universiti putra malaysia spatial yield variation and...
TRANSCRIPT
UNIVERSITI PUTRA MALAYSIA
SPATIAL YIELD VARIATION AND SOIL N IN A MATURE OIL PALM PLANTATION : A CASE STUDY IN SABAH
TEE BEE HEOH
FP 2001 10
SPATIAL YIELD VARIATION AND SOIL N IN A MATURE OIL PALM PLANTATION: A CASE STUDY IN SABAH
TEE BEE HEOH
MASTER OF AGRICULTURAL SCIENCE UNIVERSITI PUTRA MALAYSIA
2001
SPATIAL YIELD VARIATION AND SOIL N IN A MATURE OIL PALM PLANTATION: A CASE STUDY IN SABAH
By
TEE BEE HEOH
Thesis Submitted in Fulfilment of the Requirement for the Degree of Master of Agricultural Science in the Faculty of Agriculture
U niversiti Putra Malaysia
May 2001
Abstract of thesis presented to the Senate ofUniversiti Putra Malaysia in fulfilment of the requirement for the degree of Master of Agricultural Science.
SPATIAL YIELD VARIATION AND SOIL N IN A MATURE OIL PALM PLANTATION: A CASE STUDY IN SABAH
By
TEE BEE HEOH
May 2001
Chairman : Dr. Anuar Abd. Rahim
Faculty : Agriculture
11
One of the major challenges in oil palm plantations in recent times is the lack of
proper interpretation of yield maps for site-specific management, and the
identification and understanding of the causal factors influencing the variability of
oil palm yields. The ability to find and comprehend the soil factors influencing
yield variabilities of oil palm will enable us to manage them more efficiently. A
study was conducted in a mature oil palm plantation at Sri Kunak Estate, Tawau,
Sabah, Malaysia with the objectives (i) to quantify and characterize the spatial and
temporal yield variations of fresh fruit bunch (fib) so as tet determine the optimum
management zones for oil palm plantations and create possible management zones
for site-specific inputs (ii) to quantify and characterize the nature of spatial soil
NH/-N variation as influenced by long-term N fertilizer management (iii) to
establish the inter-relationship between fib yields and soil NH/-N so as to develop
optimum range of soil � + -N for optimum oil palm growth and production.
11l
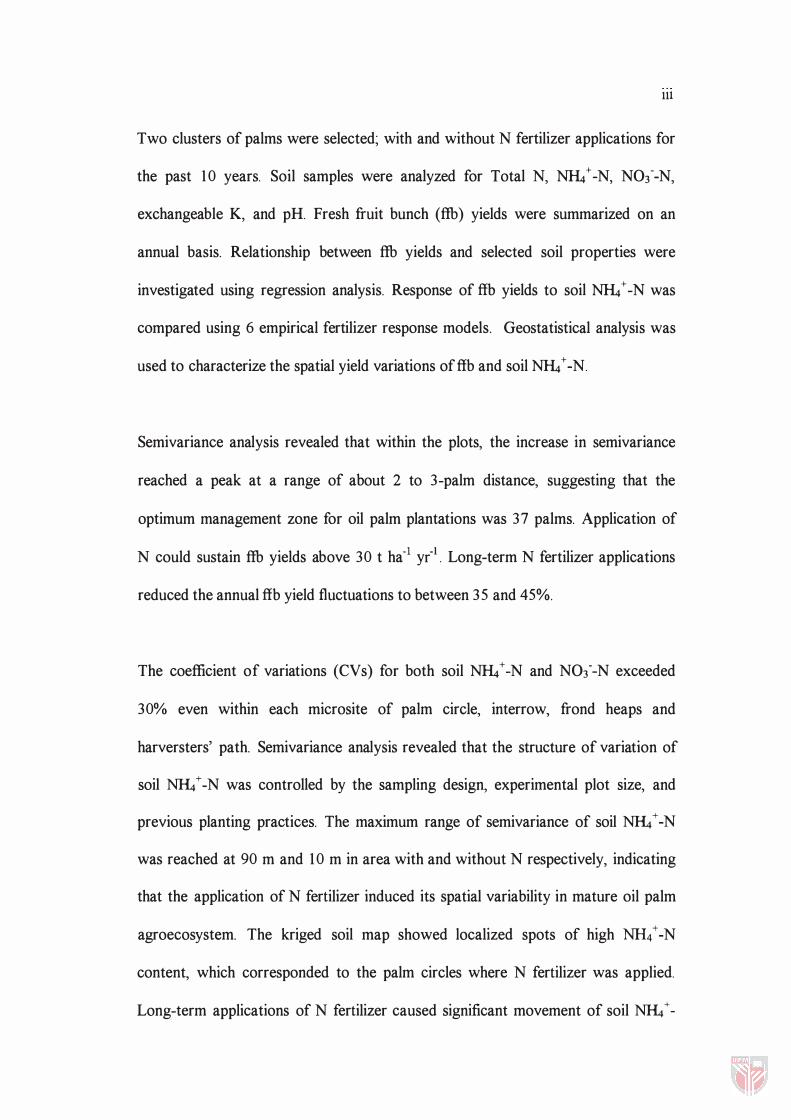
Two clusters of palms were selected; with and without N fertilizer applications for
the past 10 years. Soil samples were analyzed for Total N, NH/ -N, N03--N,
exchangeable K, and pH. Fresh fruit bunch (fib) yields were summarized on an
annual basis. Relationship between fib yields and selected soil properties were
investigated using regression analysis. Response of fib yields to soil NH/-N was
compared using 6 empirical fertilizer response models. Geostatistical analysis was
used to characterize the spatial yield variations offib and soil NH/-N .
Semivariance analysis revealed that within the plots, the increase in semivariance
reached a peak at a range of about 2 to 3-palm distance, suggesting that the
optimum management zone for oil palm plantations was 37 palms. Application of
N could sustain fib yields above 30 t ha-1 y{l . Long-term N fertilizer applications
reduced the annual fib yield fluctuations to between 3 5 and 45%.
The coefficient of variations (CVs) for both soil NH/-N and N03--N exceeded
30% even within each micro site of palm circle, interrow, frond heaps and
harversters' path. Semivariance analysis revealed that the structure of variation of
soil N& + -N was controlled by the sampling design, experimental plot size, and
previous planting practices. The maximum range of semivariance of soil N& +-N
was reached at 90 m and 10 m in area with and without N respectively, indicating
that the application of N fertilizer induced its spatial variability in mature oil palm
agroecosystem. The kriged soil map showed localized spots of high NH4 + -N
content, which corresponded to the palm circles where N fertilizer was applied.
Long-term applications of N fertilizer caused significant movement of soil N& +-
lV
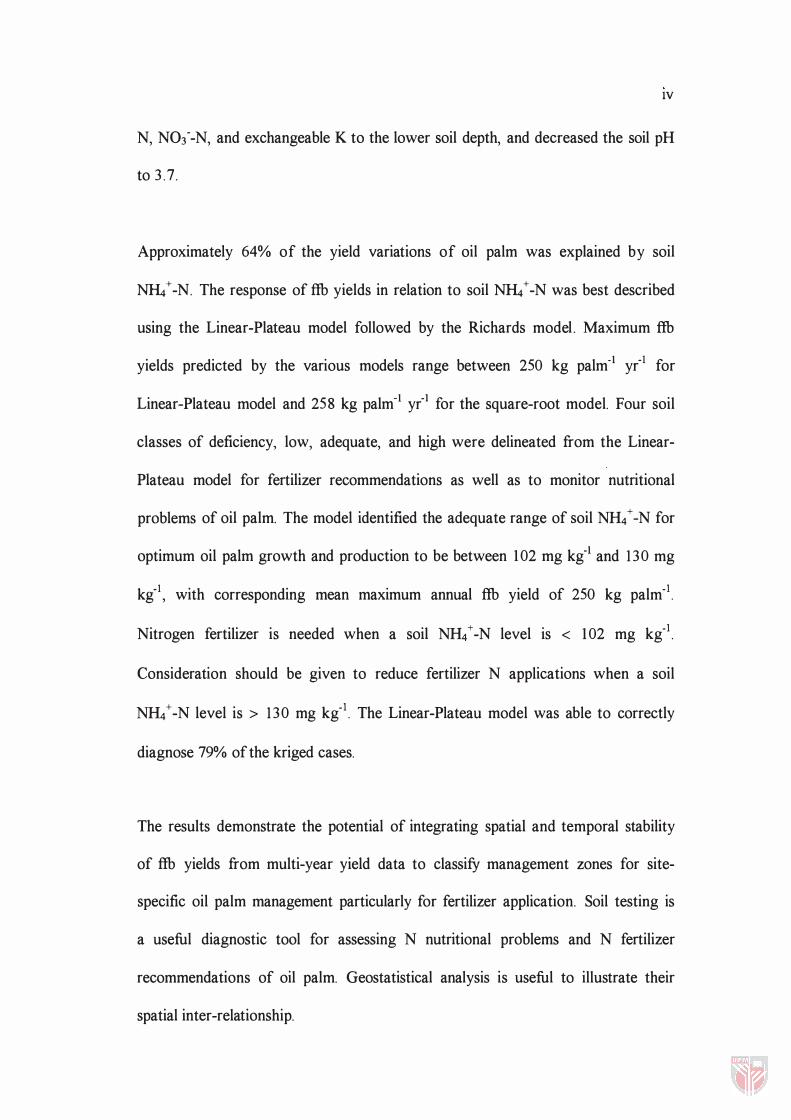
N, N03--N, and exchangeable K to the lower soil depth, and decreased the soil pH
to 3 .7.
Approximately 64% of the yield variations of oil palm was explained by soil
NH/ -N. The response of fib yields in relation to soil NH/ -N was best described
using the Linear-Plateau model followed by the Richards model. Maximum fib
yields predicted by the various models range between 250 kg palm-1 y{l for
Linear-Plateau model and 258 kg palm-1 y{l for the square-root model. Four soil
classes of deficiency, low, adequate, and high were delineated from the Linear
Plateau model for fertilizer recommendations as well as to monitor nutritional
problems of oil palm. The model identified the adequate range of soil NlLt + -N for
optimum oil palm growth and production to be between 102 mg kg-1 and 1 30 mg
kg-I , with corresponding mean maximum annual fib yield of 250 kg palm-t.
Nitrogen fertilizer is needed when a soil NlLt + -N level is < 102 mg kg-t.
Consideration should be given to reduce fertilizer N applications when a soil
NlLt+-N level is > 1 30 mg kg-t. The Linear-Plateau model was able to correctly
diagnose 79% of the kriged cases.
The results demonstrate the potential of integrating spatial and temporal stability
of fib yields from multi-year yield data to classify management zones for site
specific oil palm management particularly for fertilizer application. Soil testing is
a useful diagnostic tool for assessing N nutritional problems and N fertilizer
recommendations of oil palm. Geostatistical analysis is useful to illustrate their
spatial inter-relationship.
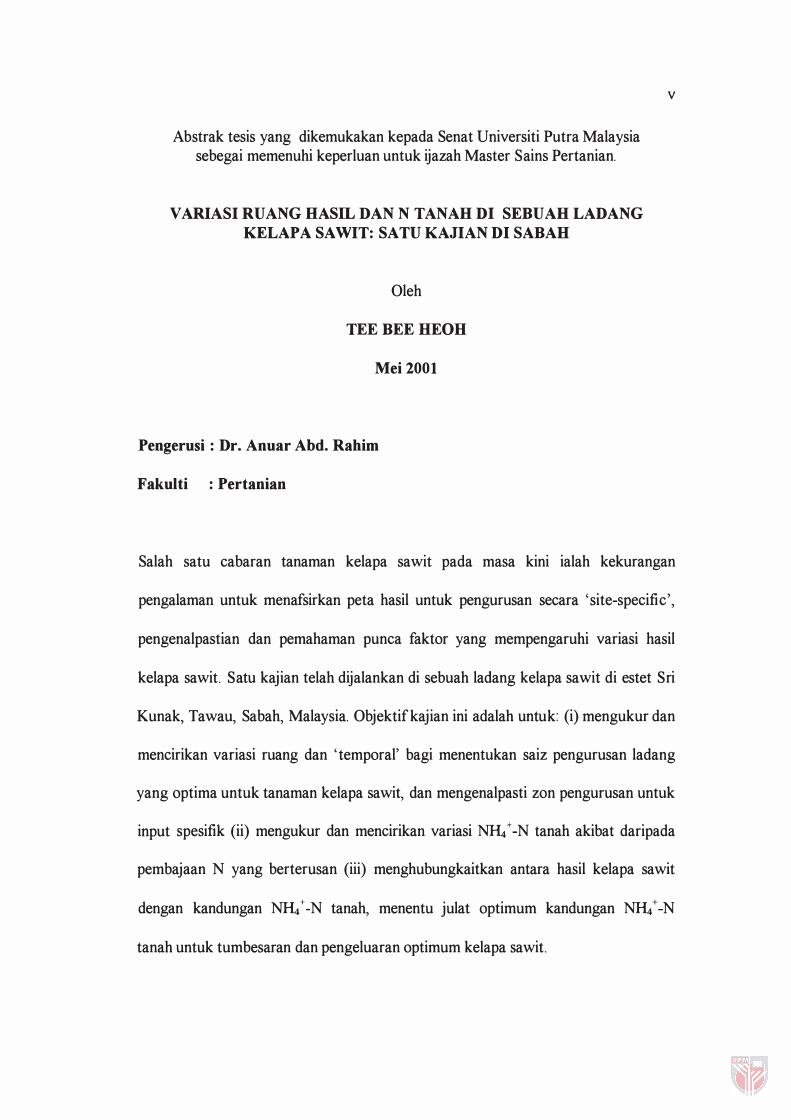
Abstrak tesis yang dikemukakan kepada Senat Universiti Putra Malaysia sebegai memenuhi keperluan untuk ijazah Master Sains Pertanian.
VARIASI RUANG BASIL DAN N TANAH DI SEBUAH LADANG KELAPA SA WIT: SATU KAJIAN DI SABAH
Oleh
TEE BEE HEOH
Mei 2001
Pengerusi : Dr. Anuar Abd. Rahim
Fakulti : Pertanian
v
Salah satu cabaran tanaman kelapa sawit pada masa kini ialah kekurangan
pengalaman untuk menafsirkan peta hasil untuk pengurusan secara 'site-specific',
pengenalpastian dan pemahaman punca faktor yang mempengaruhi variasi hasil
kelapa sawit. Satu kajian telah dijalankan di sebuah ladang kelapa sawit di estet Sri
Kunak, Tawau, Sabah, Malaysia. Objektif kajian ini adalah untuk: (i) mengukur dan
mencirikan variasi ruang dan 'temporal' bagi menentukan saiz pengurusan ladang
yang optima untuk tanaman kelapa sawit, dan mengenalpasti zon pengurusan untuk
input spesifik (ii) mengukur dan mencirikan variasi NIL. + -N tanah akibat daripada
pembajaan N yang berterusan (iii) menghubungkaitkan antara hasil kelapa sawit
dengan kandungan NIL. + -N tanah, menentu julat optimum kandungan NIL. + -N
tanah untuk tumbesaran dan pengeluaran optimum kelapa sawit.
Vl
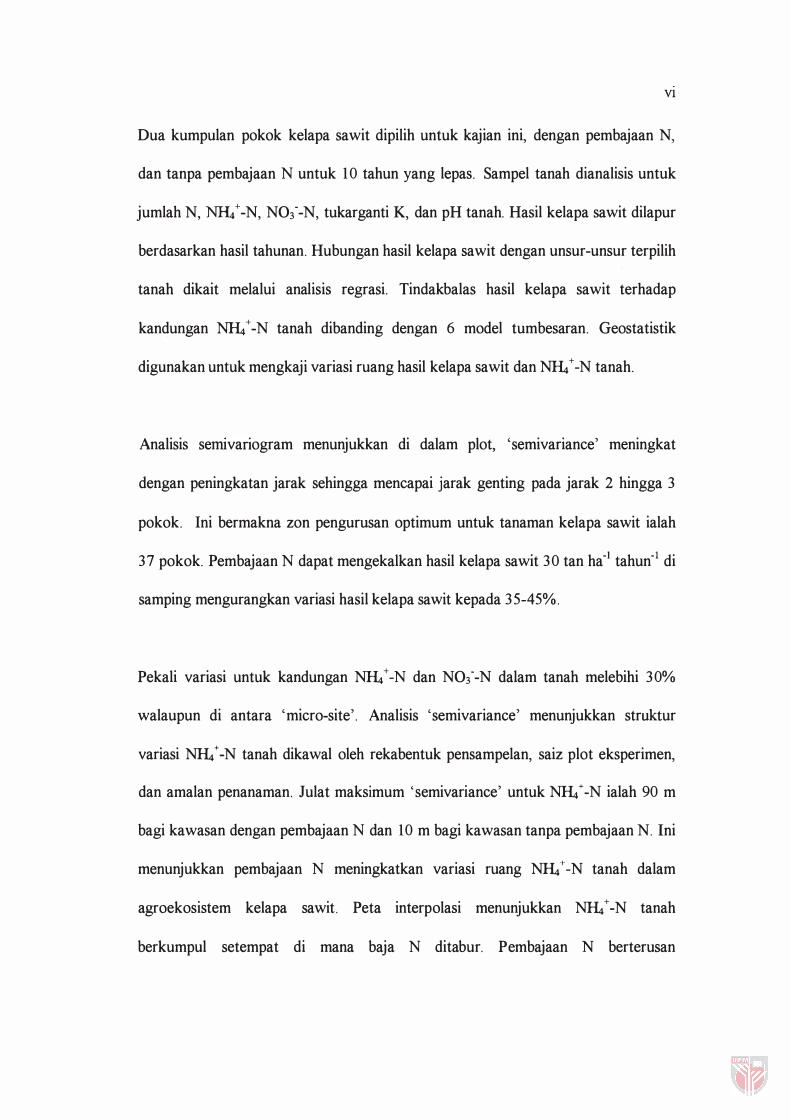
Dua kumpulan pokok kelapa sawit dipilih untuk kajian ini, dengan pembajaan N,
dan tanpa pembajaan N untuk 10 tahun yang lepas. Sampel tanah dianalisis untuk
jumlah N, NH/-N, N03--N, tukarganti K, dan pH tanah. Hasil kelapa sawit dilapur
berdasarkan hasil tahunan. Hubungan hasil kelapa sawit dengan unsur-unsur terpilih
tanah dikait melalui analisis regrasi. Tindakbalas hasil kelapa sawit terhadap
kandungan NJ4 + -N tanah dibanding dengan 6 model tumbesaran. Geostatistik
digunakan untuk mengkaji variasi ruang hasil kelapa sawit dan NJ4 + -N tanah.
Analisis seffilvanogram menunjukkan di dalam plot, 'semivariance' meningkat
dengan peningkatan jarak sehingga mencapai jarak genting pada jarak 2 hingga 3
pokok. Ini bermakna zon pengurusan optimum untuk tanaman kelapa sawit ialah
37 pokok. Pembajaan N dapat mengekalkan hasil kelapa sawit 30 tan ha-1 tahun-1 di
samping mengurangkan variasi hasil kelapa sawit kepada 35-45%.
Pekali variasi untuk kandungan NJ4+-N dan N03--N dalam tanah melebihi 30%
walaupun di antara 'micro-site'. Analisis 'semivariance' menunjukkan struktur
variasi NJ4+-N tanah dikawal oleh rekabentuk pensampelan, saiz plot eksperimen,
dan amalan penanaman. Julat maksimum 'semivariance' untuk NJ4+-N ialah 90 m
bagi kawasan dengan pembajaan N dan 10 m bagi kawasan tanpa pembajaan N. Ini
menunjukkan pembajaan N meningkatkan variasi ruang NJ4+-N tanah dalam
agroekosistem kelapa sawit. Peta interpolasi menunjukkan NJ4 + -N tanah
berkumpul setempat di mana baja N ditabur. Pembajaan N berterusan

VB
mengakibatkan pergerakan NH/-N, N03--N dan K tukarganti tanah ke horizon
tanah yang lebih dalam. Ia juga menurunkan pH tanah kepada 3 .7 .
Kira-kira 64% daripada variasi hasil kelapa sawit boleh dihubungkaitkan dengan
� + -N tanah. Tindakbalas hasil kelapa sawit terhadap kandungan � + -N tanah
paling sesuai diciri dengan model 'Linear-Plateau', diikuti dengan model Richards.
Hasil maksimum berjulat antara 250 kg pokok-I tahun-I untuk model 'Linear
Plateau' , dan 258 kg pokok-I tahun-I untuk model punca-kuasa dua. Empat kelas
tanah telah ditakrifkan daripada model 'Linear-Plateau' untuk mengesyorkan
pembajaan dan pengawasan masalah nutrien kelapa sawit, iaitu, kekurangan,
rendah, optimum, dan tinggi. Julat � + -N tanah yang sesuai untuk tumbesaran
pokok kelapa sawit ialah antara 102 mg kg-I dan 130 mg kg-\ dengan purata
maksimum hasil tahunan 250 kg pokoki. Pembajaan N diperlukan untuk kawasan
yang mengandungi �+-N tanah < 102 mg kg-I. Untuk kawasan > 130 mg kg-I
�+-N, pertimbangan perlu diberi untuk mengurangkan kadar baja N. Model
'Linear-Plateau' dapat mendiagnosis dengan betul 79% kes kriging.
Keputusan ini menunjukkan potensi mengintegrasi kestabilan ruang dan 'temporal'
hasil kelapa sawit dengan data tahunan untuk pengurusan secara 'site-specific'
dengan mengklasifikasikan zon pengurusan yang berlainan, terutama untuk
pembajaan. Pengujian tanah berguna untuk mengenalpasti masalah nutrien tanah
dan juga untuk mengesyorkan pembajaan N untuk kelapa sawit. Analisis
geostatistik berguna untuk mengambarkan hubungkaitnya secara ruang.
V111
ACKNOWLEDGEMENTS
I am deeply indebted to Dr. Anuar Abd. Rahim, the chairman of the
advisory committee, and Mr. Goh Kah Joo, co-supervisor for suggesting the
research topic, invaluable guidance, encouragement, and constructive ideas
throughout the study. Sincere thanks also go to the other members of the
supervisory committee, Assoc. Prof Dr. Zaharah A. Rahman, and Dr. Muhamad
Radzali Mispan for their constructive remarks and reviews of the thesis.
I wish to express my sincere gratitude to Applied Agricultural Research
(AAR) Sdn. Bhd., for contributing the oil palm yield trial data, hospitality, and
fieldwork facilities at Sri Kunak Estate, Tawau, Sabah. Thanks also go to the staff
and other employees at AAR especially Mr. Teo Chor Boo for assisting in the
collection of soil samples and sending them to Peninsular Malaysia. The study also
form parts of AAR's research towards the adoption of precision farming in oil
palm plantations.
I would like to express my sincere gratitude to all the staff members, and
laboratory technicians of Department of Land Management, Faculty of
Agriculture, Universiti Putra Malaysia.
I also wish to take this opportunity to express my sincere thanks to all my
friends who have supported in one way or the other towards the completion of the
thesis.

IX
Lastly, I am most grateful to my beloved mother, sisters and brother for
their sacrifices and moral support throughout the study.
x
I certify that an Examination Committee met on 8th May 200 1 to conduct the final examination of Tee Bee Heoh on her Master of Agricultural Science thesis entitled II Spatial Yield Variation and Soil N in a Mature Oil Palm Plantation: A Case Study in Sabahll in accordance with Universiti Pertanian Malaysia (Higher Degree) Act 1980 and Universiti Pertanian Malaysia (Higher Degree) Act 198 1 . The committee recommends that the candidate be awarded the relevant degree. Members of the Examination Committee are as follows:
Wan Sulaiman Wan Harun, Ph.D. Professor Department of Land Management Faculty of Agriculture Universiti Putra Malaysia (Chairman)
Anuar Abd. Rahim, Ph.D. Department of Land Management Faculty of Agriculture Universiti Putra Malaysia (Member)
Zaharah A. Rahman, Ph.D.
Professor Department of Land Management Faculty of Agriculture Universitl Putra Malaysia (Member)
Muhamad Radzali Mispan, Ph.D.
Strategic, Environment and Natural Resource Research Centre Malaysian Agriculture Research and Development Institute (Member)
Goh Kah Joo, M.Sc. Agronomy Research Unit Applied Agricultural Research Sdn Bhd Sungai BlIloh, Selangor (Member)
AINI IDERIS, Ph.D. Professor/Dean of Graduate School Universiti Putra Malaysia
Date 2 2 MAY 2agl

Xl
This thesis submitted to the Senate of Universiti Putra Malaysia has been accepted as fulfilment of the requirements for the degree of Master of Agricultural Science.
AINI IDERIS, Ph.D. Professor Dean of Graduate School Universiti Putra Malaysia
Date: 1 4 ,JUN 2001

XlI
I hereby declare that the thesis is based on my original work except for quotations and citations which have been duly acknowledged. I also declare that it has not been previously or concurrently submitted for any other degree at UPM or other institutions.
TEE BEE HEOH
Date: � fVIA'( �I .
Xl11
TABLE OF CONTENTS
Page ABSTRACT 11
ABSTRAK v ACKNOWLEDGEMENTS Vlll
APPROVAL SHEETS x
DECLARATION FORM XlI
LIST OF TABLES xv
LIST OF FIGURES XV11
CHAPTER
1 INTRODUCTION 1
2 LITERA TURE REVIEW 5
2 . 1 Brief Overview of Oil Palm 5
2.2 Nitrogen Fertilizer Requirement and Management of Oil Palm 6 2 .3 Fresh Fruit Bunch (fib) Yield Variations and Causes ofFFB 9
Yield Variations 2.4 Variations in Soil Nutrients 1 1 2 . 5 Classical Methods in QuantifYing Variability 12 2 .6 Geostatistics and Spatial Variability 13
2.6. 1 The Semivariogram 1 5 2.6 .2 Kriging 1 8
2 .7 Precision Farming 20
3 SPATIO-TEMPORAL YIELD TREND OF OIL PALM AS INFLUENCED BY N FERTILIZER MANAGEMENT 23
3.1 Introduction 23
3.2 Materials and Methods 25 3.3 Results and Discussion 28
3 . 3 . 1 Variation in FFB yields 28 3 .3 . 2 Semivariance Analysis 30 3 . 3 . 3 Spatial Annual Yield Maps of Oil Palm 33 3 . 3 .4 Spatial and Temporal Stability Yield Maps ofFFB 36 3 . 3 . 5 Classified Management Zone Maps 41
3 .4 Conclusions 43
XlV
4 SPATIAL VARIATION OF SOIL N IN A MATURE OIL PALM PLANTATION IN TAWAU, SABAH, MALAYSIA 45
4. 1 Introduction 45 4.2 Materials and Methods 46 4.3 Results and Discussion 50
4.3 . 1 Variation among Microsites 50 4.3 .2 Semivariance Analysis 55 4 .3 .3 Spatial Soil �+-N Map in Oil Palm Agroecosystem 59 4 .3 .4 Effects of Long Term N Manuring on Soil Chemical
Properties in the Palm Circles 62 4.4 Conclusions 66
5 SPATIAL DISTRIBUTION OF OIL PALM YIELD AND SOIL NITROGEN, AND THEIR INTER-RELATIONSHIP 67
5 . 1 Introduction 67 5 .2 Materials and Methods 69 5 . 3 Results and Discussion 75
5 . 3 . 1 Relationship between FFB Yields and Soil Properties 75 5 . 3 .2 Comparison of Models for Predicting Critical Soil
�+-N 78 5 . 3 . 3 Classification of Soil � + -N for Decision on N
Fertilization 8 1 5 . 3 .4 Visual Comparison ofFFB Yield Map and Soil N Map 84
5 . 5 Conclusions 90
6 SUMMARY AND FUTURE WORK 9 1
6. 1 Summary 9 1 6.2 Future Work 95
REFERENCES 97
APPENDIX 1 10
VITA 1 1 1
xv
LIST OF TABLES
Table Page
3 . 1 Mean (kg palm-i), standard deviation (Std Dev), coefficient of variation (%) and range of fib yields from 1 99 1 to 1 999 29
3 .2 Components of yield variation in the trial site, 1 992- 1 999 30
3 .3 Distribution of palms (%) in different categories of mean yield and temporal yield stability as influenced by N treatment 38
3 .4 Management classes based on the combined information of mean yield and temporal yield stability classes 4 1
4. 1 Components of variations of soil inorganic-N (NH/-N and N03--N) in an oil palm plantation 5 1
4.2 Mean, standard deviation and coefficient of variation of soil inorganic-N in each micro site 55
4.3 Correlation coefficient (r) values of selected soil chemical properties between 0- 1 5 cm depth (Dl) and 1 5-30 cm depth (D2) in the palm circle, n=1 2 63
4.4 Comparison of selected soil chemical properties in the 0- 1 5 cm (D 1 ) depth and 1 5-30 cm depth (D2) of the palm circle averaged over both K treatments 64
5 . 1 Relationships between fib yields and soil properties 77
5 .2 Models used to fit the relationship between fib yields of oil palm (1 992-1 999) and soil NH/-N, and their corresponding critical values at maximum yields 80
5 . 3 Soil NH/-N classes (mg kg-i) and the corresponding expected fib yields (kg palm-i) of oil palm 82
5 .4 Confidence interval of critical levels for linear-plateau models of fib yields and soil � + -N 83
5 . 5 Confusion matrix showing the number/ percentage (in bracket) of misclassification or wrong decision 86
5 .6 Paired T value of actual versus predicted value for fib yields and soil �+-N 88

5 .7 Comparison of actual versus predicted value for fib yields and � + -N (per plot basis) using spherical model of semivariogram for kriging
XVI
interpolation 89

XVll
LIST OF FIGURES Figure Page
2. 1 An example of semivariogram showing nugget, range and sill 1 6
3 . 1 Diagram showing relative location of recording palms (blue point) and sampling palms (red point) in area with and without N at Sri Kunak Estate, Tawau, Sabah 27
3 .2 Sine wave model of semivariogram showing experimental variance (black line) and theoretical model ( red line) of fib yields of oil palms from 1 992- 1 999. The amplitudes in both treatments generally lie between 25 m and 80 m 3 1
3 .3 Based on maximum spatial range of 3-palm distance, the optimum management zone for oil palm plantations is 3 7 palms with a triangular planting distance. Black points under the hexagon represent optimum management zone, red points represent neighbouring palms that required different inputs 34
3 .4 Diagram showing application of N tend to sustain high fib yields above 30 t ha-1 y(l . Both spatial and temporal yield variations should be considered also for proper interpretation of multiple-year yield maps for site-specific management 3 5
3 . 5 Spatial trend maps of fib yields of oil palm in area with N (a) and without N (b) applications, 1 992- 1 999 40
3 .6 Temporal yield stability maps of oil palm m area with N (a) and without N (b) applications, 1 992- 1 999 40
3 .7 Practical management zones (2 and 4) in area with N (a) and without N (b) applications based on classified management maps (top two) 42
4. 1 Sampling locations within palm base (palm circle, frond heap, interrow, and harversters' path) in area with and without N applications. Red dots represent sampling palms; blue dots represent all recorded palms in the experimental plot 47
4.2 Effects of N fertilizer on the soil inorganic N in different micro sites in an oil palm plantation 53
4.3 Isotropic semivariogram showing experimental variance (square box) and theoretical model (blue line) of soil NHt + -N in the 0-1 5 cm depth using data from all micro sites in the oil palm plantation 57
XV1l1
4.4 Isotropic semivariogram showing experimental variance (square box) and theoretical model (blue line) of soil NRt + -N in the 0- 1 5 cm depth using data from the palm circle only in the oil palm plantation. Relatively high variance occurred at lag distance below 30 m 58
4 .5 Diagram showing spatial variation of soil NRt+-N in area with N (a) and without N (b) applications. Long-term applications of N fertilizer resulted in localized hot spots of high NRt + -N content within the palm circles 60
4.6 Diagram showing soil NRt+-N and exchangeable K contents in the soil 65
5 . 1 Diagram showing relative location of recording palms (blue point), in area with and without N applications. Each palm area were demarcated into 4 micro sites (frond heap, palm circle, interrow, and harversters' path, respectively) for soil sampling. Red dots represent sampling palms; blue dots represent all recorded palms in the experimental plot 7 1
5 .2 Six empirical models showing critical values of soil NRt+-N (mg kg-I) and optimum fib yields (kg palm-I y{I) for oil palm could be varied depending on the fitted response function 79
5 .3 A portion of the N treated palms in the north had lower yields, which corresponded to the temporal yield stability maps in Figure 3 . 6 85
5 .4 Diagram showing a strong relationship between the level of soil NRt + -N and fib yields of individual palms in Figure 5 . 3 85
6. 1 Location of study at Sri Kunak Estate, Tawau, Sabah, East Malaysia 1 1 0

CHAPTER!
INTRODUCTION
The oil palm, Elaeis guineensis, Jacq., a native to the swamps of West
Africa, was introduced to Malaysia in 1 875 (Arnott, 1 963) as an ornamental plant.
The expansion of the oil palm industry started in the late 1 960s under the crop
diversification plan. From 55,000 hectares in 1 960, the area under the crop has
increased more than sixty fold to a total of 3 .3 million ha in 1 999. Approximately
50% of the total arable land in Malaysia is cultivated with oil palm. Malaysia is
currently the world's largest producer and exporter of palm oil. In 1 999, the
country produced 1 0. 5 million tonnes of crude palm oil and through the export of
palm oil products, it contributed RM 19.2 billion in gross revenue (MPOB, 2000).
However, since 1 975, the substantial increase in oil palm areas has not
matched its productivity in terms of fresh fruit bunch (fib) yields. The average fib
yields had remained in a range of 1 8-22 t ha-l yfl for the past 20 years (MPOB,
2000). This yield is well below the theoretical yield potential of 44 t ha-l yfl
(Tinker, 2000). Many of the interacting factors that influence the yield trend have
been identified and quantified by various researchers in the industry such as Foster
et al. ( 1 985a), Kee et al. ( 1994) and Goh and Teo ( 1 997). Goh et al. (2000a)
contended that "increased field size or management unit, generalized agricultural
inputs and monitoring, declining management standards, lack of skilled workers
and poor understanding of agronomy, exacerbated by the planting of oil palm on
2
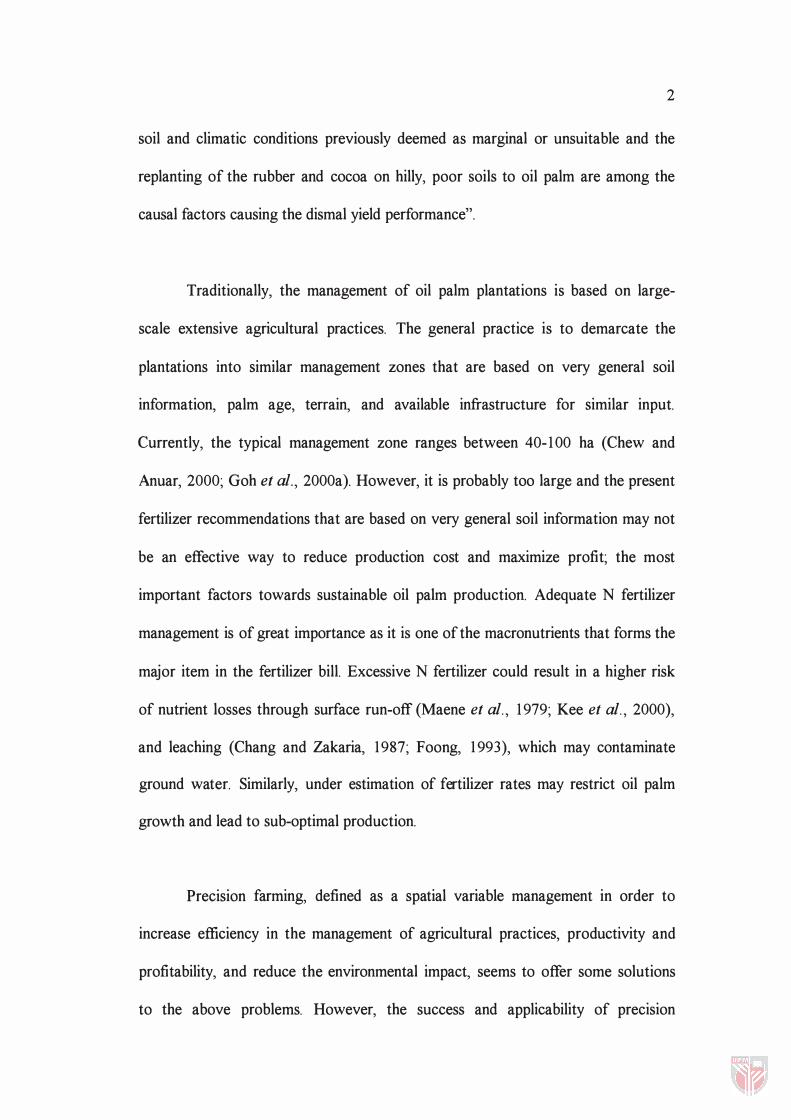
soil and climatic conditions previously deemed as marginal or unsuitable and the
replanting of the rubber and cocoa on hilly, poor soils to oil palm are among the
causal factors causing the dismal yield performance".
Traditionally, the management of oil palm plantations is based on large
scale extensive agricultural practices. The general practice is to demarcate the
plantations into similar management zones that are based on very general soil
information, palm age, terrain, and available infrastructure for similar input.
Currently, the typical management zone ranges between 40-1 00 ha (Chew and
Anuar, 2000; Goh et aI., 2000a). However, it is probably too large and the present
fertilizer recommendations that are based on very general soil information may not
be an effective way to reduce production cost and maximize profit; the most
important factors towards sustainable oil palm production. Adequate N fertilizer
management is of great importance as it is one of the macronutrients that forms the
major item in the fertilizer bill. Excessive N fertilizer could result in a higher risk
of nutrient losses through surface run-off (Maene et aI., 1 979; Kee et aI., 2000),
and leaching (Chang and Zakaria, 1987; Foong, 1 993), which may contaminate
ground water. Similarly, under estimation of fertilizer rates may restrict oil palm
growth and lead to sub-optimal production.
Precision farming, defined as a spatial variable management in order to
increase efficiency in the management of agricultural practices, productivity and
profitability, and reduce the environmental impact, seems to offer some solutions
to the above problems. However, the success and applicability of precision
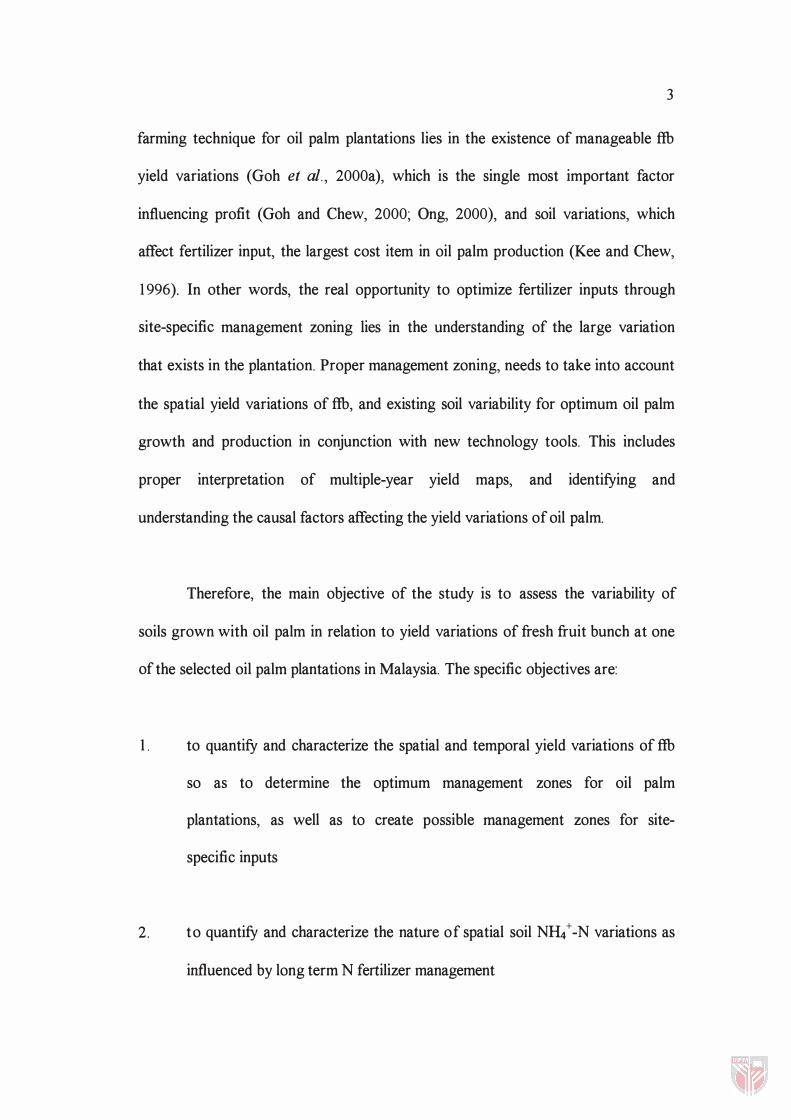
3
farming technique for oil palm plantations lies in the existence of manageable fib
yield variations (Goh et aI., 2000a), which is the single most important factor
influencing profit (Goh and Chew, 2000; Ong, 2000), and soil variations, which
affect fertilizer input, the largest cost item in oil palm production (Kee and Chew,
1 996). In other words, the real opportunity to optimize fertilizer inputs through
site-specific management zoning lies in the understanding of the large variation
that exists in the plantation. Proper management zoning, needs to take into account
the spatial yield variations of fib, and existing soil variability for optimum oil palm
growth and production in conjunction with new technology tools. This includes
proper interpretation of multiple-year yield maps, and identifying and
understanding the causal factors affecting the yield variations of oil palm.
Therefore, the main objective of the study is to assess the variability of
soils grown with oil palm in relation to yield variations of fresh fruit bunch at one
of the selected oil palm plantations in Malaysia. The specific objectives are:
1 . to quantify and characterize the spatial and temporal yield variations of fib
so as to determine the optimum management zones for oil palm
plantations, as well as to create possible management zones for site
specific inputs
2. to quantify and characterize the nature of spatial soil NH/-N variations as
influenced by long term N fertilizer management

4
3 . to establish the inter-relationship between fib yields and soil NH/-N so as
to develop optimum range of soil NHt + -N for optimum oil palm growth
and production
5
CHAPTER 2
LITERATURE REVIEW
2.1 Brief Overview of Oil Palm
Oil palm, Elaeis guineensis Jacq. , belongs to the family of Palmae and the
subfamily of Cocoidae. It is a perennial tree crop that originated in the swamps of
West Africa. This is based on the observations of botanists and the findings of
fossil pollen which resembled the oil palm pollen in Nigeria (Zeven, 1965). Oil
palm is a C3 crop that is capable of transforming solar energy into dry matter and
vegetable oil (palm oil). The latter is found in the fruitlets of fresh fruit bunch
(fib). Compared to other vegetable oil crops, oil palm is the most efficient
converter of solar energy into dry matter. It can produce six times higher oil yield
compared to rapeseed (Mielke, 1991) . On the average, 3 .6 tonnes of vegetable oil
(crude palm oil) can be extracted from 1 ha of yield from fib (Fairhurst and
Mutert, 1999).
Oil palm can be cultivated over a wide range of tropical climatic
conditions. It is best grown in the humid tropic region with high precipitation
between 2000 and 2500 mm y{I , uniformly distributed throughout the year, with
no month having rainfall below 100 mm . Wind speed less than 1 0 ms-I ; annual
mean temperature between 26°C and 29°C; daily solar radiation between 16 and
17 MJ m-2 with sunshine hours exceeding 5 hours dail are required for optimum
growth and production. The latter condition only holds true if the sunshine hours