universiti putra malaysia neural network …psasir.upm.edu.my/10131/1/fk_1998_8_a.pdf · sistem...
TRANSCRIPT
UNIVERSITI PUTRA MALAYSIA
NEURAL NETWORK BASED PATTERN RECOGNITION IN VISUAL INSPECTION SYSTEM FOR INTERGRATED CIRCUIT
MARK INSPECTION
VENANTIUS KUMAR A/L SEVAMALAI
FK 1998 8
NEURAL NETWORK BASED PATTERN RECOGNITION IN VISUAL INSPECTION SYSTEM FOR INTERGRA TED CIRCUIT'
MARK INSPECTION
BY
VENANTIUS KUMAR AIL SEV AMALAI
THESIS SUBMItTED IN FULFILMENT OF THE REQUIREMENTS FOR THE DEGREE OF MASTERS OF SCIENCE
IN THE FACULTY OF ENGINEERING UNIVERSITI PUTRA MALAYSIA
MAY 1998

ACKNOWLEGDEMENTS
I would like to begin my acknowledgement by first thanking my Creator who
gave me a pair of fully functioning eyes to observe all his creation in its beauty and
also destitute. The course of my work here was first directed by Dr. Abdul Rahman
Bidin by introducing me to neural networks. This was followed by inspiration from
Dr. Iskandar to further my knowledge in neural networks and apply it in the real
world. Without him this thesis would have been merely a theoretical jargon. The
careful and persevering guidance from Dr. Abdul Rahman Ramli has enable me to
go through trouble times to finish my thesis. I would like to give my special
appreciation to Puan Roslizah Ali for her advise in completing this work.
A big thanks is also due to Mr. L. Kumar and Mr. Yusairi from Motorola
Semiconductor Serembah, who actually suggested this project and also supported it
by providing the necessary information without which this project will not be here.
Lastly my deepest appreciation to all those who in one way or other have
contributed to the success of my project and eventually to the completion of this
thesis.
ii
TABLE OF CONTENTS
ACKNOWLEGDEMENTS . . . . . . . . . . . . . . . . . . . . . . . . . . . . . . . . . . . . . . . . . . . . . . . . . . . . . . . . . . . . . . . . . . . . . . . . . . . . . . . . . . . . . . . . . . . . . ii TABLE OF CONTENTS . . . . . . . . . . . . . . . . . . . . . . . . . . . . . . . . . . . . . . . . . . . . . . . . . . ... . . . . . . . . . . . . . . . . . . . . . . . . . . . . . . . . . . . . . . . . . . . . iii LIST OF TABLES . . . . . . . . . . . . . . . . . . . . . . . . . . . . . . . . . . . . . . . . . . . . . . . . . . . . . . . . . . . . . . . . . . . . . . . . . . . . . . . . . . . . . . . . . . . . . . . . . . ... . . . . . . v LIST OF FIGURES . . . . . . . . . . . . . . . . . . . . . . . . . . . . . . . . . . . . . . . . . . . . . . . . . . . . . . . . . . . .. . . . . . . . . . . . . . . . . . . . . . . . . . . . . . . . . . . . . . . . . . . . . . vi ABSTRACT ............... ........ ..... ..................... ................. ............................................ ....... VB ABSTRAK ....................................................................................................................... ix
CHAPTER I INTRODUCTION ...... ............................................ . ................... ................... 1
General Overview .. ........................... .. ......... .. .......... .. .... ... ............... . .... ........ 1 Pattern Recognition .................................. .............. ........ ............. . ................. 2 Visual Inspection .... . .. ............................. . ........................................... .......... . 4 Problem Statement ..... .............................................................................. ..... 5 Thesis Summary ..... ....... ............................ ............ ................................ ........ 7
II LITERATURE REVIEW .............................................................................. 9 Introduction . . . ........... .............. ....................................................................... 9 Artificial Neural Network ............................................................................. 1 0 Optical Character Recognition (OCR) . . . . . . . . . . . . . . . . . . . . . . . . . . . . . . . . . . . . . . . . . . . . . . . . . . . . . . . . . . 1 2 Conclusion . . . . . . . . . . . . . . . . . . . . . . . . . . . . . . . . . . . . . . . . . . . . . . . . . . . . . . . . . . . . . . . . . . . . . . . . . . . . . . . . . . . . . . . . . . . . . . . . . . . . 1 5
III THEORETICAL BACKGROUND . .................. ........ ... ....................... ...... ... 1 6 Introduction ............ .......... ..................... ................ .. . . . ................... ........ ... .. ... 1 6 Image Processing .......................................................................................... 1 7
Binarisation .......................................... ........ ........................................ 1 8 Morphological Operations .................... ........................................ ....... 20 Feature Extraction ................ ................................................................ 25
Multilayered Neural Network ....................................................................... 27 Error Back Propagation Learning .. ...... ..................................... . ...... .. . . 29 Self-Organising Map ........................................................................... 3 1
Conclusion ... .. . .... ........................................ .................................................. 35
IV METHODOLOGy ........................ ................................................................ 36 Introduction ................................ ...... .............. ............................................... 36 Hardware ........ ................................................................................ .......... .... . 37 Software . . . .................. ................. .......................... ........................................ 38 Image Processing .......................... ................................. ............................... 42 Neural Network ........................ ..................... ........................................ ........ 45 Conclusion . . . . . . . . . . . . . . . . . . . . . . . . . . . . . . . . . . . . . . . . . . . . . . . . . . . . . . . . . . . . . . . . . . . . . . . . . . . . . . . . . . . . . . . . . . . . . . . . . . . . 46
V RESULTS AND DISCUSSION . ................................... . .............................. 47 Introduction ................................................................................ ................... 47 Image Processing ............................... ..................................... ............. . ........ 47 Neural Network ........... ..................................... ........ ................. . ..... ....... ....... 5 1 Conclusion .................... .. .. ......... ....... ......... .......... ......................................... 54
iii
VI CONCLUSION .......... . . . . . ............ . . . . ......... . ........ ..................... .................... ... 56 Summary .............. ............. ............................................................................ 56 Achievement ...................... . .......... .................... . . .......................................... 57 Suggestions .................. ......... . . .... . . .................. ........ ...................................... 58
BIBLIOGRAPHY ............................................... ........................... ........ ........ .................. 59
APPENDIX A IMAGE PROCESSING PROGAMME LISTING ............. ........................... 62 B NEURAL NETWORK PROGRAMME LISTING .......... ............................ 83 C LEARNING IMAGES ................................. ....... ................................... ....... 1 07
TEST IMAGES ................................... ..... . . . . ................................. ................ 1 08 VITA ....................................................................................................................... 1 1 1
iv

LIST OF TABLES
finE P�E
5. 1 Time taken to section ROI and calculate ratio in seconds . .............. ....... 49
5.2 Test ImageslPatterns Output. ............ . ..................................................... 52
5.3 Neural Network Output Timing . . ..... . . . . . ....................................... .......... 53
v
LIST OF FIGURES
FlGURES PAGE
1 . 1 Current system that uses edge point features . . . . . . . . . . . . . . . . . . . . . . . . . . . . . . . . . . . . . . . . . . . . . . . . . 6
3 . 1 Histogram with 1 valley . . . . . . . . . . . . . . . . . . . . . . . . . . . . . . . . . . . . . . . . . . . . . . . . . . . . . . . . . . . . . . . . . . . . . . . . . . . . . 1 9
3 .2 Histogram with 2 distinct valleys . . . . . . . . . . . . . . . . . . . . . . . . . . . . . . . . . . . . . . . . . . . . . . . . . . . . . . . . . . . . . . . 1 9
3 .3 Image translation from point P . . . . . . . . . . . . . . . . . . . . . . . . . . . . . . . . . . . . . . . . . . . . . . . . . . . . . . . . . . . . . . . . . . . . 20
3.4 Reflection of ABC at point P . . . . . . . . . . . . . . . . . . . . . . . . . . . . . . . . . . . . . . . . . . . . . . . . . . . . . . . . . . . . . . . . . . . . . . 21
3 .5 Set A and its complement Ac .• . . . . .... ...........•.......•. . . ......... . . . ..........•....•.......... 2 1
3.6 Dilation of A by B . ..... . ................ ........... ... . . ...... . .... .................. . ....... .. .. ....... 22
3.7 A 3 X 3 window applied to the image pixels . . .................. . .. ..... .............. .... 23
3 . 8 Erosion o f A by B .... ............... . . ............. ............................ . . ................ ........ 24
3.8 Image sectioning . ...... ........................................................... ................. . . ..... 26
3 . 1 0 Neural Network implementation of SaM . . . . . . . . . . . . . . . . . . . . . . . . . . . . . . . . . . . . . . . . . . . . . . . . . . . 3 1
3. 1 1 Neural Network implementation of SaM . . . . . . . . . . . . . . . . . . . . . . . . . . . . . . . . . . . . . . . . . . . . . . . . . . . 32
3 . 1 2 Winning neurone and its neighbours . .............. ... ... ............. ... ...................... 34
4. 1 Simplified model of DT2867 processing circuitry . . . . . . . . . . . . . . . . . . . . . . . . . . . . . . . . . . . . . 38
4.2 Programming Module Architecture . . . . . . . . . . . . . . . . .... ... . . . . . . . . . . . ... ... . . . . .. . . . . . . . . . . . . . . . 40
4.3 Image Processing stages . ................... . ......................................................... 43
5. 1 Feature extraction programme created in MS-Windows environment . . . . . . . 48
5.2 Relationship between ROI size and processing time . . . . . . . . . . . . . . . . . . . . . . ... . . . . . . . . . 50
5.3 Network training output screen . . . . . . . . . . . . . . . . . . . . . . . . . . . . . . . . . . . . . . . . . . . . . . . . . . . . . . . . . . . . . . . . . . . 51
vi
Abstract of thesis presented to the Senate of Universiti Putra Malaysia in fulfilment of the requirements for the degree of Master of Science.
NEURAL NETWORK BASED PATTERN RECOGNITION IN VISUAL INSPECTION SYSTEM FOR INTERGRA TED CIRCUIT MARK
INSPECTION
By
VENANTJUS KUMAR AIL SEV AMALAI
May 1998
Chairntan: Dr. Iskartdar Baharin
Faculty: Engineering
Industrial visual machine inspection system uses template or feature matching
methods to locate or inspect parts or pattern on parts. These algorithms could not
compensate for the change or variation on the inspected parts dynamically. Such
problem was faced by a multinational semiconductor manufacturer. Therefore a
study was conducted to introduce a new algorithm to inspect integrated circuit
package markings. The main intend of the system was to verify if the marking can be
read by humans. Algorithms that the current process uses however, was not capable
in handling mark variations that was introduced by the marking process. A neural
network based pattern recognition system was implemented and tested on images
resembling the parts variations.
vii
Feature extraction was made simple by sectioning the region of interest (ROI)
on the image into a specified (by the user) number of sections. The ratio of object
pixels to the entire area of each section is calculated and used as an input into a
feedforward neural network. Error-back propagation algorithm was used to train the
network. The objective was to test the robustness of the network in handling pattern
variations as well as the feasibility of implementing it on the production floor in
tetms of execution speed.
Two separate programme modules were written in C++; one for feature
extraction and another for neural networks classifier. The feature extraction module
was tested for its speed using various ROI sizes. The time taken for processing was
round to be almost linearly related to the ROJ size and not at all effected by the
number of sections. The minimum ROJ setting (200 X 200 pixels) was considerably
slower at 55ms compared to what was required - 20ms. The neural networks
c1assifier was very successful in classifying 1 3 different image patterns by learning
from 4 training patterns. The classifier also clocked an average speed of 9.6ms
which makes it feasible to implement it on the production floor. As a final say, it can
be concluded that by carefully surveying the choices of hardware and software and its
appropriate combination, this system can be seriously considered for implementation
on the semiconductor production floor.
VIII
Abstrak tesis yang dikemukan kepada Senat Universiti Putra Malaysia sebagai memenuhi keperluan untuk ijazah Master Sains.
PENGECAMAN CORAl<: BERASASKAN RANGKAIAN NEURAL UNTUK SlSTEM PENYEMAKAN VISUAL TULISAN DAN TANDA PADA LITAR
BERSEPADU.
Oleh
VENANTIUS KUMAR AIL SEV AMALAI
Mei 1998
Pengerusi: Dr. Iskandar Baharin
Fakulti: Kejuruteraatt
Sistem pemeriksaan mesin visual industri menggunakan cara pengecaman
corak atau pengecaman ciri untuk mencari kedudukan atau memeriksa bahan dalam
proses pembuatan. Algoritma yang digunakan tidak dapat mengendali variasi yang
wujud pada bahan yang diperiksa secara dinamik. Masalah seperti ini sedang
dihadapi oleh sebuah kilang semikonduktor bertaraf antarabangsa. Satu kajian telah
di jalankan untuk menggunakan algoritma barn untuk menyemak corak tulisan pada
pakej Utar bersepadu. Tugas utama sistem tersebut adalah untuk menyemak
kejelasan tulisan supaya ia dapat dibaca oleh manusia. Algoritma yang digunakan
�ekarang tidak dapat berfungsi dengan baik disebabkan oleh ketidakseimbangan
dalam proses pembuatan. Untuk mengatasi masalah ini, suatu algoritma pengecaman
corak berasaskan rangkaian neural telah diuji untuk mengenali corak-corak yang
serupa dengan yang dikeluarkan oleh kilang terse but.
ix
COtak berasaskan rangkaian neural telah diuji untuk mengenali corak-corak yang
setupa dengan yang dikeluatkan oteh kilang terse but.
Suatu cara yang agak ringkas telah digunakan untuk tnengekstrak ciri-ciri dari
imej yang diberi. kawasan tumpuan (region of interest-ROI) dalam imej
dibahagikan kepada bebetapa bahagian yang lebih kecil seperti yang ditentukan oleh
pel1gguna. Bagi setiap bahagian ini, nisbah pixel yang menentukan objek kepada
luas seluruh bahagian itu dikira. Nisbah-nisbah ini kemudian digunakan sebagai
input dalam rangkaian neural. Algoritma "error-back propagation" telah di gunakan
untuk melatih rangkaian neural tersebut. Objektif projek ini adalah untuk tnenguji
keteguhan rangkaian neural untuk mengendali perubahan pada imej dan Juga
kebolehannya untuk beroperasi dalam keadaan sebenar pembuatan di kilang.
Pengaturcaraan telah dibuat dalam dua modul; satu untuk pengekstrakan ciri
dan satu lagi untuk rangkaian neural . Pengekstrakan ciri telah diuj i untuk kepantasan
petnptosesan dengan tnenggunakan saiz-saiz RaJ yang berlainan. Masa
pen1prosesan didapati hampir berkadar terns dengan saiz ROt Walau
bagaimanapun, untuk Rot paling minimum yang diuj i, masa yang didapati adalah
;Stns tnanakala maS a yang diperlukan untuk seluruh proses adalah hanya 20ms.
Rangkaian neural pula berjaya mengklasifikasikan 1 3 corak imej yang berbeza
dengan mempelajari 4 imej sebagai latihan. Rangkaian ini juga dapat menghabiskan
tugasnya dengah purata masa 9.6ms. lni membolehkan tangkaian neural digunakan
tltUuk proses pengecaman dalam industri. Sebagai akhir kata, boleh disimpulkan
bahawa dengan membuat pilihan kombinasi perkakasan dan perisian komputer yang
tepat, sistem ini boleh diimplimentasikan dalam keadaan kilang yang sebenar.
x
CHAPTER I
INTRODUCTION
General Overview
Among all the senses that humans have, the visual sense has always been
regarded as the most important. Vision has given man the ability to assess a situation
or an object without getting into physical contact with the environment. This has
irtspired the development of artificial vision for machines particularly computers.
these vision machines have the capability to capture a scene and process it to extract
useful information which tnay be used to take further action. The progress in
machine vision has given a wide range of application from medical imaging to
military defence systems. The complexity of these systems also varies from three
dimensional scene analysis to a simple binary image feature extraction or
measurement. The industrial usage of such systems are usually of lower complexity
levels. They are used to locate, inspect or measure components in a manufacturing
line. these systems effectively replace human operators in doing repetitive tasks
which causes fatigue and loss of concentration after a prolonged duration. The
reliability and repeatability of such systems are naturally better than the human
counterpart.
2
Of the three operations mentioned before, the inspection aspect is the focal
point of this thesis. The inspection system checks for physical or cosmetics flaws of
a product. This includes labels or markings on the product. These markings are
usually characters that gives the description of the product. The goal of the vision
system here is to recognise the marked characters which are considered as pattern.
Pattern Recognition
Pattern Recognition (PR) is the process of identifying objects of interests in
an image or scene. Within the context of image processing (IP), PR stands at the
level of classifying an object within the image. There are two generally accepted
techniques to approach PR - decision theoretic methods and structural methods. In
either case the most important issue to be considered is the feature selection.
In decision theoretic methods the number of features used are fixed. These
features (or commonly known as feature vectors) are usually passed through several
decision functions. The number of decision functions depends upon the number of
classes that these vectors can be classified into. Each function will represent a class.
The function that yields the highest value upon substituting a set of feature vectors
will represent the class that the pattern belongs to. One of the simplest form of
decision theoretic method is the correlation technique. Traditionally this is known as
template matching. This method is very common in the industrial inspection
systems. In its most primitive form, an image is tested using a sub-image (or
3
template) of the actual object. The template is moved across the entire image testing
for correlation between the pixels. Here the feature vectors are pixels themselves.
The correlation between the template pixels and the image pixels are calculated. The
position with the highest correlation indicates that an object represented by the
template is found. This method is very sensitive to scaling and rotation. If scaling
and rotational variations are to be included as a template in the matching process then
the computational time will increase to an unacceptable level .
A more popular approach to decision theoretic PR is the statistical method.
Here features of object(s) are taken from many samples. These collection of features
are used to create a probability density function (PDF). Each set of features under
inspection is classified by finding the probability of that feature to belong to a certain
class. The decision function here is usually given by a famous Bayes Theorem. The
construction of PDFs needs a very large amount of sample data. The performance of
such system is based on the assumption that the features of the test object(s) will lie
within the domain of the PDF.
Advances in neural computing has given yet another choice of classifier
implementation. Works by Rumelhart, ef at. (I 986) brought the back-propagation
training algorithm which has been successfully implemented in several applications,
especially in Optical Character Recognition (OCR). Neural Networks are modelled
after the massively interconnected neurones in the brain. This network or system
consists of many processing elements called nodes or neurones. These nodes are
interconnected and the strength of each connection (called weights) stores and recalls
a pattern. 'Training' or 'Learning' is referred to the process of modifying these
4
weights to response to a particular set of patterns. The back-propagation algorithm
by Rumelhart et al. (1986), is a very widely accepted training method. Another
alternative algorithm would be Kohonen's self-organising map (Kohonen, 1 981 ) .
Both these architectures will be covered in-depth in chapter 3 , with much emphasis
on back-propagation algorithm.
The structural method mentioned earlier, takes the shape of the object as its
primary source of pattern vectors. The outline of the object is seen as a composition
of primitive set of shapes. Each shape in the primitive set is given a number. The
total outline of the object is then recorded as a string of these shape numbers. Later
these are identified by matching them with the ones that are already known. The
most prevailing technique using the structural approach in PR is the syntactic
method. This technique requires a set of rules that specifies how a pattern string
should be formed (known as grammar ) and a recogniser (known as automaton) that
determines if the string satisfy the rules of the grammar.
Visual Inspection
Most visual inspection systems use fast template matching algorithms. These
algorithms work very well in a very controlled environment. Most of the machinery
in the manufacturing industry, however, are not perfect. There are situations when
the object under inspection is tilted at a small angle, or in the case of integrated
circuit (Ie) package mark inspection, a tiny spec or a slight fattening of characters
5
(due to illumination) occurs. The system will reject the object in such a situation. A
better technique is to extract some salient features of the characters or markings such
as corners, curves and mid concavities. These too will fail when there are specs or
spots on the Ie. Additional processing is also needed to extract features.
In this study, an example project of IC mark inspection system from Motorola
Semiconductor Seremban is investigated and a solution is proposed. The objective
here is to develop a solution for the above mentioned problems by using pattern
recognition with neural network classifier. The main advantage of using Neural
Network (NN) is that it can mimic the human recognition system in adapting to
variation that may arise. Generally NN classifier is said to be faster and more
tolerable then statistical classifiers.
Problem Statement
The system currently used is a dedicated Image Processing computer based on
the MC68000 microprocessor. It uses feature matching techniques i.e. using curves
on the character blob as the template to check the mark. ICs with some small dots or
specs are rejected, when all that is required is that the markings can be read.
6
(A)
i
1-
(8)
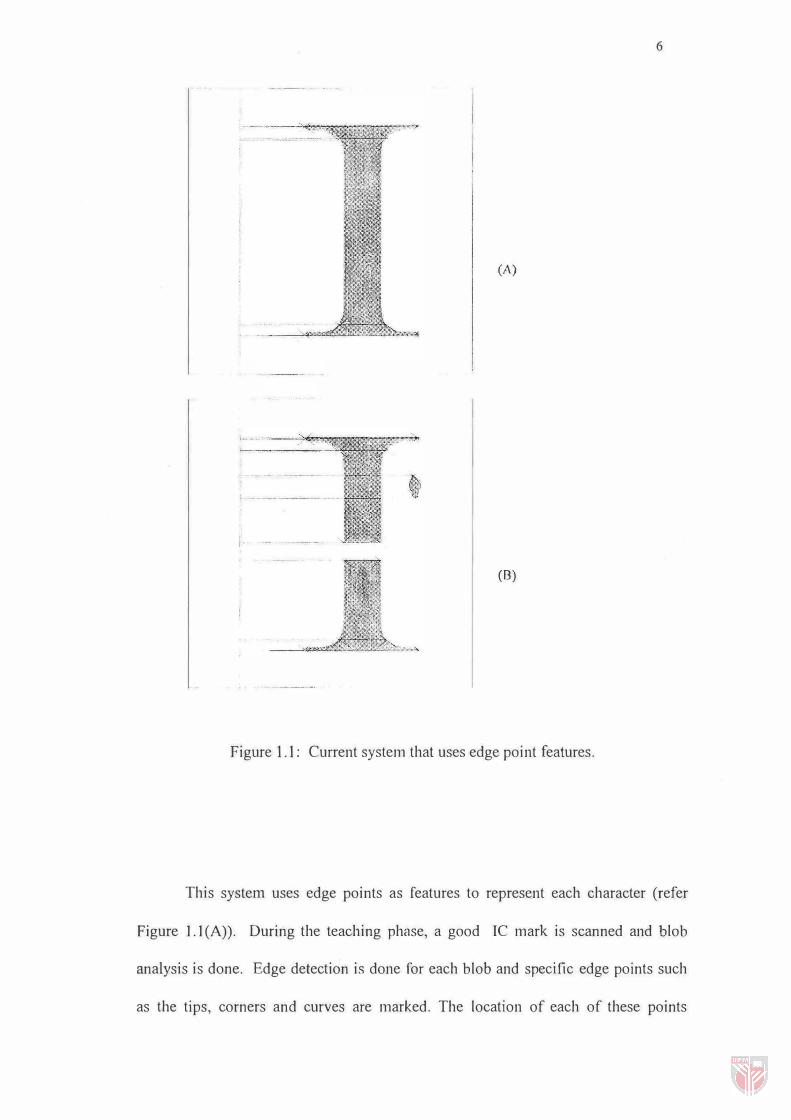
Figure 1.1: Current system that uses edge point features.
This system uses edge points as features to represent each character (refer
Figure 1.1 (A)). During the teaching phase, a good IC mark is scanned and blob
analysis is done. Edge detection is done for each blob and specific edge points such
as the tips, corners and curves are marked. The location of each of these points
7
relative to a reference point is calculated. During the production run, these points are
found for the inspected IC marking and compared with the previously stored values.
Common irregularities found are extra spots or break in the image that produces extra
points (refer to Figure 1 . 1 (B)). This will be found to be mismatched with the stored
points.
The main problem with this system (and template match system) is that its
error is accumulated globally, that is the total error throughout the entire image is
cotnpared to a given threshold. The solution for this would be to break the image into
smaller regions and then compare the similarities for each region. This localises the
error to a subsection.
The objectives of this study is to ensure that slight variations in the
markings of an Ie can be recognised by a proposed visual inspection system and
its processing time is acceptable to a manufacturing environment. This system will
consists of feature extraction such as described above and a neural classifier to
recognise the extracted features.
Thesis Summary
The following are a brief description of the contents of each chapter. The
next chapter reviews literature on neural networks and optical character recognition.
It traces through the history of neural networks and its contribution towards image
8
processing. Literature from Zheru Chi et af. ( 1 995) and lun Cao et al. ( 1 995) will be
reviewed. These two works have greatly contributed towards this thesis.
Chapter three will focus on the theory of image processmg and neural
networks. Topics covered will include binarisation, morphological operations and
feature extraction for image processing. As for neural network, the architecture for
multilayered feed forward network with error back propagation learning algorithms
and the Kohonen Self Organising Map are covered. This also includes their
respective mathematical formulas. Derivation of these formulas are not covered,
however, because they are deemed unnecessary to this project.
The following chapter on methodology, first describes the hardware and
software used in developing the programmes. A model diagram for the whole system
is presented. The internal functions of the software design is discussed for both
image processing and neural network components.
Chapter five is dedicated to presenting the results of the development and
running the programme. All timings obtained are presented in a tabular form to show
a better view of the processing speed. These results are also discussed along with the
problems faced and their respective solutions as it was implemented.
The thesis is concluded with a brief recap of the entire project in chapter six.
The main objectives are presented and its respective achievements are discussed.
This chapter is concluded with various suggestions for improvements and further
study for the future.
CHAPTER II
LITERATURE REVIEW
Introduction
Industrial visual inspection systems are an extension of pattern recognition in
image processing. However they require fast computation in order to produce higher
yield. Visual inspection systems are usually much faster compared to the mechanical
production machinery in a manufacturing plant. But when these systems are used for
tnore complex visual tasks, they take their toll of the processing time. This still
doesn't produce a bottleneck as faster processors are marketed at cheaper prices.
This has encouraged developers to look into more powerful number crunching
algorithms to be implemented. Following this, neural network based pattern
recognition systems are being adopted (Gosh, 1994). This review will trace out the
history of neural networks and its achievements. It will be biased towards image
processing applications. The review will continue with an introduction of Optical
Character Recognition researches and development and then with the works of Zheru
Chi et al. ( 1 995) and lun Cao et al. ( 1995) which forms the basis of this project.
All papers reviewed here are on Optical Character Recognition (OCR) since their
applications are leading the way in implementing neural networks as classifiers.
9
10
Artificial Neural Network
The biological neurones were first modelled by McCulloch and Pitts ( 1943).
Their computational model simulated the nervous system by performing single
threshold logic. McCulloch-Pitts work motivated several others to investigate
further. Among them, most significant result came from Hebb ( 1 949). Hebb
suggested that the synaptic strength changes during the learning period. His
hypothesis survived until today in one of the simplest mathematical formulation:
( 2 . 1 )
where Wi is the synaptic strength, Xi is the ith synapse, y(x) the excitation
function and E the learning rate.
Further works by Rosenblatt ( 1 958) combined the McCulloch-Pitts model and
Hebbs hypothesis prodUcing a functioning neural network hardware. This was the
first functioning visual pattern recognition system known popularly as perceptron.
His work has served as a stepping stone for the networks of the 1 980s and 90s.
However Minsky and Papert ( 1 968) gave a rigorous analysis to the perceptron model
and came to the conclusion that not all problems can be solved. They went on
modifying the perceptron model by introducing hidden layers which eventually
succeeded in solving those problems.
Following this Hopfield ( 1 982) advanced this structure by proposing a
feedback network. Rumelhart et al. ( 1 986) then formulated a feedback learning
11
algorithm based on propagating the error of the output node into the network for
correcting the weights in 1986. This algorithm has advanced and is very popular and
is being used as the network learning algorithm for this project.
In the same year Sejnowski and Rosenberg ( 1 986) demonstrated a working
system based on a network that could learn and speak like a six year old child. By
then the first commercial neural computer was already marketed by TRW AI
Research in 1 985 (Mori, et at. ( 1 993)).
Meanwhile another development was taking place in Europe. The learning
process of the brain has been observed to organise its the synaptic strength as such
that different cells correspond to differing signals. This ordered feature of the
mapped brain has led to the development of Self-Organising Map - a brain child of
Kohonen ( 1 981 ) from the University of Helsinki . This is yet another popular
architecture that has been developed further. He has successfully applied this
architecture to speech recognition systems. One practical system that was very
successful was the Finnish Phonetic Typewriter (Kohonen, 1 981) . Spoken Finnish
words are broken down to their phoneme (or basic sound syllables) and the system
will be able to recognise these phonemes and change them to text characters.
Fukushima (1 988) of the Science and Technical Laboratories of Japan
designed a neural network based image recogniser using techniques similar to
Kohonen's Self Organising Map. It was called Neocognitron. It uses multiple layers
of neurones to effectively classify hand-written numerals.
1 2
Optical Character Recognition (OCR)
Research and interests in Optical Character Recognition (OCR) can be traced
back to Tauschek (1929) who patented a template matching principle. His patent
was based on optical and mechanical technology that existed at that period. There
was not much development after that until the dawn of computers. With the
introduction of computers, OCR, which was a dream until then, became a reality.
Research continued by Glauberman ( 1 956) produced a technique where the
two dimensional image data of characters was projected onto one dimension. This
waS done by simply scanning the character vertically through a slit. Light that is
reflected is detected by a photo detector. The black portion (which is part of the
character) is calculated by simple analogue addition. The sampled values are
converted to digital values and matched against pre-recorded template.
In 1 957, Solatron Electronics Group Ltd., made an OCR machine based on a
technique called 'peephole' method. This method analyses the image in two
dimensions. Pixels values from various strategic locations of the character, so as to
differentiate characters, are taken and matched. Soon afterwards, Iijima et. at. (1958)
designed a machine based on the same principle but using 3 logic levels.
Another type of OCR is the recognition of hand written characters which
developed simultaneously. Due to the large variation in hand writings, methods to
analyse the structure of the characters were developed. The simplest form was
proposed by Rohland ( 1 954), where he scanned the image vertically and counted the
1 3
black pixels on each line. Following this, Weeks ( 196 1 ), scanned the image in four
directions - vertical, horizontal and both the orthogonal diagonals. An advance
approach of run-length encoding was taken by Doyle (1 960). Doyle used the
distance from a vertical base line to the first black pixel of the image when scanned
from top to bottom as a geometrical feature.
A hybrid of template matching and structure analysis was proposed by
Munson ( 1 968). It was found that template matching has the advantage on the lager
scale, whereas structure method was more robust and accurate in detecting features.
The combination of these two can be termed as feature matching. The character
under probe was divided into various subregions. In each region, the local structure
is analysed. This reduces the sensitivity of the template matching by comparing the
feature of each subregion instead of the whole character image.
Many hand written character recognition systems are adopting neural network
as their classifiers due to the flexibility it gives. Works by Cao et al. ( 1 995), for
instance, uses incremental clustering neural network and subclass neural network
with back propagation for classification. In their experiments, grey scale feature
histogram was used. The entire image was applied with 3 X 3 mean filter for about 6
times. Cao followed the hybrid method of Munson. The image was then divided
into 1 6 X 1 6 regions. The grey value for each region was fed into the clustering
neural network for classification. If the clustering network doesn't succeed in
classifying the character then the pattern is fed into a second stage subclassifier. The
second stage classifier is an error backpropagation feedfoward algorithm (Cao et aI.,
1 995). This method is considered to be slow for real time applications. However,
14
part of the feature extraction technique is very useful to this project, that is sectioning
the image into 1 6 X 1 6 regions.
Another hand written numeral recognition system proposed by Chi et at.
( 1 995), gives a more promising outlook for the problem at hand. They divided the
binary image into 8 X 8 subsections. In each section the number of image pixels
belonging to the character were counted and normalised to be within the range of 0.0
and 1 .0 . These normalised values were fed into a self organising map classifier that
has been trained to obtained the result. The sectioning of the image has the
advantage that the image is only scanned once and the output may be classified in a
single stage.
The one common feature found in both the technique is that the image is
divided (or sectioned) into smaller subsections. Usually algorithms based on
template matching and feature matching treats the whole image (or the region of
interest within the image) as one entity, thus spurious errors throughout the image is
collectively measured against a threshold limit and a negative result is obtained if it
exceeds this limit. By subsectioning the image, the processing is localised. Thus the
errors are contained within the section. As such the total error when considering the
entire image will be below the threshold level.