synthesis and characterization of low bandgap...
TRANSCRIPT
SYNTHESIS AND CHARACTERIZATION OF LOW BANDGAP NANOCRYSTALLINE
t-ZIRCONIA
NIKI PRASTOMO
UNIVERSITI SAINS MALAYSIA
2007
Saya isytiharkan bahawa kandungan yang dibentangkan di dalam tesis ini adalah hasil
kerja saya sendiri dan telah dijalankan di Universiti Sains Malaysia kecuali
dimaklumkan sebaliknya. Tesis ini juga tidak pernah disertakan untuk ijazah yang lain
sebelum ini.
Disaksikan Oleh: Tandatangan Calon Tandatangan Penyelia/Dekan Nama Calon: Niki Prastomo
SYNTHESIS AND CHARACTERIZATION OF LOW BANDGAP NANOCRYSTALLINE
t-ZIRCONIA
by
NIKI PRASTOMO
Thesis submitted in fulfillment of the requirements
for the degree of Master of Science
July 2007
ii
ACKNOWLEDGEMENTS
I cherish this chance to show my sincere gratefulness to my supervisors Assoc.
Prof. Dr. Ahmad Fauzi Mohd Noor and Dr Zainovia Lockman for their constant support,
encouragement, knowledge and valuables guidance during research project at
Materials Engineering, School of Materials & Minerals Resources Engineering,
Universiti Sains Malaysia. Inspired by them, I learned the true spirit of being a scientist.
I believe that hard work and consistent devotion are the keys to success. They have
become wonderful mentors for my work and my life. Then I would like to acknowledge
my advisor, Prof. Atsunori Matsuda at Department of Materials Science, Faculty of
Engineering, Toyohashi University of Technology, for his valuables comment and input
throughout the project. I wish to thank my advisor, Dr. Ahmad Nuruddin in ITB, for his
support and suggestions. I also would like to express my gratitude to Prof. P. Pramanik
of Department of Chemistry Indian Institute of Technology for supporting this work.
I would like to thank Dean, Assoc. Prof. Dr. Khairun Azizi Mohd. Azizli and to all
the members, past and present, of the Materials Engineering Study Program for their
kind assistance and supports, all the technical staffs, especially Mr. Sahrul, Ms Fong,
Mrs. Haslina, Mr. Hasnur, Mr. Helmi, Mr. Farid, Mr. Rashid, Mr. Azam, Mr. Mokhtar,
and Mr. Shahid for their invaluable assistance and technical support.
I am grateful to JICA-AUN/SEED-Net program for financial support and the
opportunity to undertake this work. Thank you very much to AUN/SEED-Net Chief
Advisor, Prof. Dr. Kazuo Tsutsumi, Mr. Sakae Yamada, Ms. Kalayaporn, Ms. Meena,
Ms Rungchalai, Ms. Irda, and Ms. Norpisah.
I want to thank all my group members including Koay Seong Tak, Wong Gar
Shen, Siew Fook Wai, Ch’ng Lay Ean, Nur Azila, Roshasnorlyza, Sam Sung Ting, Aye
iii
Aye Thant, Umar Al-amani, Firmandika Harda and Dr. Teoh Wah Tzu for their valuable
assistance. Without their technical support and friendship, I could not have possibly
finished my study here easily.
I want to express gratitude to all postgraduate students in School of Materials &
Mineral Resources Engineering USM, it was an unforgettable moment having great
companion during my study. All activities that we had together will be etched in my
mind.
Thanks to all my friends in PPI’s Engineering, especially for B’Sobron, Hosta,
Asep, B’Irvan, P’Teguh, B’Heri, P’Kusmono, K’Hamidah, B’zul, B’Fatur, B’Irtan and
Mba Yanti for their support and friendship. Finally, I would like to take this opportunity
to express my gratitude to my family members for their love, unfailing encouragement
and support, specially my parents. Special thanks to my dear Winda Deftiani Putri for
her endless care, encouragement and support.
iv
TABLE OF CONTENTS
Page ACKNOWLEDGEMENTS ii
TABLE OF CONTENTS iv
LIST OF TABLES viii
LIST OF FIGURES ix
LIST OF ABBREVIATION xiii
LIST OF SYMBOLS xv
LIST OF PUBLICATIONS xvi
ABSTRAK xviii
ABSTRACT xix
CHAPTER 1 : INTRODUCTION
1.1 Background and Problem statement
1
1.2 Objectives of the Research
5
1.3 Project Overview
5
CHAPTER 2 : LITERATURE REVIEW
2.1 Introduction
7
2.2 Polymorph
7
2.3 Phase Transformation
9
2.3.1 Cubic-Tetragonal
10
2.3.2 Tetragonal-Monoclinic
10
2.4 Stabilization
13
2.4.1 Influence of Lattice Defects
13
2.4.2 Influence of Particle Size
14
2.4.3 Influence of Water Vapor
15
v
2.4.4 Partially Stabilized Zirconia (PSZ)
15
2.4.5 Fully Stabilized Zirconia (FSZ)
16
2.4.6 Defects
16
2.4.7 Sintering Behaviour of Y2O3-Nb2O5 doped-Zirconia 20
2.4.8 Electronic Structure 23
2.5 Production of Nanocrystal Tetragonal Zirconia Powder 24
2.5.1 Sol-Gel Process
25
2.5.2 Precipitation Process
27
2.5.3 Polymer Precursor Decomposition Process 28
2.5.4 Soft Combustion Process
29
2.6 Application
30
CHAPTER 3 : MATERIALS AND METHODOLOGY
3.1 Introduction
32
3.2 Raw Materials
32
3.3 Experiment A (Polymer Precursor Decomposition Method) 33
3.3.1 Effect of Cooling After Calcination 34
3.2.1.1 Solution Preparation 34
3.2.1.2 Mixing of Solution Prepared 36
3.2.1.3 Calcination Stage 36
3.3.2 Effect of Amount of Tri Ethanol Amine (TEA) 37
3.3.3 Effect of Dopant Concentration 38
3.2.3.1 Mixing Process of Solution 39
3.2.3.2 Calcination and Pelletization 40
3.2.3.3 Sintering of Pellets 41
3.4 Experiment B (Soft Combustion Method) 41
3.4.1 Solution Preparation 42
vi
3.4.2 Mixing of Nitrate Solutions 42
3.4.3 Calcination
43
3.4.4 Pelletization and Sintering
43
3.5 Characterization
43
3.5.1 Thermal Analysis 43
3.5.1.1 Differential Thermal Analysis (DTA)
44
3.5.1.2 Thermo Gravimetry (TG)
45
3.5.2 Phase Analysis
46
3.5.2.1 X-Ray Diffraction (XRD) 46
3.5.3 Surface Area Determination
49
3.5.4 Morphology and Microstructure Analysis 49
3.5.4.1 Scanning Electron Microscopy (SEM) 50
3.5.4.2 Transmission Electron Microscopy (TEM) 52
3.5.5 Optical Bandgap Measurement by UV-Visible
Spectrometer
53
3.5.6 Density Measurements 54
3.5.7 Volume Shrinkage Measurements
55
CHAPTER 4 : RESULTS AND DISCUSSION
4.1 Introduction 57
4.2 Synthesis of t-ZrO2 powder 57
4.2.1 Experiment A (Polymer Precursor Decomposition Method) 57
4.2.1.1 Effect of cooling process after calcinations 57
4.2.1.2 Effect of TEA concentration 61
4.2.1.3 Effect of Dopants concentration 67
4.2.1.4 Effect of Calcination Temperature 78
vii
4.2.2 Experiment B (Soft Combustion Method)
82
4.3 Sintering and densifications of t-ZrO2 89
4.3.1 Argon-carbon sintering atmosphere 89
4.2.3 Vacuum and air sintering atmosphere 94
4.2.4 Optical Bandgap Studies
102
CHAPTER 5 : CONCLUSION AND RECOMMENDATION
5.1 Conclusion
106
5.1.1 Synthesis of nanocrystal t-ZrO2 powder 106
5.1.2 Synthesis of dense t-ZrO2 107
5.1.3 Effect of Nb to Y ratio to the phase of ZrO2 and to the
bandgap value
108
5.2 Recommendation for Future Research
109
REFERENCES
111
APPENDICES
APPENDIX A ICDD CARD
APPENDIX B Calculation Sample
APPENDIX C Optical Bandgap Graph
viii
LIST OF TABLES
Page
2.1 Physical properties of zirconia polymorph. 9
3.1 Raw materials details 33
3.2 Dopants composition and %mol TEA to metal ions ratio 37
3.3 Dopants composition for Polymer Precursor Method 39
3.4 Sintering parameters 41
3.5 Dopants composition and %mol of Glycine on study of combustion
fuel concentration
42
4.1 dhkl values of the principal peaks, crystallite size and phase of
zirconia sample
59
4.2 dhkl values of the principal peaks, crystallite size and phase of same
mol % Nb to Y-ZrO2 sample which were calcined at 700C
68
4.3 dhkl values of the principal peaks, crystallite size and phase of
different mol % Nb to Y-ZrO2 sample which were calcined at 700C
68
4.4 dhkl values of the principal peaks, crystallite size and phase of
zirconia sample were rapidly quenched after calcination
79
4.5 Summarize of optimum achievements 82
4.6 dhkl values of the principal peaks, crystallite size and phase of
zirconia sample
86
4.7 Comparisons of polymer decomposition and soft combustion method 88
4.8 Phase analysis from XRD data and density data of densified samples
from various t-ZrO2 powders sintered at 1400°C in Argon-carbon
atmosphere
91
4.9 Phase analysis from XRD data and density data of densified samples
from various t-ZrO2 powders sintered at 1550°C in Argon-carbon
atmosphere
91
4.10 Phase analysis from XRD data and density data of densified samples
from various t-ZrO2 powders sintered at 1400°C in vacuum
atmosphere
95
4.11 Phase analysis from XRD data and density data of densified samples
from various t-ZrO2 powders sintered at 1400°C in air atmosphere
98
4.12 Phase analysis from XRD data and density data of densified samples
from various t-ZrO2 powders sintered at 1600°C in air atmosphere
98
4.13 Summarize of optical bandgap measurements 103
ix
LIST OF FIGURES
Page
2.1 Atomic structure (top) and Zr to O coordination units (bottom) for
the three low pressure polymorphs of ZrO2: cubic (left), tetragonal
(middle) and monoclinic (right). Large dark circles denote O atoms,
small light circles, Zr [Munoz et al., 2006]
9
2.2 Lattice parameters changes during t-m transformation [Patil and
Subbarao, 1969]. Where am is “a” axis value of monoclinic phase,
bm is “b” axis value of monoclinic phase, cm is “c” axis value of
monoclinic phase, ct is “c” axis value for tetragonal phase, V is
volume of the zirconia crystal structure and is angle between “a”
and “c” axis
11
2.3 Tetragonal phase percentage during heating and cooling process
[Maiti et al., 1972]
12
2.4 SEM micrograph of “needle like” strucute of zirconia [Bansal and
Heuer, 1972 and 1974]
13
2.5 Part of the simplified ternary phase diagram for the system Y2O3-
Nb2O5-ZrO2 at 1500°C. Tss, Css and NTss are t-ZrO2, cubic ZrO2,
and non-transformable t-ZrO2 solid solution, respectively. A, B and
C indicate the 90 mol% ZrO2-5.5 mol% Y2O3-4.5 mol% Nb2O5,
89 mol% ZrO2-6 mol% Y2O3-5 mol% Nb2O5 and 85 mol% ZrO2-7.5
mol% Y2O3-7.5 mol% Nb2O5 compositions, respectively [Lee et al.,
1998]
22
2.6 Band structure of cubic (left), tetragonal (middle) and monoclinic
(right) ZrO2 along high symmetry directions. The energy zero is set
at the Fermi level [Munoz et al., 2006]
24
2.7 Flow chart of alkoxide route sol gel process [Bersani et al., 2004] 26
2.8 Flow chart of precipitation method [Raghavan et al., 2001] 27
2.9 Flow chart of polymer precursor decomposition method [Ray et al.,
2002]
29
2.10 Flow chart of combustion method [Juarez et al., 2000] 30
3.1 Flow chart of Phase One Polymer Precursor Decomposition
method
34
3.2 A muffle furnace in (a) closed condition (b) opened condition 37
3.3 Flow chart of phase three experiment A 38
x
3.4 Schematic Diagram of Instrumentation for DTA [Reutzel-Edens,
2004], where S refer to sample, R is reference and ∆T is different
temperature between sample and the reference
44
3.5 Schematic drawing of instrumentation for TG [Reutzel-Edens,
2004]
45
3.6 Siemens D5000, XRD instrument 47
3.7 SEM Schematic [Runyan and Shaffner, 1998] 50
3.8 Zeiss Supra 55VP PGT/HKL Field Emission Scanning Electron
Microscope (FESEM)
51
3.9 TEM Schematic [Murr, 1991] 52
3.10 Philips CM12 Transmission Electron Microscope (TEM) 53
3.11 Schematic of UV-Visible Spectrometer [Lim, 2006] 54
4.1 DTA diagram of Zr5-5 using 1:6 TEA %mol ratio 58
4.2 XRD pattern of Zr5-5 and Zr20-20 powders calcined at 700ºC, with
furnace cooling and quench cooling
59
4.3 30 K magnifications SEM with EHT = 4.00 kV pictures of (a) Zr5-5
that has been calcined at 700°C using furnace cooling and
(b) Zr20-20 that has been calcined at 700°C using quench cooling
process
60
4.4 1.00 M magnifications TEM image of (a) Zr5-5 and (b) Zr20-20,
calcinations temperature 700 ºC for 2 hours with quench cooling
61
4.5 DTA diagram of Zr5-5 using (a) 1:6, (b) 1:10 and (c) 1:20 TEA
%mol ratio
62
4.6 Crystallite size of (101) plane of TEA6, TEA10 and TEA20 63
4.7 Surface area as a function of TEA added (TEA6, TEA10 and
TEA20)
64
4.8 1.00 M Magnification TEM picture of (a) TEA6, (b) TEA10 and
(c) TEA20
66
4.9 XRD pattern of (a) Zr0-0, (b) Zr2.5-2.5, (c) Zr5-5, (d) Zr7.5-7.5,
(e) Zr10-10, (f) Zr15-15 and (g) Zr20-20 powders using 1:6 TEA,
calcined at 700ºC for 2 hours with quench cooling
67
4.10 Crystallite size of (101) plane of sample Zr5-5, Zr7.5-7.5, Zr10-10,
Zr15-15 and Zr20-20
70
4.11 The effect of dopants concentration to the lattice constant 71
xi
4.12 XRD pattern of (a) Zr0-5, (b) Zr1-5, (c) Zr3-5, (d) Zr5-5, (e) Zr7-5
and (f) Zr9-5 powders using 1:6 TEA, calcined at 700ºC for 2 hours
with quench cooling
72
4.13 XRD pattern of Zr5-0 calcined at 700ºC for 2 hours with quench
cooling
72
4.14 The crystallite size (101) plane of Zr0-5, Zr1-5, Zr5-5, Zr3-5, Zr7-5
and Zr9-5
74
4.15 20.00 K magnifications FESEM image with EHT = 3.00 kV of
(a) Zr5-5, (b) Zr7.5-7.5, (c) Zr10-10, (d) Zr15-15 and (e) Zr20-20,
calcinations temperature 700 ºC for 2 hours with quench cooling
75
4.16 1.00 M magnifications TEM image of (a) Zr5-5, (b) Zr10-10,
(c) Zr15-15 and (d) Zr20-20, calcinations temperature 700 ºC for 2
hours with quench cooling
76
4.17 Particle size distribution of Zr5-5 77
4.18 Particle size distribution of Zr10-10 77
4.19 Particle size distribution of Zr15-15 77
4.20 Particle size distribution of Zr20-20 78
4.21 Phase analysis of Zr5-5 in different calcinations temperatures 79
4.22 Crystallite size of Zr5-5 in different calcinations temperatures 80
4.23 Phase analysis of Zr20-20 in different calcinations temperatures 81
4.24 Crystallite size of Zr20-20 in different calcinations temperatures 81
4.25 Crystallization temperature of G0.5, G1, G1.5 and G2 83
4.26 XRD pattern of (a) G0.5 as, G0.5 powder with (b) 300°C, (c) 500°C,
(d) 600°C and (e) 700°C calcination temperature
85
4.27 XRD pattern of (a) G1 as, G1 powder with (b) 300°C, (c) 500°C,
(d) 600°C and (e) 700°C calcination temperature
85
4.28 40.00 K magnifications of FESEM image with EHT = 3.00 kV of (a)
G0.5 and (b) G1 powders calcined at 700°C for 2 hours
87
4.29 1.00 M magnifications of TEM image of G1powders calcined at
700°C for 2 hours
87
4.30 Particle size distribution of Zr5-5 (G1) 88
4.31 XRD pattern of (a) Zr0-5, (b) Zr1-5, (c) Zr3-5, (d) Zr5-5, (e) Zr7-5
and (f) Zr9-5 t-ZrO2 powders sintered at 1400°C in Argon-carbon
atmosphere
90
xii
4.32 XRD pattern of (a) Zr5-5, (b) Zr10-10, (c) Zr15-15, (d) Zr20-20 and
(e) Zr5-5-G1 t-ZrO2 powders sintered at 1550°C in Argon-carbon
atmosphere
90
4.33 Tetragonal phase percentage of Zr5-5, Zr10-10, Zr15-15, Zr20-20
and Zr5-5-G1 t-ZrO2 powders sintered at 1400°C and 1550°C in
Argon-carbon atmosphere
92
4.34 25.00 K magnification with EHT = 3.00 kV, microstructure of
Zr5-5-G1, sintered at 1550°C in argon-carbon atmosphere
93
4.35 100 and 5000 magnification with EHT = 3.00 kV, microstructure of
(a) Zr5-5, (b) Zr10-10, (c) Zr15-15 and (d) Zr20-20 sintered at
1400°C in vacuum atmosphere
96
4.36 50.00 K magnification with EHT = 3.00 kV, microstructure of (a)
Zr5-5, (b) Zr10-10, (c) Zr15-15 and (d) Zr20-20 sintered at 1400°C
in vacuum atmosphere
97
4.37 (a) 100, (b) 500, (c) 2000 and (d) 5000 magnification with
EHT = 3.00 kV, microstructure of Zr20-20 sintered at 1600°C in air
atmosphere
99
4.38 Percentage of tetragonal phase of samples sintered at 1400°C in
argon-carbon, vacuum and air atmosphere
101
4.39 Optical bandgap value of Zr1-5 samples that sintered at 1400°C in
vacuum atmosphere
103
xiii
LIST OF ABBREVIATION
Ca : Calcium
Ce : Cerium
Cu : Copper
CB : Conduction Band
c-ZrO2 : Cubic Zirconia
BET : Surface Area Measurements
DTA : Differential Thermal Analysis
EF : Fermi Energy
Eg : Bandgap Energy
FESEM : Field Emission Scanning Electron Microscope
FSZ : Fully Stabilized Zirconia
GaN : Gallium Nitride
ICDD : International Centre for Diffraction Data
JCPDS : Joint Committee on Powder Diffraction Standards
LTD : Low Temperature Degradation
MSDS : Materials Safety Data Sheet
m-ZrO2 : Monoclinic Zirconia
Mg : Magnesium
Nb : Niobium
NHE Normal Hydrogen Electron
nm : nano meter
PSZ : Partially Stabilized Zirconia
SEM : Scanning Electron Microscope
SiC : Silicon Carbide
SOFC : Solid Oxide Fuel Cells
SPG : Secondary Precipitate Growth
TEA : Tri Ethanol Amine
TEM : Transmission Electron Microscope
TG : Thermo Gravimetry
Th : Thorium
Ti : Titanium
TiO2 : Titanium Oxide
TZP : Tetragonal Zirconia Polycrystalline
xiv
t-ZrO2 : Tetragonal ZIrconia
UV : Ultra Violet
VB : Valence Band
YNbO4 : Yttrium Niobium Oxide
XRD : X-Ray Diffraction
Y : Yttrium
YSZ : Yttria Stabilized Zirconia
Zr : Zirconium
ZrO2 : Zirconia
ZTM : Zirconia Toughened Mullite
xv
LIST OF SYMBOLS
ac : “a” axis value of cubic phase (Å)
am : “a” axis value of monoclinic phase (Å)
at : “a” axis value of tetragonal phase (Å)
A : Specific Surface Area (g/m2)
bm : “b” axis value of monoclinic phase (Å)
: angle between “a” and “c” axes (°)
cm : “c” axis value of monoclinic phase (Å)
ct : “c” axis value of tetragonal phase (Å)
dhkl : Interplanar Spacing (Å)
e : Electron
hkl : Miller Indices
hv : Photon Energy (eV)
Ic : X-Ray intensity of cubic phase
Im : X-Ray intensity of monoclinic phase
It : X-Ray intensity of tetragonal phase
: wavelength of the X-Ray radiation (nm)
ρ : Density (g/cm3)
V : Volume pellets (cm3)
vc : Volume fraction of cubic phase (%)
vm : Volume fraction of monoclinic phase (%)
VÖ : Oxygen Vacancy
vt : Volume fraction of tetragonal phase (%)
θ : Angle (°)
xvi
LIST OF PUBLICATIONS
1. Niki Prastomo, Zainovia Lockman, Ahmad Nuruddin, Atsunori Matsuda, Ahmad
Fauzi Mohd Noor. (2006) Preliminary Study On Chemical Synthesis Of
Nanocrystals Semi-Conducting Tetragonal Zirconia. Proceeding 3rd School of
Materials and Mineral Resources Engineering USM Postgraduate Research
Paper, Published by SMMRE, USM, Pulau Penang, Malaysia. 2005/2006, p58
2. Niki Prastomo, Zainovia Lockman, Ahmad Nuruddin, Atsunori Matsuda, Ahmad
Fauzi Mohd Noor. (2006) Chemical Synthesis Of Nanocrystals Semi-
Conducting Tetragonal Zirconia Powders. Proceeding. AUN/SEED-Net/JICA
Field-Wise Seminar VIII, 22nd-23rd May 2006, Pulau Pinang, published by
School of Materials and Mineral Resources Engineering, Universiti Sains
Malaysia, 14300 Nibong Tebal, Pulau Pinang, Malaysia.
3. Niki Prastomo, Zainovia Lockman, Ahmad Nuruddin, Atsunori Matsuda, Ahmad
Fauzi Mohd Noor. (2006) Chemical Synthesis Of Nanocrystals Tetragonal
Zirconia Powders. Proceeding. Nano MIG Seminar, 22nd June 2006, School of
Materials and Mineral Resources Engineering, Universiti Sains Malaysia, 14300
Nibong Tebal, Pulau Pinang, Malaysia.
4. Niki Prastomo, Zainovia Lockman, Ahmad Nuruddin, Atsunori Matsuda, Ahmad
Fauzi Mohd Noor. (2006) Soft Combustion Synthesis Of Nanocrystalssemi-
Conducting Tetragonal Zirconia Powders. Proceeding. Asian Symposium on
Materials and Processing (ASMP) 2006, 9th -10th November 2006. The Japan
Society of Mechanical Engineers, Bangkok, Thailand.
xvii
5. Niki Prastomo, Zainovia Lockman, Ahmad Nuruddin, Atsunori Matsuda,
Panchanan Pramanik, Ahmad Fauzi Mohd Noor. (2006) Soft Combustion
Synthesis Of Nanocrystalssemi-Conducting Tetragonal Zirconia Powders.
Proceeding. International Conference on X-Rays and Related Techniques in
Research and Industry (ICXRI) 2006, 29th-30th November 2006. Malaysian
Institute for Nuclear Technology Research, Putrajaya, Kuala Lumpur, Malaysia.
6. Niki Prastomo, Zainovia Lockman, Ahmad Nuruddin, Atsunori Matsuda, Ahmad
Fauzi Mohd Noor. (2007) The Effect Of Nb-Doping On Tetragonal Y-Zirconia.
Proceeding. International Conference on Engineering and Environment (ICEE)
2007. 10th-11th May 2007. Faculty of Engineering, Prince of Songkla University,
Thailand.
xviii
SINTESIS DAN PENCIRIAN t-ZIRKONIA NANOHABLUR DENGAN SELA JALUR RENDAH
ABSTRAK
Serbuk nanohablur t-ZrO2 disintesis melalui kaedah kimia untuk mencari
kemungkinan jika dop elektronik akan meningkatkan konduktiviti elektronik oksida. Y3+
ditambah sebagai penstabil untuk mengekalkan fasa t-ZrO2 manakala Nb5+
dimasukkan untuk dop elektronik. Fasa pembentukan dan penstabilan untuk
memperolehi 100% t-ZrO2 dikaji secara terperinci dengan menggunakan kesemua
parameter yang mempunyai kemungkinan untuk menyumbang fasa pembentukannya.
Melalui kajian ini, dop zirkonia disediakan melalui kaedah penguraian polimer dan
kaedah pembakaran lembut. Untuk kaedah penguraian polimer, larutan mediumnya
disediakan daripada campuran zirkonil nitrat (ZrO(NO3)2), yttrium nitrat (Y(NO3)3),
niobium tartarat (HNb(C4O6)) dan TEA (triethanolamine) manakala untuk kaedah
pembakran lembut, hanya zirkonil nitrat, yttrium nitrat, niobium nitrat (Nb(NO3)5) dan
glisin digunakan. Beberapa komposisi dop serbuk zirkonia telah disediakan melalui
kaedah penguraian terma pada suhu yang berbeza. Serbuk yang dihasilkan telah
dicirikan dengan menggunakan Analisis Perbezaan Terma (DTA), Pembelauan Sinar-X
(XRD), Pengimbas Mikroskopi Elektron (SEM) dan Penghantaran Mikroskopi Elektron
(TEM). Purata saiz partikel kalsin pada 700°C dalam kajian ini adalah dalam
lingkungan 13 sehingga 38 nm. Penambahan Nb5+ tidak mengubah kestabilan sintesis
serbuk dalam fasa tetragonal. Apabila disinter dalam atmosfera yang berlainan (argon-
karbon, vakum dan udara) didapati pensinteran pada suhu yang tinggi menyebabkan
t-ZrO2 berubah ke m-ZrO2. Walau bagaimanapun 100% t-ZrO2 dikekal dengan
pensinteran pada suhu 1400°C dalam atmosfera vakum. Sela jalur optik dikira
menggunakan Spektrometer Ultra Ungu-Cahaya Nampak keatas sample sinter dengan
t-ZrO2 memberikan nilai minima 4.00 eV, lebih rendah daripada sela jalur Zirkonia
Terstabil Yttria (YSZ) komersil dengan nilai 6.09 eV.
xix
SYNTHESIS AND CHARACTERIZATION OF LOW BANDGAP NANOCRYSTALLINE t-ZIRCONIA
ABSTRACT
Nanocrystal t-ZrO2 powders were synthesized through a chemical route to seek
a possibility if electronic doping would improve the electronics conductivity of the oxide.
Y3+ was added as a stabilizer to retain tetragonal phase ZrO2 whereas Nb5+ was added
for electronics doping. The phase formation and stabilization to achieve 100% pure
t-ZrO2 were studied in detail encompassing all possible parameters which would
contribute to the phase formation. Polymer decomposition and soft combustion
methods were performed in this study to produce the doped zirconia. Precursor
solutions were prepared from a mixture of zirconyl nitrate (ZrO(NO3)2), yttrium nitrate
(Y(NO3)3), niobium tartarate (HNb(C4O6)) and TEA (triethanolamine) for polymer
decomposition method, while zirconyl nitrate, yttrium nitrate, niobium nitrate (Nb(NO3)5)
and glycine were used in soft combustion method. Several dopants compositions of
zirconia powders were prepared by thermal decomposition method and were annealed
at different temperatures. The synthesized powders were characterized using
Differential Thermal Analysis (DTA), X-ray Diffraction (XRD), Scanning Electron
Microscopy (SEM) and Transmission Electron Microscopy (TEM). The average particle
size of the powders calcined at 700ºC in this study ranges from 13.00 to 38.00 nm. The
addition of Nb5+ did not alter the stability of the tetragonal phase formed in powder
synthesis. Upon sintering different kind of atmosphere (argon-carbon, vacuum and air)
it was found that at high sintering temperature, 1250°C to 1600°C, t-ZrO2 had
transformed to m-ZrO2. However 100% t-ZrO2 was retained with sintering at 1400°C in
vacuum condition. The optical band gap as measured by the UV-Visible Spectrometer
for the sintered sample with t-ZrO2 gave a minimum value 4.00 eV, lower than the
optical bandgap from commercial Yttria Stabilized Zirconia (YSZ) which was 6.09 eV.
1
CHAPTER 1 INTRODUCTION
1.1 Background and Problem Statement
As a result of continuous research and development, zirconia (ZrO2) has been
used in many wear resistant and refractory applications such as piston caps, extrusion
dies and machinery wear parts, as well as a solid electrolyte in furnace elements, fuel
cells and oxygen sensors [Amelinck et al., 1997]. The important role of ZrO2 in
industrial application is attributed to its good physical properties such as high flexural
strength (~1 GPa), good fracture toughness (~10 MPa m1/2), high temperature stability
and optimal dielectric constant (0) of around 20 [Munoz et al., 2006].
Below ~1170ºC zirconia occur in the monoclinic crystal structure (m-ZrO2),
while between ~1170ºC-2370ºC zirconia has a tetragonal crystal structure (t-ZrO2).
Above 2370ºC to the melting point at 2680ºC, zirconia is in cubic structure (c-ZrO2).
However, metastable t-ZrO2 often appears at room temperature besides m-ZrO2, and
by doping with low amount of metal oxides as well as controlled heat treatment, t-ZrO2
can be retained at room temperature [Stefanc et al., 1999-a].
Many studies on the stabilization at room temperature of this high temperature
phase (t and c) have been carried out by using higher size dopant of metallic oxides
such as calcia [Saha and Pramanik, 1995], magnesia [Porter and Heur, 1997] and
yttria [Ray et al., 2000], or lower size dopants such as tantalum [Ray et al., 2002] and
niobia [Ray et al., 2003]. Study on the stabilization of ziconia using two kinds of
dopants that has lower and higher size than zirconium has also been conducted
[Raghavan et al., 2001]. However there are still more to be explored especially on the
2
electronic conductivity of the ZrO2 when compositions of dopants with lower and higher
size than ZrO2 are added.
Lately in the last decade, studies on nanosized zirconia has gained some
recognition. Various chemical methods have been used for the production of
nanocrystalline zirconia-based powders, such as polymer decomposition process [Ray
et al., 2001], co-precipitation [Yashima et al., 1996], sol-gel [Martinez et al., 2005] and
soft combustion process [Juarez et al., 2000]. Among these processes, polymer
decomposition and soft combustion methods show some advantages such as its low
calcination temperature, relatively low cost compared to alkoxide-based sol-gel
methods and better control of stoichiometry in comparison with co-precipitation ones,
while producing powders in the nanometer range. Phase formation and stabilization for
achieving 100% pure tetragonal zirconia were studied in this current work which
encompasses some parameters contributing to the phase formation.
Sintering in high temperature was important to density doped t-ZrO2. However,
one major problem faced in sintering of ZrO2 was the phase transformation from
tetragonal to monoclinic [Capel et al., 2002]. Upon sintering at high temperatures more
energy would be required to overcome the stabilization energy from the metal ions.
Higher atomic-bonding vibration energy that could occur at high temperature breaks
apart the oxygen-metal ions bonding resulting the atomic reorientation, hence leading
to the phase transformation. This could induce the monoclinic formation upon cooling.
Zirconia is typically classified as an electrical insulator. Due to the significant
ionic characteristic of the chemical bond between metallic cations and oxide ions,
hence metallic oxides posses large band gaps [Robertson, 2004]. Their ionic nature
simultaneously suppresses the formation of easily ionized shallow donors or acceptors,
enhancing localization of either holes or electrons. A large energy is thus required to
3
delocalize these carriers. Zirconia is characterized by a roughly 5.8 eV bandgap,
higher than most common semiconducting oxides like TiO2 (3.5 eV) and Ta2O5 (4.4 eV)
[Robertson, 2004]. The conduction band edge for zirconia is however in the range of -
1.5 vs. Normal Hydrogen Electron (NHE) and the valance band is therefore +4.3 vs.
NHE. Such values are adequate for photocatalytic activity of this oxide. In fact, having
larger bandgap will allow absorption of light in the blue and ultraviolet region enhancing
the photcatalytic activity of the oxide. Indeed, zirconia has already being used to
oxidize various organic compounds forming a more benign compound safe for
disposable [Robertson, 2004].
The difference between an insulator and a semiconductor is essentially only
qualitative in nature; namely, insulators need to be heated to very high temperatures to
acquire appreciable thermally enhanced conductivity, whereas semiconductors are the
nonmetal solids which posses a noticeable electrical conductivity at room temperature
[Berger, 1997].
The development of semiconductor started, in the 1870s, when the selenium
photoconductivity was discovered [Berger, 1997], leading to the use of selenium in the
devices for the visual image transport by telegraph. The first solid-state rectifiers of the
alternating current based on selenium were made by Firtts (1883). His work was then
developed by Grondahl and Geiger (1927) by using cuprous oxide. The development
was followed by the useful of silicon and galenite in the electromagnetic wave detectors
for radio receivers [Bose, 1904]. In the search for materials with improved parameters,
the methods of material purification and single crystal growth were developed, and the
properties of semiconductor materials and devices became a subject of a large number
of researches, especially in silicon, germanium and transistor invention [Shockley,
1950].
4
The development was followed by the investigation of the electrical properties
of large number of binary compounds with components that belong to the groups of
periodic table equidistant from group IV. These compounds belong to one of three
types, III-V, II-VI, or I-VII, with crystal structure similar to either one of the cubic mineral,
sphalerite, or to hexagonal wurtzite [Berger, 1997]. Investigation of properties of the III-
V and II-VI compounds shows a very successful application in semiconductor devices,
such as fectifoiers, photodiodes and Gunn diodes [Gunn, 1963].
Currently, electronic materials require wide bandgaps within the range 3 to 4 eV
for high voltage and temperature operation, with good transport properties. Traditional
silicon based technology cannot support such requirements, but research in Gallium
Nitride (GaN) [Pearton et al., 2001] and Silicon Carbide (SiC) [Burk et al., 1999] made
this type of material capable of reaching similar performance level. Zirconia also has a
possibility to carry out this kind of applications at high voltage and high temperature
due to its high temperature stability and high toughness. However, further study on its
electronic conductivity should be conducted to produce lower bandgap zirconia.
With this background, this study was embarked to investigate the possibility of
zirconia as a semiconductor material. The production process of zirconia and the
electronic properties via doping the oxide with yttrium (Y3+) and niobium (Nb5+) was
explored. With its high solubility in zirconia system, Y3+ was used to induce and
stabilize t-ZrO2 phase while with its high electronic conductivity, Nb5+ was used as
electronic dopant to the pure t-ZrO2. As reported by Munoz et al. (2006) and Botta et
al. (1999) the bandgap of t-ZrO2 is in the range of 3 eV and hence pure t-ZrO2 is of
interest in this work due to the low bandgap value. Therefore, in this study, work was
done to optimize the formation of pure tetragonal phase, with intention to lower the
bandgap of zirconia by Nb5+ doping into wide bandgap semiconductor range. It is of
interest to explore this matter and evaluate if indeed t-phase of Nb-Y-ZrO2 can be used
5
as a semiconducting materials. One possible application of this oxide would be in high
power and high temperature devices, which include sensors and switches in
automobile.
1.2 Objective of the Research
The main objective of this research work is to produce nanocrystal t-ZrO2 with
semiconducting properties. With this main objective, the following studies were
conducted:
1 Synthesis of nanocrystal t-ZrO2 powders via wet chemical process, polymeric
precursor decomposition and soft combustion method.
2 Sintering of dense t-ZrO2 with optimum physical properties with low bandgap
value.
3 Investigation of the effect of Nb5+ to Y3+ ratio to the phase of ZrO2 (i.e. if the
tetragonal phase retained) and the bandgap value.
1.3 Project Overview
In this study, a wet chemical process by polymer precursor decomposition
(Experiment A) and a soft combustion method (Experiment B) was selected to produce
the t-ZrO2. Various parameters were investigated in synthesizing of t-ZrO2. Three
phases of study were conducted in the quest to explore the polymer precursor method.
The preliminary first phase was to study cooling process after calcinations. In the
second phase the effect of the amount of polymer precursor was investigated. The third
phase was a study on the dopants concentration effect and also the temperature
stability of the doped powders. A soft-combustion method was conducted to compare
with the polymer precursor decomposition synthesizing route in term of calcinations
temperature as well as the properties of the samples produced. Study on solution
6
preparation, amount of precursors, calcinations, pelletization, sintering and optical
bandgap were explored in both type experiments.
Characterization methods and equipments such as density measurement,
surface area determination, X-Ray diffraction (XRD), scanning electron microscopy
(SEM), transmission electron microscopy (TEM), differential thermal analysis (DTA)
and UV-Visible Spectrometer were employed.
7
CHAPTER 2 LITERATURE REVIEW
2.1 Introduction
Zirconium dioxide (ZrO2), also known as zirconia is a well studied material and
has now been used in many applications. It has unique physical properties such as low
thermal conductivity, high melting temperature, high hardness, low coefficient of
friction, chemical inertness, low wear resistance and good ionic conductivity. Zirconia
has been seen as one of the most promising ceramics for functional and structural
materials [Tang et al., 2004]. The uses of zirconia in wide variety of technical
applications make this compound an interesting subject for research works. For
example, at the present time ZrO2 has been developed to be used in wear resistant
and refractories applications such as piston caps, extrusion dies and machinery wear
parts as well as a solid electrolyte in furnace element, fuel cells and oxygen sensors
[Amelinck et al., 1997].
Apart from its excellent applications as hard coatings and refractories ceramic
components, ZrO2 has been long known to be an ionic conductor. It has been reported
that ZrO2 has been used as electrolyte in Solid Oxide Fuel Cells (SOFC) and as
oxygen sensors [Capel et al., 2002]. Nevertheless the electronic conductivity of ZrO2
has remained a subject which requires further studies.
2.2 Polymorph
Zirconia exists in three polymorphs, i.e. monoclinic (m), tetragonal (t) and cubic
(c). Below ~1170ºC zirconia occurs in the monoclinic terms, between ~1170ºC-2370ºC
zirconia has tetragonal crystal structure, and above 2370ºC to the melting point of ZrO2
(2680ºC), zirconia is in cubic structure [Stefanc et al., 1999-b].
8
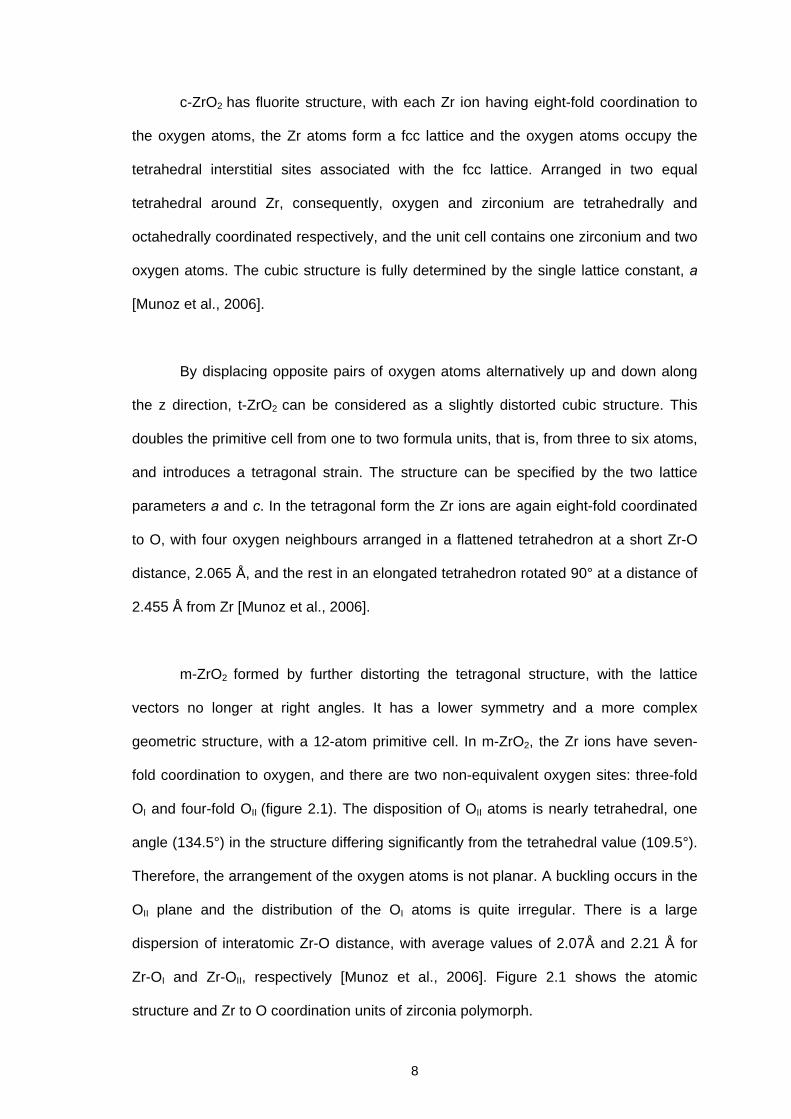
c-ZrO2 has fluorite structure, with each Zr ion having eight-fold coordination to
the oxygen atoms, the Zr atoms form a fcc lattice and the oxygen atoms occupy the
tetrahedral interstitial sites associated with the fcc lattice. Arranged in two equal
tetrahedral around Zr, consequently, oxygen and zirconium are tetrahedrally and
octahedrally coordinated respectively, and the unit cell contains one zirconium and two
oxygen atoms. The cubic structure is fully determined by the single lattice constant, a
[Munoz et al., 2006].
By displacing opposite pairs of oxygen atoms alternatively up and down along
the z direction, t-ZrO2 can be considered as a slightly distorted cubic structure. This
doubles the primitive cell from one to two formula units, that is, from three to six atoms,
and introduces a tetragonal strain. The structure can be specified by the two lattice
parameters a and c. In the tetragonal form the Zr ions are again eight-fold coordinated
to O, with four oxygen neighbours arranged in a flattened tetrahedron at a short Zr-O
distance, 2.065 Å, and the rest in an elongated tetrahedron rotated 90° at a distance of
2.455 Å from Zr [Munoz et al., 2006].
m-ZrO2 formed by further distorting the tetragonal structure, with the lattice
vectors no longer at right angles. It has a lower symmetry and a more complex
geometric structure, with a 12-atom primitive cell. In m-ZrO2, the Zr ions have seven-
fold coordination to oxygen, and there are two non-equivalent oxygen sites: three-fold
OI and four-fold OII (figure 2.1). The disposition of OII atoms is nearly tetrahedral, one
angle (134.5°) in the structure differing significantly from the tetrahedral value (109.5°).
Therefore, the arrangement of the oxygen atoms is not planar. A buckling occurs in the
OII plane and the distribution of the OI atoms is quite irregular. There is a large
dispersion of interatomic Zr-O distance, with average values of 2.07Å and 2.21 Å for
Zr-OI and Zr-OII, respectively [Munoz et al., 2006]. Figure 2.1 shows the atomic
structure and Zr to O coordination units of zirconia polymorph.
9
Figure 2.1: Atomic structure (top) and Zr to O coordination units (bottom) for the three low pressure polymorphs of ZrO2: cubic (left), tetragonal (middle) and monoclinic (right). Large dark circles denote O atoms, small light circles, Zr [Munoz et al., 2006]
Table 2.1 shows some physical properties of zirconia polymorph.
Table 2.1: Physical properties of zirconia polymorph. Property m-ZrO2 t-ZrO2 c-ZrO2 Reference
Bulk Density (g/cm3) 5.6 6.1 6.27 Rudolph, 2004
Band Gap (eV) 5.83 5.78 6.1 French et al., 1994
Thermal expansion
coefficient 0-1000°C
(x10-6K-1)
- 10.6 - Green et al., 1989
Thermal expansion
coefficient 0-1200°C
(x10-6K-1)
6.5 - 10.5 American Elements Co
(2007), Online
Lattice Parameters
(nm)
a = 0.51507
b = 0.52031
c = 0.53154
a = 0.50950
c = 0.51800 - Green et al., 1989
Lattice Parameters
(nm) - - a = 0.50800 Marshall et al., 1989
2.3 Phase Transformation
As reported, zirconia has three polymorphs; cubic, tetragonal and monoclinic.
At room temperature, the monoclinic structure is the stable phase. Upon cooling from
melting point, zirconia shows two kinds of solid-solid phase transformation, namely,
cubic to tetragonal (c-t) [Yoshimura, 1988] and tetragonal to monoclinic (t-m)
[Subbarao et al., 1974].
10
2.3.1 Cubic-Tetragonal
The cubic to tetragonal phase transformation in ZrO2 ceramics, is similar to
transformations in steels, and may be divided into two steps: the lattice rearrangement
and the adjustment of chemical composition toward the equilibrium state [Zhou et al,
1991]. The lattice rearrangement from cubic to tetragonal structure requires the
displacement of oxygen ions in order to increase the parameter of the c-axis and
decrease the parameters of a and b axis. The appearance of tetragonality corresponds
to the appearance of (112) reflections which are forbidden for the cubic phase. In this
case a tweed structure forms throughout the specimen and the visible contrast in dark
images taken by three (112) reflections is in fact a strain-type contrast induced by the
uniformly distributed nuclei of the t-phase. In this case the chemical composition did not
changed and remained just as the initial cubic phase [Zhou et al, 1991].
2.3.2 Tetragonal-Monoclinic
The t-m transformation occurs with a volume expansion and a shear distortion
parallel to the basal plane of t-ZrO2. These two characteristic can be used to increase
both the strength and the toughness of zirconia. In fact, ZrO2-based ceramic exhibits
various outstanding properties that are closely related to the t-m phase transformation;
for example, the volume change and the shear strain developed by the t-m
transformation of metastable tetragonal particles act against the opening of a crack,
and therefore increase the resistance of the ceramic to crack propagation. This
mechanism significantly extends the reliability and lifetime of ZrO2 derived materials
and leads to the high fracture toughness of tetragonal zirconia [Garvie et al., 1975].
By using high temperature X-Ray Diffraction (XRD), Ruff and Ebert (1929)
found the t-m transformation for the first time. Since then there were a lot of research
11
done using various technique, such as XRD, Different Thermal Analysis (DTA),
morphology study and also electrical resistance [Subbarao, 1981].
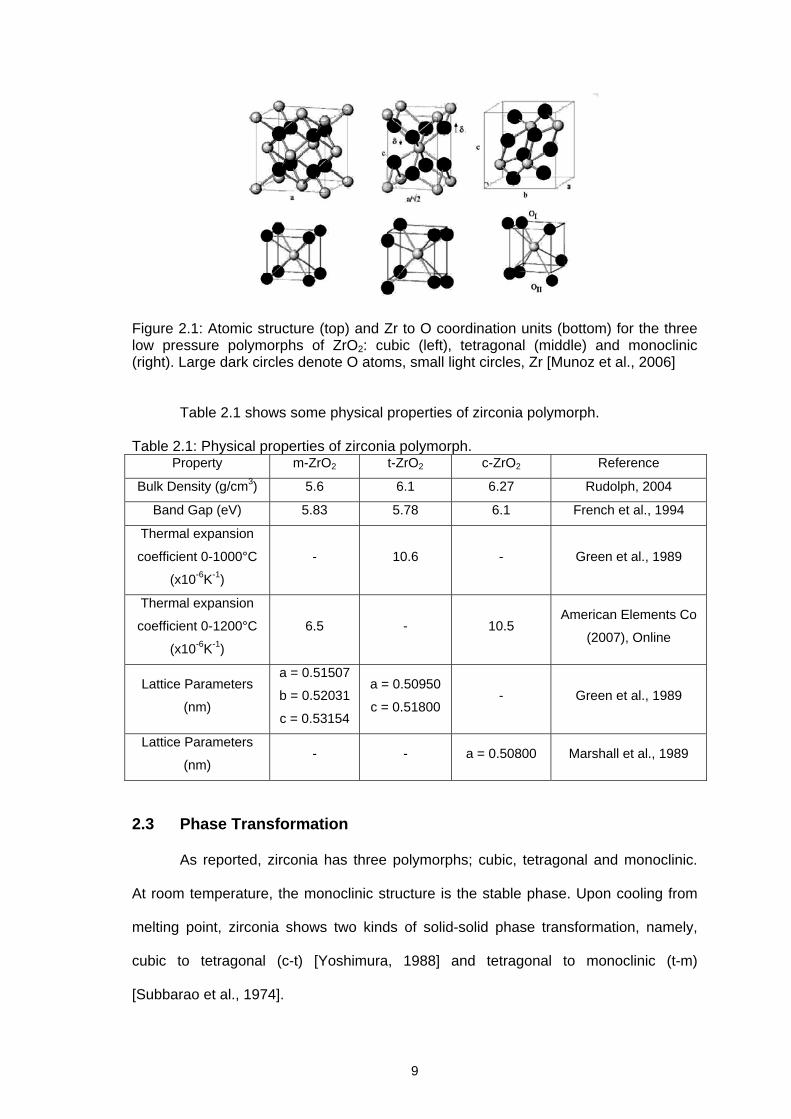
Phase transformation from tetragonal to monoclinic is not isotropic. Lattice
parameter a and c shows significant changes, but b value has a negligible changes
[Patil and Subbarao, 1969]. Figure 2.2 shows the lattice parameters changes during
transformation.
Figure 2.2: Lattice parameters changes during t-m transformation [Patil and Subbarao, 1969]. Where am is “a” axis value of monoclinic phase, bm is “b” axis value of monoclinic phase, cm is “c” axis value of monoclinic phase, ct is “c” axis value for tetragonal phase, V is volume of the zirconia crystal structure and is angle between “a” and “c” axis
Tetragonal-monoclinic transformation shows large thermal hysterysis (Figure
2.3). The transformation to monoclinic during cooling process occurs between ~1000°C
to ~650°C, whereby below this temperature all tetragonal would transform to
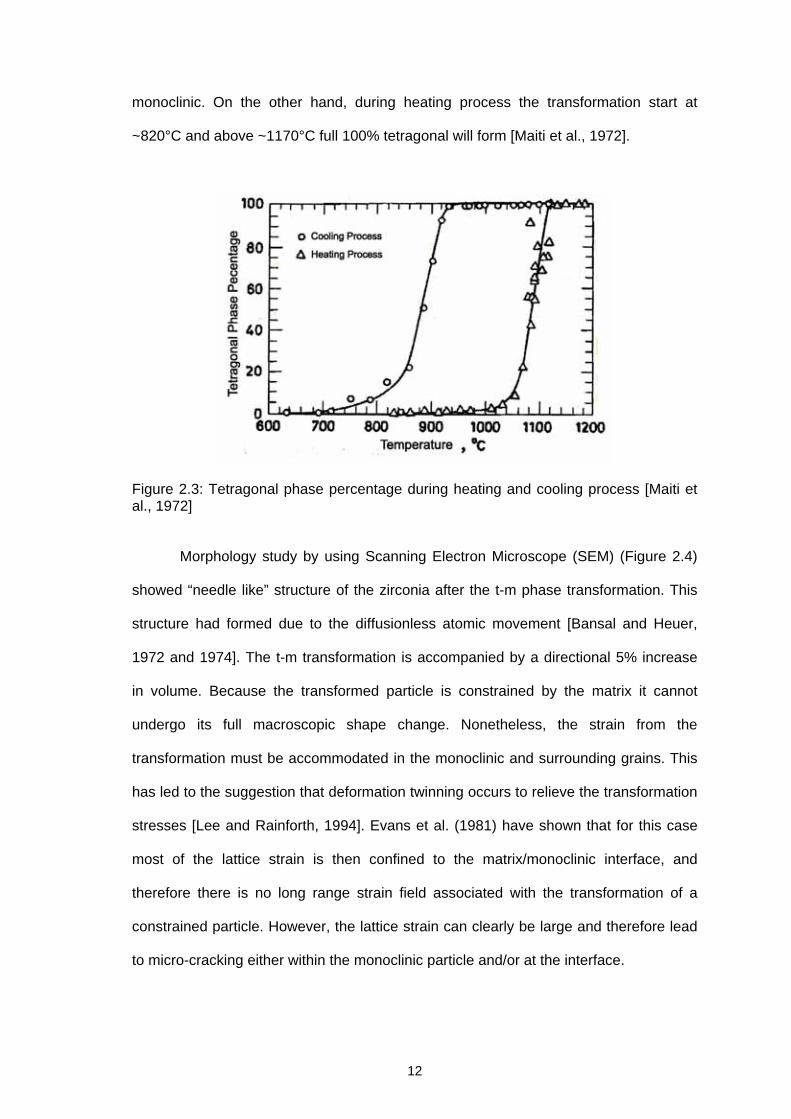
12
monoclinic. On the other hand, during heating process the transformation start at
~820°C and above ~1170°C full 100% tetragonal will form [Maiti et al., 1972].
Figure 2.3: Tetragonal phase percentage during heating and cooling process [Maiti et al., 1972]
Morphology study by using Scanning Electron Microscope (SEM) (Figure 2.4)
showed “needle like” structure of the zirconia after the t-m phase transformation. This
structure had formed due to the diffusionless atomic movement [Bansal and Heuer,
1972 and 1974]. The t-m transformation is accompanied by a directional 5% increase
in volume. Because the transformed particle is constrained by the matrix it cannot
undergo its full macroscopic shape change. Nonetheless, the strain from the
transformation must be accommodated in the monoclinic and surrounding grains. This
has led to the suggestion that deformation twinning occurs to relieve the transformation
stresses [Lee and Rainforth, 1994]. Evans et al. (1981) have shown that for this case
most of the lattice strain is then confined to the matrix/monoclinic interface, and
therefore there is no long range strain field associated with the transformation of a
constrained particle. However, the lattice strain can clearly be large and therefore lead
to micro-cracking either within the monoclinic particle and/or at the interface.
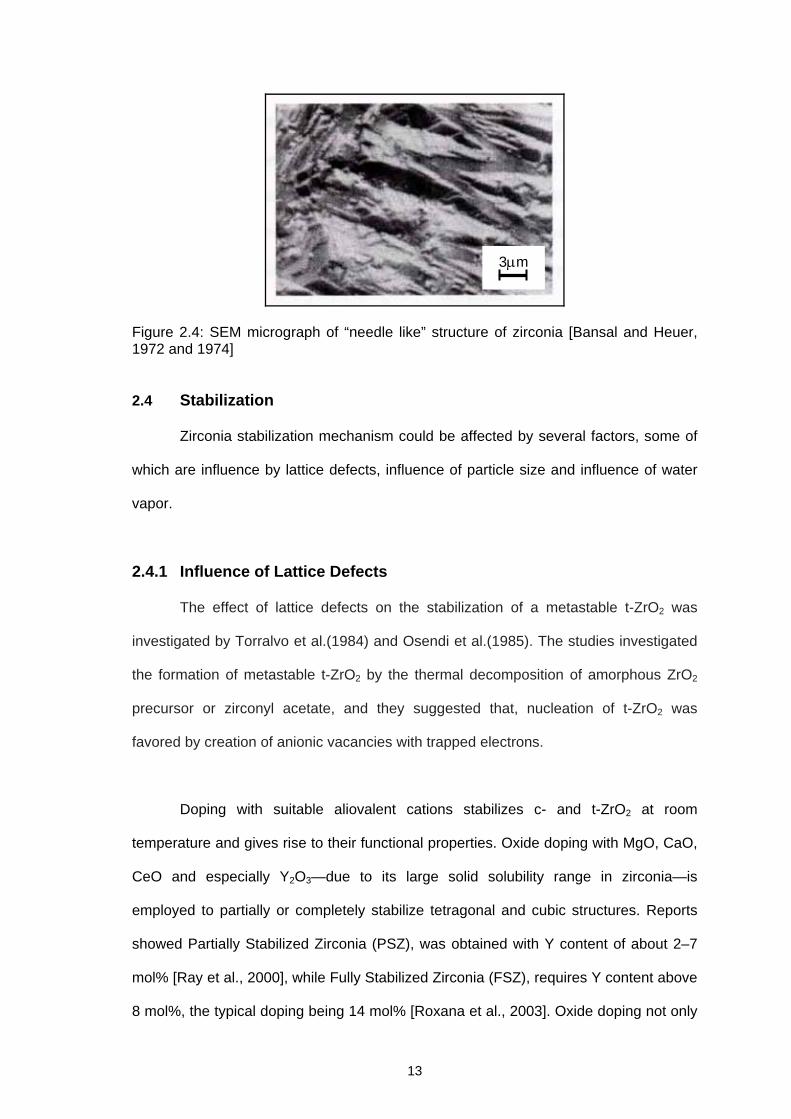
13
Figure 2.4: SEM micrograph of “needle like” structure of zirconia [Bansal and Heuer, 1972 and 1974]
2.4 Stabilization
Zirconia stabilization mechanism could be affected by several factors, some of
which are influence by lattice defects, influence of particle size and influence of water
vapor.
2.4.1 Influence of Lattice Defects
The effect of lattice defects on the stabilization of a metastable t-ZrO2 was
investigated by Torralvo et al.(1984) and Osendi et al.(1985). The studies investigated
the formation of metastable t-ZrO2 by the thermal decomposition of amorphous ZrO2
precursor or zirconyl acetate, and they suggested that, nucleation of t-ZrO2 was
favored by creation of anionic vacancies with trapped electrons.
Doping with suitable aliovalent cations stabilizes c- and t-ZrO2 at room
temperature and gives rise to their functional properties. Oxide doping with MgO, CaO,
CeO and especially Y2O3—due to its large solid solubility range in zirconia—is
employed to partially or completely stabilize tetragonal and cubic structures. Reports
showed Partially Stabilized Zirconia (PSZ), was obtained with Y content of about 2–7
mol% [Ray et al., 2000], while Fully Stabilized Zirconia (FSZ), requires Y content above
8 mol%, the typical doping being 14 mol% [Roxana et al., 2003]. Oxide doping not only
3m
14
modifies the ZrO2 structure, but also its vacancy concentration. This is because a large
number of oxygen vacancies are introduced when, for example, divalent (Mg2+) or
trivalent (Y3+) ions are incorporated into the zirconia structure for the purpose of phase
stabilization. The large number of O vacancies leads to a high ionic conductivity,
making the stabilized forms of zirconia one of the most useful electroceramics. In fact,
PSZ and FSZ present important advantages, and they are used instead of pure ZrO2
for most applications [Munoz et al., 2006]. FSZ and PSZ will be discussed in depth in
the subsequent headings.
2.4.2 Influence of particle size
Reducing the crystal size to a few nanometers is another approach for
stabilizing the high temperature phases at room temperature [Garvie, 1965; Garvie,
1985]. While m-ZrO2 is the thermodynamically stable polymorph at room temperature in
all system, t-ZrO2 can be retained at room temperature provided that the particle size is
below some critical value [Lee and Rainforth, 1994]. Above this critical size,
spontaneous transformation will occur on cooling from the sintering temperature.
Particles very much smaller than the critical size are resistant to transformation from
propagating crack.
Chraska et al. (2000) found that any coarsening above a certain critical size
results in particle transformation to the monoclinic phase. The critical size, up to which
the tetragonal phase is stable, is around 18 nm in diameter (9 nm radius). Various
explanations have been proposed for the observed stabilization of high temperature
tetragonal phase in nanocrystalline zirconia particles at room temperature and
controversies still exist in the elucidation of the mechanism of the t-phase stability.
Garvie and Goss (1986) proposed that the lower surface energy of the t-ZrO2 was the
cause for this phase to be present in nanocrystalline form at or below room
temperature. They predicted that particles below about 10 nm in diameter are stabilized
15
in the tetragonal form, and those that are above this critical particle size are subject to
the t-m transformation.
Srinivasan et al. (1990) argued against the concept proposed Garvie and Goss
(1986) (stabilization due to lower surface energy of the t phase) as they found
monoclinic particles with much smaller diameters. They suggested that anionic oxygen
vacancies present on the surface control the t-m phase transformation on cooling, and
that oxygen adsorption triggers this phase transformation.
2.4.3 Influence of water vapor
Murase and Kato (1979 and 1983) examined the transformation of tetragonal
ZrO2 by ball-milling at different atmospheres. The results obtained indicated the
important role of water adsorption on the surface of particles for the t-m transition of
milled samples. The authors concluded that water vapor markedly accelerated
crystallite growth of both m- and t-ZrO2 and facilitated the t-m transformation.
2.4.4 Partially Stabilized Zirconia (PSZ)
Partially stabilized Zirconia is a mixture of zirconia polymorphs. PSZ formed
because insufficient cubic phase-forming oxide added to the ZrO2. A smaller addition of
stabilizer to the pure zirconia will bring its structure into a tetragonal phase at a
temperature higher than 1,000°C and a mixture of cubic phase and monoclinic (or
tetragonal)-phase at a lower temperature [Stubican and Hellmann, 1981). Usually such
PSZ consists of larger than 8 mol% (2.77 wt%) of MgO, 8 mol% (3.81 wt%) of CaO, or
3-4 mol% (5.4-7.1 wt%) of Y2O3 [Jaeger and Nickell, 1971].
PSZ is a transformation-toughened material. Micro-crack and induced stress
may be two explainations for the toughening in partially stabilized zirconia. The micro-
crack explaination depends upon difference in the thermal expansion between the
16
cubic phase particle and monoclinic (or tetragonal)-phase particles in the PSZ [Green
et al., 1973 and 1974]. The difference in coefficient of thermal expansion between
monoclinic and cubic phase creates micro-cracks that dissipate the energy of
propagating cracks. The cubic matrix provides a compressive force that maintains the
tetragonal phase. Stress energies from propagating cracks cause the transition from
the metastable tetragonal to the stable m-ZrO2. The energy used by this transformation
is sufficient to slow or stop the propagation of the cracks.
2.4.5 Fully Stabilized Zirconia (FSZ)
FSZ is 100% cubic ZrO2. The addition of more than 16 mol% of CaO (7.9 wt%)
[Saha and Pramanik, 1995], 16 mol% MgO (5.86 wt%) [Porter and Heur, 1997], or 8
mol% of Y2O3 (13.75 wt%) [Roxana et al., 2003], into zirconia structure will form 100%
c-ZrO2 or is termed FSZ. Its structure becomes cubic solid solution, which has no
phase transformation from room temperature up to 2,500 °C.
2.4.6 Defects
By the addition of aliovalent oxides into the zirconia, the high temperature cubic
and tetragonal phases are partially or totally stabilized at room temperature. When
divalent or trivalent ions such as Mg, Ca or Y are incorporated into the zirconia matrix,
the dopant cations substitute Zr atoms and therefore introducing oxygen vacancies into
the anion sites to maintain electrical neutrality. Thus, PSZ and FSZ not only contain the
stabilizing dopants, but also a significant amount of oxygen vacancies. Their presence
gives rise to the large ionic conductivity of oxide-stabilized zirconia. The long range
transport of oxygen ions occurs by hopping between anion sites via the vacancies. In
addition, ZrO2 sintering methods performed in a reducing atmosphere result in the
production of another kind of oxygen vacancies, the so-called neutral or
thermodynamic vacancies [Munoz et al., 2006].
17
It has been demonstrated that thermodynamic vacancies also exert a
considerable stabilizing effect on the tetragonal ZrO2 phase [Zu and Yan, 1997], The
symmetry of the lattice is broken by dopants and the appearance of oxygen vacancies,
giving rise not only to structural modifications associated with the phase transformation,
but also to change in the electronic properties of the ceramic [Munoz et al., 2006].
Capel et al. (2002) discovered that the incorporation of titania (TiO2) into ceria-
stabilized tetragonal zirconia decreases the ionic conductivity in air of the formed
ternary t-ZrO2 solid solutions with increasing titania content. It is believed that such a
conductivity decrease is due to the formation of oxygen vacancy-cation associations
(Ti–Vö) with low vacancy diffusion dynamic resulting, thus, in a decrease in the global
concentration of moving oxygen vacancies. Interestingly, for TiO2-doped Zirconia, they
found that with decreasing oxygen partial pressures a strong departure from
stoichiometry with the reduction of Ti4+ to Ti3+ seems to take place. This indicates that
the conduction process is controlled by the Ce’Zr and Ti’Zr defect concentrations.
Assuming that the electrons are located on cerium and titanium sites, the electrical
conduction occurs by hopping of the electrons between Ce4+ and Ce3+ and Ti4+ and Ti3+
via a small polaron hopping mechanism. Botta et al. (1999) also found that the
incorporation of Fe(III), acting as an electron or hole trapping center in zirconia,
managed to produce t-ZrO2 with energy bandgap in ranges of 2.2-2.4 eV.
When a trivalent oxide, e.g. Y2O3, is added to ZrO2 as stabilizer, certain amount
of lattice defects, e.g. oxygen vacancies VÖ and negatively-charged solutes Y’Zr are
produced in the ZrO2 lattice. The conductivity of stabilized-ZrO2 is determined by its
defect structure, chiefly VÖ, Y’Zr and the defect associates between them in the case of
Y2O3 stabilized ZrO2 (YSZ) [Guo and Wang, 1997].
18
The lattice defect in YSZ is the grain boundaries and point defects. The major
point defects in YSZ are Y’Zr. and VÖ. However, VÖ will repulse positrons due to its
positive charge. Because of coulombic interaction between the charged defects, some
defect associates may be formed. It has been proved that (Y’ZrVÖ) is the dominant
defect associate in dilute Y2O3 and ZrO2 solution; in ZrO2 with high Y2O3 concentration,
the formation of (Y’ZrVÖY’Zr) is possible [Subbarao and Maiti, 1984].
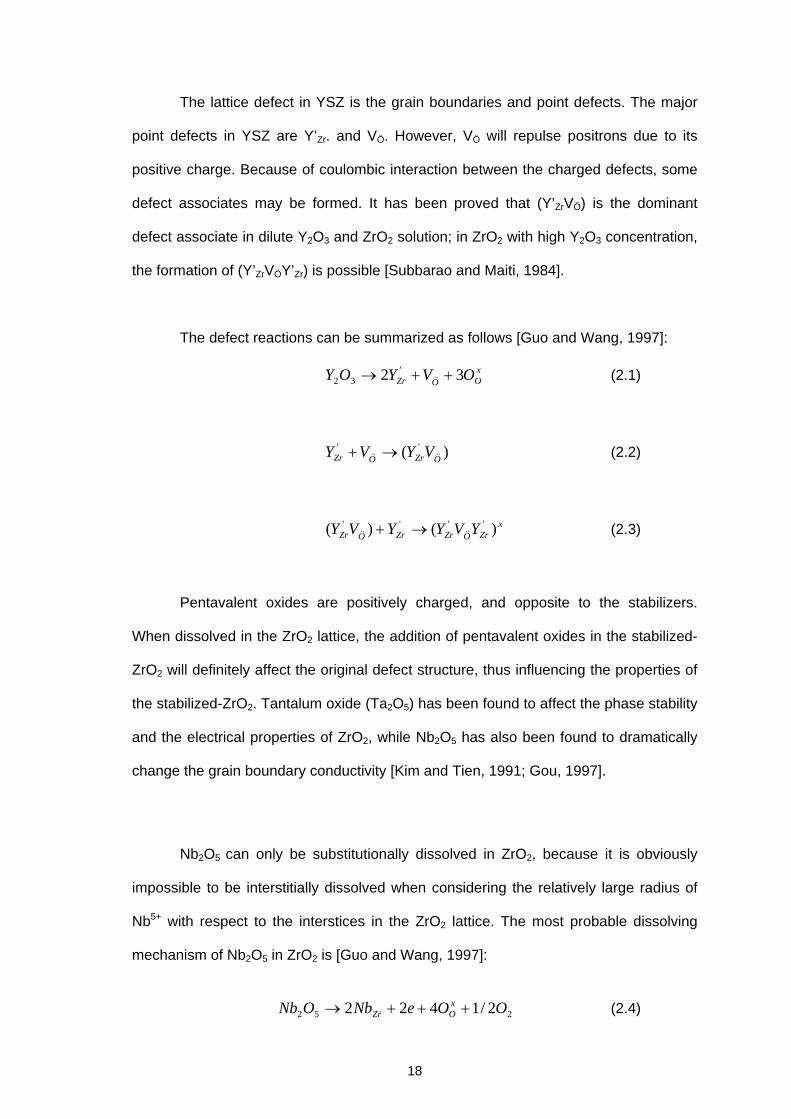
The defect reactions can be summarized as follows [Guo and Wang, 1997]:
xOOZr OVYOY 32 '
32 (2.1)
)( ''OZrOZr VYVY (2.2)
xZrOZrZrOZr YVYYVY )()( ''''
(2.3)
Pentavalent oxides are positively charged, and opposite to the stabilizers.
When dissolved in the ZrO2 lattice, the addition of pentavalent oxides in the stabilized-
ZrO2 will definitely affect the original defect structure, thus influencing the properties of
the stabilized-ZrO2. Tantalum oxide (Ta2O5) has been found to affect the phase stability
and the electrical properties of ZrO2, while Nb2O5 has also been found to dramatically
change the grain boundary conductivity [Kim and Tien, 1991; Gou, 1997].
Nb2O5 can only be substitutionally dissolved in ZrO2, because it is obviously
impossible to be interstitially dissolved when considering the relatively large radius of
Nb5+ with respect to the interstices in the ZrO2 lattice. The most probable dissolving
mechanism of Nb2O5 in ZrO2 is [Guo and Wang, 1997]:
252 2/1422 OOeNbONb xOrZ (2.4)
19
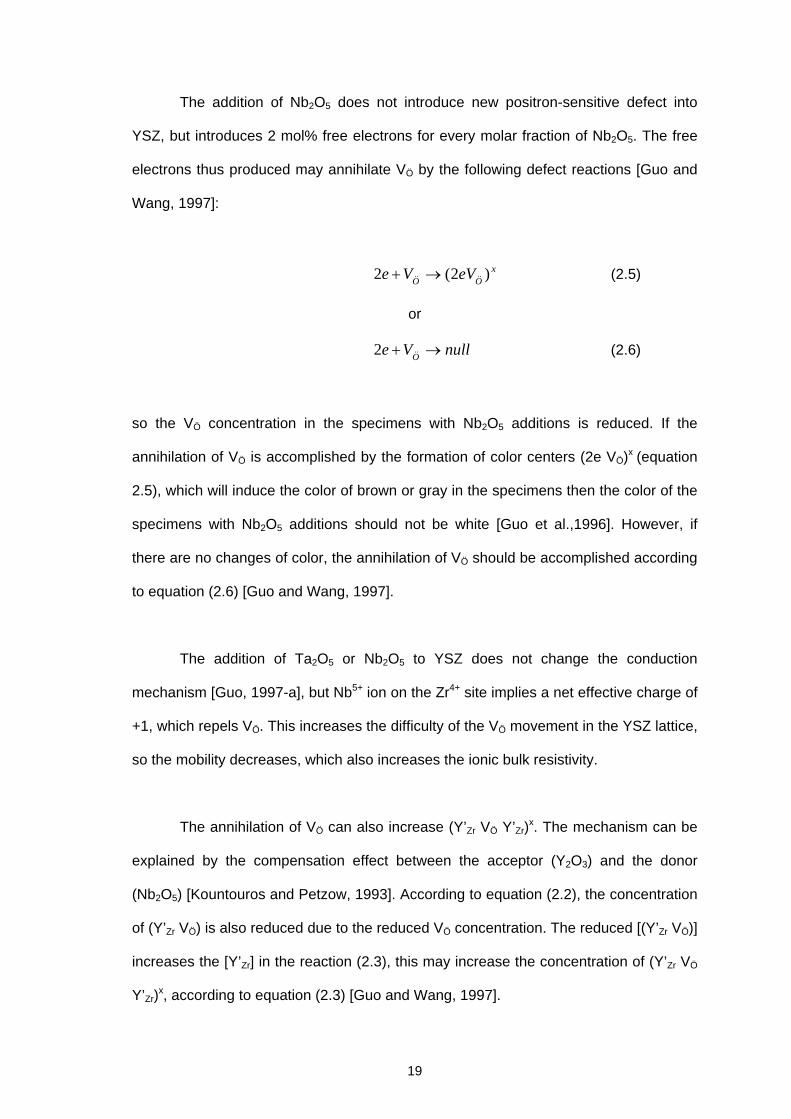
The addition of Nb2O5 does not introduce new positron-sensitive defect into
YSZ, but introduces 2 mol% free electrons for every molar fraction of Nb2O5. The free
electrons thus produced may annihilate VÖ by the following defect reactions [Guo and
Wang, 1997]:
xOO
eVVe )2(2 (2.5)
or
nullVeO 2 (2.6)
so the VÖ concentration in the specimens with Nb2O5 additions is reduced. If the
annihilation of VÖ is accomplished by the formation of color centers (2e VÖ)x (equation
2.5), which will induce the color of brown or gray in the specimens then the color of the
specimens with Nb2O5 additions should not be white [Guo et al.,1996]. However, if
there are no changes of color, the annihilation of VÖ should be accomplished according
to equation (2.6) [Guo and Wang, 1997].
The addition of Ta2O5 or Nb2O5 to YSZ does not change the conduction
mechanism [Guo, 1997-a], but Nb5+ ion on the Zr4+ site implies a net effective charge of
+1, which repels VÖ. This increases the difficulty of the VÖ movement in the YSZ lattice,
so the mobility decreases, which also increases the ionic bulk resistivity.
The annihilation of VÖ can also increase (Y’Zr VÖ Y’Zr)x. The mechanism can be
explained by the compensation effect between the acceptor (Y2O3) and the donor
(Nb2O5) [Kountouros and Petzow, 1993]. According to equation (2.2), the concentration
of (Y’Zr VÖ) is also reduced due to the reduced VÖ concentration. The reduced [(Y’Zr VÖ)]
increases the [Y’Zr] in the reaction (2.3), this may increase the concentration of (Y’Zr VÖ
Y’Zr)x, according to equation (2.3) [Guo and Wang, 1997].
20
In addition, there may be another possible defect reaction involved in the Nb2O5
additions [Guo and Wang, 1997]. At high Nb2O5 concentration, because of the
expected repulsive force between Nb’Zr and VÖ, the introduction of Nb’Zr into YSZ may
suppress the formation of the defect associates, even split the already formed defect
associates, i.e. two defect reactions defined as follows may occur:
'''' )()( ZrOZr
Nbx
ZrOZr YVYYVYrZ
(2.7)
OZr
Nb
OZr VYVYrZ
'' )( (2.8)
which will increase the concentration of mobile VÖ. This surely decreases the
concentration of the only positron-sensitive defect associate in YSZ: (Y’Zr VÖ Y’Zr)x.
However, this certainly will also decrease the bulk resistivities [Choudhary and
Subbarao, 1979; Guo and Wang, 1997].
At present, there is no stabilized ZrO2 structure for which the origin and strength
of defect interactions can be completely understood. Even for the most studied case,
yttria stabilized zirconia (YSZ), the experimental results support different defect
configurations. Some of research suggest that oxygen vacancies are bonded to the
dopant Y [Steele and Fender, 1974; Li and Hafskjold, 1995], others claim host Zr–
vacancy bonds [Catlow et al., 1986; Goff et al., 1999]. The strength of the vacancy–ion
bonds is also a matter of discussion.
2.4.7 Sintering Behaviour of Y2O3-Nb2O5 doped-Zirconia
In the ZrO2-Y2O3-Nb2O5 system, as the Nb2O5 content increased up to 1.5
mol%, the rate of low-temperature degradation (LTD) was reported to rise due to
the increase in the c/a axial ratio (tetragonality) of the t-ZrO2 solid solution. The
measurements was done to the sample that prepared by ceramic processing
21
method which involves mixing, ball-milling, pressing and sintering at 1500°C for two
hours [Guo, 1997-b]. This was associated with the internal strain, as a result of
annihilation of oxygen vacancies introduced by Y3+ [Kim et al., 1995; Kim et al.,
1998]. On the other hand, having a composition of 90.24 mol% ZrO2 ; 5.31 mol%
Y2O3; 4.45 mol% Nb2O5 (5.31Y-TZP) that sintered at temperatures of 1500-1650°C
with a heating rate of 6°C min-1 up to 900°C and a heating rate of 3°C min-1 up to the
sintering temperature and then furnace cooled to room temperature, showed excellent
phase stability and fracture toughness due to local Y-Nb dopant ordering in t-ZrO2 into
a scheelite-like arrangement, which resulted in a relief of the internal strain in the t-
ZrO2 lattice [Lee et al., 1998]. In the ordered structure, the smaller cation Nb5+ adopts
a four-fold coordination leaving eight-fold coordination to Y3+, determined by the
observation of X-ray absorption spectroscopy [Li et al., 1994].
The absence of LTD in TZP doped with certain Nb2O5 concentration indicates
two types of t-ZrO2 phases, i.e. a stable t-ZrO2 in the system ZrO2-YNbO4 and a
degradable t-ZrO2 in the system ZrO2-Y2O3, may coexist. However, the stable t-ZrO2
phase would hamper the t-m phase transformation of the degradable t-phase. This
was due to lattice relaxation of the degradable t-ZrO2 is restrained significantly by
the stable t-phase. The stable t-ZrO2, which does not transform to m-ZrO2 during low
temperature aging, exists due to local Y-Nb ordering in the composition region with
14±15 mol% YNbO4 in the ZrO2-YNbO4 quasibinary system [Lee et al., 1998]. At
4.45 mol% Nb2O5, Nb5+ necessary for the stability of t-ZrO2 is dissipated by the
proper substitution so that Y-Nb dopant ordering into a scheelite-like structure is
achieved and the relaxation of the internal strain inherent in the t-lattice is
accomplished. Beyond 4.6 mol% Nb2O5 , the fraction of m-ZrO2 starts to increase
again, implying that the addition of excess Nb5+ into t-ZrO2 increases the internal
strain more significantly than TZPs doped with a small amount of Nb2O5 [Lee et al.,
2001].
22
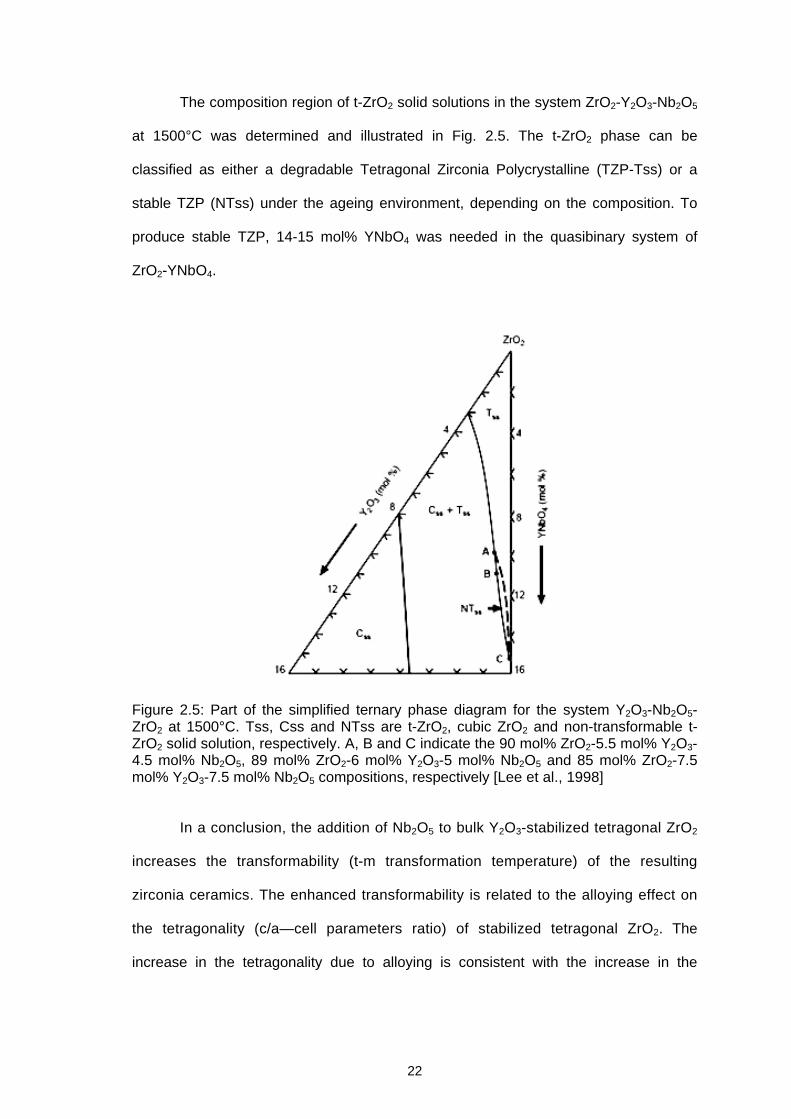
The composition region of t-ZrO2 solid solutions in the system ZrO2-Y2O3-Nb2O5
at 1500°C was determined and illustrated in Fig. 2.5. The t-ZrO2 phase can be
classified as either a degradable Tetragonal Zirconia Polycrystalline (TZP-Tss) or a
stable TZP (NTss) under the ageing environment, depending on the composition. To
produce stable TZP, 14-15 mol% YNbO4 was needed in the quasibinary system of
ZrO2-YNbO4.
Figure 2.5: Part of the simplified ternary phase diagram for the system Y2O3-Nb2O5-ZrO2 at 1500°C. Tss, Css and NTss are t-ZrO2, cubic ZrO2 and non-transformable t-ZrO2 solid solution, respectively. A, B and C indicate the 90 mol% ZrO2-5.5 mol% Y2O3-4.5 mol% Nb2O5, 89 mol% ZrO2-6 mol% Y2O3-5 mol% Nb2O5 and 85 mol% ZrO2-7.5 mol% Y2O3-7.5 mol% Nb2O5 compositions, respectively [Lee et al., 1998] In a conclusion, the addition of Nb2O5 to bulk Y2O3-stabilized tetragonal ZrO2
increases the transformability (t-m transformation temperature) of the resulting
zirconia ceramics. The enhanced transformability is related to the alloying effect on
the tetragonality (c/a—cell parameters ratio) of stabilized tetragonal ZrO2. The
increase in the tetragonality due to alloying is consistent with the increase in the
23
fracture toughness and the increase in the t-m transformation temperature. [Kim, 1990;
Kim and Tien, 1991]
2.4.8 Electronic Structure
The electronic structure of zirconia can be roughly described as a valence band
formed by the filled O 2p orbitals and a conduction band formed by the empty Zr 4d
metal levels [Kralik et al., 1998]. The calculated electronic properties are in good
agreement with the available experimental data, even though they do not describe
properly the band gap and other excited-state properties. However, after including
electron self-energy corrections, the structural and quasiparticle properties of the three
ZrO2 phases reach an improved level of agreement with experiments.
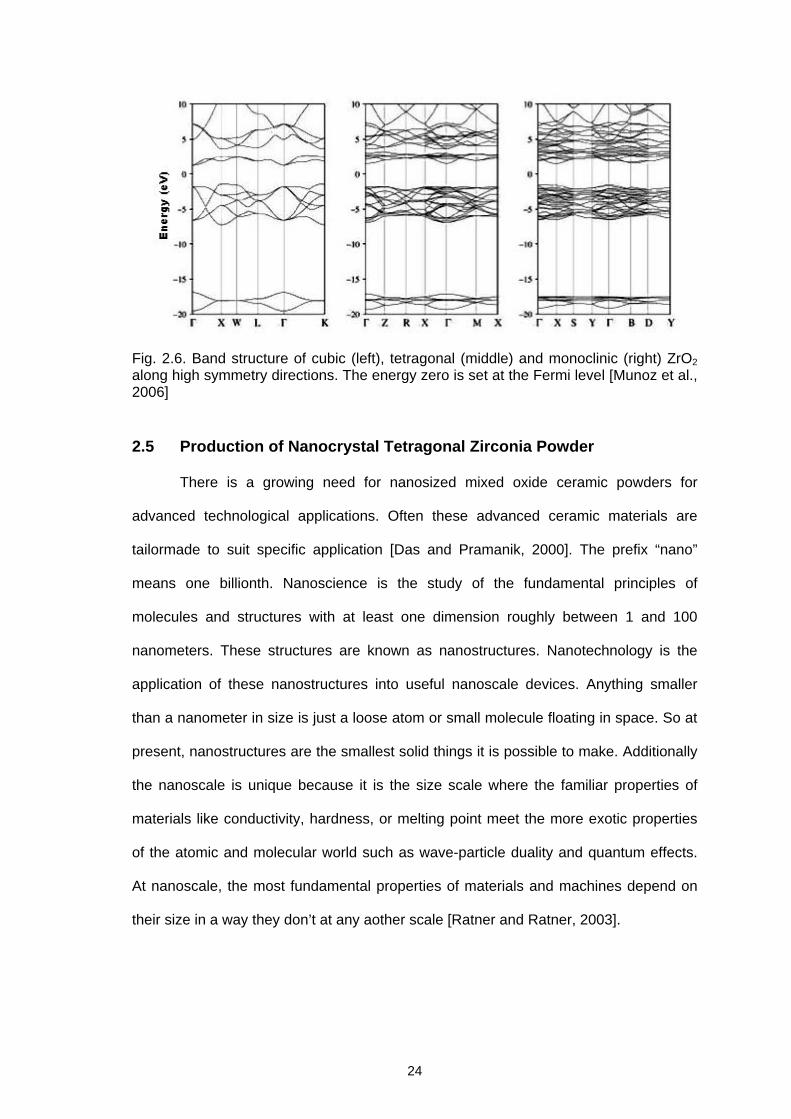
Band structures of the monoclinic, tetragonal and cubic phases are shown in
Fig. 2.6. The valence bands (VBs) of the three phases are very similar. Starting from
the lowest energies, the first contribution arises from the O 2s states and is centered
around ~18 eV below the Fermi level (EF) depending on the phase. The oxygen 2p
band, completely filled by the transfer of Zr 4d electrons, is the occupied structure of
highest energy. The maximum of the VB is located at the reciprocal point X in the cubic
lattice and at Γ in the monoclinic one, while in the tetragonal phase it comprises various
points along the Γ M and Γ Z directions. The calculated VB O 2p width is around 5 eV
for the monoclinic and tetragonal phases, and about 6 eV for c- ZrO2. All phases
present an indirect energy gap [Munoz et al., 2006].
24
Fig. 2.6. Band structure of cubic (left), tetragonal (middle) and monoclinic (right) ZrO2 along high symmetry directions. The energy zero is set at the Fermi level [Munoz et al., 2006]
2.5 Production of Nanocrystal Tetragonal Zirconia Powder
There is a growing need for nanosized mixed oxide ceramic powders for
advanced technological applications. Often these advanced ceramic materials are
tailormade to suit specific application [Das and Pramanik, 2000]. The prefix “nano”
means one billionth. Nanoscience is the study of the fundamental principles of
molecules and structures with at least one dimension roughly between 1 and 100
nanometers. These structures are known as nanostructures. Nanotechnology is the
application of these nanostructures into useful nanoscale devices. Anything smaller
than a nanometer in size is just a loose atom or small molecule floating in space. So at
present, nanostructures are the smallest solid things it is possible to make. Additionally
the nanoscale is unique because it is the size scale where the familiar properties of
materials like conductivity, hardness, or melting point meet the more exotic properties
of the atomic and molecular world such as wave-particle duality and quantum effects.
At nanoscale, the most fundamental properties of materials and machines depend on
their size in a way they don’t at any aother scale [Ratner and Ratner, 2003].