JABATAN PERANGKAAN MALAYSIA DEPARTMENT OF STATISTICS, MALAYSIA
PUTRAJAYA
PERANGKAAN PERKHIDMATAN
SERVICES STATISTICS
BANCI EKONOMI 2011
SEKTOR PERKHIDMATAN
ECONOMIC CENSUS 2011
SERVICES SECTOR
MALAYSIA

KATA PENGANTAR
Laporan ini memuatkan perangkaan bagi Sektor Perkhidmatan yang merangkumi aktiviti
perkhidmatan Perdagangan Edaran; Pengangkutan dan Penyimpanan; Penginapan;
Makanan dan Minuman; Maklumat dan Komunikasi; Perkhidmatan Kewangan;
Perkhidmatan Perniagaan; Pendidikan; Kesihatan dan Kerja Sosial; Kesenian, Hiburan dan
Rekreasi serta Perkhidmatan Lain. Maklumat yang disediakan adalah berdasarkan Banci
Ekonomi yang dijalankan pada tahun 2011 bagi tahun rujukan 2010.
Data yang berkaitan dengan nilai pendapatan, perbelanjaan, bilangan pekerja dan gaji &
upah diterbitkan dalam laporan ini. Data tersebut digunakan bagi tujuan membuat
perancangan pembangunan dan penggubalan dasar serta bagi pengunjuran dan analisis
ekonomi oleh kerajaan dan penyelidik.
Laporan ini mengandungi tiga bahagian. Penemuan daripada hasil bancian dibentangkan
di bahagian pertama laporan ini. Aspek teknikal seperti objektif, skop dan liputan serta
konsep dan definisi yang digunakan dalam banci ini dimuatkan di bahagian kedua laporan.
Jadual perangkaan terperinci berdasarkan subsektor perkhidmatan dipaparkan di bahagian
ketiga bagi membolehkan pengguna membuat analisis.
Saya ingin merakamkan setinggi-tinggi penghargaan dan terima kasih kepada semua
pihak yang terlibat dalam menyumbang kepada laporan ini. Sebarang ulasan dan
cadangan daripada pengguna untuk menambahbaik laporan ini pada masa hadapan
amatlah dihargai.
DR. HAJI ABDUL RAHMAN BIN HASAN
Ketua Perangkawan
Malaysia
November 2012
i

PREFACE
This report presents statistics on the Services Sector which encompasses broadly
Distributive Trade; Transport and Storage; Accommodation; Food and Beverages;
Information and Communication; Financial Services; Business Services; Education; Health
and Social Work; Arts, Entertainment and Recreation as well as Other Services. The
information provided here is gathered through the Economic Census conducted in 2011
for reference year 2010.
Data pertaining to revenue, expenditure, number of persons engaged, salaries & wages
and value added are published in this report. These data are used for planning and policy
formulation as well as for economic projection and analysis by the government and
researchers.
This report consists of three parts. The summary findings obtained from the census are
highlighted in the first part of the report. The second part focuses on the technical aspects
including the objectives, scope and coverage as well as relevant concepts and definitions
used in the census. Detailed statistical tables by broad services sub-sectors are included
in the third part of the report to facilitate analysis by users.
I would like to express my appreciation to all parties concerned who have contributed
towards this report. Comments and suggestions from users for improvement in future
reports are greatly appreciated.
DR. HAJI ABDUL RAHMAN BIN HASAN
Chief Statistician
Malaysia
November 2012
ii
KANDUNGAN
CONTENT
Muka surat
Page
Kata pengantar i
Preface
Ringkasan penemuan 3
Summary findings
Nota teknikal 19
Technical notes
Jadual Senarai jadual
Table List of tables
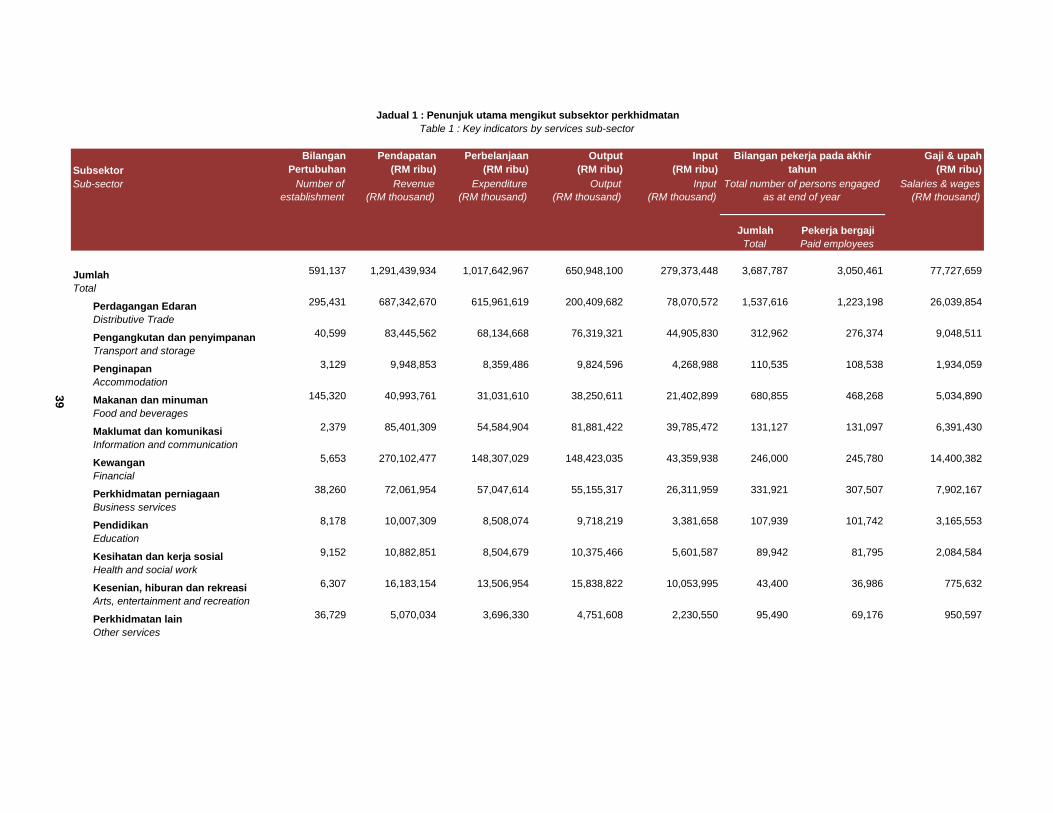
1 Jadual 1 : Penunjuk utama mengikut subsektor perkhidmatan 39
Table 1 : Key indicators by services sub-sector
2 Jadual 2 : Penunjuk utama subsektor perkhidmatan mengikut negeri 40
Table 2 : Key indicators of services sub-sector by state
3 Jadual 3
Table 3
3.1 Bilangan pertubuhan mengikut subsektor perkhidmatan dan taraf sah 56
Number of establishments by services sub-sector and legal organisation
3.2 Pendapatan mengikut subsektor perkhidmatan dan taraf sah 57
Revenue by services sub-sector and legal organisation
3.3 Bilangan pekerja mengikut subsektor perkhidmatan dan taraf sah 58
Total number of person engaged by services sub-sector and
legal organisation
4 Jadual 4
Table 4
4.1 Bilangan pertubuhan mengikut subsektor perkhidmatan dan 59
saiz pendapatan
Number of establishments by services sub-sector and revenue size
Banci Ekonomi 2011 (Sektor Perkhidmatan) /
Economic Census 2011 (Services Sector) | iii
Muka surat
Page
4.2 Pendapatan mengikut subsektor perkhidmatan dan 59
saiz pendapatan
Revenue by services sub-sector and revenue size
4.3 Bilangan pekerja mengikut subsektor perkhidmatan dan 60
saiz pendapatan
Total number of persons engaged by services sub-sector and revenue size
5 Jadual 5
Table 5
5.1 Bilangan pertubuhan mengikut subsektor perkhidmatan 61
dan saiz pekerja
Number of establishments by services sub-sector and employment size
5.2 Pendapatan mengikut subsektor perkhidmatan dan saiz pekerja 61
Revenue by services sub-sector and employment size
5.3 Bilangan pekerja mengikut subsektor perkhidmatan dan saiz pekerja 62
Total number of persons engaged by services sub-sector and
employment size
6 Jadual 6 : Purata dan nisbah terpilih mengikut subsektor 63
Table 6 : Selected averages and ratio by sub-sectors
Lampiran
Appendix
Piawaian Klasifikasi Industri Malaysia (MSIC) 2008 Ver. 1.0 67
Malaysia Standard Industrial Classification (MSIC) 2008 Ver. 1.0
Banci Ekonomi 2011 (Sektor Perkhidmatan) /
Economic Census 2011 (Services Sector) | iv
RINGKASAN PENEMUAN SUMMARY FINDINGS
SEKTOR PERKHIDMATAN SERVICES SECTOR

Banci Ekonomi 2011 (Sektor Perkhidmatan) | 3
SEKTOR PERKHIDMATAN
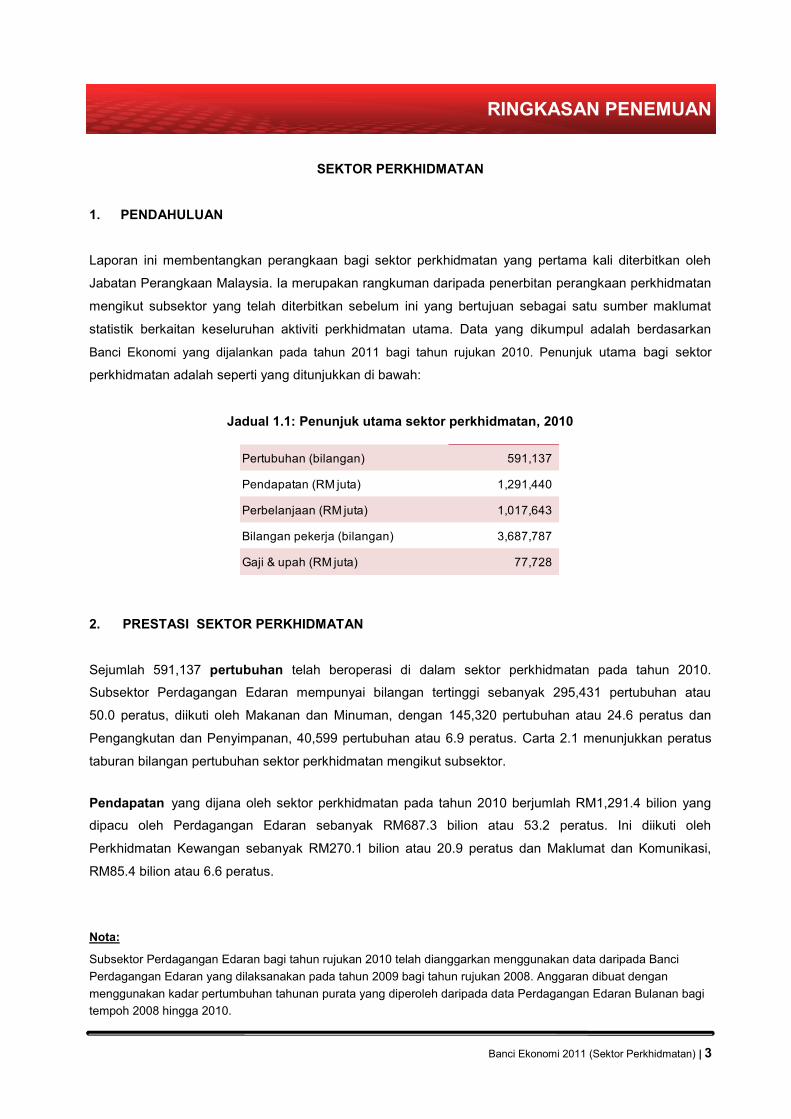
1. PENDAHULUAN
Laporan ini membentangkan perangkaan bagi sektor perkhidmatan yang pertama kali diterbitkan oleh
Jabatan Perangkaan Malaysia. Ia merupakan rangkuman daripada penerbitan perangkaan perkhidmatan
mengikut subsektor yang telah diterbitkan sebelum ini yang bertujuan sebagai satu sumber maklumat
statistik berkaitan keseluruhan aktiviti perkhidmatan utama. Data yang dikumpul adalah berdasarkan
Banci Ekonomi yang dijalankan pada tahun 2011 bagi tahun rujukan 2010. Penunjuk utama bagi sektor
perkhidmatan adalah seperti yang ditunjukkan di bawah:
Jadual 1.1: Penunjuk utama sektor perkhidmatan, 2010
2. PRESTASI SEKTOR PERKHIDMATAN
Sejumlah 591,137 pertubuhan telah beroperasi di dalam sektor perkhidmatan pada tahun 2010.
Subsektor Perdagangan Edaran mempunyai bilangan tertinggi sebanyak 295,431 pertubuhan atau
50.0 peratus, diikuti oleh Makanan dan Minuman, dengan 145,320 pertubuhan atau 24.6 peratus dan
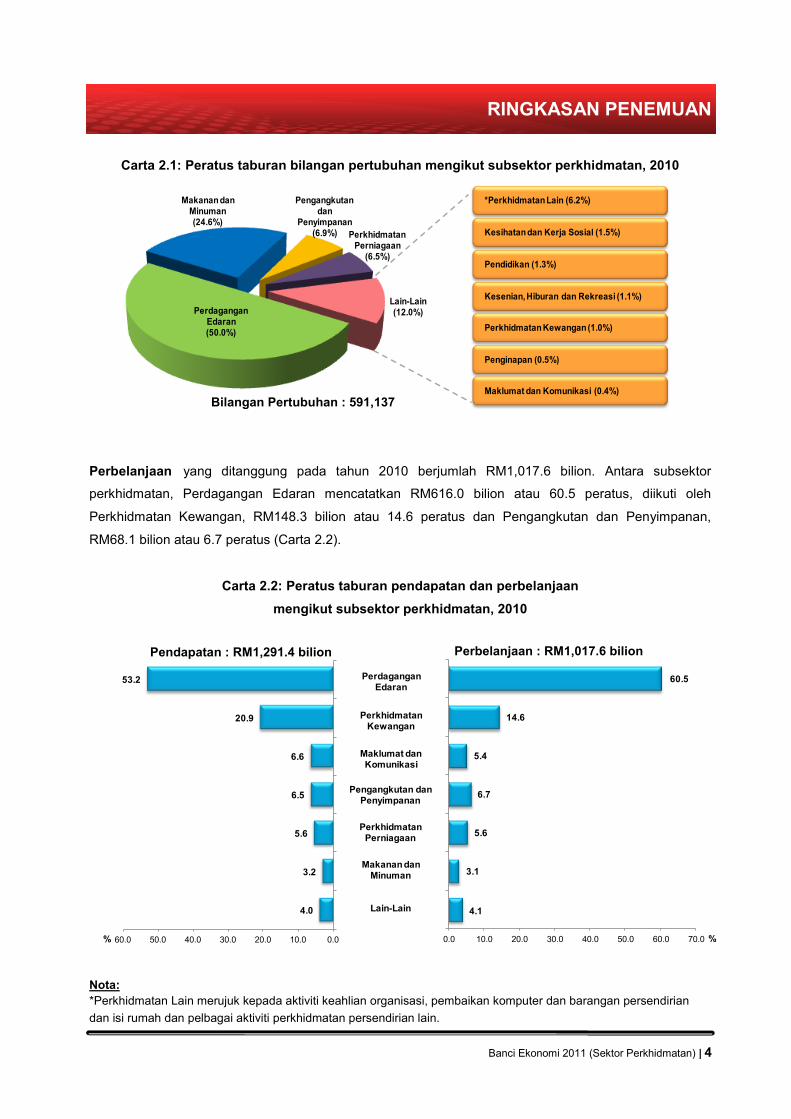
Pengangkutan dan Penyimpanan, 40,599 pertubuhan atau 6.9 peratus. Carta 2.1 menunjukkan peratus
taburan bilangan pertubuhan sektor perkhidmatan mengikut subsektor.
Pendapatan yang dijana oleh sektor perkhidmatan pada tahun 2010 berjumlah RM1,291.4 bilion yang
dipacu oleh Perdagangan Edaran sebanyak RM687.3 bilion atau 53.2 peratus. Ini diikuti oleh
Perkhidmatan Kewangan sebanyak RM270.1 bilion atau 20.9 peratus dan Maklumat dan Komunikasi,
RM85.4 bilion atau 6.6 peratus.
RINGKASAN PENEMUAN
Subsektor Perdagangan Edaran bagi tahun rujukan 2010 telah dianggarkan menggunakan data daripada Banci
Perdagangan Edaran yang dilaksanakan pada tahun 2009 bagi tahun rujukan 2008. Anggaran dibuat dengan
menggunakan kadar pertumbuhan tahunan purata yang diperoleh daripada data Perdagangan Edaran Bulanan bagi
tempoh 2008 hingga 2010.
Nota:
2010
Pertubuhan (bilangan) 591,137
Pendapatan (RM juta) 1,291,440
Perbelanjaan (RM juta) 1,017,643
Bilangan pekerja (bilangan) 3,687,787
Gaji & upah (RM juta) 77,728
4.0
3.2
5.6
6.5
6.6
20.9
53.2
0.010.020.030.040.050.060.0
Other services
Food and beverages
Business services
Transport and storage
Information and communication
Financial servicesPerkhidmatan Kewangan
Maklumat dan Komunikasi
4.1
3.1
5.6
6.7
5.4
14.6
60.5
0.0 10.0 20.0 30.0 40.0 50.0 60.0 70.0
Per…
Pen…
Pen…
Kes…
Kes…
Mak…
Per…
Perdagangan Edaran
Pengangkutan dan Penyimpanan
Perkhidmatan Perniagaan
Makanan dan Minuman
Lain-Lain
Carta 2.1: Peratus taburan bilangan pertubuhan mengikut subsektor perkhidmatan, 2010
Perbelanjaan yang ditanggung pada tahun 2010 berjumlah RM1,017.6 bilion. Antara subsektor
perkhidmatan, Perdagangan Edaran mencatatkan RM616.0 bilion atau 60.5 peratus, diikuti oleh
Perkhidmatan Kewangan, RM148.3 bilion atau 14.6 peratus dan Pengangkutan dan Penyimpanan,
RM68.1 bilion atau 6.7 peratus (Carta 2.2).
Carta 2.2: Peratus taburan pendapatan dan perbelanjaan
mengikut subsektor perkhidmatan, 2010
Banci Ekonomi 2011 (Sektor Perkhidmatan) | 4
Perdagangan Edaran(50.0%)
Pengangkutan dan
Penyimpanan(6.9%) Perkhidmatan
Perniagaan(6.5%)
Lain-Lain(12.0%)
Makanan dan Minuman(24.6%)
*Perkhidmatan Lain (6.2%)
Kesihatan dan Kerja Sosial (1.5%)
Pendidikan (1.3%)
Kesenian, Hiburan dan Rekreasi (1.1%)
Perkhidmatan Kewangan (1.0%)
Penginapan (0.5%)
Maklumat dan Komunikasi (0.4%)
Bilangan Pertubuhan : 591,137
*Perkhidmatan Lain merujuk kepada aktiviti keahlian organisasi, pembaikan komputer dan barangan persendirian
dan isi rumah dan pelbagai aktiviti perkhidmatan persendirian lain.
Nota:
Pendapatan : RM1,291.4 bilion Perbelanjaan : RM1,017.6 bilion
% %
RINGKASAN PENEMUAN
0.0
2.0
4.0
6.0
8.0
10.0
12.0
14.0
16.0
18.0
20.0
Se
lan
go
r
W.P
. K
ua
la L
um
pu
r
Jo
ho
r
Pe
rak
Sa
raw
ak
Pu
lau
Pin
an
g
Ke
da
h
Sa
ba
h
Pa
ha
ng
Ke
lan
tan
Ne
ge
ri S
em
bila
n
Te
ren
gg
an
u
*Ne
ge
ri-n
eg
eri la
in
19.7
13.2
10.7
8.4
7.2 6.96.5 6.3
4.7 4.53.9
3.4
4.6
%
Bilangan pekerja di dalam sektor perkhidmatan adalah seramai 3,687,787 orang, di mana 82.7 peratus
atau 3,050,461 orang adalah merupakan pekerja bergaji. Subsektor Perdagangan Edaran mencatatkan
bilangan pekerja tertinggi seramai 1,537,616 orang atau 41.7 peratus, manakala subsektor Kesenian,
Hiburan dan Rekreasi mempunyai bilangan terendah sebanyak 43,400 orang atau 1.2 peratus.
Gaji & upah yang telah dibayar dalam sektor perkhidmatan pada tahun 2010 adalah sebanyak
RM77.7 bilion, di mana subsektor Perdagangan Edaran merupakan pembayar tertinggi dengan nilai
sebanyak RM26.0 bilion atau 33.5 peratus. Ini diikuti oleh Perkhidmatan Kewangan dan Pengangkutan
dan Penyimpanan dengan masing-masing mencatatkan nilai sebanyak RM14.4 bilion (18.5 peratus) dan
RM9.0 bilion (11.6 peratus).
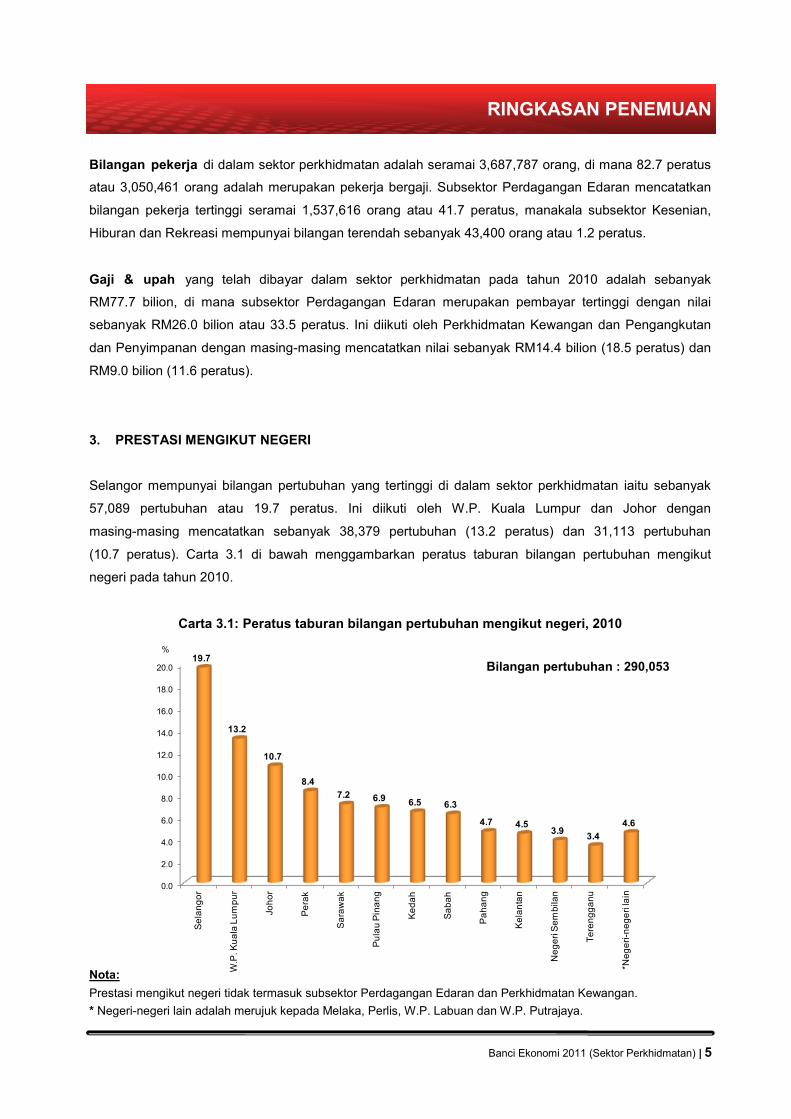
3. PRESTASI MENGIKUT NEGERI
Selangor mempunyai bilangan pertubuhan yang tertinggi di dalam sektor perkhidmatan iaitu sebanyak
57,089 pertubuhan atau 19.7 peratus. Ini diikuti oleh W.P. Kuala Lumpur dan Johor dengan
masing-masing mencatatkan sebanyak 38,379 pertubuhan (13.2 peratus) dan 31,113 pertubuhan
(10.7 peratus). Carta 3.1 di bawah menggambarkan peratus taburan bilangan pertubuhan mengikut
negeri pada tahun 2010.
Carta 3.1: Peratus taburan bilangan pertubuhan mengikut negeri, 2010
Banci Ekonomi 2011 (Sektor Perkhidmatan) | 5
Bilangan pertubuhan : 290,053
Prestasi mengikut negeri tidak termasuk subsektor Perdagangan Edaran dan Perkhidmatan Kewangan.
* Negeri-negeri lain adalah merujuk kepada Melaka, Perlis, W.P. Labuan dan W.P. Putrajaya.
Nota:
RINGKASAN PENEMUAN
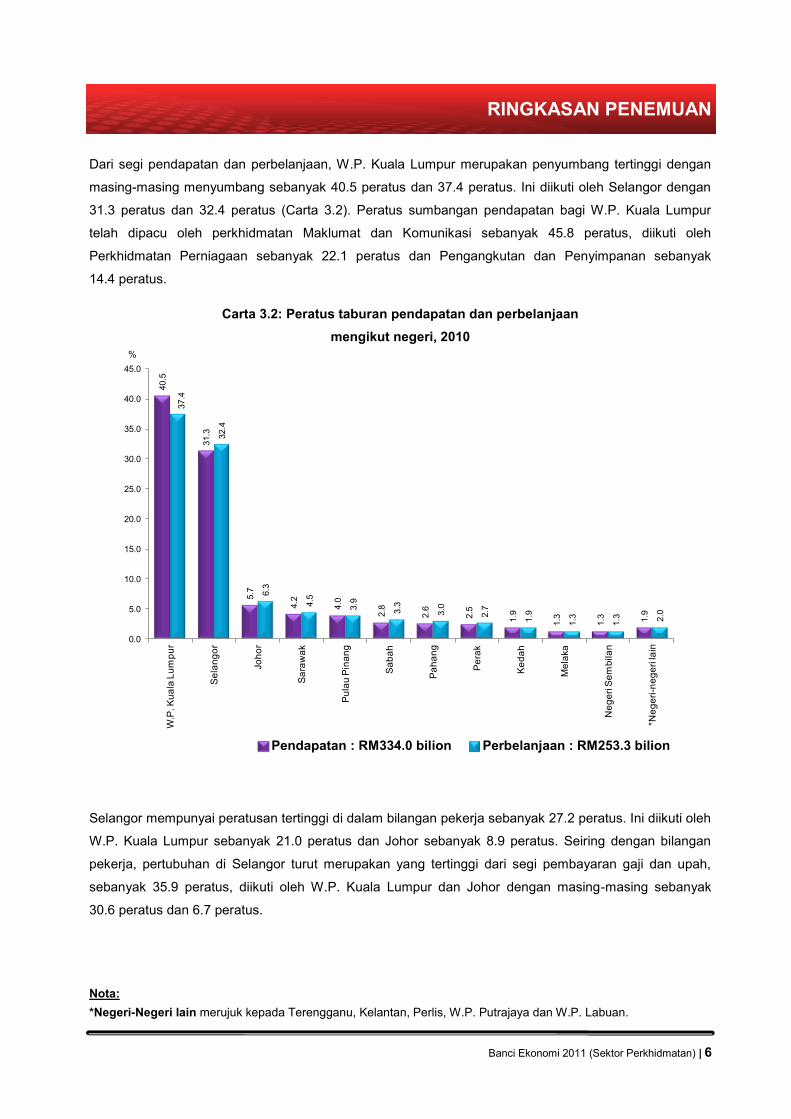
Dari segi pendapatan dan perbelanjaan, W.P. Kuala Lumpur merupakan penyumbang tertinggi dengan
masing-masing menyumbang sebanyak 40.5 peratus dan 37.4 peratus. Ini diikuti oleh Selangor dengan
31.3 peratus dan 32.4 peratus (Carta 3.2). Peratus sumbangan pendapatan bagi W.P. Kuala Lumpur
telah dipacu oleh perkhidmatan Maklumat dan Komunikasi sebanyak 45.8 peratus, diikuti oleh
Perkhidmatan Perniagaan sebanyak 22.1 peratus dan Pengangkutan dan Penyimpanan sebanyak
14.4 peratus.
Carta 3.2: Peratus taburan pendapatan dan perbelanjaan
mengikut negeri, 2010
Selangor mempunyai peratusan tertinggi di dalam bilangan pekerja sebanyak 27.2 peratus. Ini diikuti oleh
W.P. Kuala Lumpur sebanyak 21.0 peratus dan Johor sebanyak 8.9 peratus. Seiring dengan bilangan
pekerja, pertubuhan di Selangor turut merupakan yang tertinggi dari segi pembayaran gaji dan upah,
sebanyak 35.9 peratus, diikuti oleh W.P. Kuala Lumpur dan Johor dengan masing-masing sebanyak
30.6 peratus dan 6.7 peratus.
*Negeri-Negeri lain merujuk kepada Terengganu, Kelantan, Perlis, W.P. Putrajaya dan W.P. Labuan.
Nota:
Banci Ekonomi 2011 (Sektor Perkhidmatan) | 6
40.5
31.3
5.7
4.2
4.0
2.8
2.6
2.5
1.9
1.3
1.3 1.9
37.4
32.4
6.3
4.5
3.9
3.3
3.0
2.7
1.9
1.3
1.3 2.0
0.0
5.0
10.0
15.0
20.0
25.0
30.0
35.0
40.0
45.0
W.P
. K
ua
la L
um
pu
r
Se
lan
go
r
Jo
ho
r
Sa
raw
ak
Pu
lau
Pin
an
g
Sa
ba
h
Pa
ha
ng
Pe
rak
Ke
da
h
Me
laka
Ne
ge
ri S
em
bila
n
*Ne
ge
ri-n
eg
eri la
in
Series1 Series2Perbelanjaan : RM253.3 bilion Pendapatan : RM334.0 bilion
%
RINGKASAN PENEMUAN

4. PRESTASI MENGIKUT NISBAH
Nisbah Input-Output bagi sektor perkhidmatan adalah sebanyak 0.4. Perkhidmatan Kewangan dan
Pendidikan adalah yang terendah sebanyak 0.3. Sementara itu, subsektor Pengangkutan dan
Penyimpanan; Makanan dan Minuman; dan Kesenian, Hiburan dan Rekreasi mempunyai nisbah input-
output tertinggi iaitu masing-masing sebanyak 0.6 seperti yang ditunjukkan di carta 4.1.
Carta 4.1: Nisbah Input-Output bagi subsektor perkhidmatan , 2010
Nisbah Pendapatan-Perbelanjaan bagi sektor perkhidmatan adalah sebanyak 1.3 pada tahun 2010.
Perkhidmatan Kewangan mempunyai nisbah pendapatan-perbelanjaan tertinggi antara keseluruhan
sektor perkhidmatan iaitu 1.8, diikuti oleh Maklumat dan Komunikasi dan Perkhidmatan Lain dengan
masing-masing sebanyak 1.6 dan 1.4. Perdagangan Edaran mempamerkan nisbah pendapatan-
perbelanjaan yang terendah sebanyak 1.1 (Carta 4.2).
Carta 4.2: Nisbah pendapatan-perbelanjaan bagi subsektor perkhidmatan, 2010
Banci Ekonomi 2011 (Sektor Perkhidmatan) | 7
0.3 0.3
0.4 0.4
0.5 0.5 0.5 0.5
0.6 0.6 0.6
-
0.1
0.2
0.3
0.4
0.5
0.6
0.7
Pe
rkh
idm
ata
n
Ke
wa
ng
an
Pe
nd
idik
an
Pe
rda
ga
ng
an
Ed
ara
n
Pe
ng
ina
pa
n
Pe
rkh
idm
ata
n L
ain
Pe
rkh
idm
ata
n
Pe
rnia
ga
an
Ma
klu
ma
t da
n
Ko
mu
nik
asi
Ke
sih
ata
n d
an
Ke
rja
S
osia
l
Ma
ka
na
n d
an
Min
um
an
Pe
ng
an
gku
tan
da
n
Pe
nyim
pa
na
n
Ke
se
nia
n, H
ibu
ran
da
n
Re
kre
asi
1.8
1.6
1.41.3 1.3 1.3
1.2 1.2 1.2 1.21.1
0.0
0.2
0.4
0.6
0.8
1.0
1.2
1.4
1.6
1.8
2.0
Perk
hid
mata
n
Kew
ang
an
Makl
um
at d
an
Ko
munik
asi
Perk
hid
mata
n L
ain
Maka
nan d
an
Min
um
an
Kesih
ata
n d
an K
erja
So
sia
l
Perk
hid
mata
n
Pern
iag
aan
Peng
ang
kuta
n d
an
Penyim
panan
Kesenia
n, H
ibura
n d
an
Rekr
easi
Peng
inap
an
Pend
idik
an
Perd
ag
ang
an E
dara
n
RINGKASAN PENEMUAN

Purata Gaji Tahunan per Pekerja adalah sebanyak RM25,481 pada tahun 2010. Antara subsektor
perkhidmatan, pekerja yang bekerja dalam Perkhidmatan Kewangan adalah yang tertinggi menerima
bayaran purata gaji tahunan sebanyak RM58,591, manakala purata gaji tahunan per pekerja terendah
telah direkodkan oleh perkhidmatan Makanan dan Minuman sebanyak RM10,752 (Jadual 4.1).
Jadual 4.1: Purata gaji tahunan per pekerja bagi subsektor perkhidmatan, 2010
5. PRESTASI MENGIKUT SAIZ
5.1 Saiz Pekerja
Pertubuhan yang mempunyai kurang daripada 5 orang pekerja merupakan bilangan yang tertinggi di
dalam sektor perkhidmatan sebanyak 67.9 peratus pada tahun 2010. Sementara itu, pertubuhan yang
mempunyai lebih daripada 100 orang pekerja dan ke atas mempunyai sumbangan yang terendah dari
segi bilangan pertubuhan iaitu hanya 0.4 peratus. Walau bagaimanapun, kategori tersebut merupakan
penyumbang terbesar dari segi pendapatan dan bilangan pekerja dengan masing-masing sebanyak 53.8
peratus dan 32.4 peratus (Jadual 5.1).
Banci Ekonomi 2011 (Sektor Perkhidmatan) | 8
Subsektor Pekerja bergajiGaji & upah dibayar
(RM ribu)
Purata gaji setahun
diterima setiap pekerja
(RM)
Perkhidmatan Kewangan 245,780 14,400,382 58,591
Maklumat dan Komunikasi 131,097 6,391,430 48,753
Pengangkutan dan Penyimpanan 276,374 9,048,511 32,740
Pendidikan 101,742 3,165,553 31,114
Perkhidmatan Perniagaan 307,507 7,902,167 25,698
Kesihatan dan Kerja Sosial 81,795 2,084,584 25,485
Perdagangan Edaran 1,223,198 26,039,854 21,288
Kesenian, Hiburan dan Rekreasi 36,986 775,632 20,971
Penginapan 108,538 1,934,059 17,819
Perkhidmatan Lain 69,176 950,597 13,742
Makanan dan Minuman 468,268 5,034,890 10,752
Jumlah 3,050,461 77,727,659 25,481
RINGKASAN PENEMUAN

Jadual 5.1: Bilangan pertubuhan, pendapatan dan bilangan pekerja
mengikut saiz pekerja, 2010
5.2 Saiz Pendapatan
Pertubuhan yang mempunyai pendapatan kurang daripada RM200 ribu membentuk majoriti dari segi
sumbangan kepada bilangan pertubuhan di dalam sektor perkhidmatan dengan 65.1 peratus pada tahun
2010. Walau bagaimanapun, sumbangan mereka terhadap pendapatan adalah yang terendah sebanyak
2.5 peratus. Sebagai tambahan, pertubuhan yang mempunyai saiz pendapatan lebih daripada RM5 juta
ke atas mencatatkan sumbangan tertinggi sebanyak 85.6 peratus terhadap jumlah pendapatan
(Jadual 5.2).
Jadual 5.2: Bilangan pertubuhan, pendapatan dan bilangan pekerja
mengikut saiz pendapatan, 2010
Banci Ekonomi 2011 (Sektor Perkhidmatan) | 9
Saiz Pendapatan(RM ribu)
Pertubuhan(Bilangan)
Pendapatan (RM ribu)
Pekerja(Bilangan)
< 200 192,448 14,852,653 486,120
200 - < 1,000 78,731 33,679,709 527,869
1,000 - 5,000 18,434 38,362,342 324,884
> 5,000 6,093 517,202,560 811,298
Saiz PekerjaPertubuhan (Bilangan)
Pendapatan(RM ribu)
Pekerja(Bilangan)
< 5 orang 200,929 61,366,047 436,495
5 - 19 orang 83,576 87,541,658 658,932
20 - 50 orang 7,667 43,293,976 226,598
51 - 99 orang 2,220 86,874,611 132,504
> 100 orang 1,314 325,020,970 695,642
RINGKASAN PENEMUAN

SERVICES SECTOR
1. INTRODUCTION
This report presents statistics on the services sector which is published for the first time by the
Department of Statistics, Malaysia. It is a compilation of services statistics for each sub-sector which had
been published before for the purpose of providing a source of statistical information on overall service
activities. Data compiled are collected based on the Economic Census conducted in 2011 for reference
year 2010. Key indicators of the services sector are shown below:
Table 1.1: Key indicators of the services sector, 2010
2. PERFORMANCE OF THE SERVICES SECTOR
A total of 591,137 establishments were operating in the services sector in 2010. The Distributive Trade
sub-sector had the highest number of establishments, with 295,431 establishments or 50.0 per cent,
followed by Food and Beverages, 145,320 establishments or 24.6 per cent and Transport and Storage,
40,599 establishments or 6.9 per cent. Chart 2.1 shows the percentage distribution of number of
establishments by services sub-sectors.
Revenue generated by the services sector in 2010 was RM1,291.4 billion driven by the Distributive Trade
with RM687.3 billion or 53.2 per cent. This was followed by Financial Services with RM270.1 billion or
20.9 per cent and Information and Communication, RM85.4 billion or 6.6 per cent.
Economic Census 2011 (Services Sector) | 10
SUMMARY FINDINGS
Distributive Trade sub-sectors for reference year 2010 were estimated using data from the Census of Distributive
Trade undertaken in 2009 for reference year 2008. The estimation was done by using compounding annual growth
rate from Monthly Distributive Trade data for year 2008 to 2010.
Notation:
2010
Establishments (number) 591,137
Revenue (RM million) 1,291,440
Expenditure (RM million) 1,017,643
Total Employment (number) 3,687,787
Salaries & wages (RM million) 77,728

4.0
3.2
5.6
6.5
6.6
20.9
53.2
0.010.020.030.040.050.060.0
Other services
Food and beverages
Business services
Transport and storage
Information and communication
Financial servicesFinancial Services
4.1
3.1
5.6
6.7
5.4
14.6
60.5
0.0 10.0 20.0 30.0 40.0 50.0 60.0 70.0
Per…
Pen…
Pen…
Kes…
Kes…
Mak…
Per…
Distributive Trade
Information and Communication
Transport and Storage
Business Services
Food and Beverages
Others
Chart 2.1: Percentage distribution of number of establishments by services sub-sectors, 2010
Expenditure incurred in 2010 was RM1,017.6 billion. Among the services sub-sectors, Distributive Trade
registered RM616.0 billion or 60.5 per cent, followed by Financial Services, RM148.3 billion or
14.6 per cent and Transport and Storage, RM68.1 billion or 6.7 per cent (Chart 2.2).
Chart 2.2: Percentage distribution of revenue and expenditure
by services sub-sectors, 2010
Economic Census 2011 (Services Sector) | 11
Revenue : RM1,291.4 billion Expenditure : RM1,017.6 billion
Distributive Trade
(50.0%)
Transport and Storage(6.9%) Business
Services(6.5%)
Others (12.0%)
Food and Beverages
(24.6%)
*Other Services (6.2%)
Health and Social Work (1.5%)
Education (1.3%)
Arts, Entertainment and Recreation (1.1%)
Financial Services (1.0%)
Accommodation (0.5%)
Information and Communication (0.4%)Number of establishments : 591,137
*Other Services refer to activities of membership organisations, repair of computer and personal and household
goods and a variety of other personal service activities.
Notation:
% %
SUMMARY FINDINGS

0.0
2.0
4.0
6.0
8.0
10.0
12.0
14.0
16.0
18.0
20.0
Se
lan
go
r
W.P
. Ku
ala
Lu
mp
ur
Jo
ho
r
Pe
rak
Sa
raw
ak
Pu
lau
Pin
an
g
Ke
da
h
Sa
ba
h
Pa
ha
ng
Ke
lan
tan
Ne
ge
ri S
em
bila
n
Te
ren
gg
an
u
*Oth
er sta
tes
19.7
13.2
10.7
8.4
7.2 6.96.5 6.3
4.7 4.53.9
3.4
4.6
%
Total number of persons engaged in the services sector was 3,687,787 persons, of which 82.7 per cent
or 3,050,461 persons were paid employees. Distributive Trade sub-sector employed the highest with
1,537,616 persons or 41.7 per cent, while the Arts, Entertainment and Recreation sub-sector employed
the lowest, with 43,400 persons or 1.2 per cent.
Salaries & wages disbursed in the services sector was RM77.7 billion in 2010, of which Distributive
Trade sub-sector paid the most with RM26.0 billion or 33.5 per cent. This was followed by Financial
Services and Transport and Storage which registered RM14.4 billion (18.5 per cent) and RM9.0 billion
(11.6 per cent) respectively.
3. PERFORMANCE BY STATE
Selangor had the highest number of establishments operating in the services sector, with 57,089
establishments or 19.7 per cent. This was followed by W.P. Kuala Lumpur and Johor which accounted for
38,379 establishments (13.2 per cent) and 31,113 establishments (10.7 per cent) respectively. Chart 3.1
illustrates the percentage distribution of number of establishments by state in 2010.
Chart 3.1: Percentage distribution of number of establishments by state, 2010
Economic Census 2011 (Services Sector) | 12
Performance by state were excluding Distributive Trade and Financial Services sub-sector.
*Other states refer to Melaka, Perlis, W.P. Labuan and W.P. Putrajaya.
Notation:
Number of establishments : 290,053
SUMMARY FINDINGS
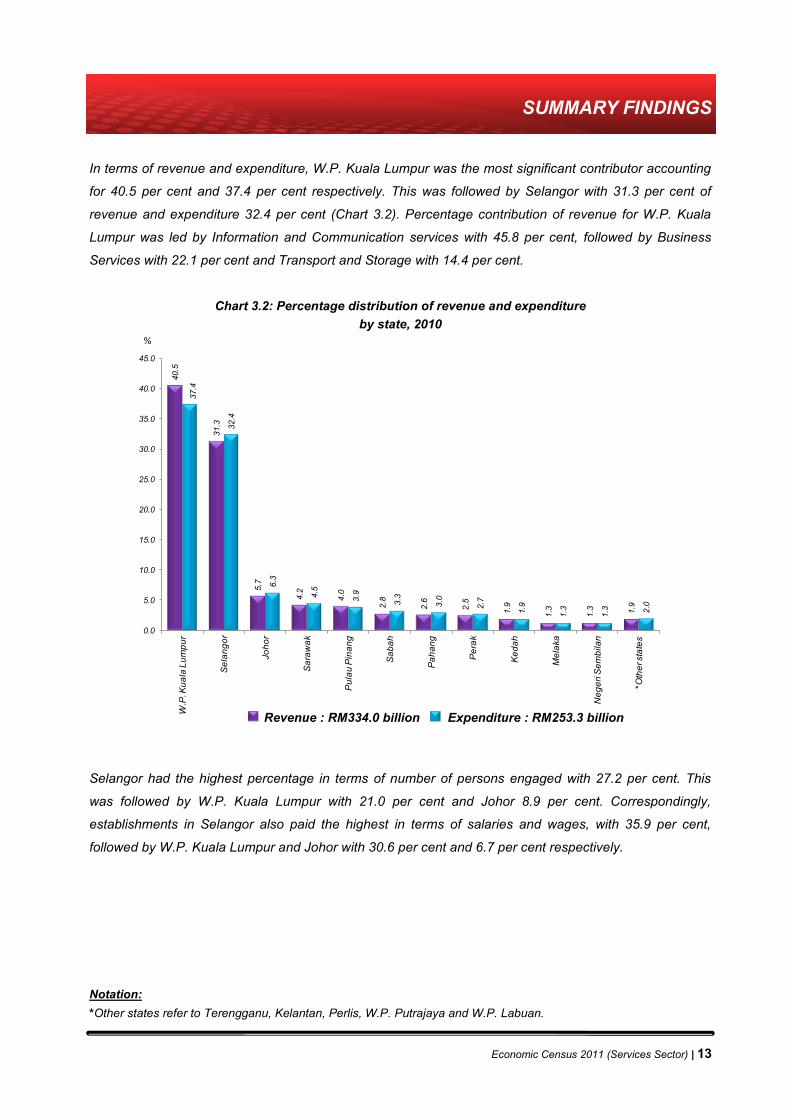
In terms of revenue and expenditure, W.P. Kuala Lumpur was the most significant contributor accounting
for 40.5 per cent and 37.4 per cent respectively. This was followed by Selangor with 31.3 per cent of
revenue and expenditure 32.4 per cent (Chart 3.2). Percentage contribution of revenue for W.P. Kuala
Lumpur was led by Information and Communication services with 45.8 per cent, followed by Business
Services with 22.1 per cent and Transport and Storage with 14.4 per cent.
Chart 3.2: Percentage distribution of revenue and expenditure
by state, 2010
Selangor had the highest percentage in terms of number of persons engaged with 27.2 per cent. This
was followed by W.P. Kuala Lumpur with 21.0 per cent and Johor 8.9 per cent. Correspondingly,
establishments in Selangor also paid the highest in terms of salaries and wages, with 35.9 per cent,
followed by W.P. Kuala Lumpur and Johor with 30.6 per cent and 6.7 per cent respectively.
Economic Census 2011 (Services Sector) | 13
*Other states refer to Terengganu, Kelantan, Perlis, W.P. Putrajaya and W.P. Labuan.
Notation:
40.5
31.3
5.7
4.2
4.0
2.8
2.6
2.5
1.9
1.3
1.3 1.9
37.4
32.4
6.3
4.5
3.9
3.3
3.0
2.7
1.9
1.3
1.3 2.0
0.0
5.0
10.0
15.0
20.0
25.0
30.0
35.0
40.0
45.0
W.P
. Ku
ala
Lu
mp
ur
Se
lan
go
r
Jo
ho
r
Sa
raw
ak
Pu
lau
Pin
an
g
Sa
ba
h
Pa
ha
ng
Pe
rak
Ke
da
h
Me
laka
Ne
ge
ri S
em
bila
n
*Oth
er sta
tes
Series1 Series2Expenditure : RM253.3 billion Revenue : RM334.0 billion
%
SUMMARY FINDINGS

4. KEY PERFORMANCE RATIOS
Input-Output ratio of the services sector was 0.4. Financial Services and Education sub-sectors were the
lowest with 0.3. Meanwhile, Transport and Storage, Food and Beverages; and Arts, Entertainment and
Recreation sub-sectors had the highest input-output ratio with 0.6 each as shown in chart 4.1.
Chart 4.1: Input-Output ratios of services sub-sectors, 2010
Revenue-Expenditure ratio of the services sector was 1.3 in 2010. Among the services sector, Financial
Services had the highest revenue-expenditure ratio with 1.8, followed by Information and Communication
and Other Services with 1.6 and 1.4 respectively. Distributive Trade had the lowest revenue-expenditure
ratio with 1.1 (Chart 4.2).
Chart 4.2: Revenue-Expenditure ratios of services sub-sectors, 2010
Economic Census 2011 (Services Sector) | 14
0.3 0.3
0.4 0.4
0.5 0.5 0.5 0.5
0.6 0.6 0.6
-
0.1
0.2
0.3
0.4
0.5
0.6
0.7
Fin
an
cia
l Se
rvic
es
Ed
uca
tio
n
Dis
trib
utive
Tra
de
Acco
mm
od
atio
n
Oth
er S
erv
ice
s
Bu
sin
ess S
erv
ice
s
Info
rma
tio
n a
nd
C
om
mu
nic
atio
n
He
alth
an
d S
ocia
l wo
rk
Fo
od
an
d B
eve
rag
es
Tra
nsp
ort
an
d S
tora
ge
Art
s, E
nte
rta
inm
en
t an
d
Re
cre
atio
n
1.8
1.6
1.41.3 1.3 1.3
1.2 1.2 1.2 1.21.1
0.0
0.2
0.4
0.6
0.8
1.0
1.2
1.4
1.6
1.8
2.0
Fin
ancia
l Serv
ices
Info
rmation a
nd
Com
munic
ation
Oth
er S
erv
ices
Food a
nd B
evera
ges
Health a
nd S
ocia
l W
ork
Busin
ess S
erv
ices
Tra
nsport
and S
tora
ge
Art
s, E
nte
rtain
ment
and R
ecre
ation
Accom
odation
Education
Dis
trib
utive T
rade
SUMMARY FINDINGS

Average Annual Salary per Employee was RM25,481 in 2010. Among the services sub-sector,
employees working in Financial Services were the highest paid, receiving an average annual salary of
RM58,591 while the lowest average annual salary per employee was recorded by the Food and
Beverages services with RM10,752 (Table 4.1).
Table 4.1: Average annual salary per employee of services sub-sectors, 2010
5. PERFORMANCE BY SIZE
5.1 Employment Size
Establishments engaging less than 5 persons were the highest number in the services sector with
67.9 per cent in 2010. Meanwhile, establishments with more than 100 persons and above had the lowest
contribution towards the number of establishments with only 0.4 per cent. However, they accounted the
majority contribution of revenue and total employment with 53.8 per cent and 32.4 per cent respectively
(Table 5.1).
Economic Census 2011 (Services Sector) | 15
Sub-sector Paid EmployeesSalaries & wages paid
(RM thousand)
Average annual salary
per employee
(RM)
Financial Services 245,780 14,400,382 58,591
Information and Communication 131,097 6,391,430 48,753
Transport and Storage 276,374 9,048,511 32,740
Education 101,742 3,165,553 31,114
Business Services 307,507 7,902,167 25,698
Health and Social Work 81,795 2,084,584 25,485
Distributive Trade 1,223,198 26,039,854 21,288
Arts, Entertainment and Recreation 36,986 775,632 20,971
Accommodation 108,538 1,934,059 17,819
Other Services 69,176 950,597 13,742
Food and Beverages 468,268 5,034,890 10,752
Total 3,050,461 77,727,659 25,481
SUMMARY FINDINGS
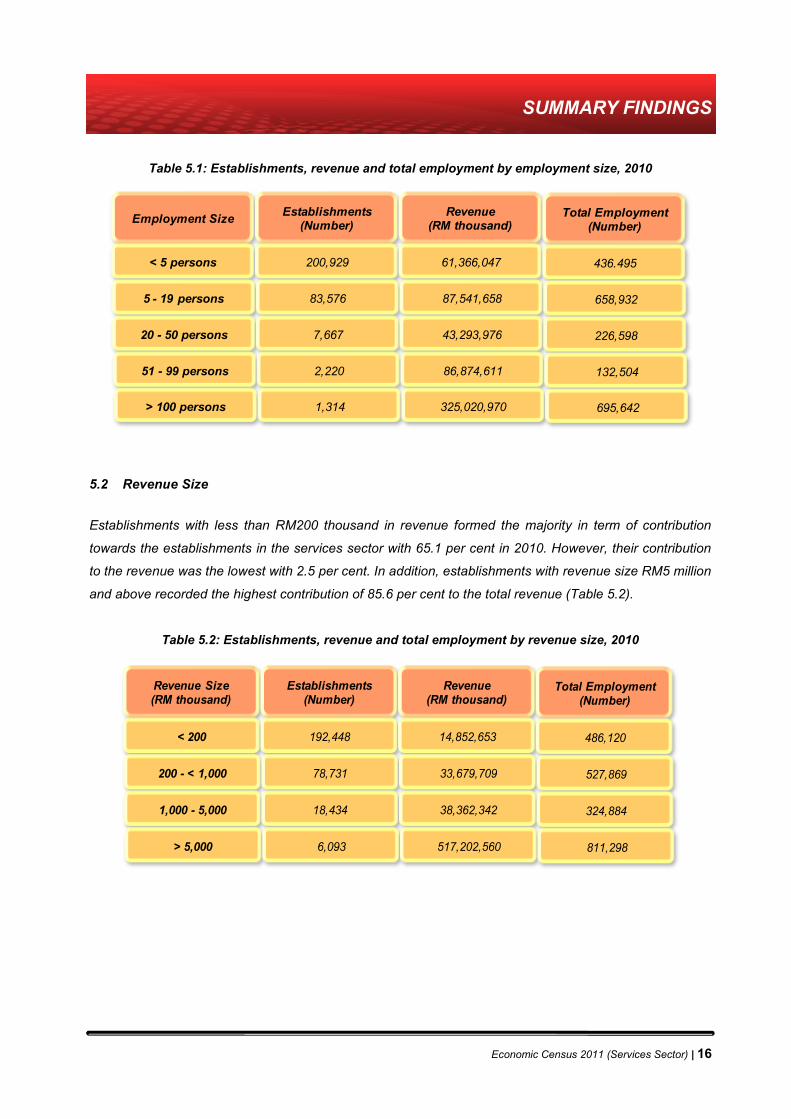
Table 5.1: Establishments, revenue and total employment by employment size, 2010
5.2 Revenue Size
Establishments with less than RM200 thousand in revenue formed the majority in term of contribution
towards the establishments in the services sector with 65.1 per cent in 2010. However, their contribution
to the revenue was the lowest with 2.5 per cent. In addition, establishments with revenue size RM5 million
and above recorded the highest contribution of 85.6 per cent to the total revenue (Table 5.2).
Table 5.2: Establishments, revenue and total employment by revenue size, 2010
Economic Census 2011 (Services Sector) | 16
Revenue Size (RM thousand)
Establishments (Number)
Revenue (RM thousand)
Total Employment(Number)
< 200 192,448 14,852,653 486,120
200 - < 1,000 78,731 33,679,709 527,869
1,000 - 5,000 18,434 38,362,342 324,884
> 5,000 6,093 517,202,560 811,298
Employment SizeEstablishments
(Number) Revenue
(RM thousand) Total Employment
(Number)
< 5 persons 200,929 61,366,047 436.495
5 - 19 persons 83,576 87,541,658 658,932
20 - 50 persons 7,667 43,293,976 226,598
51 - 99 persons 2,220 86,874,611 132,504
> 100 persons 1,314 325,020,970 695,642
SUMMARY FINDINGS
NOTA TEKNIKAL TECHNICAL NOTES
SEKTOR PERKHIDMATAN SERVICES SECTOR


Banci Ekonomi 2011 (Sektor Perkhidmatan) | 19
Laporan ini membekalkan maklumat sektor perkhidmatan bagi tahun rujukan 2010. Data
tersebut dikumpul dan disusun daripada Banci Ekonomi yang dilaksanakan pada tahun
2011. Di dalam laporan ini tiada pecahan data di peringkat negeri bagi Perkhidmatan
Kewangan dan Perdagangan Edaran. Hanya data agregat di peringkat Malaysia sahaja
diterbitkan.
Banci ini dilaksanakan di bawah Akta Perangkaan 1965 (Disemak 1989). Seksyen 5 di
bawah akta ini menghendaki mana-mana pertubuhan yang beroperasi di Malaysia untuk
memberikan maklumat sebenar atau anggaran terbaik kepada Jabatan. Mengikut Akta
ini, kandungan soal selidik adalah sulit dan hanya angka agregat diterbitkan.
Banci ini meliputi pertubuhan berdaftar yang terlibat dalam sektor perkhidmatan. Sumber
maklumat utama rangka pertubuhan diperoleh daripada Suruhanjaya Syarikat Malaysia
(SSM). Selain daripada SSM, maklumat rangka banci juga dikemas kini daripada
sumber seperti Lembaga Pelesenan Kenderaan Perdagangan (LPKP), Suruhanjaya
Komunikasi dan Multimedia Malaysia (SKMM), Kementerian Perumahan dan Kerajaan
Tempatan (KPKT), Suruhanjaya Sekuriti Malaysia (SC), pelbagai persatuan perniagaan
dan perdagangan, iklan surat khabar dan laman web. Rangka dikemas kini setiap tahun
untuk mengambil kira pertubuhan baru dan merekodkan sebarang perubahan status
yang berlaku kepada pertubuhan seperti tutup, tidak beroperasi, perubahan jenis aktiviti,
lokasi kilang atau alamat pos.
Banci ini dilaksanakan secara mel dengan menggunakan borang soal selidik.
Responden diberi tempoh satu bulan untuk melengkapkan dan mengembalikan borang
soal selidik tersebut kepada Jabatan ini. Selepas tempoh tersebut, kerja luar dijalankan
untuk mendapatkan borang lengkap daripada pertubuhan yang tidak memberi jawapan.
Banci dilaksanakan secara ‘area listing’ bagi aktiviti perkhidmatan makanan dan
minuman. Maklumat yang diperlukan dipungut melalui penghitungan luar. Responden
ditemuramah secara terus oleh pegawai luar yang terlibat.
Banci ini dilaksanakan dengan menggunakan pendekatan pertubuhan. Pertubuhan
ditakrifkan sebagai “satu unit ekonomi yang bergiat di bawah satu hak milik atau
penguasaan tunggal, iaitu di bawah satu entiti yang sah. Ia menjalankan satu jenis
aktiviti ekonomi utama di satu tempat/lokasi fizikal”. Setiap pertubuhan diberikan
klasifikasi industri yang berbeza berdasarkan aktiviti utamanya dan bukannya mengikut
aktiviti syarikat induk.
Skop & liputan
Pendahuluan
Kuasa perundangan
Metodologi
Unit melapor
NOTA TEKNIKAL

Banci Ekonomi 2011 (Sektor Perkhidmatan) | 20
Bagi pertubuhan yang menjalankan pelbagai aktiviti, unit yang bergiat dalam aktiviti yang
berasingan dalam satu lokasi yang sama terdiri daripada entiti pertubuhan yang
berbeza. Oleh itu, setiap cawangan daripada organisasi yang mempunyai pelbagai
cawangan di lokasi yang berbeza dari segi konsep dianggap sebagai pertubuhan yang
berlainan. Pertubuhan berkenaan diminta memberikan penyata yang berasingan bagi
biasanya disediakan secara berpusat yang sukar untuk diasingkan mengikut unit atau
cawangan. Entiti atau enterpris berkenaan dianggap sebagai satu pertubuhan dan
dibenarkan menghantar satu borang soal selidik yang menggabungkan semua unit atau
cawangan.
Tahun banci merujuk kepada tahun pelaksanaan banci.
Tahun rujukan bagi banci ini ialah tahun takwim 2010. Pertubuhan yang mempunyai
tahun perakaunan yang berbeza daripada tahun takwim diminta menyediakan laporan
mengikut tahun perakaunan atau kewangan yang meliputi sebahagian besar daripada
tahun rujukan.
Jenis aktiviti perniagaan merujuk kepada aktiviti utama dan sekunder. Aktiviti utama
merujuk kepada aktiviti yang mana pertubuhan menumpukan sebahagian besar
sumbernya atau yang memberikan sumbangan besar dari segi pendapatan. Aktiviti
sekunder adalah sampingan atau sokongan kepada aktiviti utama. Klasifikasi industri
pertubuhan dibuat berdasarkan aktiviti utama dan mengikut Piawaian Klasifikasi Industri
Malaysia (MSIC) 2008. MSIC 2008 yang diguna pakai adalah selaras dengan Piawaian
Klasifikasi Industri Antarabangsa bagi Semua Aktiviti Ekonomi (ISIC), Semakan Ke-4,
Pertubuhan Bangsa-Bangsa Bersatu, dengan pengubahsuaian untuk keperluan
tempatan.
Definisi yang diguna pakai dalam penerbitan ini berasaskan kepada Piawaian Klasifikasi
Industri Malaysia (MSIC) 2008 ver. 1.0. Definisi tersebut adalah termasuk aktiviti berikut:
i. Perkhidmatan Perdagangan Edaran ditakrifkan sebagai:
Perkhidmatan Perdagangan Edaran merujuk kepada Perdagangan Borong,
Perdagangan Runcit dan Kenderaan Bermotor merujuk kepada aktiviti
“penjualan semula (tanpa pengubahsuaian) barangan baru dan barangan yang
telah digunakan”. Perdagangan Borong merujuk kepada aktiviti penjualan
semula (tanpa pengubahsuaian) barangan baru dan terpakai kepada peruncit,
pengguna perindustrian, perdagangan, institusi atau profesional; atau kepada
pemborong lain; atau bertindak sebagai agen atau broker dalam pembelian
barang dagangan, atau menjual barang dagangan kepada orang atau syarikat
berkenaan. Perdagangan Runcit merujuk kepada penjualan semula (tanpa
Tahun banci
Tahun rujukan
Jenis aktiviti
perniagaan
Konsep dan
definisi
NOTA TEKNIKAL

Banci Ekonomi 2011 (Sektor Perkhidmatan) | 21
pengubahsuaian) barang baru dan terpakai kepada orang awam untuk
kegunaan persendirian atau isi rumah. Kenderaan Bermotor merujuk kepada
jualan secara borong dan runcit kenderaan bermotor dan motorsikal, sama ada
baru atau terpakai, jualan alat-alat ganti dan aksesori kenderaan,
penyelenggaraan dan pembaikan kenderaan bermotor dan motorsikal termasuk
mencuci, mengilap dan menunda kenderaan serta jualan oleh agen berkomisen.
ii. Pengangkutan dan penyimpanan ditakrifkan sebagai:
Pengangkutan dan penyimpanan merujuk kepada penyediaan bagi
pengangkutan penumpang atau muatan, sama ada berjadual atau tidak, melalui
rel, saluran paip, jalan raya, air atau udara dan aktiviti yang berhubungkait
seperti kemudahan terminal, pengendalian kargo, penyimpanan dan lain-lain.
Termasuk juga penyewaan kelengkapan pengangkutan dengan pemandu atau
operator dan juga perkhidmatan pos dan kurier.
iii. Perkhidmatan penginapan ditakrifkan sebagai:
Perkhidmatan penginapan merujuk kepada penginapan jangka pendek untuk
pelawat dan pelancong. Perkhidmatan penginapan meliputi pertubuhan
berdaftar yang terlibat dalam aktiviti perkhidmatan penginapan yang
merangkumi hotel (termasuk resort), hotel bajet, pangsapuri khidmat, chalet,
rumah rehat/ rumah tetamu/ hostel/ bed & breakfast, tapak perkhemahan, taman
kenderaan rekreasi, taman treler dan jenis penginapan yang lain.
iv. Perkhidmatan makanan dan minuman ditakrifkan sebagai:
Perkhidmatan makanan dan minuman merujuk kepada penyediaan hidangan
makanan dan minuman untuk penggunaan segera, sama ada di restoran
tradisional, restoran layan diri atau bawa pulang, yang didirikan secara kekal
dengan atau tiada kemudahan tempat duduk. Hidangan yang dibekalkan untuk
penggunaan segera adalah faktor yang diambil kira bukannya jenis kemudahan
untuk menyediakan hidangan tersebut.
v. Perkhidmatan maklumat dan komunikasi ditakrifkan sebagai:
Perkhidmatan maklumat dan komunikasi merujuk kepada penyediaan produksi
dan pengedaran maklumat dan produk kebudayaan serta peruntukan untuk
menghantar atau mengedar produk tersebut seperti data atau komunikasi,
aktiviti teknologi maklumat dan prosesan data dan aktiviti perkhidmatan
maklumat yang lain. Termasuk dalam perkhidmatan ini ialah aktiviti penerbitan,
wayang gambar, pengeluaran video dan program televisyen, rakaman bunyi dan
penerbitan muzik, pemprograman dan penyiaran, telekomunikasi,
pengaturcaraan komputer, perundingan dan aktiviti berkaitan dan aktiviti
NOTA TEKNIKAL
Banci Ekonomi 2011 (Sektor Perkhidmatan) | 22
perkhidmatan maklumat.
vi. Perkhidmatan kewangan ditakrifkan sebagai:
Perkhidmatan kewangan termasuk semua unit yang terlibat dalam aktiviti
pengantaraan kewangan iaitu untuk mendapatkan dan pengagihan dana, dalam
bentuk deposit oleh Bank Pusat dan institusi kewangan lain. Ia juga termasuk
semua unit yang terlibat dalam dana insurans dan pencen dan juga aktiviti-
aktiviti sokongan lain kepada pengantaraan kewangan.
vii. Perkhidmatan perniagaan ditakrifkan sebagai:
Perkhidmatan perniagaan merujuk kepada semua aktiviti yang merangkumi
perkhidmatan hartanah, perkhidmatan profesional, saintifik dan teknikal dan
perkhidmatan pentadbiran dan sokongan. Perkhidmatan ini termasuk aktiviti
seperti pemberi pajak, agen dan/atau broker di dalam satu atau lebih daripada
penjualan atau pembelian hartanah, penyewaan hartanah, penyediaan
perkhidmatan hartanah lain seperti penilaian hartanah atau bertindak sebagai
agen hartanah eskrow, guaman, aktiviti perakaunan, aktiviti ibu pejabat, aktiviti
perundingan pengurusan, aktiviti arkitek dan kejuruteraan, ujian teknikal dan
analisis, penyelidikan dan pembangunan saintifik, pengiklanan dan penyelidikan
pasaran, aktiviti profesional, saintifik dan teknikal lain, aktiviti veterinar, sewaan
dan pajakan, aktiviti pekerjaan, agensi pengembaraan, operator pelancongan,
aktiviti perkhidmatan penempahan lain, aktiviti keselamatan dan
penyiasatan, aktiviti perkhidmatan kepada bangunan dan lanskap dan aktiviti
pengurusan pejabat, sokongan pejabat dan perniagaan lain.
viii.Perkhidmatan pendidikan ditakrifkan sebagai:
Perkhidmatan pendidikan termasuk pendidikan pada mana-mana peringkat atau
untuk mana-mana profesion, secara lisan atau penulisan dan juga melalui siaran
radio dan televisyen atau saluran komunikasi lain yang bersamaan dengannya.
Ia termasuk sistem persekolahan biasa pelbagai peringkat yang dilaksanakan
oleh institusi yang berlainan dan juga pendidikan dewasa, program literasi dan
lain-lain. Ia termasuk pendidikan pra-sekolah & rendah, pendidikan menengah,
pendidikan tinggi dan pendidikan lain.
ix. Perkhidmatan kesihatan dan kerja sosial ditakrifkan sebagai:
Perkhidmatan kesihatan dan kerja sosial merujuk aktiviti bermula daripada
penjagaan kesihatan yang disediakan oleh profesional perubatan terlatih di
hospital dan kemudahan lain sehinggalah kepada aktiviti rumah penjagaan dan
aktiviti penjagaan kesihatan kepada kerja sosial tanpa penglibatan profesional
dalam penjagaan kesihatan. Ini termasuk aktiviti hospital, aktiviti amalan
NOTA TEKNIKAL
Banci Ekonomi 2011 (Sektor Perkhidmatan) | 23
perubatan & pergigian, aktiviti kesihatan kemanusiaan lain, aktiviti rumah
penjagaan dan aktiviti kerja sosial tanpa penginapan.
x. Perkhidmatan kesenian, hiburan dan rekreasi ditakrifkan sebagai:
Perkhidmatan kesenian, hiburan dan rekreasi termasuk pelbagai aktiviti bagi
memenuhi minat orang awam dalam aktiviti kebudayaan, hiburan dan rekreasi
meliputi persembahan secara langsung, operasi muzium, perjudian, sukan dan
rekreasi.
xi. Perkhidmatan persendirian dan lain-lain aktiviti ditakrifkan sebagai:
Perkhidmatan persendirian dan lain-lain aktiviti termasuk aktiviti keahlian
organisasi, membaiki komputer dan barangan persendirian dan isi rumah dan
pelbagai aktiviti perkhidmatan persendirian lain yang tidak diliputi di dalam
mana-mana klasifikasi Piawaian Klasifikasi Industri Malaysia.
Taraf sah organisasi sesebuah pertubuhan ditakrifkan seperti berikut:
i. Hak milik perseorangan
Ia merujuk kepada perniagaan yang dimiliki oleh orang perseorangan dan
dijalankan semata-mata untuk mendapatkan keuntungan. Pemilik mempunyai hak
mutlak untuk mengendalikan urusan pertubuhannya.
ii. Perkongsian
Merujuk kepada sekumpulan individu yang telah bersetuju untuk mengikat kontrak
dan menjalankan perniagaan dengan matlamat untuk mendapat keuntungan.
Perniagaan tersebut diuruskan oleh semua atau salah seorang daripada mereka
yang bertindak mewakili semua pihak. Perkongsian perniagaan ini hendaklah
mengandungi sekurang-kurangnya dua orang ahli dan tidak melebihi had
maksimum dua puluh orang.
iii. Syarikat sendirian berhad
Merujuk kepada sebuah perbadanan swasta yang ditubuhkan untuk menjalankan
perniagaan dengan tujuan untuk mencari keuntungan. Saham dipegang secara
tertutup oleh pemegang-pemegang saham yang mempunyai kawalan terhadap
operasi syarikat. Ia didaftarkan dengan tanggungan berhad. Sesebuah syarikat
sendirian berhad mempunyai Memorandum dan Artikel Persatuan sendiri, yang
antara lain:
a) Menghadkan hak untuk memindahkan sahamnya;
b) Menghadkan bilangan pemegang sahamnya di antara dua hingga lima
puluh orang (tidak termasuk pekerja syarikat itu dan bekas pekerja yang
Taraf sah
NOTA TEKNIKAL
Banci Ekonomi 2011 (Sektor Perkhidmatan) | 24
masih menjadi ahli);
c) Melarang sebarang pelawaan kepada orang ramai untuk membeli
apa-apa saham atau debentur syarikat itu; dan
d) Melarang sebarang pelawaan kepada orang ramai supaya menyimpan
wang di syarikat itu bagi sesuatu tempoh yang ditetapkan ataupun untuk
dibayar bila dituntut, sama ada dengan faedah atau tidak.
iv. Syarikat awam berhad
Syarikat awam berhad juga merupakan sebuah perbadanan swasta yang
ditubuhkan, dengan tanggungan berhad, oleh sekurang-kurangnya dua orang
untuk menjalankan perniagaan dengan tujuan mencari keuntungan. Saham
syarikat awam berhad ini dipegang secara terbuka dan bagi sesebuah syarikat
yang disenaraikan di Bursa Saham, sahamnya boleh bertukar milik secara bebas.
Syarikat tersebut dianggap sebagai entiti yang sah dan ditubuhkan mengikut
Memorandum dan Artikel Persatuan.
v. Koperasi
Ia merujuk kepada sesebuah persatuan sukarela yang bilangan ahlinya tidak
terhad dan didaftarkan di bawah Akta Koperasi, 1993. Kumpulan wang yang ada
adalah milik bersama untuk memenuhi keperluan ahlinya.
vi. Perbadanan awam
Ia merujuk kepada sebuah perbadanan yang ditubuhkan di bawah Akta Khas
Parlimen atau Dewan Perundangan Negeri.
vii. Pertubuhan persendirian tidak mencari keuntungan
Ia merujuk kepada syarikat tanpa saham yang ditubuhkan dengan tanggungan
berhad. Kebanyakan syarikat ini terdiri daripada pertubuhan kebajikan,
keagamaan, pendidikan, kesihatan, kebudayaan, rekreasi dan pertubuhan yang
memberikan perkhidmatan sosial dan kemasyarakatan kepada isi rumah.
Perkhidmatan diberikan secara percuma atau pada harga yang tidak melebihi kos
perkhidmatan (subsidi). Sebarang keuntungan yang diperoleh dilabur semula ke
dalam pertubuhan berkenaan.
viii. Lain-lain
Ia merujuk kepada semua pertubuhan lain yang tidak termasuk di mana-mana
kategori yang tersebut di atas.
NOTA TEKNIKAL
Banci Ekonomi 2011 (Sektor Perkhidmatan) | 25
Hak milik sesebuah pertubuhan dikelaskan megikut taraf residen pemilik/ pemilik-pemilik
modal berbayar terbesar (melebihi 50%) dan bukannya mengikut taraf kewarganegaraan
mereka. Dalam kes di mana setiap pihak (Residen Malaysia dan Bukan Residen
Malaysia) memegang bilangan saham yang sama banyak dalam perniagaan berkenaan,
maka pertubuhan tersebut telah dikelaskan di bawah „Hak Milik Bersama‟.
Residen Malaysia ialah individu, enterpris atau organisasi lain yang lazimnya terletak di
Malaysia untuk jangka masa sekurang-kurangnya satu tahun. Cawangan dan anak
syarikat asing yang didaftarkan dan perbadankan di Malaysia adalah dianggap sebagai
residen Malaysia.
Bukan residen Malaysia ialah individu, enterpris atau organisasi lain yang lazimnya
terletak di negara lain selain Malaysia. Cawangan dan anak syarikat milik residen
Malaysia di luar negara dianggap sebagai bukan residen Malaysia.
Harta tetap meliputi semua barangan, baru atau terpakai, ketara atau tidak ketara yang
mempunyai hayat produktif lebih daripada setahun. Ia termasuk tanah, bangunan dan
struktur, alat pengangkutan, komputer dan peralatan periferal, perisian komputer,
peralatan mesin dan lain-lain, serta perabot dan pemasangan lain. Nilai harta pembuka
dan penutup bagi tahun rujukan 2010 adalah berasakan nilai buku akaun. Pembelian,
pindaan dan pembaikan besar atau perbelanjaan modal pada tahun berkenaan dikira
pada nilai sebenar yang dibayar. Nilai aset yang dijual dalam tahun semasa juga dikira
pada nilai sebenar.
Jumlah pekerja meliputi orang yang diambil bekerja pada bulan Disember atau pada
tempoh pembayaran gaji terakhir bagi tahun rujukan. Bilangan orang yang bekerja
dikategorikan seperti berikut:
i. Pemilik yang bekerja dan rakan niaga yang aktif
Kategori ini merujuk kepada semua pemilik perseorangan dan rakan niaga,
sambilan atau sepenuh masa, yang bekerja dengan aktif dalam pertubuhan. Justeru
itu, ia tidak termasuk rakan niaga yang tidak aktif.
ii. Pekerja keluarga tidak bergaji
Kategori ini meliputi semua ahli isi rumah pemilik pertubuhan yang melaksanakan
kerja tertentu (sepenuh masa atau sambilan) dan bekerja sekurang-kurangnya satu
pertiga daripada waktu bekerja biasa yang diamalkan oleh pertubuhan berkenaan
tanpa mendapat bayaran secara tetap sama ada dalam bentuk wang tunai atau
mata benda bagi kerja yang dilakukan. Biasanya pekerja berkenaan mendapat
Nilai harta tetap
Jumlah pekerja
Struktur hak
milik
NOTA TEKNIKAL

Banci Ekonomi 2011 (Sektor Perkhidmatan) | 26
makanan, tempat tinggal dan bantuan lain sebagai sebahagian daripada ahli isi
rumah pemilik dan terus mendapatnya sama ada ia bekerja atau tidak di dalam
pertubuhan itu.
iii. Pekerja sepenuh masa
Ia merujuk kepada semua pekerja bergaji yang bekerja sekurang-kurangnya 6 jam
sehari dan 20 hari sebulan.
iv. Pekerja sambilan
Ia merujuk kepada semua pekerja bergaji yang bekerja kurang daripada 6 jam
sehari dan /atau kurang daripada 20 hari sebulan.
Gaji & upah yang dibayar merujuk kepada pembayaran tunai, termasuk yang dibayar
bonus, komisen, bayaran lebih masa, elaun kos sara hidup dan elaun-elaun lain yang
dibayar kepada semua pekerja bergaji dalam tempoh tahun rujukan. Sementara
caruman pekerja kepada Kumpulan Wang Simpanan Pekerja (KWSP) dan Pertubuhan
Keselamatan Sosial (PERKESO) turut dimasukkan, manakala caruman oleh majikan
dikecualikan. Elaun kepada pemilik yang bekerja, rakan niaga yang bekerja dan
pekerja keluarga tidak bergaji juga dikecualikan.
Pendapatan merujuk kepada penerimaan yang diterima atau pendapatan yang diperoleh
daripada perkhidmatan yang diberikan dan lain-lain transaksi yang dibuat semasa tahun
rujukan. Ia terdiri daripada pendapatan operasi dan bukan operasi. Ia hanya berasaskan
kepada Penyata Kira-kira Perdagangan dan Untung Rugi bagi tahun rujukan tersebut.
Perbelanjaan merujuk kepada amaun yang dibayar dan perlu dibayar bagi pembelian
barangan dan perkhidmatan pada tahun rujukan kecuali perbelanjaan modal. Ia terdiri
daripada perbelanjaan operasi dan bukan operasi.
Nilai output kasar perkhidmatan ditakrifkan dengan memasukkan perkara berikut:
Pendapatan daripada perkhidmatan yang diberikan
+ Nilai jualan barangan yang dibeli untuk dijual semula
+ Perkhidmatan pengurusan
+ Komisen dan pembrokeran yang diterima
+ Yuran yang diterima daripada keahlian
+ Pendapatan daripada sewa yang diterima kecuali tanah
+ Pendapatan operasi lain
Gaji & upah
Pendapatan
Perbelanjaan
Nilai output
kasar
NOTA TEKNIKAL

Banci Ekonomi 2011 (Sektor Perkhidmatan) | 27
+ Cukai perkhidmatan dan caj perkhidmatan
- Nilai barang yang dibeli untuk dijual semula dalam keadaan
sama seperti dibeli
+ Stok akhir
- Stok awal
Nilai input perantaraan perkhidmatan ditakrifkan dengan memasukkan unsur
berikut:
Pembelian barangan, bahan dan perkhidmatan
+ Premium insurans
+ Royalti dan yuran paten
+ Caj bank
+ Pembelian elektrik dan air
+ Pembelian bahan pembakar, pelincir dan gas
+ Perbelanjaan penyelidikan dan pembangunan
+ Perbelanjaan pematuhan alam sekitar
+ Perbelanjaan operasi lain
Nilai ditambah adalah tambahan kepada nilai barangan dan perkhidmatan yang
dikeluarkan oleh sesebuah pertubuhan. Nilai ditambah diperoleh daripada perbezaan
antara nilai output kasar dengan nilai input perantaraan.
Pampasan pekerja perkhidmatan ditakrifkan dengan memasukkan perkara berikut:
Gaji dan upah dibayar
+ bayaran berbentuk manfaat kepada pekerja
+ Bayaran pampasan, persaraan / pemberhentian kepada pekerja
+ Caruman majikan kepada kumpulan wang simpanan, skim keselamatan
sosial, pencen dan kebajikan
Penjumlahan dan campuran komponen-komponen mungkin berbeza dengan jumlah
besar di dalam jadual-jadual dalam penerbitan ini disebabkan pembundaran angka.
Huruf ringkas berikut telah digunakan di dalam keseluruhan penerbitan:
- tiada
RM Ringgit Malaysia
t.t.t.l tidak terkelas di tempat lain
Nilai Ditambah
Pampasan
pekerja
Nilai input
perantaraan
Pembundaran
Huruf ringkas
NOTA TEKNIKAL
Economic Census 2011 (Services Sector) | 28
This report provides information on the services sector for the year 2010. The data were
collected and compiled from the Economic Census conducted in 2011. There is no
breakdown of data at state level for Financial Services and Distributive Trade in this
report. Only aggregated data at Malaysia level are published
The Census was conducted under the provisions of the Statistics Act, 1965
(Revised-1989). The Section 5 of this Act requires all establishments operating in
Malaysia to provide actual information or best estimates to the Department. The Act
stipulates that the contents of individual returns are confidential and only aggregated
figures are published.
This census covered all registered establishments engaged in the services sector. The
main source of information for the frame was the Companies Commission of Malaysia
(CCM). Apart from the CCM, information on the frame was also updated from other
sources such as the Commercial Vehicle Licensing Board (CVLB), Malaysian
Communications and Multimedia Commission (MCMC), Ministry of Housing and Local
Government (MHLG), Securities Commission Malaysia (SC), various businesses and
trade associations, newspaper advertisements and websites. The frame was updated
annually to take into account new establishments and to record any changes in the
status of the establishments such as closed down, not in operation, change in activities
and location or postal addresses.
The census was conducted through mail enquiry. Respondents were given one month to
complete and return the questionnaires to the Department. After that period, field
enumeration was undertaken to expedite response from the remaining establishments.
For food and beverage services activities, the census was conducted by area listing.
Information was canvassed through field enumeration. Respondents were interviewed by
officers or supervisory staff involved directly.
The census was conducted on an establishment basis. An establishment is defined as
“an economic unit that engaged in one activity, under a single legal entity and
operating in a single physical location”. Each establishment was assigned an
industry classification based on its principal activity and not to that of its parent company.
In the case of a multi-activity entity, units engaged in separate activities in the same
location constituted distinct establishments. Thus, each branch of a multi-branch
organisation at a different location was conceptually treated as a different establishment.
The establishment was requested to give separate returns for each activity in terms of
value. However, if in practice, the accounts were centrally kept such that it was not
Technical Notes
Methodology
Introduction
Legal authority
Scope and
coverage
Reporting unit
TECHNICAL NOTES

Economic Census 2011 (Services Sector) | 29
possible to obtain separate data for each individual unit or branch, that entity or
enterprise was treated as a single reporting unit and was allowed to submit a
consolidated questionnaire covering all units or branches.
Census year refers to the year in which a census was conducted.
The reference period of the census was the calendar year 2010. Establishments whose
accounting year differed from calendar year were asked to report according to the
accounting year covering the major part of the reference year.
Type of business activity refers to both principal and secondary activities. The principal
activity refers to the activity to which the establishment devoted most of its resources or
activity which contributes the largest income. Secondary activities are those incidental or
ancillary to the principal activity. The classification of the industry of the establishment is
based on the principal activity and is in accordance to the Malaysia Standard Industrial
Classification 2008 (MSIC 2008). The MSIC 2008 conforms to the latest International
Standard Industrial Classification of All Economic Activities (ISIC), Revision 4, United
Nations, with modifications to suit local conditions.
The definition adopted in this publication is based on the recommendations of the
Malaysia Standard Industrial Classification 2008 (MSIC 2008) ver. 1.0. The definitions
include the following activities:-
i. Distributive Trade Services is defined as:
Distributive Trade Services refers to Wholesale Trade, Retail Trade and Motor
Vehicles refers to the resale (sale without transformation) of new and used
goods. Wholesale Trade refers to the resale (sale without transformation) of new
and used goods to retailers; to industrial, commercial, institutional or
professional users; or to other wholesalers; or involves acting as an agent or
broker in buying merchandise for, or selling merchandise to such persons or
companies. Retail Trade refers to the resale (sale without transformation) of new
and used goods to the general public for personal or household consumption or
utilisation. Motor Vehicles refers to activity related to the wholesale and retail
sale of motor vehicles and motorcycles, either new or used, sale of motor
vehicle parts and accessories, maintenance and repair of motor vehicles and
motorcycles including washing, polishing and towing as well as sales by
commission agents.
Concepts and
definitions
Type of
business
activity
Reference year
Census year
TECHNICAL NOTES
Economic Census 2011 (Services Sector) | 30
ii. Transportation and storage is defined as:
Transportation & storage refers to provision of passengers or freight transport,
whether scheduled or not, by rail, pipeline, road, water or air and associated
activities such as terminal and parking facilities, cargo handling, storage, ect.
Included also renting of transport equipment with driver or operator and postal
and courier services.
iii. Accommodation Services is defined as:
Accommodation services refers to provision of short-stay for visitors and other
travelers. Accommodation services covered all registered establishments
engaged in the accommodation services including hotels (including resort
hotels), budget hotels, services apartment, chalets, rest houses/guest houses,
hostels/bed & breakfast, camping ground, recreational vehicle parks, trailer
parks and other types of accommodation in Malaysia.
iv. Food and Beverage is defined as:
Food and beverage refers to providing meals and drinks fit for immediate
consumption, whether in traditional restaurants, self-service or take-away
restaurants, whether as permanent with or without seating. Decisive is the fact
that meals fit for immediate consumption are offered, not the kind of facility
providing them.
v. Information and Communication is defined as:
Information and communication refers to production and distribution of
information and cultural products, the provision of the means to transmit or
distribute these products, as well as data or communications, information
technology activities and the processing of data and other information services
activities. This services includes publishing activities, motion picture, video and
television programme production, sound recording and music publishing
activities, broadcasting and programming activities, telecommunications,
computer programming, consultancy and related activities and information
services activities.
vi. Financial Services is defined as:
Financial services refers to all activities of financial intermediation i.e. obtaining
and redistributing funds in the form of deposits by Central Banks and other
monetary institutions. It also includes all units engaged in insurance and pension
funding as well as other activities auxiliary to financial intermediation.
TECHNICAL NOTES

Economic Census 2011 (Services Sector) | 31
vii. Business Services is defined as:
Business services refers to all activities under Real Estate Services,
Professional, Scientific and Technical Services and Administrative and Support
Services. This services includes activities acting as lessors, agents and/or
brokers in one or more of selling or buying real estate, renting real estate,
providing other real estate services such as appraising real estate or acting as
real estate escrow agents, legal and accounting activities, activities of head
offices, management consultancy activities, architectural and engineering
activities, technical testing and analysis, scientific research and development,
advertising and market research, other professional, scientific and technical
activities and veterinary activities, rental and leasing activities, employment
activities, travel agency, tour operator and other reservation service activities,
security and investigation activities, services to buildings and landscape
activities, office administrative, office and other business support activities.
viii. Education Services is defined as:
Education services includes education at any level or for any profession, oral or
written as well as by radio and television or other means of
communication. It includes education by the different institutions in the regular
school system at its different levels as well as adult education, literacy
programmes, ect. This includes pre-primary & primary education, secondary
education, higher education and other education.
ix. Health and Social Work Services is defined as:
Health and social work services refers activities starting from health care
provided by trained medical professionals in hospitals and other facilities, over
residential care activities that still involve a degree of health care activities to
social work activities without any involvement of health care professionals. This
includes hospital activities, medical & dental practice activities, other human
health activities, residential care activities and social work activities without
accommodation.
x. Art, Entertainment and Recreation Services is defined as:
Art, entertainment and recreation services includes a wide range of activities to
meet varied cultural, entertainment and recreational interests of the general
public, including live performances, operation of museum sites, gambling, sport
and recreation activities.
TECHNICAL NOTES

Economic Census 2011 (Services Sector) | 32
xi. Personal Services and Other Activities is defined as:
Personal services and other activities includes the activities of membership
organisations, repair of computers and personal and household goods and a
variety of other personal service activities not covered elsewhere in the
Malaysian Standard Industrial Classification.
The legal organisation of an establishment is defined as follows:
i. Individual proprietorship
This refers to a business, owned and operated by one person for profit. The owner
has the exclusive right to control the operations of the establishment.
ii. Partnership
This refers to a group of individuals who agree to contract and to carry on a business
with the objective of making a profit. The business is managed by all or any one
acting for all parties. A trading partnership must comprise at least two members and
should not exceed a maximum of twenty members.
iii. Private limited company
Refers to a private corporation established to undertake a business with the
objective of making a profit. The shares are closely held by shareholders of the
corporation who have control over its operation. It is registered with limited liability. A
private limited company has a Memorandum and Articles of Association, which
among others:
a) Restricts the right to transfer its shares;
b) Limits the number of its shareholders between two to fifty (not including
employees of the company and past employees who are currently members);
c) Prohibits any invitation to the public to subscribe for any share or debenture of
the company; and
d) Prohibits any invitation to the public to deposit money with the company for fixed
periods or payable at call with or without interest.
iv. Public limited company
A public limited company is also a private corporation established, with limited
liability, by a minimum of two persons to operate the business with the objective of
making a profit. The shares in a public limited company are openly held and in the
case of a company listed on the Bursa Malaysia, the shares are freely transferable.
The company is regarded as a legal entity and is constituted by the Memorandum
and Articles of Association.
Legal
organisation
TECHNICAL NOTES
Economic Census 2011 (Services Sector) | 33
v. Co-operative
This refers to a voluntary association with unrestricted number of members and
registered under the Co-operatives Act 1993. Funds are collectively owned to meet
the needs of the members.
vi. Public corporation
This refers to a corporation set up under a Special Act of Parliament or by the State
Legislature.
vii. Private non-profit making organisation
This is non-stock company set up with limited liability. It comprises mainly welfare,
religious, educational, health, cultural, recreational and other
organisations providing social and community services to households. These
services are provided free of charge or at prices, which do not necessarily or fully
cover the cost of providing such services (subsidy). Any profit made is reinvested in
the organization.
viii. Others
This refers to all other establishments, which do not fall under any of the categories
mentioned above.
The ownership of an establishment is classified by the residential status of the owners of
the majority (more than 50%) of the paid-up capital and not by their citizenship status. In
instances where each party (Malaysian Resident and Non-Malaysian Resident) held
equal shares in the business, the establishments were classified as ‘Joint Ownership’.
A Malaysian resident is any individual, enterprise or other organisation ordinarily
domiciled in Malaysia for a period of at least one year. Malaysian registered branches
and incorporated subsidiaries of foreign enterprises are regarded as Malaysian
residents.
A non-Malaysian resident is any individual, enterprise or other organisation
ordinarily domiciled in a country other than Malaysia. Foreign branches and/or
subsidiaries of Malaysian companies are regarded as non-Malaysian residents.
Assets refers to fixed assets. It covers all goods, new or used, tangible or intangible that
have a normal economic life span of more than one year. Included are land, buildings
and structure, transport equipment, computer and peripheral equipment, other
machinery equipment, computer software and furniture and fittings. Value of assets as at
Value of fixed
assets
Ownership
TECHNICAL NOTES
Economic Census 2011 (Services Sector) | 34
the beginning and end of 2010 was based on net book value. Purchases, alterations and
major repairs or capital expenditure during the year were valued at actual costs incurred.
Value of assets sold during the year refers to the realised value.
Employment covers all persons engaged during December or the last pay period of
the reference year. The number of persons engaged was classified under the following
categories:
i. Working proprietors and active business partners
This category refers to all individual proprietors and partners, part-time or full time,
who are actively engaged in the work of the establishment. It therefore, excludes
silent and inactive partners.
ii. Unpaid family workers
This category encompasses all persons (full-time or part-time) in the household of
any of the owners of the establishment who perform a specified job and work for a
minimum of one third of the normal working time of the establishment but do not
receive regular payment either in cash or in kind for the work done. Such workers
generally receive food, shelter and other support as part of the household of an
owner but this would continue whether they worked in the establishment or not.
iii. Full-time employees
It refers to all paid workers who work for at least 6 hours a day and 20 days a month.
iv. Part-time employees
It refers to all paid workers who work for less than 6 hours a day and/or less than 20
days a month.
Salaries & wages paid refer to cash payments, including bonuses, commissions,
overtime wages, cost of living and allowances made to all employees during the
reference year. While the employees’ contributions to Employees’ Provident Fund (EPF)
and Social Security Organisation (SOCSO) are included, the employer’s contributions
are excluded. Allowances to working proprietors, working partners and unpaid family
worker are also not included.
It refers to revenue received from services that was given and others transaction during
the reference year. It included operational and non operational income. It should based
on Income Statement and Profit & Loss Account during the reference year.
Expenditure
Revenue
Salaries & wages
Number of
persons engaged
TECHNICAL NOTES

Economic Census 2011 (Services Sector) | 35
Expenditure refers to amount that establishment have to pay for purchase goods and
services during reference year excluded capital expenditure. It included operational and
non operational expenses.
The value of gross output of services is defined to include the following items:
Income from services rendered
+ Value of goods sold in the same condition as purchased
+ Management services
+ Commission and brokerage earned
+ Fees earned from membership
+ Rental income received except land rental
+ Other operating income
+ Service tax and service charges
- Value of goods purchased for resale in the same condition as
Value of intermediate input of services is defined to include the following items:-
Purchased of goods, materials and services
+ Insurance premiums
+ Royalty and patent fees
+ Bank charges
+ Purchase of electricity and water
+ Purchase of fuels, lubricants and gas
+ Research and development expenditure
+ Environmental compliance expenditure
+ Other operating expenditure
Value added is the increment to the value of commodities and services contributed by
the construction establishment and it is derived as the difference between the value of
gross output and the value of intermediate input.
Compensation of employee of services is defined to include the following items:
Salaries & wages paid
+ Payment in kind to employees
+ Payment of gratuity, retirement/retrenchment benefits to employees
+ Employer’s contribution to provident funds,social security schemes,
pensions and welfare schemes
Abbreviation
Value added
Compensation
of employee
Value of
intermediate
input
Value of gross
output
Expenditure
TECHNICAL NOTES
Economic Census 2011 (Services Sector) | 36
The sum of components may not add up to the totals in the tables presented in this
publication due to rounding.
The following abbreviations have been used throughout the publication:
- nil
RM Ringgit Malaysia
n.e.c. not elsewhere classified
Abbreviation
Rounding
Abbreviation
TECHNICAL NOTES
JADUAL TABLES
SEKTOR PERKHIDMATAN SERVICES SECTOR

Subsektor
Bilangan
Pertubuhan
Pendapatan
(RM ribu)
Perbelanjaan
(RM ribu)
Output
(RM ribu)
Input
(RM ribu)
Gaji & upah
(RM ribu)
Sub-sector Number of
establishment
s
Revenue
(RM thousand)
Expenditure
(RM thousand)
Output
(RM thousand)
Input
(RM thousand)
Salaries & wages
(RM thousand)
Jumlah Pekerja bergaji
Total Paid employees
Jumlah
Total
591,137 1,291,439,934 1,017,642,967 650,948,100 279,373,448 3,687,787 3,050,461 77,727,659
Perdagangan Edaran
Distributive Trade
295,431 687,342,670 615,961,619 200,409,682 78,070,572 1,537,616 1,223,198 26,039,854
Pengangkutan dan penyimpanan
Transport and storage
40,599 83,445,562 68,134,668 76,319,321 44,905,830 312,962 276,374 9,048,511
Penginapan
Accommodation
3,129 9,948,853 8,359,486 9,824,596 4,268,988 110,535 108,538 1,934,059
Makanan dan minuman
Food and beverages
145,320 40,993,761 31,031,610 38,250,611 21,402,899 680,855 468,268 5,034,890
Maklumat dan komunikasi
Information and communication
2,379 85,401,309 54,584,904 81,881,422 39,785,472 131,127 131,097 6,391,430
Kewangan
Financial
5,653 270,102,477 148,307,029 148,423,035 43,359,938 246,000 245,780 14,400,382
Perkhidmatan perniagaan
Business services
38,260 72,061,954 57,047,614 55,155,317 26,311,959 331,921 307,507 7,902,167
Pendidikan
Education
8,178 10,007,309 8,508,074 9,718,219 3,381,658 107,939 101,742 3,165,553
Kesihatan dan kerja sosial
Health and social work
9,152 10,882,851 8,504,679 10,375,466 5,601,587 89,942 81,795 2,084,584
Kesenian, hiburan dan rekreasi
Arts, entertainment and recreation
6,307 16,183,154 13,506,954 15,838,822 10,053,995 43,400 36,986 775,632
Perkhidmatan lain
Other services
36,729 5,070,034 3,696,330 4,751,608 2,230,550 95,490 69,176 950,597
Bilangan pekerja pada akhir
tahun
Total number of persons engaged
as at end of year
Jadual 1 : Penunjuk utama mengikut subsektor perkhidmatan
Table 1 : Key indicators by services sub-sector
39

Subsektor
Bilangan
Pertubuhan
Pendapatan
(RM ribu)
Perbelanjaan
(RM ribu)
Gaji & upah
(RM ribu)
Sub-sector Number of
establishments
Revenue
(RM thousand)
Expenditure
(RM thousand)
Salaries & wages
(RM thousand)
Jumlah Pekerja bergaji
Total Paid employees
JOHOR
Jumlah
Total
31,113 19,013,728 15,947,408 170,117 140,870 2,513,280
Pengangkutan dan penyimpanan
Transport and storage
5,161 5,789,454 4,991,544 27,156 22,606 587,742
Penginapan
Accommodation
365 523,866 508,539 7,478 7,263 121,739
Makanan dan minuman
Food and beverages
15,291 3,607,504 3,083,243 71,435 54,883 621,705
Maklumat dan komunikasi
Information and communication
45 170,675 105,606 712 708 17,663
Perkhidmatan perniagaan
Business services
3,353 6,266,761 5,072,156 29,064 26,906 629,863
Pendidikan
Education
1,198 682,100 598,120 11,823 10,847 199,468
Kesihatan dan kerja sosial
Health and social work
1,092 1,035,918 851,485 9,094 8,097 189,398
Kesenian, hiburan dan rekreasi
Arts, entertainment and recreation
624 468,340 375,141 3726 2900 49,848
Perkhidmatan lain
Other services
3,984 469,111 361,575 9,629 6,660 95,854
40
Jadual 2 : Penunjuk utama subsektor perkhidmatan mengikut negeri
Table 2 : Key indicators of services sub-sectors by state
Bilangan pekerja pada akhir
tahun
Total number of persons engaged
as at end of year
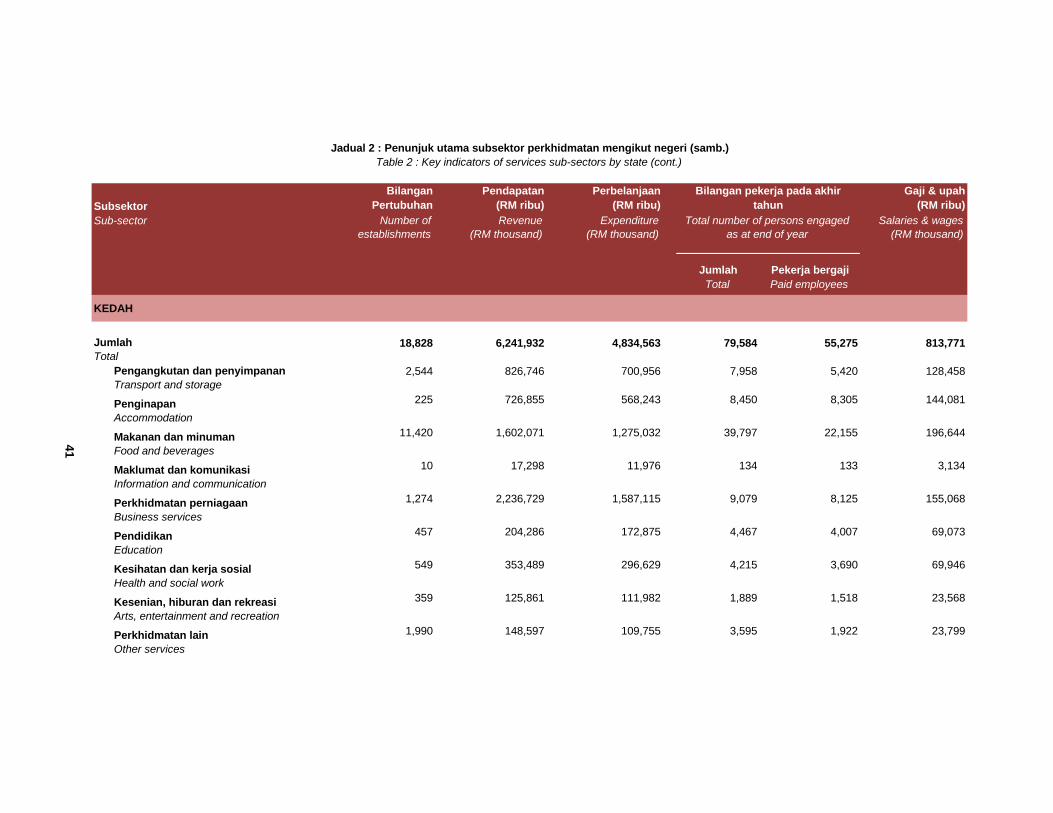
Subsektor
Bilangan
Pertubuhan
Pendapatan
(RM ribu)
Perbelanjaan
(RM ribu)
Gaji & upah
(RM ribu)
Sub-sector Number of
establishments
Revenue
(RM thousand)
Expenditure
(RM thousand)
Salaries & wages
(RM thousand)
Jumlah Pekerja bergaji
Total Paid employees
KEDAH
Jumlah
Total
18,828 6,241,932 4,834,563 79,584 55,275 813,771
Pengangkutan dan penyimpanan
Transport and storage
2,544 826,746 700,956 7,958 5,420 128,458
Penginapan
Accommodation
225 726,855 568,243 8,450 8,305 144,081
Makanan dan minuman
Food and beverages
11,420 1,602,071 1,275,032 39,797 22,155 196,644
Maklumat dan komunikasi
Information and communication
10 17,298 11,976 134 133 3,134
Perkhidmatan perniagaan
Business services
1,274 2,236,729 1,587,115 9,079 8,125 155,068
Pendidikan
Education
457 204,286 172,875 4,467 4,007 69,073
Kesihatan dan kerja sosial
Health and social work
549 353,489 296,629 4,215 3,690 69,946
Kesenian, hiburan dan rekreasi
Arts, entertainment and recreation
359 125,861 111,982 1,889 1,518 23,568
Perkhidmatan lain
Other services
1,990 148,597 109,755 3,595 1,922 23,799
41
Total number of persons engaged
as at end of year
Jadual 2 : Penunjuk utama subsektor perkhidmatan mengikut negeri (samb.)
Table 2 : Key indicators of services sub-sectors by state (cont.)
Bilangan pekerja pada akhir
tahun
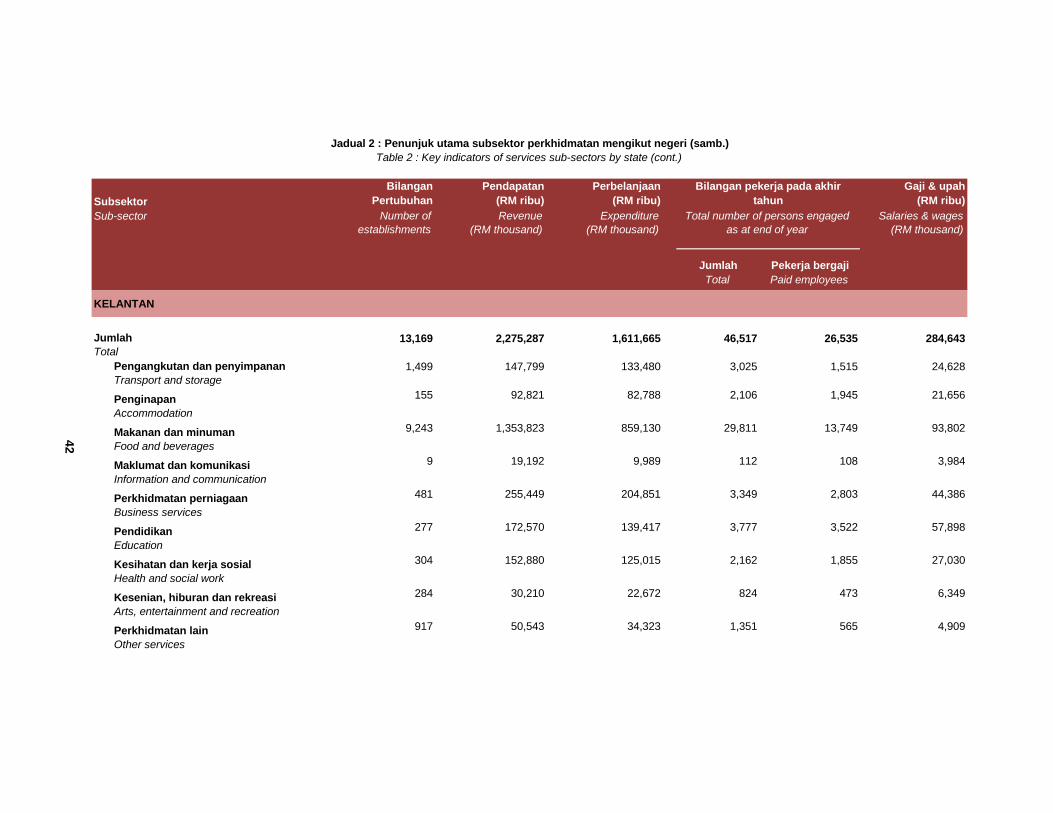
Subsektor
Bilangan
Pertubuhan
Pendapatan
(RM ribu)
Perbelanjaan
(RM ribu)
Gaji & upah
(RM ribu)
Sub-sector Number of
establishments
Revenue
(RM thousand)
Expenditure
(RM thousand)
Salaries & wages
(RM thousand)
Jumlah Pekerja bergaji
Total Paid employees
KELANTAN
Jumlah
Total
13,169 2,275,287 1,611,665 46,517 26,535 284,643
Pengangkutan dan penyimpanan
Transport and storage
1,499 147,799 133,480 3,025 1,515 24,628
Penginapan
Accommodation
155 92,821 82,788 2,106 1,945 21,656
Makanan dan minuman
Food and beverages
9,243 1,353,823 859,130 29,811 13,749 93,802
Maklumat dan komunikasi
Information and communication
9 19,192 9,989 112 108 3,984
Perkhidmatan perniagaan
Business services
481 255,449 204,851 3,349 2,803 44,386
Pendidikan
Education
277 172,570 139,417 3,777 3,522 57,898
Kesihatan dan kerja sosial
Health and social work
304 152,880 125,015 2,162 1,855 27,030
Kesenian, hiburan dan rekreasi
Arts, entertainment and recreation
284 30,210 22,672 824 473 6,349
Perkhidmatan lain
Other services
917 50,543 34,323 1,351 565 4,909
Jadual 2 : Penunjuk utama subsektor perkhidmatan mengikut negeri (samb.)
Table 2 : Key indicators of services sub-sectors by state (cont.)
Bilangan pekerja pada akhir
tahun
42
Total number of persons engaged
as at end of year

Subsektor
Bilangan
Pertubuhan
Pendapatan
(RM ribu)
Perbelanjaan
(RM ribu)
Gaji & upah
(RM ribu)
Sub-sector Number of
establishments
Revenue
(RM thousand)
Expenditure
(RM thousand)
Salaries & wages
(RM thousand)
Jumlah Pekerja bergaji
Total Paid employees
MELAKA
Jumlah
Total
9,629 4,255,757 3,440,651 49,845 36,489 712,162
Pengangkutan dan penyimpanan
Transport and storage
1,082 430,976 352,257 3,795 2,787 65,035
Penginapan
Accommodation
156 289,822 271,293 4,875 4,775 56,311
Makanan dan minuman
Food and beverages
5,227 998,451 739,243 20,750 11,038 113,681
Maklumat dan komunikasi
Information and communication
12 19,181 14,105 181 180 4,028
Perkhidmatan perniagaan
Business services
968 1,076,808 867,169 7,195 6,404 128,602
Pendidikan
Education
315 476,370 414,924 4,250 3,990 191,900
Kesihatan dan kerja sosial
Health and social work
404 554,694 460,155 4,484 4,178 103,715
Kesenian, hiburan dan rekreasi
Arts, entertainment and recreation
281 267,723 222,822 1,890 1,647 29,876
Perkhidmatan lain
Other services
1,184 141,732 98,683 2,425 1,490 19,014
Jadual 2 : Penunjuk utama subsektor perkhidmatan mengikut negeri (samb.)
Table 2 : Key indicators of services sub-sectors by state (cont.)
Bilangan pekerja pada akhir
tahun
43
Total number of persons engaged
as at end of year

Subsektor
Bilangan
Pertubuhan
Pendapatan
(RM ribu)
Perbelanjaan
(RM ribu)
Gaji & upah
(RM ribu)
Sub-sector Number of
establishments
Revenue
(RM thousand)
Expenditure
(RM thousand)
Salaries & wages
(RM thousand)
Jumlah Pekerja bergaji
Total Paid employees
NEGERI SEMBILAN
Jumlah
Total
11,280 4,181,244 3,295,112 57,682 42,785 674,383
Pengangkutan dan penyimpanan
Transport and storage
1,158 725,670 558,481 6,377 5,243 120,294
Penginapan
Accommodation
113 275,821 258,930 3,913 3,841 57,223
Makanan dan minuman
Food and beverages
6,653 1,416,654 1,082,344 27,619 16,926 177,632
Maklumat dan komunikasi
Information and communication
11 37,376 22,443 83 83 1,643
Perkhidmatan perniagaan
Business services
874 684,175 548,223 7,495 6,704 106,303
Pendidikan
Education
392 426,633 346,876 4,582 4,207 121,422
Kesihatan dan kerja sosial
Health and social work
360 272,081 218,106 3,146 2,773 50,637
Kesenian, hiburan dan rekreasi
Arts, entertainment and recreation
244 211,176 162,304 1,199 941 14,337
Perkhidmatan lain
Other services
1,475 131,658 97,404 3,268 2,067 24,893
44
Total number of persons engaged
as at end of year
Jadual 2 : Penunjuk utama subsektor perkhidmatan mengikut negeri (samb.)
Table 2 : Key indicators of services sub-sectors by state (cont.)
Bilangan pekerja pada akhir
tahun
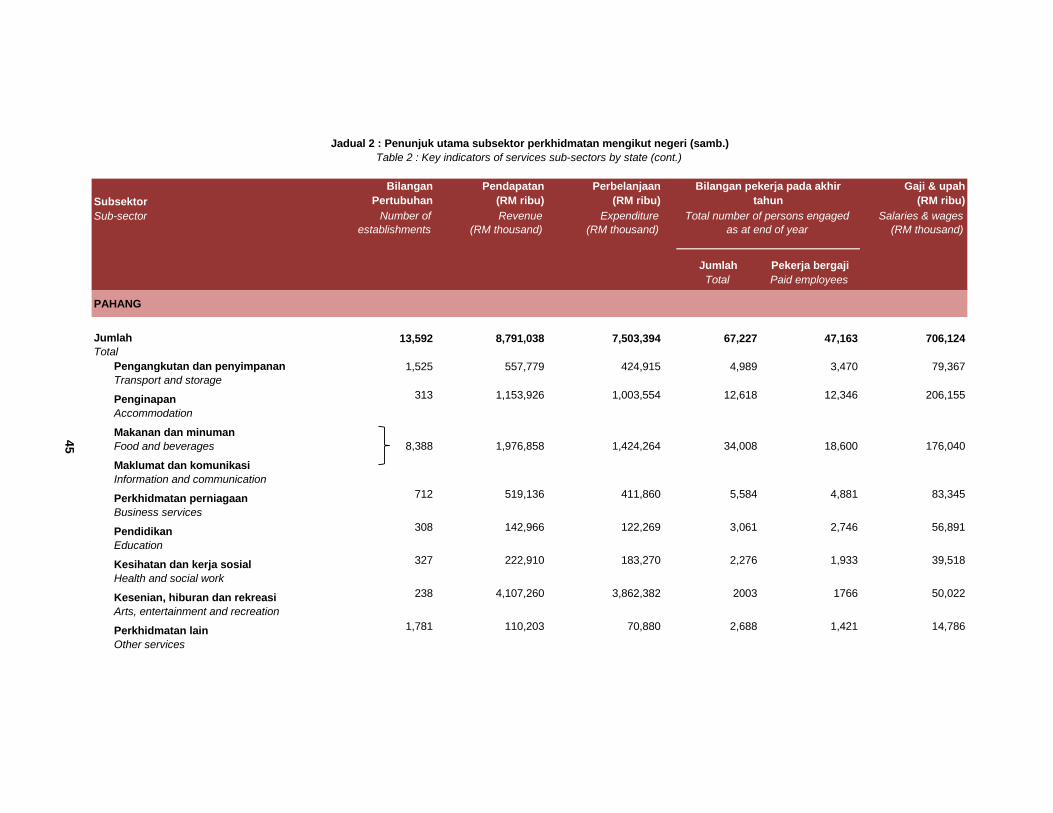
Subsektor
Bilangan
Pertubuhan
Pendapatan
(RM ribu)
Perbelanjaan
(RM ribu)
Gaji & upah
(RM ribu)
Sub-sector Number of
establishments
Revenue
(RM thousand)
Expenditure
(RM thousand)
Salaries & wages
(RM thousand)
Jumlah Pekerja bergaji
Total Paid employees
PAHANG
Jumlah
Total
13,592 8,791,038 7,503,394 67,227 47,163 706,124
Pengangkutan dan penyimpanan
Transport and storage
1,525 557,779 424,915 4,989 3,470 79,367
Penginapan
Accommodation
313 1,153,926 1,003,554 12,618 12,346 206,155
Makanan dan minuman
Food and beverages 8,388 1,976,858 1,424,264 34,008 18,600 176,040
Maklumat dan komunikasi
Information and communication
Perkhidmatan perniagaan
Business services
712 519,136 411,860 5,584 4,881 83,345
Pendidikan
Education
308 142,966 122,269 3,061 2,746 56,891
Kesihatan dan kerja sosial
Health and social work
327 222,910 183,270 2,276 1,933 39,518
Kesenian, hiburan dan rekreasi
Arts, entertainment and recreation
238 4,107,260 3,862,382 2003 1766 50,022
Perkhidmatan lain
Other services
1,781 110,203 70,880 2,688 1,421 14,786
Jadual 2 : Penunjuk utama subsektor perkhidmatan mengikut negeri (samb.)
Table 2 : Key indicators of services sub-sectors by state (cont.)
Bilangan pekerja pada akhir
tahun
45
Total number of persons engaged
as at end of year

Subsektor
Bilangan
Pertubuhan
Pendapatan
(RM ribu)
Perbelanjaan
(RM ribu)
Gaji & upah
(RM ribu)
Sub-sector Number of
establishments
Revenue
(RM thousand)
Expenditure
(RM thousand)
Salaries & wages
(RM thousand)
Jumlah Pekerja bergaji
Total Paid employees
PERAK
Jumlah
Total
24,274 8,409,493 6,763,398 106,300 74,790 1,159,178
Pengangkutan dan penyimpanan
Transport and storage
2,422 981,119 840,958 9,958 7,481 150,255
Penginapan
Accommodation
273 318,191 276,527 5,222 4,985 69,923
Makanan dan minuman
Food and beverages
13,660 3,402,587 2,382,482 51,524 29,567 322,090
Maklumat dan komunikasi
Information and communication
17 36,247 24,976 221 220 4,211
Perkhidmatan perniagaan
Business services
1,960 1,781,294 1,532,127 13,488 11,911 212,502
Pendidikan
Education
725 446,812 446,110 7,068 6,383 165,317
Kesihatan dan kerja sosial
Health and social work
877 675,018 515,826 7,280 6,462 134,599
Kesenian, hiburan dan rekreasi
Arts, entertainment and recreation
644 413,797 499,224 4033 3327 45,782
Perkhidmatan lain
Other services
3,696 354,428 245,168 7,506 4,454 54,499
Jadual 2 : Penunjuk utama subsektor perkhidmatan mengikut negeri (samb.)
Table 2 : Key indicators of services sub-sectors by state (cont.)
Bilangan pekerja pada akhir
tahun
46
Total number of persons engaged
as at end of year

Subsektor
Bilangan
Pertubuhan
Pendapatan
(RM ribu)
Perbelanjaan
(RM ribu)
Gaji & upah
(RM ribu)
Sub-sector Number of
establishments
Revenue
(RM thousand)
Expenditure
(RM thousand)
Salaries & wages
(RM thousand)
Jumlah Pekerja bergaji
Total Paid employees
PERLIS
Jumlah
Total
2,323 423,942 341,065 9,446 6,487 75,023
Pengangkutan dan penyimpanan
Transport and storage
393 65,709 57,848 736 324 6,913
Penginapan
Accommodation
14 17,042 16,099 443 435 5,637
Makanan dan minuman
Food and beverages
1,412 210,642 160,864 5,663 3,501 31,703
Perkhidmatan perniagaan
Business services
93 49,629 40,697 1,131 1,045 12,622
Pendidikan
Education
52 39,899 31,046 706 658 10,877
Kesihatan dan kerja sosial
Health and social work
46 15,337 13,601 291 256 4,407
Kesenian, hiburan dan rekreasi
Arts, entertainment and recreation
74 6,055 5,057 100 65 656
Perkhidmatan lain
Other services
239 19,630 15,853 376 203 2,208
Table 2 : Key indicators of services sub-sectors by state (cont.)
Jadual 2 : Penunjuk utama subsektor perkhidmatan mengikut negeri (samb.)
Bilangan pekerja pada akhir
tahun
47
Total number of persons engaged
as at end of year

Subsektor
Bilangan
Pertubuhan
Pendapatan
(RM ribu)
Perbelanjaan
(RM ribu)
Gaji & upah
(RM ribu)
Sub-sector Number of
establishments
Revenue
(RM thousand)
Expenditure
(RM thousand)
Salaries & wages
(RM thousand)
Jumlah Pekerja bergaji
Total Paid employees
PULAU PINANG
Jumlah
Total
19,959 13,247,159 9,815,245 109,794 86,626 1,766,592
Pengangkutan dan penyimpanan
Transport and storage
1,709 3,005,070 1,934,619 13,731 12,369 308,183
Penginapan
Accommodation
152 796,024 639,506 7,535 7,449 155,474
Makanan dan minuman
Food and beverages
9,865 2,691,091 1,970,426 37,620 22,433 273,164
Maklumat dan komunikasi
Information and communication
57 400,880 246,244 1,495 1,493 53,039
Perkhidmatan perniagaan
Business services
2,621 3,435,225 2,586,316 17,995 16,141 370,584
Pendidikan
Education
614 374,097 590,758 6,721 6,207 154,530
Kesihatan dan kerja sosial
Health and social work
680 1,383,526 1,071,171 10,101 9,526 276,502
Kesenian, hiburan dan rekreasi
Arts, entertainment and recreation
357 350,174 257,629 2384 1998 38,219
Perkhidmatan lain
Other services
3,904 811,072 518,575 12,212 9,010 136,897
Jadual 2 : Penunjuk utama subsektor perkhidmatan mengikut negeri (samb.)
Table 2 : Key indicators of services sub-sectors by state (cont.)
Bilangan pekerja pada akhir
tahun
48
Total number of persons engaged
as at end of year

Subsektor
Bilangan
Pertubuhan
Pendapatan
(RM ribu)
Perbelanjaan
(RM ribu)
Gaji & upah
(RM ribu)
Sub-sector Number of
establishments
Revenue
(RM thousand)
Expenditure
(RM thousand)
Salaries & wages
(RM thousand)
Jumlah Pekerja bergaji
Total Paid employees
SABAH
Jumlah
Total
18,302 9,468,577 8,279,309 112,643 92,647 1,401,259
Pengangkutan dan penyimpanan
Transport and storage
6,483 2,260,314 1,903,856 24,920 18,470 388,159
Penginapan
Accommodation
348 847,929 772,958 12,878 12,694 169,128
Makanan dan minuman
Food and beverages
7,401 2,145,140 1,710,146 44,055 33,166 268,111
Maklumat dan komunikasi
Information and communication
16 216,483 104,709 339 339 5,990
Perkhidmatan perniagaan
Business services
1,591 2,965,146 2,923,533 16,346 15,518 355,502
Pendidikan
Education
246 286,274 224,715 4,161 4,058 80,675
Kesihatan dan kerja sosial
Health and social work
271 237,230 190,977 2,355 2,144 49,361
Kesenian, hiburan dan rekreasi
Arts, entertainment and recreation
482 331,630 307,045 3,587 3,118 46,301
Perkhidmatan lain
Other services
1,464 178,431 141,370 4,002 3,140 38,032
49
Total number of persons engaged
as at end of year
Jadual 2 : Penunjuk utama subsektor perkhidmatan mengikut negeri (samb.)
Table 2 : Key indicators of services sub-sectors by state (cont.)
Bilangan pekerja pada akhir
tahun

Subsektor
Bilangan
Pertubuhan
Pendapatan
(RM ribu)
Perbelanjaan
(RM ribu)
Gaji & upah
(RM ribu)
Sub-sector Number of
establishments
Revenue
(RM thousand)
Expenditure
(RM thousand)
Salaries & wages
(RM thousand)
Jumlah Pekerja bergaji
Total Paid employees
SARAWAK
Jumlah
Total
20,836 14,088,012 11,343,805 122,463 98,418 1,872,138
Pengangkutan dan penyimpanan
Transport and storage
4,881 5,479,752 4,702,475 30,150 25,795 669,917
Penginapan
Accommodation
317 474,531 413,120 7,957 7,796 106,790
Makanan dan minuman
Food and beverages
9,313 2,046,095 1,564,131 40,823 24,669 219,714
Maklumat dan komunikasi
Information and communication
21 365,423 201,273 1,138 1,137 33,325
Perkhidmatan perniagaan
Business services
2,028 3,887,280 2,940,613 21,742 20,606 480,960
Pendidikan
Education
557 442,569 385,752 7,792 7,371 170,084
Kesihatan dan kerja sosial
Health and social work
445 448,489 349,358 4,075 3,691 87,159
Kesenian, hiburan dan rekreasi
Arts, entertainment and recreation
602 564,576 497,158 2,433 2,032 30,305
Perkhidmatan lain
Other services
2,672 379,297 289,925 6,353 5,321 73,884
Jadual 2 : Penunjuk utama subsektor perkhidmatan mengikut negeri (samb.)
Table 2 : Key indicators of services sub-sectors by state (cont.)
Bilangan pekerja pada akhir
tahun
50
Total number of persons engaged
as at end of year

Subsektor
Bilangan
Pertubuhan
Pendapatan
(RM ribu)
Perbelanjaan
(RM ribu)
Gaji & upah
(RM ribu)
Sub-sector Number of
establishments
Revenue
(RM thousand)
Expenditure
(RM thousand)
Salaries & wages
(RM thousand)
Jumlah Pekerja bergaji
Total Paid employees
SELANGOR
Jumlah
Total
57,089 104,384,887 82,068,485 518,600 469,569 13,384,676
Pengangkutan dan penyimpanan
Transport and storage
7,272 42,770,155 38,472,742 125,408 120,037 4,771,444
Penginapan
Accommodation
178 1,104,060 957,771 10,236 10,174 254,009
Makanan dan minuman
Food and beverages
24,233 10,651,668 7,672,556 149,313 122,209 1,394,424
Maklumat dan komunikasi
Information and communication
1,171 22,108,456 13,200,751 53,114 53,100 2,407,656
Perkhidmatan perniagaan
Business services
10,768 18,250,650 14,175,961 91,470 84,428 2,264,808
Pendidikan
Education
1,837 3,951,895 3,244,545 30,807 29,520 1,246,498
Kesihatan dan kerja sosial
Health and social work
2,367 2,859,130 2,257,045 24,387 22,131 568,935
Kesenian, hiburan dan rekreasi
Arts, entertainment and recreation
992 1,348,380 1,062,483 10,056 9,476 202,657
Perkhidmatan lain
Other services
8,271 1,340,493 1,024,631 23,809 18,494 274,245
Jadual 2 : Penunjuk utama subsektor perkhidmatan mengikut negeri (samb.)
Table 2 : Key indicators of services sub-sectors by state (cont.)
Bilangan pekerja pada akhir
tahun
51
Total number of persons engaged
as at end of year
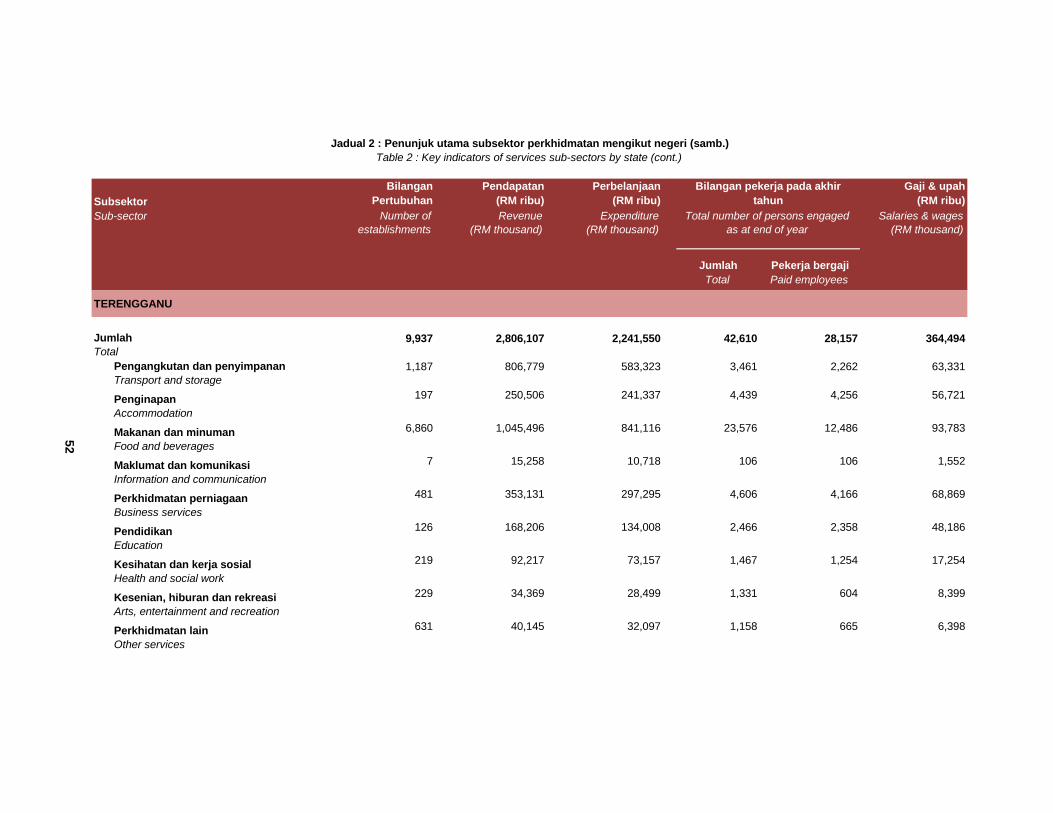
Subsektor
Bilangan
Pertubuhan
Pendapatan
(RM ribu)
Perbelanjaan
(RM ribu)
Gaji & upah
(RM ribu)
Sub-sector Number of
establishments
Revenue
(RM thousand)
Expenditure
(RM thousand)
Salaries & wages
(RM thousand)
Jumlah Pekerja bergaji
Total Paid employees
TERENGGANU
Jumlah
Total
9,937 2,806,107 2,241,550 42,610 28,157 364,494
Pengangkutan dan penyimpanan
Transport and storage
1,187 806,779 583,323 3,461 2,262 63,331
Penginapan
Accommodation
197 250,506 241,337 4,439 4,256 56,721
Makanan dan minuman
Food and beverages
6,860 1,045,496 841,116 23,576 12,486 93,783
Maklumat dan komunikasi
Information and communication
7 15,258 10,718 106 106 1,552
Perkhidmatan perniagaan
Business services
481 353,131 297,295 4,606 4,166 68,869
Pendidikan
Education
126 168,206 134,008 2,466 2,358 48,186
Kesihatan dan kerja sosial
Health and social work
219 92,217 73,157 1,467 1,254 17,254
Kesenian, hiburan dan rekreasi
Arts, entertainment and recreation
229 34,369 28,499 1,331 604 8,399
Perkhidmatan lain
Other services
631 40,145 32,097 1,158 665 6,398
Table 2 : Key indicators of services sub-sectors by state (cont.)
Jadual 2 : Penunjuk utama subsektor perkhidmatan mengikut negeri (samb.)
Bilangan pekerja pada akhir
tahun
52
Total number of persons engaged
as at end of year
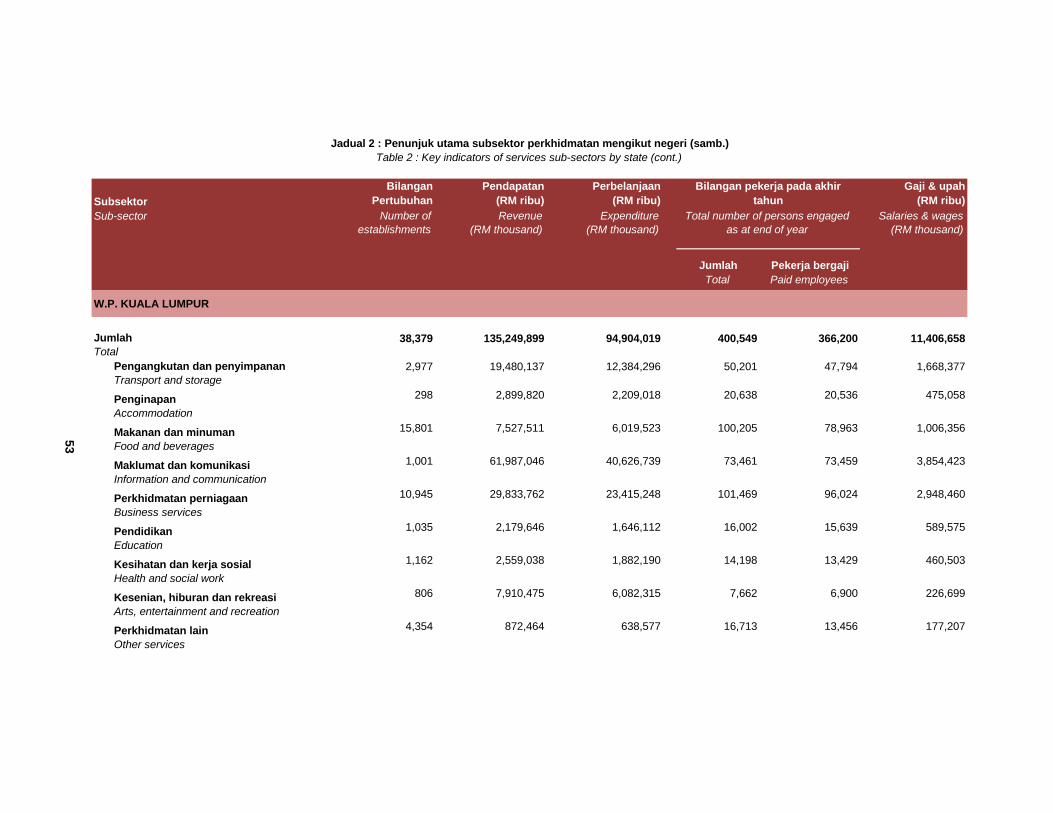
Subsektor
Bilangan
Pertubuhan
Pendapatan
(RM ribu)
Perbelanjaan
(RM ribu)
Gaji & upah
(RM ribu)
Sub-sector Number of
establishments
Revenue
(RM thousand)
Expenditure
(RM thousand)
Salaries & wages
(RM thousand)
Jumlah Pekerja bergaji
Total Paid employees
W.P. KUALA LUMPUR
Jumlah
Total
38,379 135,249,899 94,904,019 400,549 366,200 11,406,658
Pengangkutan dan penyimpanan
Transport and storage
2,977 19,480,137 12,384,296 50,201 47,794 1,668,377
Penginapan
Accommodation
298 2,899,820 2,209,018 20,638 20,536 475,058
Makanan dan minuman
Food and beverages
15,801 7,527,511 6,019,523 100,205 78,963 1,006,356
Maklumat dan komunikasi
Information and communication
1,001 61,987,046 40,626,739 73,461 73,459 3,854,423
Perkhidmatan perniagaan
Business services
10,945 29,833,762 23,415,248 101,469 96,024 2,948,460
Pendidikan
Education
1,035 2,179,646 1,646,112 16,002 15,639 589,575
Kesihatan dan kerja sosial
Health and social work
1,162 2,559,038 1,882,190 14,198 13,429 460,503
Kesenian, hiburan dan rekreasi
Arts, entertainment and recreation
806 7,910,475 6,082,315 7,662 6,900 226,699
Perkhidmatan lain
Other services
4,354 872,464 638,577 16,713 13,456 177,207
Jadual 2 : Penunjuk utama subsektor perkhidmatan mengikut negeri (samb.)
Table 2 : Key indicators of services sub-sectors by state (cont.)
Bilangan pekerja pada akhir
tahun
53
Total number of persons engaged
as at end of year

Subsektor
Bilangan
Pertubuhan
Pendapatan
(RM ribu)
Perbelanjaan
(RM ribu)
Gaji & upah
(RM ribu)
Sub-sector Number of
establishments
Revenue
(RM thousand)
Expenditure
(RM thousand)
Salaries & wages
(RM thousand)
Jumlah Pekerja bergaji
Total Paid employees
W.P. LABUAN
Jumlah
Total
961 417,187 324,666 6,853 5,795 87,031
Pengangkutan dan penyimpanan
Transport and storage
289 109,993 85,660 986 709 14,555
Penginapan
Accommodation
21 74,807 43,478 806 797 10,888
Makanan dan minuman
Food and beverages
376 139,524 113,100 2,735 2,152 23,280
Perkhidmatan perniagaan
Business services
76 53,884 51,661 1,553 1,509 29,697
Pendidikan
Education
26 6,212 5,251 163 149 1,802
Kesihatan dan kerja sosial
Health and social work
15 11,495 8,983 127 118 2,467
Kesenian, hiburan dan rekreasi
Arts, entertainment and recreation
82 6,893 5,217 194 134 1,534
Perkhidmatan lain
Other services
76 14,379 11,316 289 227 2,807
54
Total number of persons engaged
as at end of year
Jadual 2 : Penunjuk utama subsektor perkhidmatan mengikut negeri (samb.)
Table 2 : Key indicators of services sub-sectors by state (cont.)
Bilangan pekerja pada akhir
tahun

Subsektor
Bilangan
Pertubuhan
Pendapatan
(RM ribu)
Perbelanjaan
(RM ribu)
Gaji & upah
(RM ribu)
Sub-sector Number of
establishments
Revenue
(RM thousand)
Expenditure
(RM thousand)
Salaries & wages
(RM thousand)
Jumlah Pekerja bergaji
Total Paid employees
W.P. PUTRAJAYA
Jumlah
Total
382 740,538 659,983 3,941 3,677 66,013
Pengangkutan dan penyimpanan
Transport and storage
17 8,112 7,257 111 92 1,853
Penginapan
Accommodation
4 102,832 96,325 941 941 23,265
Makanan dan minuman
Food and beverages
179 186,441 139,384 1,952 1,802 23,543
Perkhidmatan perniagaan
Business services
35 412,895 392,789 355 336 10,596
Pendidikan
Education
13 6,774 5,296 93 80 1,357
Kesihatan dan kerja sosial
Health and social work
34 9,399 7,711 284 258 3,153
Kesenian, hiburan dan rekreasi
Arts, entertainment and recreation
9 6,235 5,023 89 87 1,081
Perkhidmatan lain
Other services
91 7,851 6,198 116 81 1,165
Jadual 2 : Penunjuk utama subsektor perkhidmatan mengikut negeri (samb.)
Table 2 : Key indicators of services sub-sectors by state (cont.)
Bilangan pekerja pada akhir
tahun
55
Total number of persons engaged
as at end of year

Subsektor
Hak milik
perseorangan
Perkongsian Syarikat
sendirian berhad
Syarikat awam
berhad
Syarikat
koperasi
Perbadanan
awam
Pertubuhan
persendirian tidak
mencari keuntungan
Lain-lain
Sub-sector Individual
proprietorship
Partnership Private limited
company
Public limited
company
Co-operative Public
corporation
Private non-profit
making organisation
Others
BILANGAN PERTUBUHAN / NUMBER OF ESTABLISHMENTS
Jumlah
Total
217,733 17,835 47,388 866 195 26 9,409 2,254
Pengangkutan dan penyimpanan
Transport and storage
33,124 1,600 5,792 29 47
12
- 5
Penginapan
Accommodation
1,208 505 1,378 23 3 -
Makanan dan minuman
Food and beverages
132,521 5,363 7,394 27 15 - -
Maklumat dan komunikasi
Information and communication
168 61 2,124 26 - - 3 -
Kewangan
Financial
99 54 4,717 641 109 21
Perkhidmatan perniagaan
Business services
14,291 5,716 18,167 73
8
4
Pendidikan
Education
4,727 1,176 1,701 -
14
536 37
Kesihatan dan kerja sosial
Health and social work
6,255 685 1,898 - - 314 -
Kesenian, hiburan dan rekreasi
Arts, entertainment and recreation
3482 611 1033 47 - - 1,134
Perkhidmatan lain
Other services
21,858 2,064 3,184 - 13 8,556 1,053
Jadual 3 : Taraf sah organisasi mengikut subsektor
Table 3 : Legal organisation by sub-sector
56
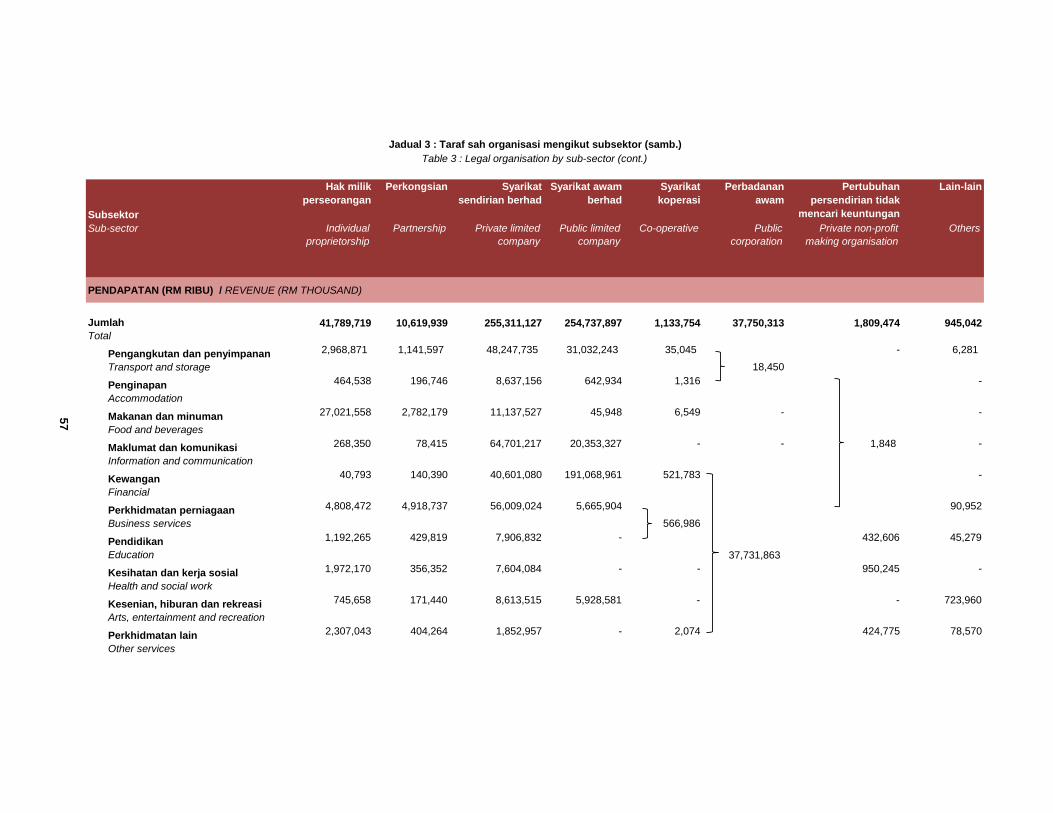
Subsektor
Hak milik
perseorangan
Perkongsian Syarikat
sendirian berhad
Syarikat awam
berhad
Syarikat
koperasi
Perbadanan
awam
Pertubuhan
persendirian tidak
mencari keuntungan
Lain-lain
Sub-sector Individual
proprietorship
Partnership Private limited
company
Public limited
company
Co-operative Public
corporation
Private non-profit
making organisation
Others
PENDAPATAN (RM RIBU) / REVENUE (RM THOUSAND)
Jumlah
Total
41,789,719 10,619,939 255,311,127 254,737,897 1,133,754 37,750,313 1,809,474 945,042
Pengangkutan dan penyimpanan
Transport and storage
2,968,871 1,141,597 48,247,735 31,032,243 35,045
18,450
- 6,281
Penginapan
Accommodation
464,538 196,746 8,637,156 642,934 1,316 -
Makanan dan minuman
Food and beverages
27,021,558 2,782,179 11,137,527 45,948 6,549 - -
Maklumat dan komunikasi
Information and communication
268,350 78,415 64,701,217 20,353,327 - - 1,848 -
Kewangan
Financial
40,793 140,390 40,601,080 191,068,961 521,783 -
Perkhidmatan perniagaan
Business services
4,808,472 4,918,737 56,009,024 5,665,904
566,986
90,952
Pendidikan
Education
1,192,265 429,819 7,906,832 -
37,731,863
432,606 45,279
Kesihatan dan kerja sosial
Health and social work
1,972,170 356,352 7,604,084 - - 950,245 -
Kesenian, hiburan dan rekreasi
Arts, entertainment and recreation
745,658 171,440 8,613,515 5,928,581 - - 723,960
Perkhidmatan lain
Other services
2,307,043 404,264 1,852,957 - 2,074 424,775 78,570
Jadual 3 : Taraf sah organisasi mengikut subsektor (samb.)
Table 3 : Legal organisation by sub-sector (cont.)
57

Subsektor
Hak milik
perseorangan
Perkongsian Syarikat
sendirian berhad
Syarikat awam
berhad
Syarikat
koperasi
Perbadanan
awam
Pertubuhan
persendirian tidak
mencari keuntungan
Lain-lain
Sub-sector Individual
proprietorship
Partnership Private limited
company
Public limited
company
Co-operative Public
corporation
Private non-profit
making organisation
Others
BILANGAN PEKERJA / TOTAL NUMBER OF PERSONS ENGAGED
Jumlah
Total
788,073 146,918 879,893 277,332 2,181 23,128 21,515 11,131
Pengangkutan dan penyimpanan
Transport and storage
55,566 11,387 184,331 60,239 994 - 106
Penginapan
Accommodation
8,972 4,610 90,044 6,722 25 457 -
Makanan dan minuman
Food and beverages
516,507 41,519 122,085 636 108 - -
Maklumat dan komunikasi
Information and communication
1,126 532 114,950 14,519 - - 51 -
Kewangan
Financial
418 441 34,054 187,604 974 52
Perkhidmatan perniagaan
Business services
72,046 60,182 196,349 2,906
44
229
Pendidikan
Education
28,938 10,827 58,150 -
22,671
9,339 658
Kesihatan dan kerja sosial
Health and social work
31,951 4,824 45,647 - - 7,520 -
Kesenian, hiburan dan rekreasi
Arts, entertainment and recreation
11,839 3,304 13,982 4,706 - - 9,569
Perkhidmatan lain
Other services
60,710 9,292 20,301 - 36 4,605 517
Jadual 3 : Taraf sah organisasi mengikut subsektor (samb.)
Table 3 : Legal organisation by sub-sector (cont.)
58
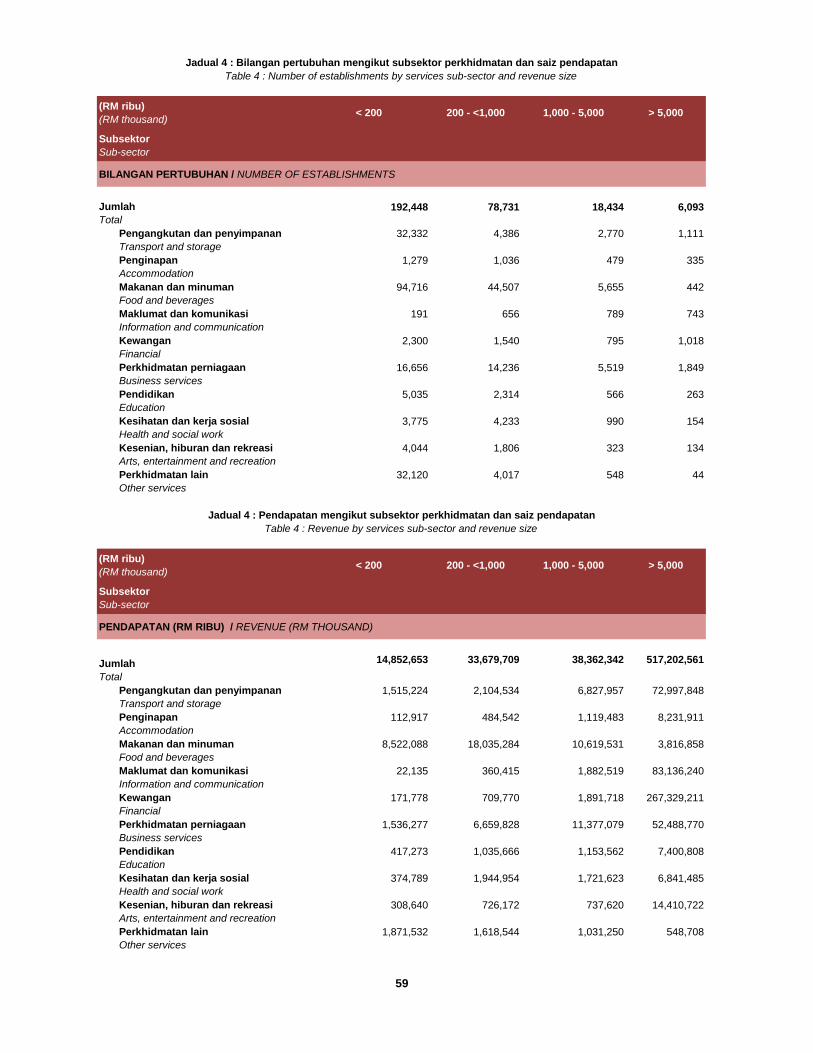
(RM ribu)
(RM thousand)< 200 200 - <1,000 1,000 - 5,000 > 5,000
Subsektor
Sub-sector
BILANGAN PERTUBUHAN / NUMBER OF ESTABLISHMENTS
Jumlah
Total
192,448 78,731 18,434 6,093
Pengangkutan dan penyimpanan
Transport and storage
32,332 4,386 2,770 1,111
Penginapan
Accommodation
1,279 1,036 479 335
Makanan dan minuman
Food and beverages
94,716 44,507 5,655 442
Maklumat dan komunikasi
Information and communication
191 656 789 743
Kewangan
Financial
2,300 1,540 795 1,018
Perkhidmatan perniagaan
Business services
16,656 14,236 5,519 1,849
Pendidikan
Education
5,035 2,314 566 263
Kesihatan dan kerja sosial
Health and social work
3,775 4,233 990 154
Kesenian, hiburan dan rekreasi
Arts, entertainment and recreation
4,044 1,806 323 134
Perkhidmatan lain
Other services
32,120 4,017 548 44
(RM ribu)
(RM thousand)< 200 200 - <1,000 1,000 - 5,000 > 5,000
Subsektor
Sub-sector
PENDAPATAN (RM RIBU) / REVENUE (RM THOUSAND)
Jumlah
Total
14,852,653 33,679,709 38,362,342 517,202,561
Pengangkutan dan penyimpanan
Transport and storage
1,515,224 2,104,534 6,827,957 72,997,848
Penginapan
Accommodation
112,917 484,542 1,119,483 8,231,911
Makanan dan minuman
Food and beverages
8,522,088 18,035,284 10,619,531 3,816,858
Maklumat dan komunikasi
Information and communication
22,135 360,415 1,882,519 83,136,240
Kewangan
Financial
171,778 709,770 1,891,718 267,329,211
Perkhidmatan perniagaan
Business services
1,536,277 6,659,828 11,377,079 52,488,770
Pendidikan
Education
417,273 1,035,666 1,153,562 7,400,808
Kesihatan dan kerja sosial
Health and social work
374,789 1,944,954 1,721,623 6,841,485
Kesenian, hiburan dan rekreasi
Arts, entertainment and recreation
308,640 726,172 737,620 14,410,722
Perkhidmatan lain
Other services
1,871,532 1,618,544 1,031,250 548,708
Jadual 4 : Bilangan pertubuhan mengikut subsektor perkhidmatan dan saiz pendapatan
Table 4 : Number of establishments by services sub-sector and revenue size
Jadual 4 : Pendapatan mengikut subsektor perkhidmatan dan saiz pendapatan
Table 4 : Revenue by services sub-sector and revenue size
59

(RM ribu)
(RM thousand)< 200 200 - <1,000 1,000 - 5,000 > 5,000
Subsektor
Sub-sector
BILANGAN PEKERJA / TOTAL NUMBER OF PERSONS ENGAGED
Jumlah
Total
486,120 527,869 324,884 811,298
Pengangkutan dan penyimpanan
Transport and storage
45,585 29,719 56,180 181,478
Penginapan
Accommodation
5,344 11,442 19,803 73,946
Makanan dan minuman
Food and beverages
258,303 291,630 105,061 25,861
Maklumat dan komunikasi
Information and communication
404 3,027 9,173 118,523
Kewangan
Financial
5,533 6,861 6,651 226,955
Perkhidmatan perniagaan
Business services
59,688 101,232 83,932 87,069
Pendidikan
Education
23,040 23,695 17,209 43,995
Kesihatan dan kerja sosial
Health and social work
14,292 25,827 12,213 37,610
Kesenian, hiburan dan rekreasi
Arts, entertainment and recreation
10,920 10,328 8,029 14,123
Perkhidmatan lain
Other services
63,011 24,108 6,633 1,738
Jadual 4 : Bilangan pekerja mengikut subsektor perkhidmatan dan saiz pendapatan
Table 4 : Total number of persons engaged by services sub-sector and revenue size
60
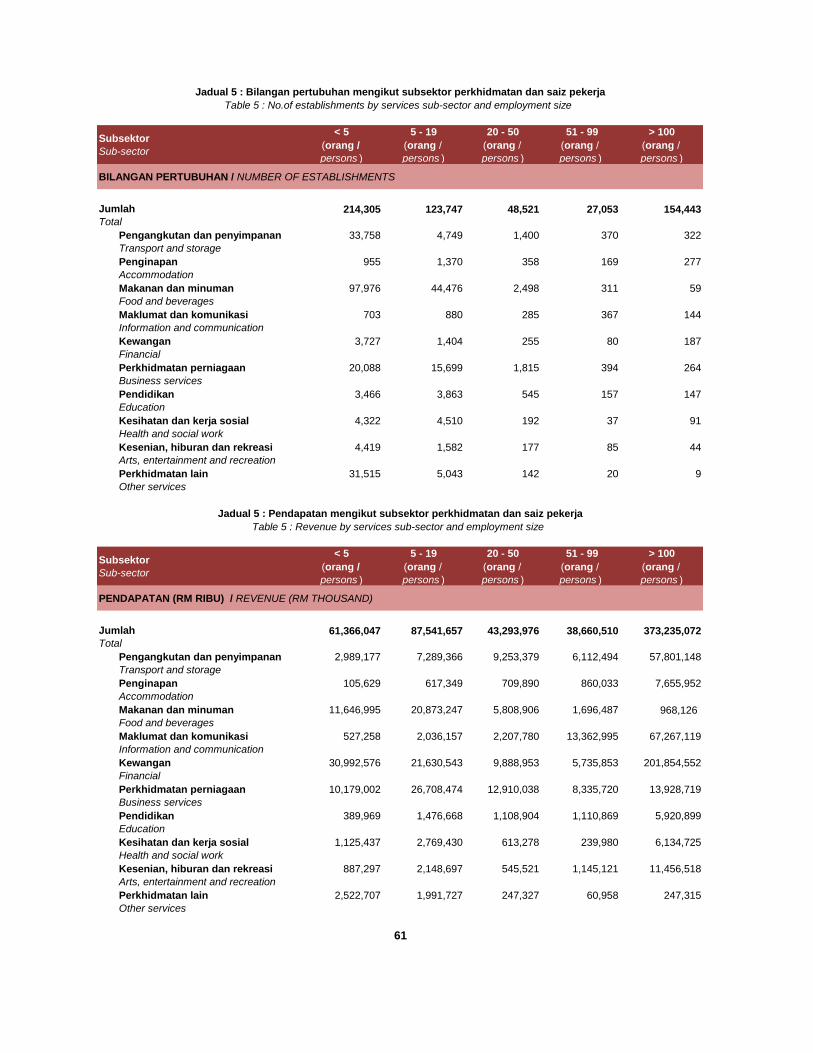
Subsektor
Sub-sector
< 5
(orang /
persons )
5 - 19
(orang /
persons )
20 - 50
(orang /
persons )
51 - 99
(orang /
persons )
> 100
(orang /
persons )
BILANGAN PERTUBUHAN / NUMBER OF ESTABLISHMENTS
Jumlah
Total
214,305 123,747 48,521 27,053 154,443
Pengangkutan dan penyimpanan
Transport and storage
33,758 4,749 1,400 370 322
Penginapan
Accommodation
955 1,370 358 169 277
Makanan dan minuman
Food and beverages
97,976 44,476 2,498 311 59
Maklumat dan komunikasi
Information and communication
703 880 285 367 144
Kewangan
Financial
3,727 1,404 255 80 187
Perkhidmatan perniagaan
Business services
20,088 15,699 1,815 394 264
Pendidikan
Education
3,466 3,863 545 157 147
Kesihatan dan kerja sosial
Health and social work
4,322 4,510 192 37 91
Kesenian, hiburan dan rekreasi
Arts, entertainment and recreation
4,419 1,582 177 85 44
Perkhidmatan lain
Other services
31,515 5,043 142 20 9
Subsektor
Sub-sector
< 5
(orang /
persons )
5 - 19
(orang /
persons )
20 - 50
(orang /
persons )
51 - 99
(orang /
persons )
> 100
(orang /
persons )
PENDAPATAN (RM RIBU) / REVENUE (RM THOUSAND)
Jumlah
Total
61,366,047 87,541,657 43,293,976 38,660,510 373,235,072
Pengangkutan dan penyimpanan
Transport and storage
2,989,177 7,289,366 9,253,379 6,112,494 57,801,148
Penginapan
Accommodation
105,629 617,349 709,890 860,033 7,655,952
Makanan dan minuman
Food and beverages
11,646,995 20,873,247 5,808,906 1,696,487 968,126
Maklumat dan komunikasi
Information and communication
527,258 2,036,157 2,207,780 13,362,995 67,267,119
Kewangan
Financial
30,992,576 21,630,543 9,888,953 5,735,853 201,854,552
Perkhidmatan perniagaan
Business services
10,179,002 26,708,474 12,910,038 8,335,720 13,928,719
Pendidikan
Education
389,969 1,476,668 1,108,904 1,110,869 5,920,899
Kesihatan dan kerja sosial
Health and social work
1,125,437 2,769,430 613,278 239,980 6,134,725
Kesenian, hiburan dan rekreasi
Arts, entertainment and recreation
887,297 2,148,697 545,521 1,145,121 11,456,518
Perkhidmatan lain
Other services
2,522,707 1,991,727 247,327 60,958 247,315
Jadual 5 : Bilangan pertubuhan mengikut subsektor perkhidmatan dan saiz pekerja
Table 5 : No.of establishments by services sub-sector and employment size
Jadual 5 : Pendapatan mengikut subsektor perkhidmatan dan saiz pekerja
Table 5 : Revenue by services sub-sector and employment size
61
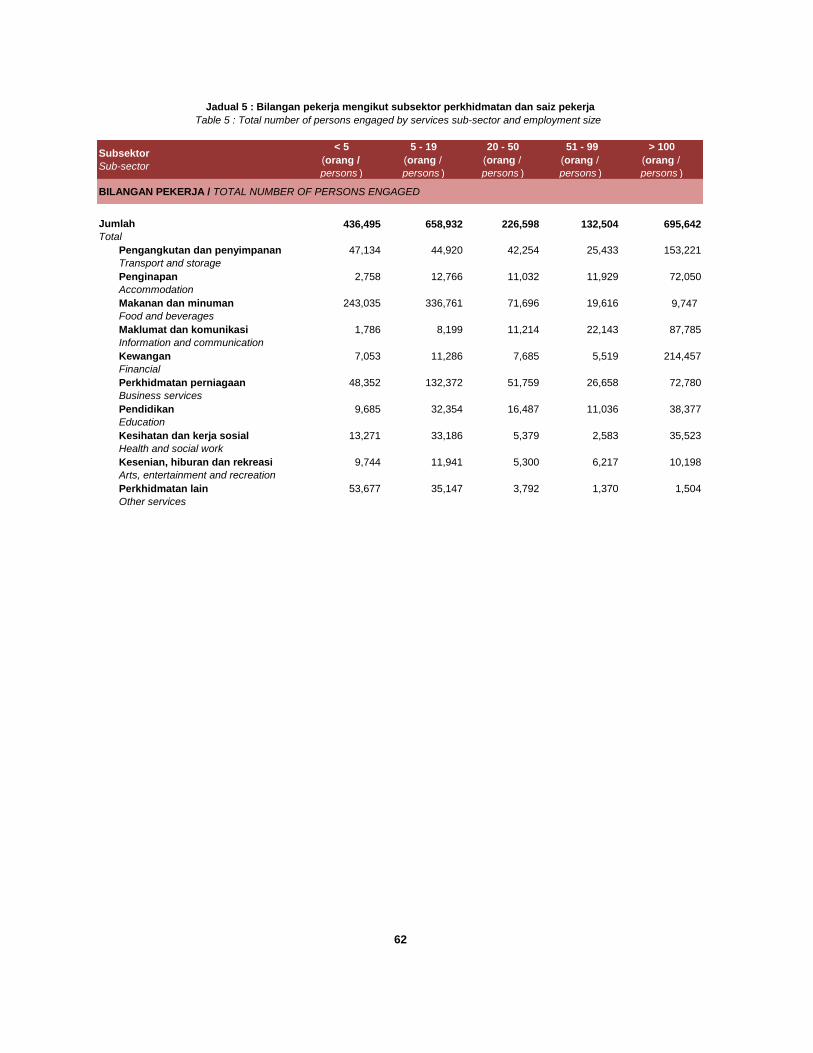
Subsektor
Sub-sector
< 5
(orang /
persons )
5 - 19
(orang /
persons )
20 - 50
(orang /
persons )
51 - 99
(orang /
persons )
> 100
(orang /
persons )
BILANGAN PEKERJA / TOTAL NUMBER OF PERSONS ENGAGED
Jumlah
Total
436,495 658,932 226,598 132,504 695,642
Pengangkutan dan penyimpanan
Transport and storage
47,134 44,920 42,254 25,433 153,221
Penginapan
Accommodation
2,758 12,766 11,032 11,929 72,050
Makanan dan minuman
Food and beverages
243,035 336,761 71,696 19,616 9,747
Maklumat dan komunikasi
Information and communication
1,786 8,199 11,214 22,143 87,785
Kewangan
Financial
7,053 11,286 7,685 5,519 214,457
Perkhidmatan perniagaan
Business services
48,352 132,372 51,759 26,658 72,780
Pendidikan
Education
9,685 32,354 16,487 11,036 38,377
Kesihatan dan kerja sosial
Health and social work
13,271 33,186 5,379 2,583 35,523
Kesenian, hiburan dan rekreasi
Arts, entertainment and recreation
9,744 11,941 5,300 6,217 10,198
Perkhidmatan lain
Other services
53,677 35,147 3,792 1,370 1,504
Jadual 5 : Bilangan pekerja mengikut subsektor perkhidmatan dan saiz pekerja
Table 5 : Total number of persons engaged by services sub-sector and employment size
62
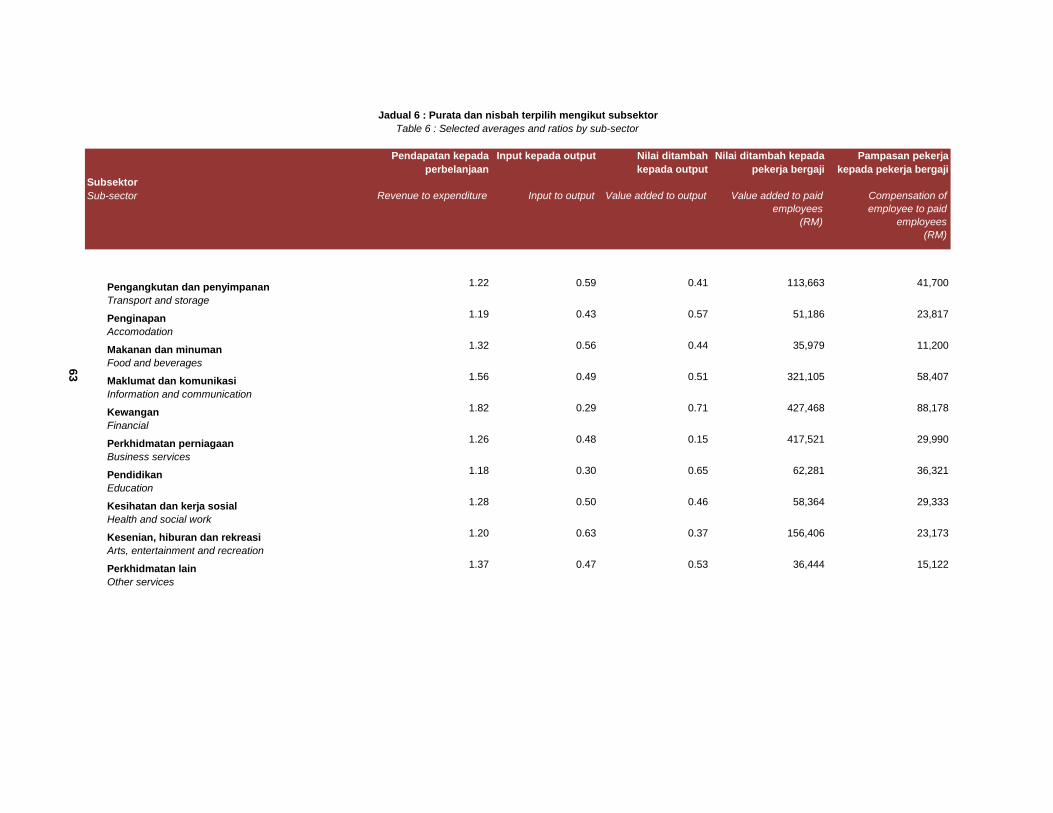
Subsektor
Pendapatan kepada
perbelanjaan
Input kepada output Nilai ditambah
kepada output
Nilai ditambah kepada
pekerja bergaji
Pampasan pekerja
kepada pekerja bergaji
Sub-sector Revenue to expenditure Input to output Value added to output Value added to paid
employees
(RM)
Compensation of
employee to paid
employees
(RM)
Pengangkutan dan penyimpanan
Transport and storage
1.22 0.59 0.41 113,663 41,700
Penginapan
Accomodation
1.19 0.43 0.57 51,186 23,817
Makanan dan minuman
Food and beverages
1.32 0.56 0.44 35,979 11,200
Maklumat dan komunikasi
Information and communication
1.56 0.49 0.51 321,105 58,407
Kewangan
Financial
1.82 0.29 0.71 427,468 88,178
Perkhidmatan perniagaan
Business services
1.26 0.48 0.15 417,521 29,990
Pendidikan
Education
1.18 0.30 0.65 62,281 36,321
Kesihatan dan kerja sosial
Health and social work
1.28 0.50 0.46 58,364 29,333
Kesenian, hiburan dan rekreasi
Arts, entertainment and recreation
1.20 0.63 0.37 156,406 23,173
Perkhidmatan lain
Other services
1.37 0.47 0.53 36,444 15,122
Jadual 6 : Purata dan nisbah terpilih mengikut subsektor
Table 6 : Selected averages and ratios by sub-sector
63

LAMPIRAN APPENDIX
PIAWAIAN KLASIFIKASI INDUSTRI MALAYSIA
(MSIC) 2008 Ver.1.0 MALAYSIA STANDARD INDUSTRIAL
CLASSIFICATION (MSIC) 2008 Ver.1.0

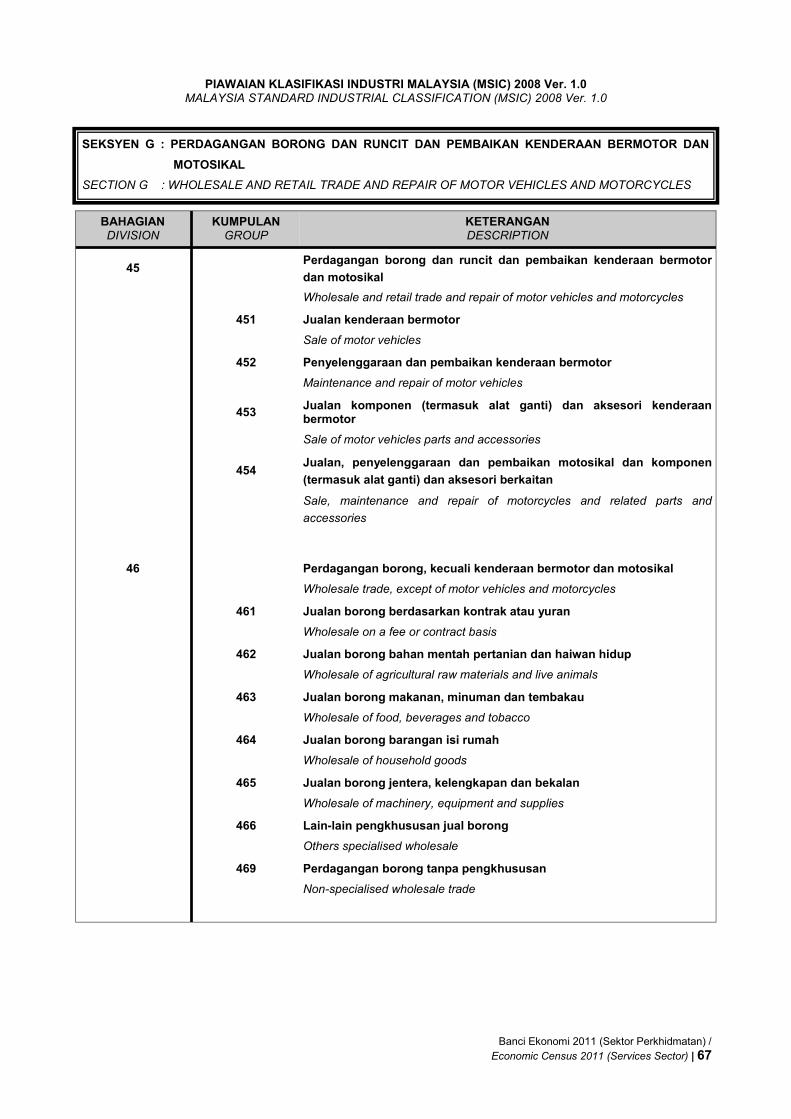
PIAWAIAN KLASIFIKASI INDUSTRI MALAYSIA (MSIC) 2008 Ver. 1.0 MALAYSIA STANDARD INDUSTRIAL CLASSIFICATION (MSIC) 2008 Ver. 1.0
BAHAGIAN DIVISION
KUMPULAN GROUP
KETERANGAN DESCRIPTION
45 Perdagangan borong dan runcit dan pembaikan kenderaan bermotor
dan motosikal
Wholesale and retail trade and repair of motor vehicles and motorcycles
451 Jualan kenderaan bermotor
Sale of motor vehicles
452 Penyelenggaraan dan pembaikan kenderaan bermotor
Maintenance and repair of motor vehicles
453 Jualan komponen (termasuk alat ganti) dan aksesori kenderaan bermotor
Sale of motor vehicles parts and accessories
454 Jualan, penyelenggaraan dan pembaikan motosikal dan komponen
(termasuk alat ganti) dan aksesori berkaitan
Sale, maintenance and repair of motorcycles and related parts and
accessories
46 Perdagangan borong, kecuali kenderaan bermotor dan motosikal
Wholesale trade, except of motor vehicles and motorcycles
461 Jualan borong berdasarkan kontrak atau yuran
Wholesale on a fee or contract basis
462 Jualan borong bahan mentah pertanian dan haiwan hidup
Wholesale of agricultural raw materials and live animals
463 Jualan borong makanan, minuman dan tembakau
Wholesale of food, beverages and tobacco
464 Jualan borong barangan isi rumah
Wholesale of household goods
465 Jualan borong jentera, kelengkapan dan bekalan
Wholesale of machinery, equipment and supplies
466 Lain-lain pengkhususan jual borong
Others specialised wholesale
469 Perdagangan borong tanpa pengkhususan
Non-specialised wholesale trade
SEKSYEN G : PERDAGANGAN BORONG DAN RUNCIT DAN PEMBAIKAN KENDERAAN BERMOTOR DAN
MOTOSIKAL
SECTION G : WHOLESALE AND RETAIL TRADE AND REPAIR OF MOTOR VEHICLES AND MOTORCYCLES
Banci Ekonomi 2011 (Sektor Perkhidmatan) /
Economic Census 2011 (Services Sector) | 67
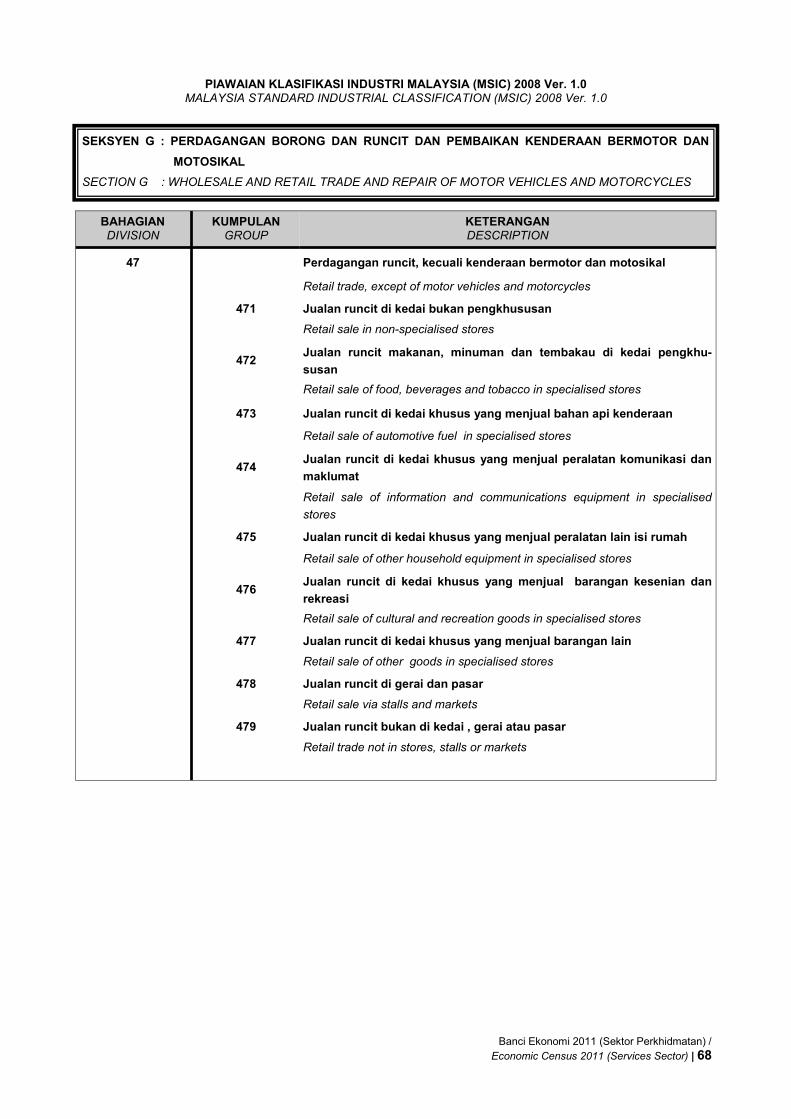
PIAWAIAN KLASIFIKASI INDUSTRI MALAYSIA (MSIC) 2008 Ver. 1.0 MALAYSIA STANDARD INDUSTRIAL CLASSIFICATION (MSIC) 2008 Ver. 1.0
BAHAGIAN DIVISION
KUMPULAN GROUP
KETERANGAN DESCRIPTION
47 Perdagangan runcit, kecuali kenderaan bermotor dan motosikal
Retail trade, except of motor vehicles and motorcycles
471 Jualan runcit di kedai bukan pengkhususan
Retail sale in non-specialised stores
472 Jualan runcit makanan, minuman dan tembakau di kedai pengkhu-
susan
Retail sale of food, beverages and tobacco in specialised stores
473 Jualan runcit di kedai khusus yang menjual bahan api kenderaan
Retail sale of automotive fuel in specialised stores
474 Jualan runcit di kedai khusus yang menjual peralatan komunikasi dan
maklumat
Retail sale of information and communications equipment in specialised
stores
475 Jualan runcit di kedai khusus yang menjual peralatan lain isi rumah
Retail sale of other household equipment in specialised stores
476 Jualan runcit di kedai khusus yang menjual barangan kesenian dan
rekreasi
Retail sale of cultural and recreation goods in specialised stores
477 Jualan runcit di kedai khusus yang menjual barangan lain
Retail sale of other goods in specialised stores
478 Jualan runcit di gerai dan pasar
Retail sale via stalls and markets
479 Jualan runcit bukan di kedai , gerai atau pasar
Retail trade not in stores, stalls or markets
SEKSYEN G : PERDAGANGAN BORONG DAN RUNCIT DAN PEMBAIKAN KENDERAAN BERMOTOR DAN
MOTOSIKAL
SECTION G : WHOLESALE AND RETAIL TRADE AND REPAIR OF MOTOR VEHICLES AND MOTORCYCLES
Banci Ekonomi 2011 (Sektor Perkhidmatan) /
Economic Census 2011 (Services Sector) | 68
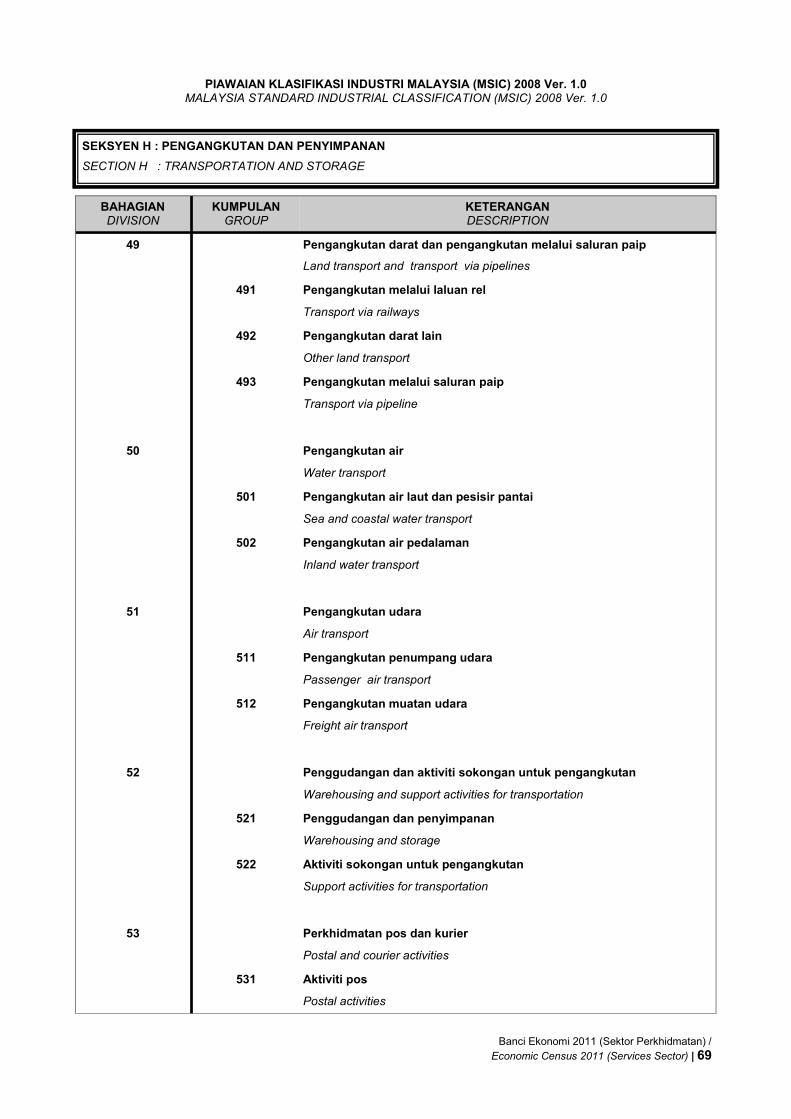
PIAWAIAN KLASIFIKASI INDUSTRI MALAYSIA (MSIC) 2008 Ver. 1.0 MALAYSIA STANDARD INDUSTRIAL CLASSIFICATION (MSIC) 2008 Ver. 1.0
BAHAGIAN DIVISION
KUMPULAN GROUP
KETERANGAN DESCRIPTION
49 Pengangkutan darat dan pengangkutan melalui saluran paip
Land transport and transport via pipelines
491 Pengangkutan melalui laluan rel
Transport via railways
492 Pengangkutan darat lain
Other land transport
493 Pengangkutan melalui saluran paip
Transport via pipeline
50 Pengangkutan air
Water transport
501 Pengangkutan air laut dan pesisir pantai
Sea and coastal water transport
502 Pengangkutan air pedalaman
Inland water transport
51 Pengangkutan udara
Air transport
511 Pengangkutan penumpang udara
Passenger air transport
512 Pengangkutan muatan udara
Freight air transport
52 Penggudangan dan aktiviti sokongan untuk pengangkutan
Warehousing and support activities for transportation
521 Penggudangan dan penyimpanan
Warehousing and storage
522 Aktiviti sokongan untuk pengangkutan
Support activities for transportation
53 Perkhidmatan pos dan kurier
Postal and courier activities
531 Aktiviti pos
Postal activities
SEKSYEN H : PENGANGKUTAN DAN PENYIMPANAN
SECTION H : TRANSPORTATION AND STORAGE
Banci Ekonomi 2011 (Sektor Perkhidmatan) /
Economic Census 2011 (Services Sector) | 69
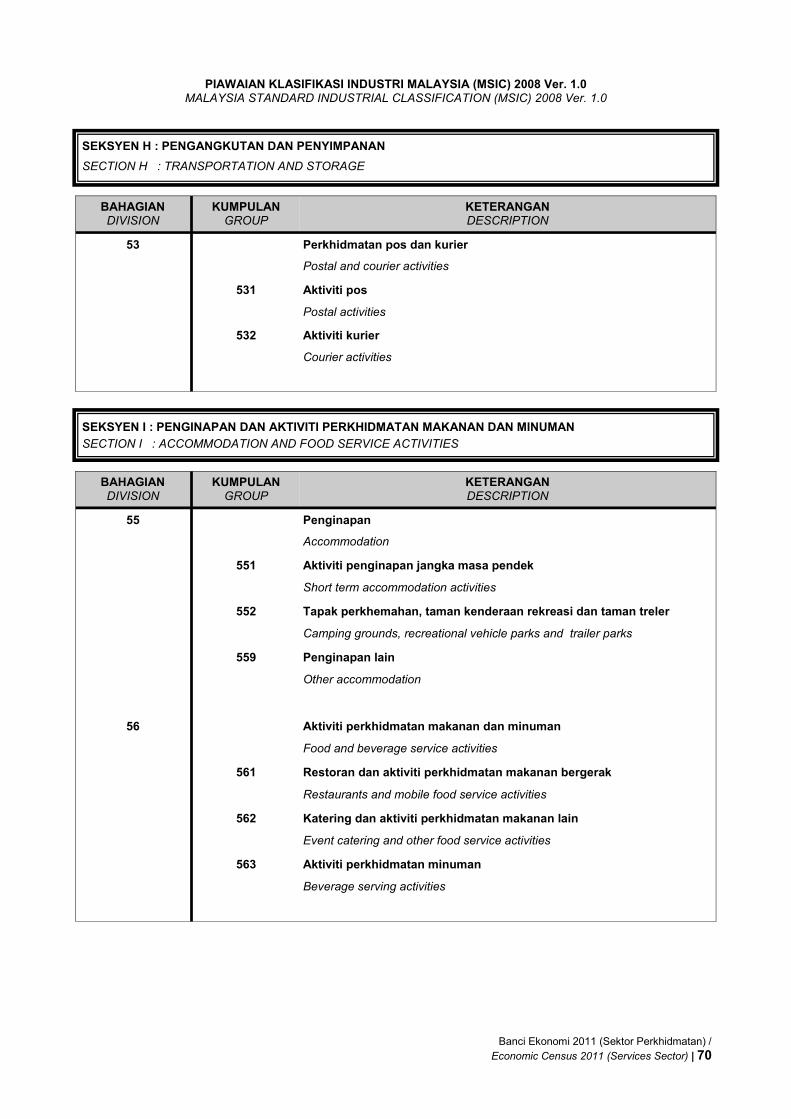
PIAWAIAN KLASIFIKASI INDUSTRI MALAYSIA (MSIC) 2008 Ver. 1.0 MALAYSIA STANDARD INDUSTRIAL CLASSIFICATION (MSIC) 2008 Ver. 1.0
BAHAGIAN DIVISION
KUMPULAN GROUP
KETERANGAN DESCRIPTION
53 Perkhidmatan pos dan kurier
Postal and courier activities
531 Aktiviti pos
Postal activities
532 Aktiviti kurier
Courier activities
SEKSYEN I : PENGINAPAN DAN AKTIVITI PERKHIDMATAN MAKANAN DAN MINUMAN
SECTION I : ACCOMMODATION AND FOOD SERVICE ACTIVITIES
SEKSYEN H : PENGANGKUTAN DAN PENYIMPANAN
SECTION H : TRANSPORTATION AND STORAGE
BAHAGIAN DIVISION
KUMPULAN GROUP
KETERANGAN DESCRIPTION
55 Penginapan
Accommodation
551 Aktiviti penginapan jangka masa pendek
Short term accommodation activities
552 Tapak perkhemahan, taman kenderaan rekreasi dan taman treler
Camping grounds, recreational vehicle parks and trailer parks
559 Penginapan lain
Other accommodation
56 Aktiviti perkhidmatan makanan dan minuman
Food and beverage service activities
561 Restoran dan aktiviti perkhidmatan makanan bergerak
Restaurants and mobile food service activities
562 Katering dan aktiviti perkhidmatan makanan lain
Event catering and other food service activities
563 Aktiviti perkhidmatan minuman
Beverage serving activities
Banci Ekonomi 2011 (Sektor Perkhidmatan) /
Economic Census 2011 (Services Sector) | 70
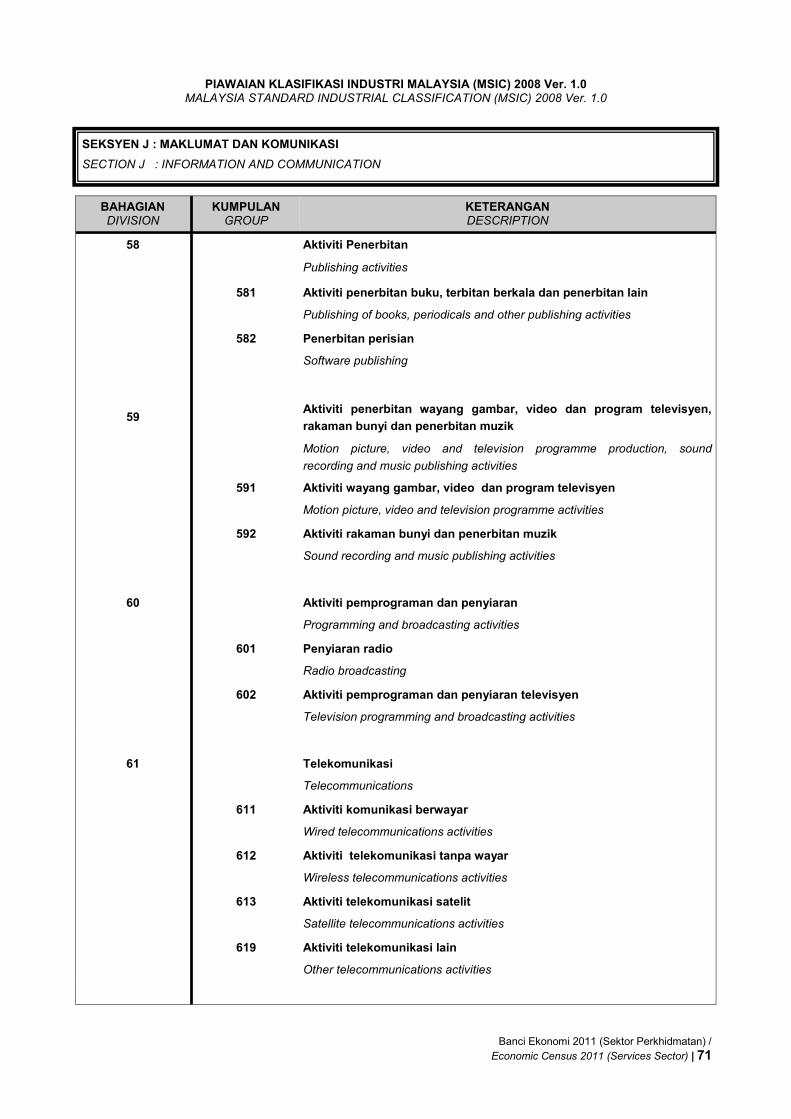
PIAWAIAN KLASIFIKASI INDUSTRI MALAYSIA (MSIC) 2008 Ver. 1.0 MALAYSIA STANDARD INDUSTRIAL CLASSIFICATION (MSIC) 2008 Ver. 1.0
BAHAGIAN DIVISION
KUMPULAN GROUP
KETERANGAN DESCRIPTION
58 Aktiviti Penerbitan
Publishing activities
581 Aktiviti penerbitan buku, terbitan berkala dan penerbitan lain
Publishing of books, periodicals and other publishing activities
582 Penerbitan perisian
Software publishing
59 Aktiviti penerbitan wayang gambar, video dan program televisyen,
rakaman bunyi dan penerbitan muzik
Motion picture, video and television programme production, sound
recording and music publishing activities
591 Aktiviti wayang gambar, video dan program televisyen
Motion picture, video and television programme activities
592 Aktiviti rakaman bunyi dan penerbitan muzik
Sound recording and music publishing activities
60 Aktiviti pemprograman dan penyiaran
Programming and broadcasting activities
601 Penyiaran radio
Radio broadcasting
602 Aktiviti pemprograman dan penyiaran televisyen
Television programming and broadcasting activities
61 Telekomunikasi
Telecommunications
611 Aktiviti komunikasi berwayar
Wired telecommunications activities
612 Aktiviti telekomunikasi tanpa wayar
Wireless telecommunications activities
613 Aktiviti telekomunikasi satelit
Satellite telecommunications activities
619 Aktiviti telekomunikasi lain
Other telecommunications activities
SEKSYEN J : MAKLUMAT DAN KOMUNIKASI
SECTION J : INFORMATION AND COMMUNICATION
Banci Ekonomi 2011 (Sektor Perkhidmatan) /
Economic Census 2011 (Services Sector) | 71
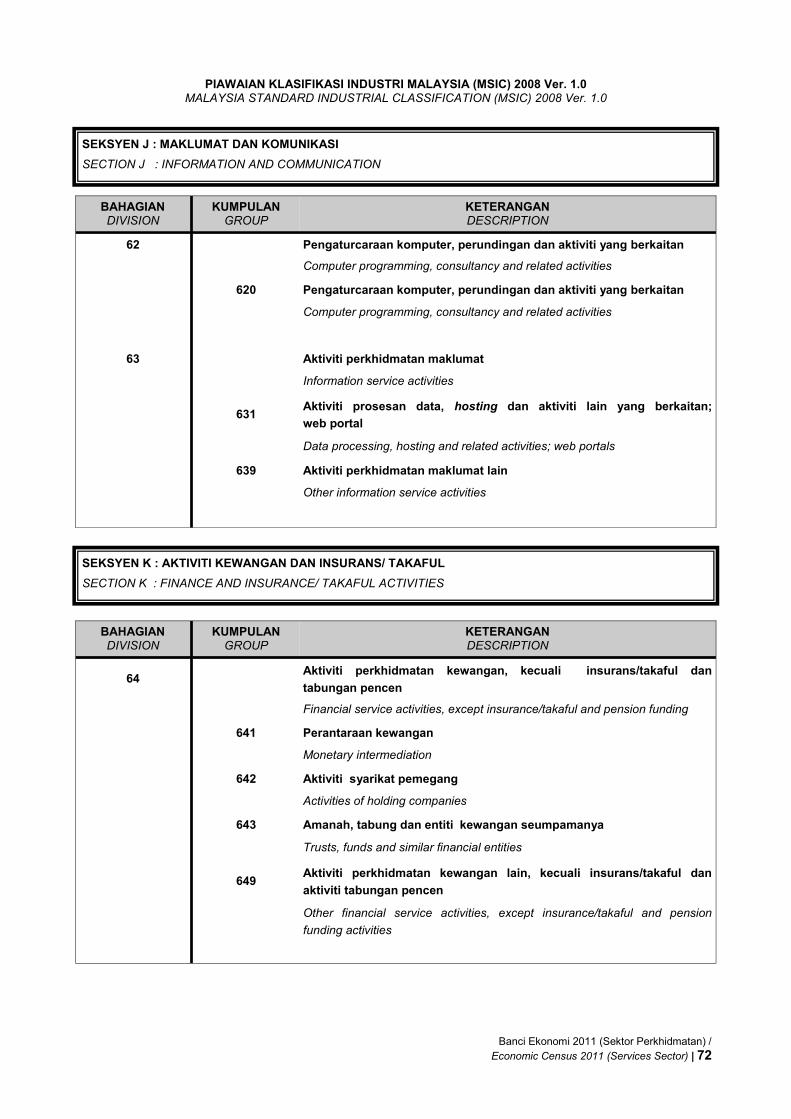
PIAWAIAN KLASIFIKASI INDUSTRI MALAYSIA (MSIC) 2008 Ver. 1.0 MALAYSIA STANDARD INDUSTRIAL CLASSIFICATION (MSIC) 2008 Ver. 1.0
BAHAGIAN DIVISION
KUMPULAN GROUP
KETERANGAN DESCRIPTION
62 Pengaturcaraan komputer, perundingan dan aktiviti yang berkaitan
Computer programming, consultancy and related activities
620 Pengaturcaraan komputer, perundingan dan aktiviti yang berkaitan
Computer programming, consultancy and related activities
63 Aktiviti perkhidmatan maklumat
Information service activities
631 Aktiviti prosesan data, hosting dan aktiviti lain yang berkaitan;
web portal
Data processing, hosting and related activities; web portals
639 Aktiviti perkhidmatan maklumat lain
Other information service activities
SEKSYEN J : MAKLUMAT DAN KOMUNIKASI
SECTION J : INFORMATION AND COMMUNICATION
SEKSYEN K : AKTIVITI KEWANGAN DAN INSURANS/ TAKAFUL
SECTION K : FINANCE AND INSURANCE/ TAKAFUL ACTIVITIES
BAHAGIAN DIVISION
KUMPULAN GROUP
KETERANGAN DESCRIPTION
64 Aktiviti perkhidmatan kewangan, kecuali insurans/takaful dan
tabungan pencen
Financial service activities, except insurance/takaful and pension funding
641 Perantaraan kewangan
Monetary intermediation
642 Aktiviti syarikat pemegang
Activities of holding companies
643 Amanah, tabung dan entiti kewangan seumpamanya
Trusts, funds and similar financial entities
649 Aktiviti perkhidmatan kewangan lain, kecuali insurans/takaful dan
aktiviti tabungan pencen
Other financial service activities, except insurance/takaful and pension
funding activities
Banci Ekonomi 2011 (Sektor Perkhidmatan) /
Economic Census 2011 (Services Sector) | 72
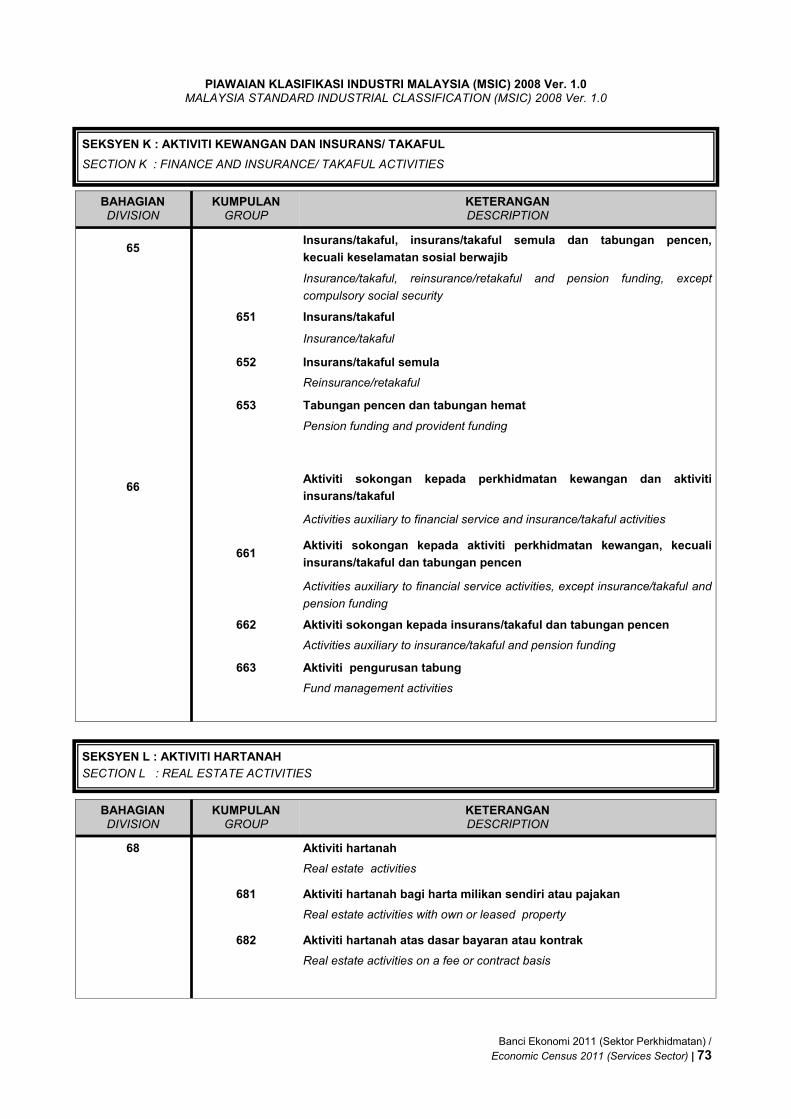
PIAWAIAN KLASIFIKASI INDUSTRI MALAYSIA (MSIC) 2008 Ver. 1.0 MALAYSIA STANDARD INDUSTRIAL CLASSIFICATION (MSIC) 2008 Ver. 1.0
BAHAGIAN DIVISION
KUMPULAN GROUP
KETERANGAN DESCRIPTION
65 Insurans/takaful, insurans/takaful semula dan tabungan pencen,
kecuali keselamatan sosial berwajib
Insurance/takaful, reinsurance/retakaful and pension funding, except
compulsory social security
651 Insurans/takaful
Insurance/takaful
652 Insurans/takaful semula
Reinsurance/retakaful
653 Tabungan pencen dan tabungan hemat
Pension funding and provident funding
66 Aktiviti sokongan kepada perkhidmatan kewangan dan aktiviti
insurans/takaful
Activities auxiliary to financial service and insurance/takaful activities
661 Aktiviti sokongan kepada aktiviti perkhidmatan kewangan, kecuali
insurans/takaful dan tabungan pencen
Activities auxiliary to financial service activities, except insurance/takaful and
pension funding
662 Aktiviti sokongan kepada insurans/takaful dan tabungan pencen
Activities auxiliary to insurance/takaful and pension funding
663 Aktiviti pengurusan tabung
Fund management activities
SEKSYEN K : AKTIVITI KEWANGAN DAN INSURANS/ TAKAFUL
SECTION K : FINANCE AND INSURANCE/ TAKAFUL ACTIVITIES
SEKSYEN L : AKTIVITI HARTANAH
SECTION L : REAL ESTATE ACTIVITIES
BAHAGIAN DIVISION
KUMPULAN GROUP
KETERANGAN DESCRIPTION
68 Aktiviti hartanah
Real estate activities
681 Aktiviti hartanah bagi harta milikan sendiri atau pajakan
Real estate activities with own or leased property
682 Aktiviti hartanah atas dasar bayaran atau kontrak
Real estate activities on a fee or contract basis
Banci Ekonomi 2011 (Sektor Perkhidmatan) /
Economic Census 2011 (Services Sector) | 73
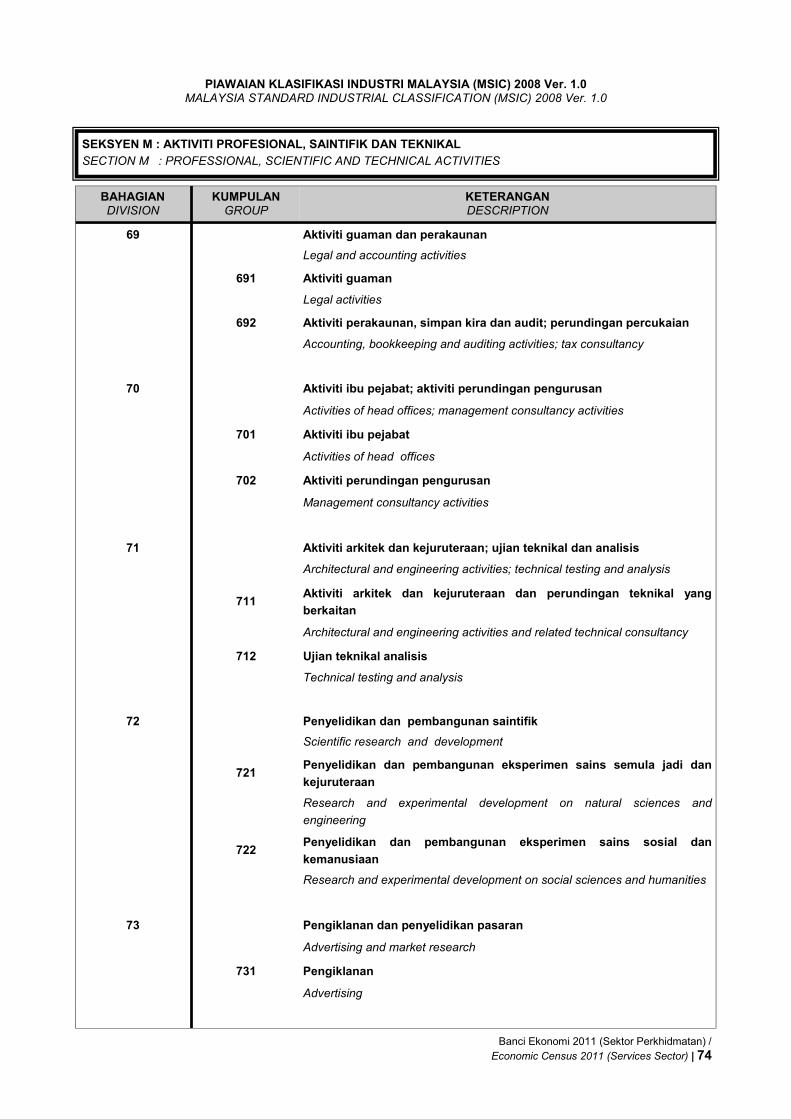
PIAWAIAN KLASIFIKASI INDUSTRI MALAYSIA (MSIC) 2008 Ver. 1.0 MALAYSIA STANDARD INDUSTRIAL CLASSIFICATION (MSIC) 2008 Ver. 1.0
BAHAGIAN DIVISION
KUMPULAN GROUP
KETERANGAN DESCRIPTION
69 Aktiviti guaman dan perakaunan
Legal and accounting activities
691 Aktiviti guaman
Legal activities
692 Aktiviti perakaunan, simpan kira dan audit; perundingan percukaian
Accounting, bookkeeping and auditing activities; tax consultancy
70 Aktiviti ibu pejabat; aktiviti perundingan pengurusan
Activities of head offices; management consultancy activities
701 Aktiviti ibu pejabat
Activities of head offices
702 Aktiviti perundingan pengurusan
Management consultancy activities
71 Aktiviti arkitek dan kejuruteraan; ujian teknikal dan analisis
Architectural and engineering activities; technical testing and analysis
711 Aktiviti arkitek dan kejuruteraan dan perundingan teknikal yang
berkaitan
Architectural and engineering activities and related technical consultancy
712 Ujian teknikal analisis
Technical testing and analysis
72 Penyelidikan dan pembangunan saintifik
Scientific research and development
721 Penyelidikan dan pembangunan eksperimen sains semula jadi dan
kejuruteraan
Research and experimental development on natural sciences and
engineering
722 Penyelidikan dan pembangunan eksperimen sains sosial dan
kemanusiaan
Research and experimental development on social sciences and humanities
73 Pengiklanan dan penyelidikan pasaran
Advertising and market research
731 Pengiklanan
Advertising
SEKSYEN M : AKTIVITI PROFESIONAL, SAINTIFIK DAN TEKNIKAL
SECTION M : PROFESSIONAL, SCIENTIFIC AND TECHNICAL ACTIVITIES
Banci Ekonomi 2011 (Sektor Perkhidmatan) /
Economic Census 2011 (Services Sector) | 74

PIAWAIAN KLASIFIKASI INDUSTRI MALAYSIA (MSIC) 2008 Ver. 1.0 MALAYSIA STANDARD INDUSTRIAL CLASSIFICATION (MSIC) 2008 Ver. 1.0
BAHAGIAN DIVISION
KUMPULAN GROUP
KETERANGAN DESCRIPTION
732 Penyelidikan pasaran dan tinjauan pendapat umum
Market research and public opinion polling
74 Perkhidmatan professional, saintifik dan teknikal lain
Other professional, scientific and technical activities
741 Aktiviti mereka bentuk khusus
Specialised design activities
742 Aktiviti fotografi
Photographic activities
749 Aktiviti professional, saintifik dan teknikal lain
Other professional, scientific and technical activities n.e.c.
75 Aktiviti veterinar
Veterinary activities
750 Aktiviti veterinar
Veterinary activities
SEKSYEN M : AKTIVITI PROFESIONAL, SAINTIFIK DAN TEKNIKAL
SECTION M : PROFESSIONAL, SCIENTIFIC AND TECHNICAL ACTIVITIES
SEKSYEN N : AKTIVITI PENTADBIRAN DAN KHIDMAT SOKONGAN
SECTION N : ADMINISTRATIVE AND SUPPORT SERVICE ACTIVITIES
BAHAGIAN DIVISION
KUMPULAN GROUP
KETERANGAN DESCRIPTION
77 Aktiviti sewaan dan pajakan
Rental and leasing activities
771 Penyewaan dan pemajakan kenderaan bermotor
Renting and leasing of motor vehicles
772 Penyewaan dan pemajakan barang persendirian dan isi rumah
Renting and leasing of personal and household goods
773 Penyewaan dan pemajakan mesin, kelengkapan dan barang ketara lain
Renting and leasing of other machinery, equipment and tangible goods
774 Pemajakan harta intelektual dan produk seumpamanya, kecuali kerja
berhakcipta
Leasing of intellectual property and similar products, except copyrighted
works
Banci Ekonomi 2011 (Sektor Perkhidmatan) /
Economic Census 2011 (Services Sector) | 75

PIAWAIAN KLASIFIKASI INDUSTRI MALAYSIA (MSIC) 2008 Ver. 1.0 MALAYSIA STANDARD INDUSTRIAL CLASSIFICATION (MSIC) 2008 Ver. 1.0
BAHAGIAN DIVISION
KUMPULAN GROUP
KETERANGAN DESCRIPTION
78 Aktiviti pekerjaan
Employment activities
781 Aktiviti agensi penempatan pekerjaan
Activities of employment placement agencies
782 Aktiviti agensi pekerjaan sementara
Temporary employment agency activities
783 Penyediaan sumber manusia lain
Other human resources provision
79 Agensi pengembaraan, operator pelancongan, khidmat penempahan
dan aktiviti berkaitan
Travel agency, tour operator, reservation service and related activities
791 Aktiviti agensi pengembaraan dan operator pelancongan
Travel agency and tour operator activities
792 Aktiviti khidmat penempahan lain dan aktiviti berkaitan
Other reservation service and related activities
80 Aktiviti keselamatan dan penyiasatan
Security and investigation activities
801 Aktiviti keselamatan persendirian
Private security activities
802 Aktiviti perkhidmatan sistem keselamatan
Security systems service activities
803 Aktiviti penyiasatan
Investigation activities
81 Aktiviti perkhidmatan bangunan dan lanskap
Services to buildings and landscape activities
811 Aktiviti sokongan gabungan pelbagai kemudahan
Combined facilities support activities
812 Aktiviti pembersihan
Cleaning activities
813 Aktiviti perkhidmatan penjagaan dan penyelenggaraan lanskap
Landscape care and maintenance service activities
SEKSYEN N : AKTIVITI PENTADBIRAN DAN KHIDMAT SOKONGAN
SECTION N : ADMINISTRATIVE AND SUPPORT SERVICE ACTIVITIES
Banci Ekonomi 2011 (Sektor Perkhidmatan) /
Economic Census 2011 (Services Sector) | 76
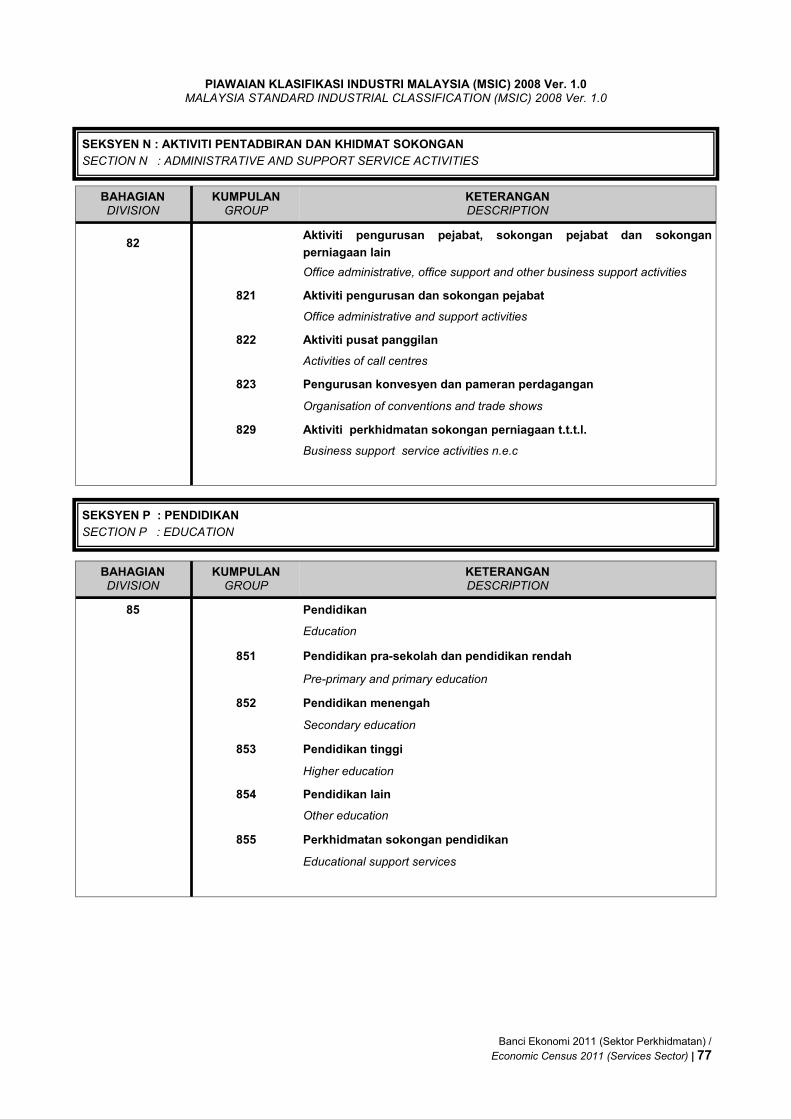
PIAWAIAN KLASIFIKASI INDUSTRI MALAYSIA (MSIC) 2008 Ver. 1.0 MALAYSIA STANDARD INDUSTRIAL CLASSIFICATION (MSIC) 2008 Ver. 1.0
BAHAGIAN DIVISION
KUMPULAN GROUP
KETERANGAN DESCRIPTION
82 Aktiviti pengurusan pejabat, sokongan pejabat dan sokongan
perniagaan lain
Office administrative, office support and other business support activities
821 Aktiviti pengurusan dan sokongan pejabat
Office administrative and support activities
822 Aktiviti pusat panggilan
Activities of call centres
823 Pengurusan konvesyen dan pameran perdagangan
Organisation of conventions and trade shows
829 Aktiviti perkhidmatan sokongan perniagaan t.t.t.l.
Business support service activities n.e.c
SEKSYEN N : AKTIVITI PENTADBIRAN DAN KHIDMAT SOKONGAN
SECTION N : ADMINISTRATIVE AND SUPPORT SERVICE ACTIVITIES
SEKSYEN P : PENDIDIKAN
SECTION P : EDUCATION
BAHAGIAN DIVISION
KUMPULAN GROUP
KETERANGAN DESCRIPTION
85 Pendidikan
Education
851 Pendidikan pra-sekolah dan pendidikan rendah
Pre-primary and primary education
852 Pendidikan menengah
Secondary education
853 Pendidikan tinggi
Higher education
854 Pendidikan lain
Other education
855 Perkhidmatan sokongan pendidikan
Educational support services
Banci Ekonomi 2011 (Sektor Perkhidmatan) /
Economic Census 2011 (Services Sector) | 77
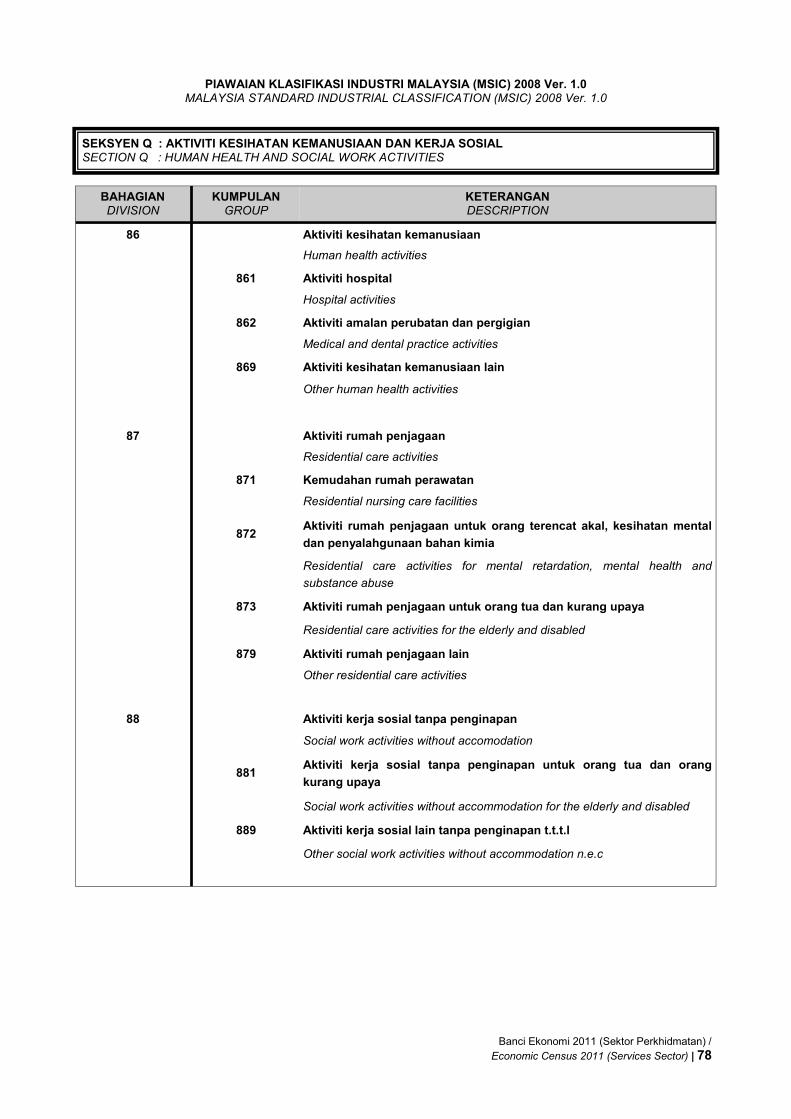
PIAWAIAN KLASIFIKASI INDUSTRI MALAYSIA (MSIC) 2008 Ver. 1.0 MALAYSIA STANDARD INDUSTRIAL CLASSIFICATION (MSIC) 2008 Ver. 1.0
BAHAGIAN DIVISION
KUMPULAN GROUP
KETERANGAN DESCRIPTION
86 Aktiviti kesihatan kemanusiaan
Human health activities
861 Aktiviti hospital
Hospital activities
862 Aktiviti amalan perubatan dan pergigian
Medical and dental practice activities
869 Aktiviti kesihatan kemanusiaan lain
Other human health activities
87 Aktiviti rumah penjagaan
Residential care activities
871 Kemudahan rumah perawatan
Residential nursing care facilities
872 Aktiviti rumah penjagaan untuk orang terencat akal, kesihatan mental
dan penyalahgunaan bahan kimia
Residential care activities for mental retardation, mental health and
substance abuse
873 Aktiviti rumah penjagaan untuk orang tua dan kurang upaya
Residential care activities for the elderly and disabled
879 Aktiviti rumah penjagaan lain
Other residential care activities
88 Aktiviti kerja sosial tanpa penginapan
Social work activities without accomodation
881 Aktiviti kerja sosial tanpa penginapan untuk orang tua dan orang
kurang upaya
Social work activities without accommodation for the elderly and disabled
889 Aktiviti kerja sosial lain tanpa penginapan t.t.t.l
Other social work activities without accommodation n.e.c
SEKSYEN Q : AKTIVITI KESIHATAN KEMANUSIAAN DAN KERJA SOSIAL SECTION Q : HUMAN HEALTH AND SOCIAL WORK ACTIVITIES
Banci Ekonomi 2011 (Sektor Perkhidmatan) /
Economic Census 2011 (Services Sector) | 78
PIAWAIAN KLASIFIKASI INDUSTRI MALAYSIA (MSIC) 2008 Ver. 1.0 MALAYSIA STANDARD INDUSTRIAL CLASSIFICATION (MSIC) 2008 Ver. 1.0
BAHAGIAN DIVISION
KUMPULAN GROUP
KETERANGAN DESCRIPTION
90 Aktiviti kesenian, hiburan dan kreatif
Creative, arts and entertainment activities
900 Aktiviti kesenian, hiburan dan kreatif
Creative, arts and entertainment activities
91 Aktiviti perpustakaan, arkib, muzium dan kebudayaan lain
Libraries, archives, museums and other cultural activities
910 Aktiviti perpustakaan, arkib, muzium dan kebudayaan lain
Libraries, archives, museums and other cultural activities
92 Aktiviti perjudian dan pertaruhan
Gambling and betting activities
920 Aktiviti perjudian dan pertaruhan
Gambling and betting activities
93 Aktiviti sukan dan aktiviti hiburan dan rekreasi
Sports activities and amusement and recreation activities
931 Aktiviti sukan
Sports activities
932 Aktiviti hiburan dan rekreasi lain
Other amusement and recreation activities
SEKSYEN R : KESENIAN , HIBURAN DAN REKREASI
SECTION R : ARTS , ENTERTAINMENT AND RECREATION
SEKSYEN S : AKTIVITI PERKHIDMATAN LAIN
SECTION S : OTHER SERVICE ACTIVITIES
BAHAGIAN DIVISION
KUMPULAN GROUP
KETERANGAN DESCRIPTION
94 Aktiviti keahlian organisasi
Activities of membership organisations
941 Aktiviti organisasi keahlian perniagaan, majikan dan profesional
Activities of business, employers and professional membership organisations
942 Aktiviti kesatuan buruh
Activities of trade unions
949 Aktiviti keahlian organisasi lain
Activities of other membership organisations
Banci Ekonomi 2011 (Sektor Perkhidmatan) /
Economic Census 2011 (Services Sector) | 79

PIAWAIAN KLASIFIKASI INDUSTRI MALAYSIA (MSIC) 2008 Ver. 1.0 MALAYSIA STANDARD INDUSTRIAL CLASSIFICATION (MSIC) 2008 Ver. 1.0
SEKSYEN S : AKTIVITI PERKHIDMATAN LAIN
SECTION S : OTHER SERVICE ACTIVITIES
BAHAGIAN DIVISION
KUMPULAN GROUP
KETERANGAN DESCRIPTION
95 Pembaikan komputer dan barangan persendirian dan isi rumah
Repair of computers and personal and household goods
951 Pembaikan komputer dan peralatan komunikasi
Repair of computers and communication equipment
952 Pembaikan barangan persendirian dan isi rumah
Repair of personal and household goods
96 Aktiviti perkhidmatan persendirian lain
Other personal service activities
960 Aktiviti berkaitan perkhidmatan persendirian lain
Other personal service activities
Banci Ekonomi 2011 (Sektor Perkhidmatan) /
Economic Census 2011 (Services Sector) | 80


