bank negara malaysia · 2019-03-28 · source: bank negara malaysia record growth in loans...
TRANSCRIPT
BANK NEGARA MALAYSIA
2018 ANNUAL REPORT &
FINANCIAL STABILITY AND PAYMENT SYSTEMS REPORT
27 MARCH 2019
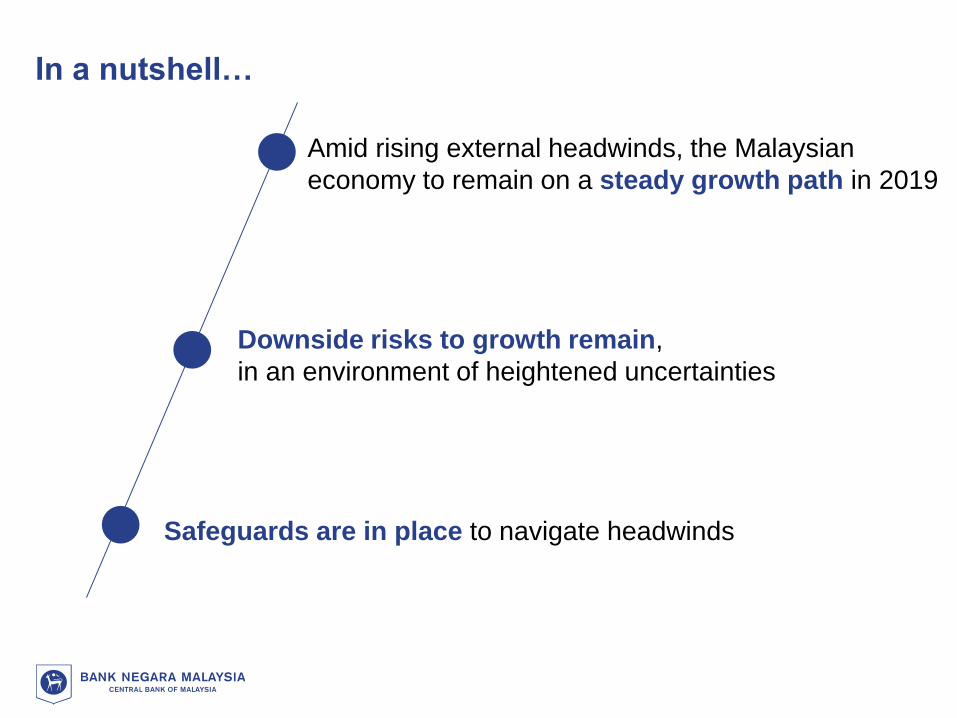
In a nutshell…
Amid rising external headwinds, the Malaysian
economy to remain on a steady growth path in 2019
Downside risks to growth remain,
in an environment of heightened uncertainties
Safeguards are in place to navigate headwinds
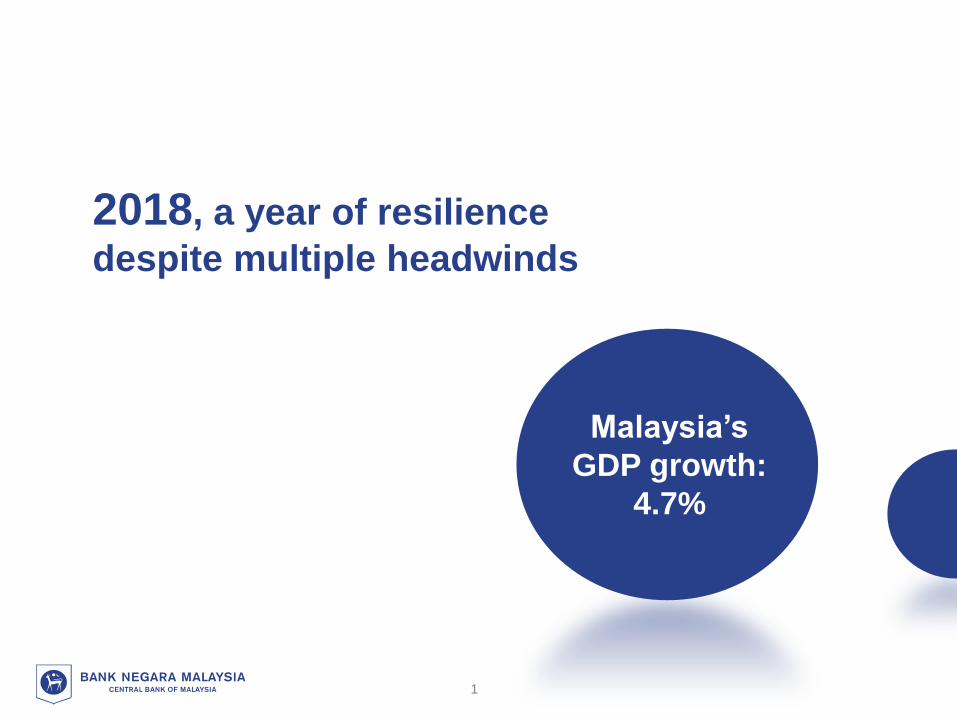
2018, a year of resilience
despite multiple headwinds
Malaysia’s
GDP growth:
4.7%
1

High frequency indicators point to
slowing global economic activity going into 2019
Broad-based PMI moderation High global financial market volatility
Global Composite PMI (Manufacturing and Services)
Index
Sources: Haver, Bloomberg, Economic Policy Uncertainty, and BNM estimates
L
CBOE Volatility Index (VIX)
Index
52.7
50.4
Jan-17 Jun-17 Nov-17 Apr-18 Sep-18 Feb-19
Advanced Economies
Emerging Markets
> 50 = expansionary
Elevated policy uncertainty Volatile commodity prices
Global Economic Policy Uncertainty Index
Index, 3 mma
Brent Crude Oil Price
USD/bl
12.9
25.0
15.2
Jan-17 Jun-17 Nov-17 Apr-18 Sep-18 Feb-19
80.6
64.4
Jan-17 Jun-17 Nov-17 Apr-18 Sep-18 Feb-19
129
298
Jan-17 Jun-17 Nov-17 Apr-18 Sep-18 Feb-19
2
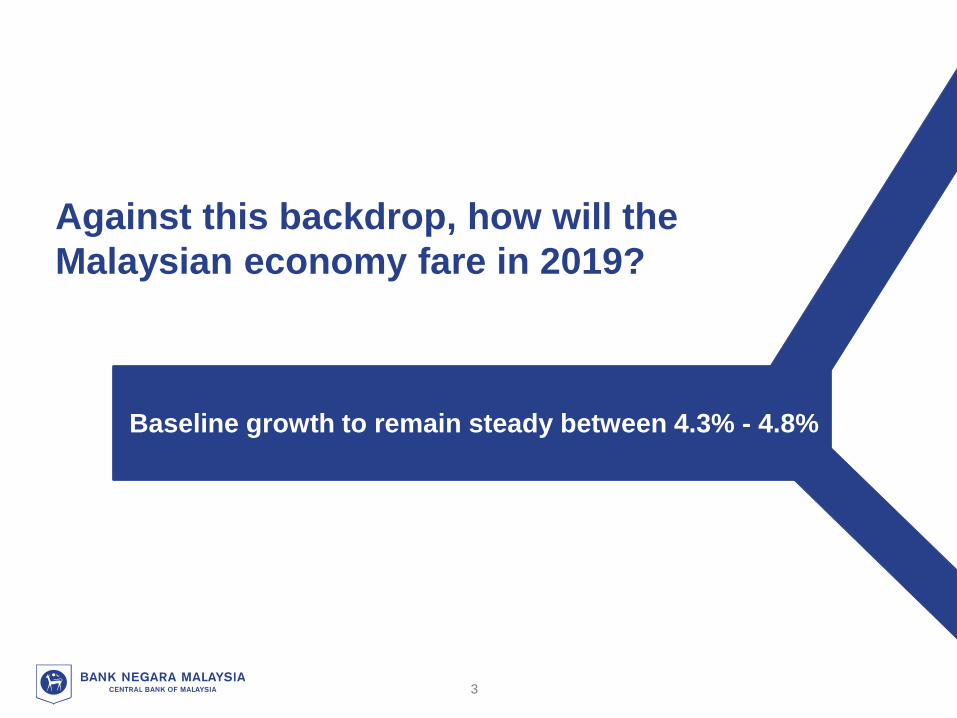
Against this backdrop, how will the
Malaysian economy fare in 2019?
Malaysia’s
GDP growth:
4.7%
Baseline growth to remain steady between 4.3% - 4.8%
3
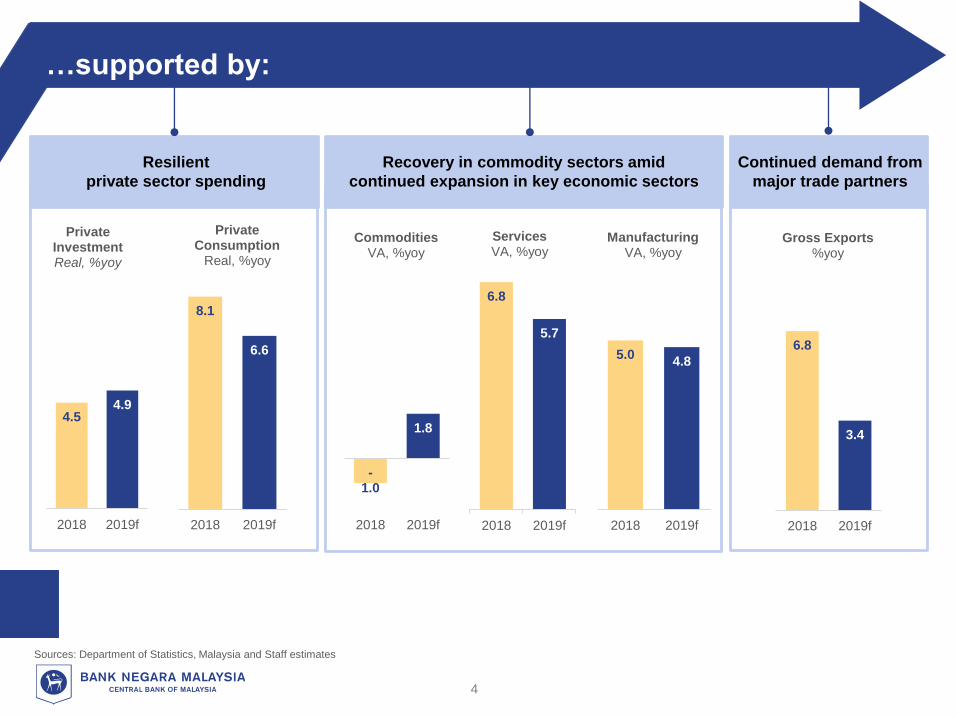
…supported by:
Malaysia’s
GDP growth:
4.7%
Sources: Department of Statistics, Malaysia and Staff estimates
6.8
5.7
2018 2019f
ServicesVA, %yoy
-1.0
1.8
2018 2019f
Commodities VA, %yoy
5.04.8
2018 2019f
ManufacturingVA, %yoy
8.1
6.6
2018 2019f
Private Consumption
Real, %yoy
4.54.9
2018 2019f
Private InvestmentReal, %yoy
6.8
3.4
2018 2019f
Gross Exports %yoy
Continued demand from
major trade partners
Resilient
private sector spending
Recovery in commodity sectors amid
continued expansion in key economic sectors
4
Private sector spending to remain resilient, in the absence of major shocks
5
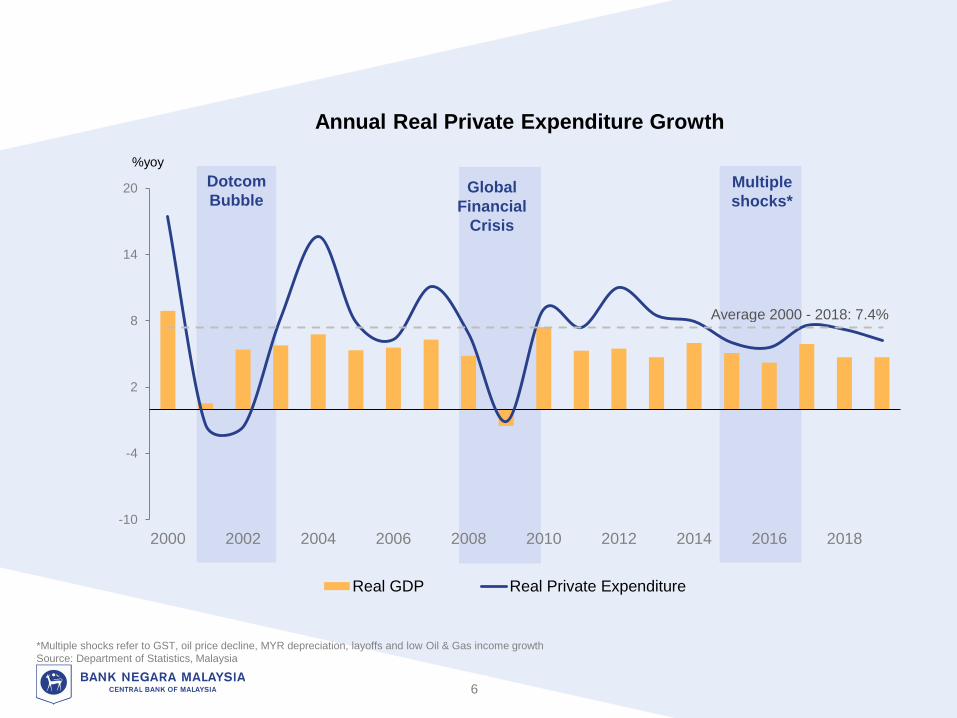
Annual Real Private Expenditure Growth
Multiple
shocks*
%yoy
Dotcom
Bubble
*Multiple shocks refer to GST, oil price decline, MYR depreciation, layoffs and low Oil & Gas income growth
Source: Department of Statistics, Malaysia
6
-10
-4
2
8
14
20
2000 2002 2004 2006 2008 2010 2012 2014 2016 2018
Real GDP Real Private Expenditure
Global
Financial
Crisis
Average 2000 - 2018: 7.4%
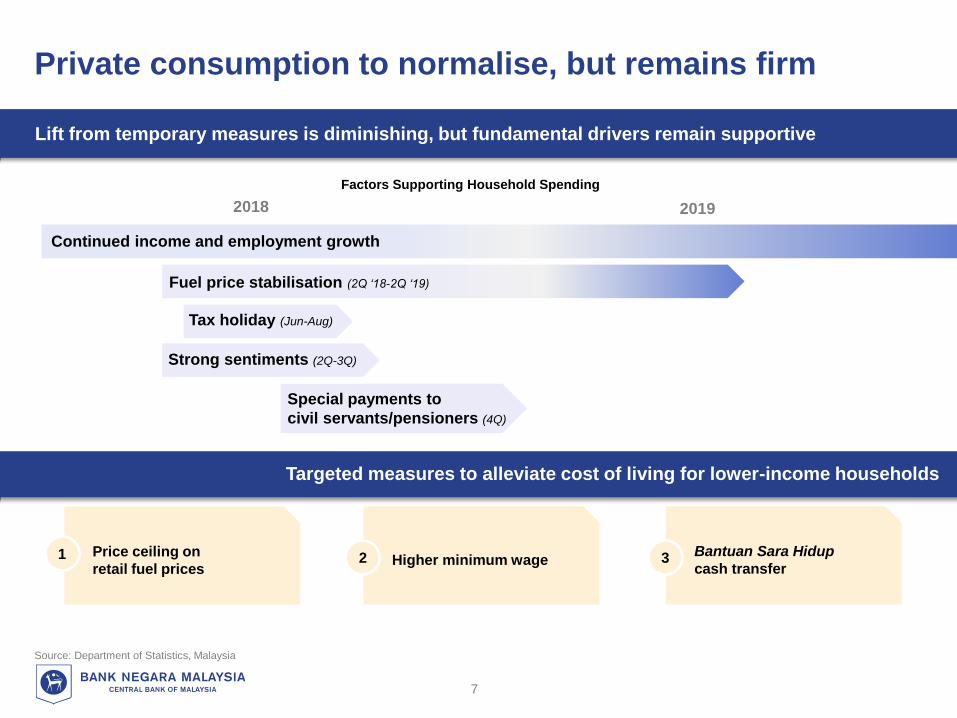
Special payments to
civil servants/pensioners (4Q)
Updated
Factors Supporting Household Spending
Source: Department of Statistics, Malaysia
Targeted measures to alleviate cost of living for lower-income households
Lift from temporary measures is diminishing, but fundamental drivers remain supportive
Private consumption to normalise, but remains firm
2018 2019
Tax holiday (Jun-Aug)
Fuel price stabilisation (2Q ‘18-2Q ‘19)
Strong sentiments (2Q-3Q)
Continued income and employment growth
Price ceiling on
retail fuel prices1 Higher minimum wage2 Bantuan Sara Hidup
cash transfer3
7
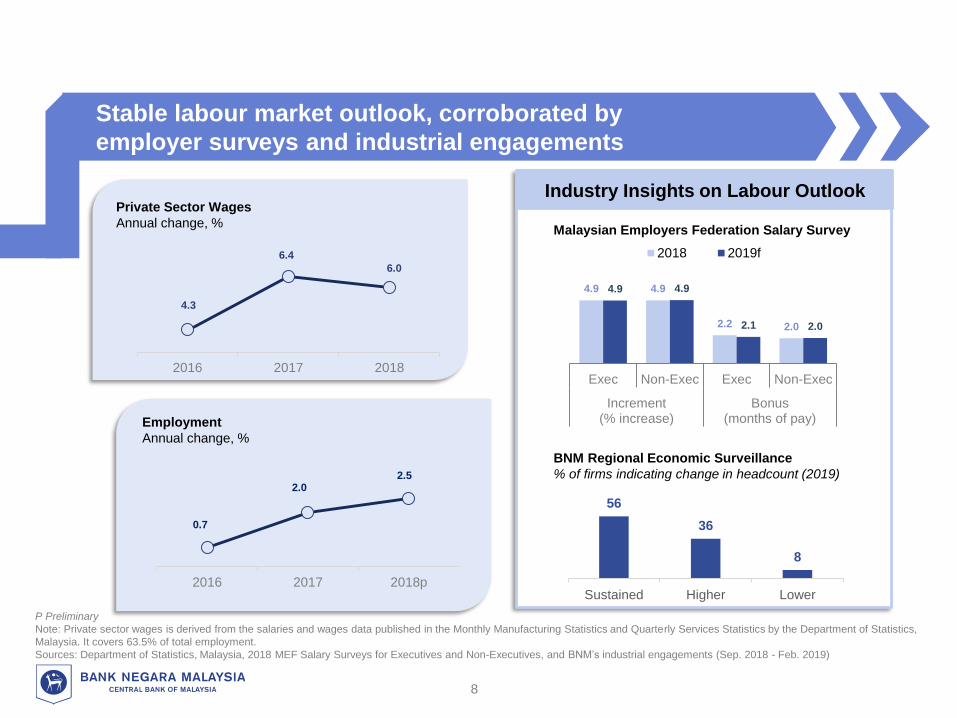
Updated
Private Sector Wages
Annual change, %
Industry Insights on Labour Outlook
Malaysian Employers Federation Salary Survey
BNM Regional Economic Surveillance
% of firms indicating change in headcount (2019)
4.9 4.9
2.2 2.0
4.9 4.9
2.1 2.0
Exec Non-Exec Exec Non-Exec
Increment(% increase)
Bonus(months of pay)
2018 2019f
56
36
8
Sustained Higher Lower
P Preliminary
Note: Private sector wages is derived from the salaries and wages data published in the Monthly Manufacturing Statistics and Quarterly Services Statistics by the Department of Statistics,
Malaysia. It covers 63.5% of total employment.
Sources: Department of Statistics, Malaysia, 2018 MEF Salary Surveys for Executives and Non-Executives, and BNM’s industrial engagements (Sep. 2018 - Feb. 2019)
0.7
2.02.5
2016 2017 2018p
4.3
6.4
6.0
2016 2017 2018
Employment
Annual change, %
8
Stable labour market outlook, corroborated by
employer surveys and industrial engagements

Despite the uncertain environment,
firms continue to invest
Malaysia’s
GDP growth:
4.7%
Baseline growth to remain steady between 4.3% - 4.8% Optimism
threshold
=100
Vistage-MIER CEO Confidence Index
Points
Sentiments softened amid
increased uncertainty
2Q-18 3Q-18 4Q-18
MIER Business Conditions Index
Points
116.3
108.8
95.3
106.9 107.1
95.8
Source: MIER and Vistage-MIER
9
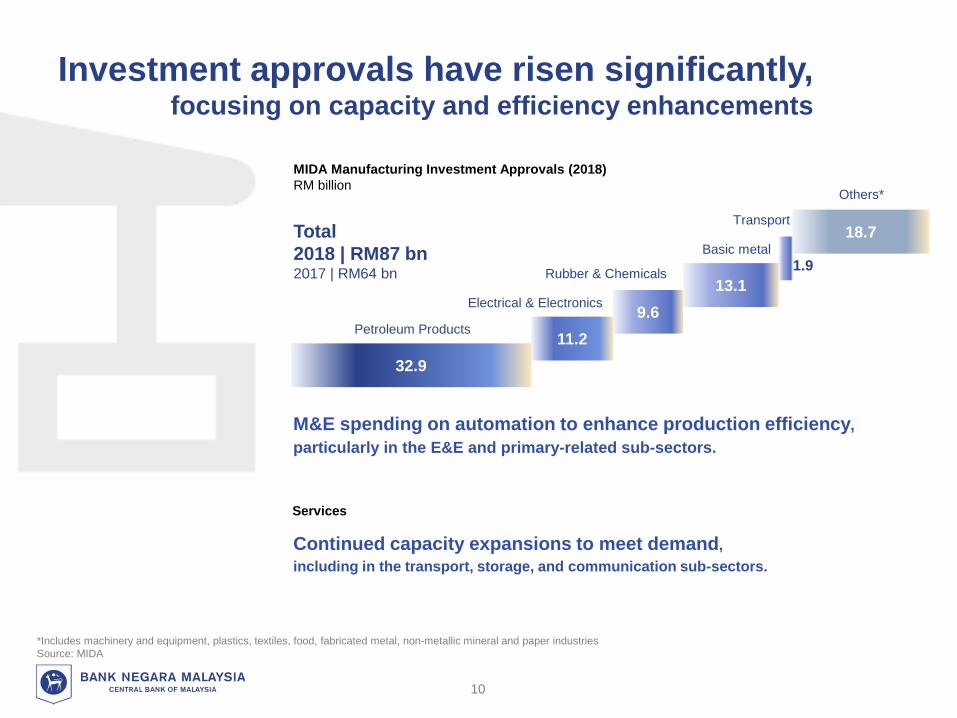
Investment approvals have risen significantly, focusing on capacity and efficiency enhancements
32.9
11.2
9.6
13.1
1.9
18.7
Petroleum Products
MIDA Manufacturing Investment Approvals (2018)
RM billion
Total
2018 | RM87 bn2017 | RM64 bn
Electrical & Electronics
Rubber & Chemicals
Basic metal
Transport
Others*
M&E spending on automation to enhance production efficiency,
particularly in the E&E and primary-related sub-sectors.
Services
Continued capacity expansions to meet demand,
including in the transport, storage, and communication sub-sectors.
*Includes machinery and equipment, plastics, textiles, food, fabricated metal, non-metallic mineral and paper industries
Source: MIDA
10
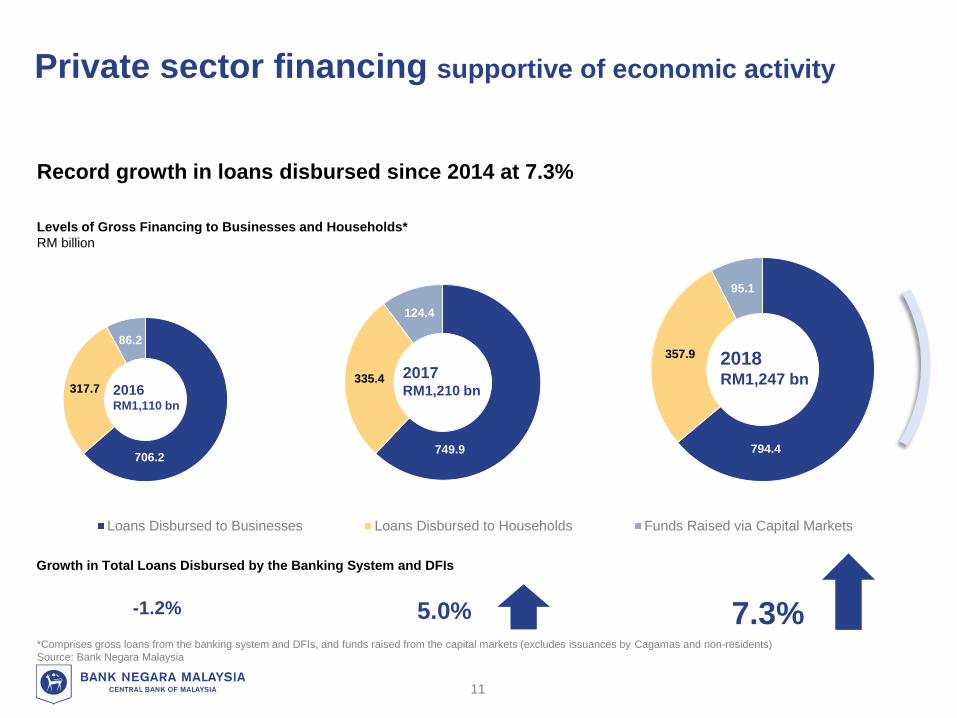
Private sector financing supportive of economic activity
*Comprises gross loans from the banking system and DFIs, and funds raised from the capital markets (excludes issuances by Cagamas and non-residents)
Source: Bank Negara Malaysia
Record growth in loans disbursed since 2014 at 7.3%
Levels of Gross Financing to Businesses and Households*
RM billion
749.9
335.4
124.4
Loans Disbursed to Businesses Loans Disbursed to Households Funds Raised via Capital Markets
706.2
317.7
86.2
794.4
357.9
95.1
2016RM1,110 bn
2017RM1,210 bn
2018RM1,247 bn
11
Growth in Total Loans Disbursed by the Banking System and DFIs
-1.2% 5.0% 7.3%
**Loans from the banking system and DFIs
Source: Bank Negara Malaysia
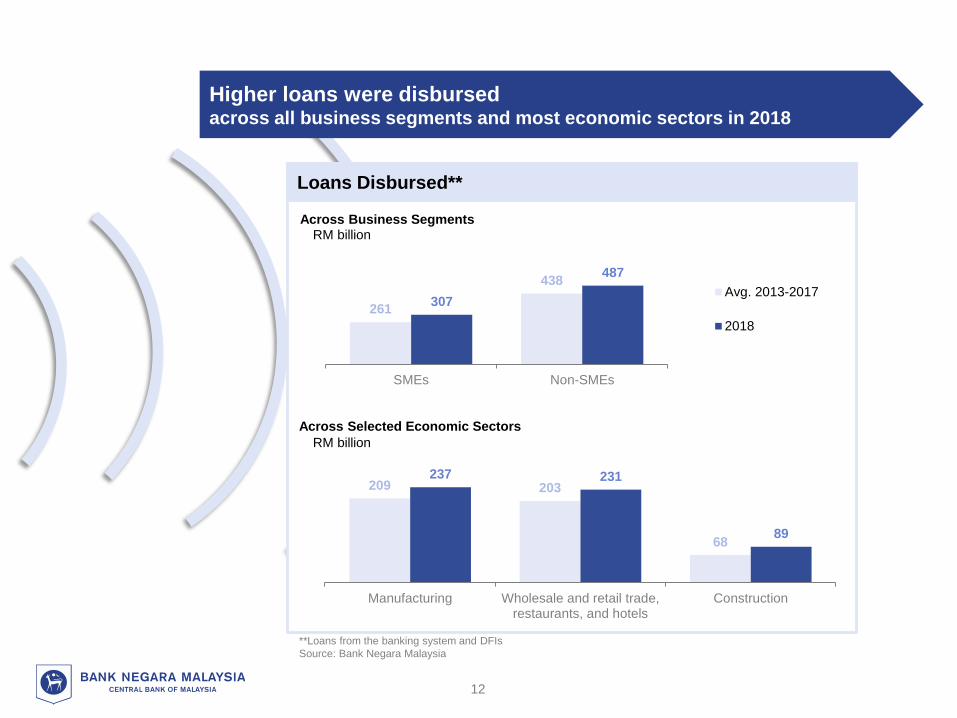
Across Business Segments
261
438
307
487
SMEs Non-SMEs
Avg. 2013-2017
2018
Across Selected Economic Sectors
209 203
68
237 231
89
Manufacturing Wholesale and retail trade,restaurants, and hotels
Construction
Higher loans were disbursed across all business segments and most economic sectors in 2018
Loans Disbursed**
RM billion
RM billion
12
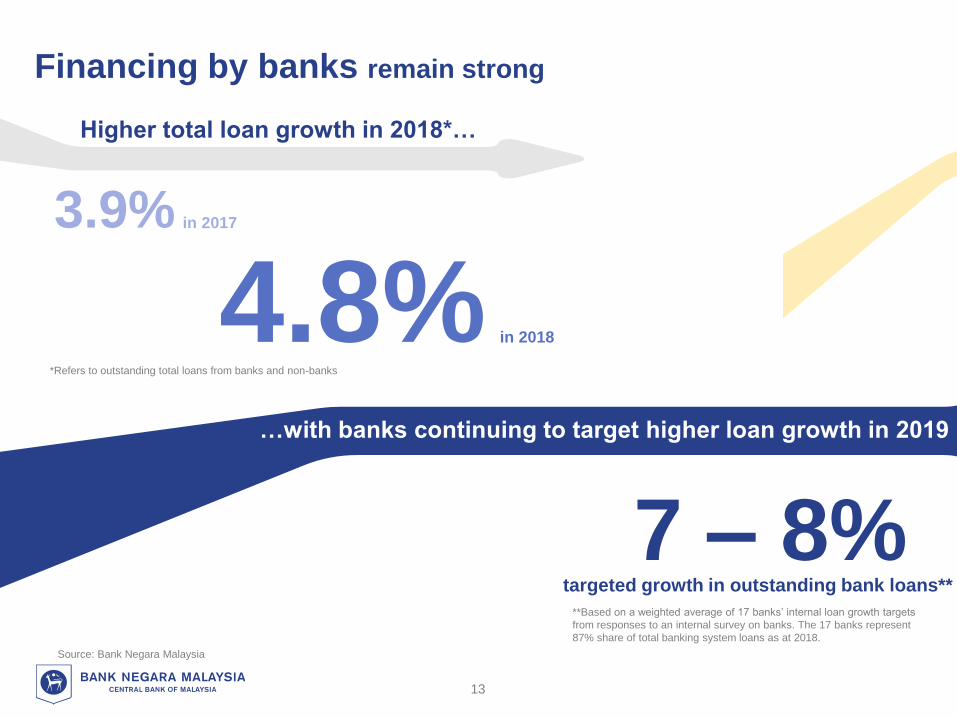
Financing by banks remain strong
Source: Bank Negara Malaysia
4.8% in 2018
in 20173.9%
7 – 8%
*Refers to outstanding total loans from banks and non-banks
Higher total loan growth in 2018*…
…with banks continuing to target higher loan growth in 2019
targeted growth in outstanding bank loans**
**Based on a weighted average of 17 banks’ internal loan growth targets
from responses to an internal survey on banks. The 17 banks represent
87% share of total banking system loans as at 2018.
13
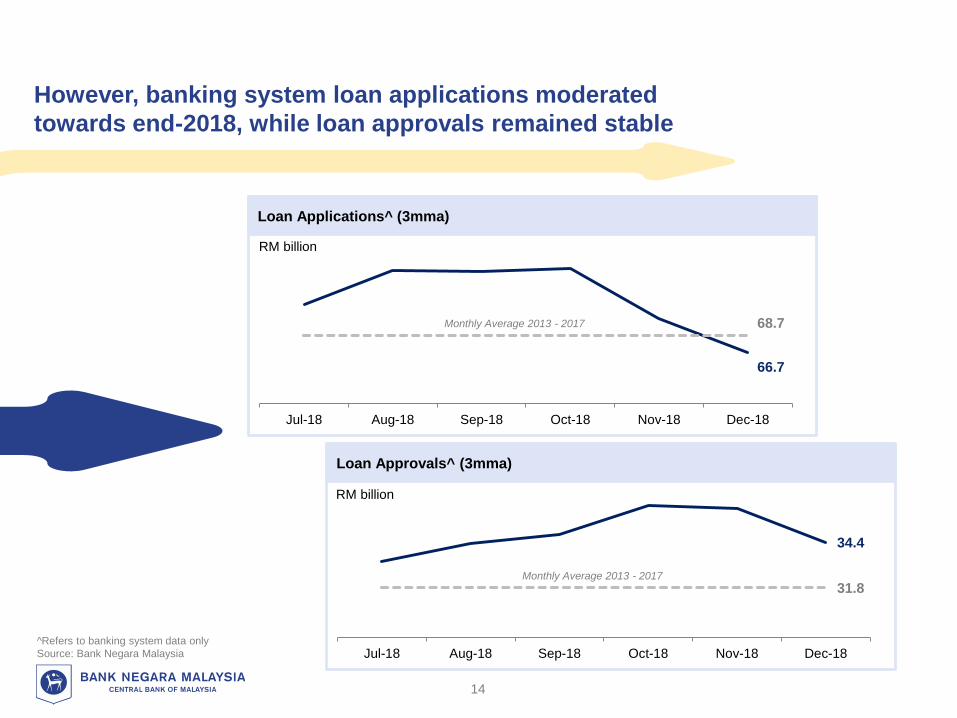
However, banking system loan applications moderated
towards end-2018, while loan approvals remained stable
RM billion
RM billion
66.7
68.7
Jul-18 Aug-18 Sep-18 Oct-18 Nov-18 Dec-18
34.4
31.8
Jul-18 Aug-18 Sep-18 Oct-18 Nov-18 Dec-18
Monthly Average 2013 - 2017
Monthly Average 2013 - 2017
Loan Applications^ (3mma)
Loan Approvals^ (3mma)
14
^Refers to banking system data only
Source: Bank Negara Malaysia
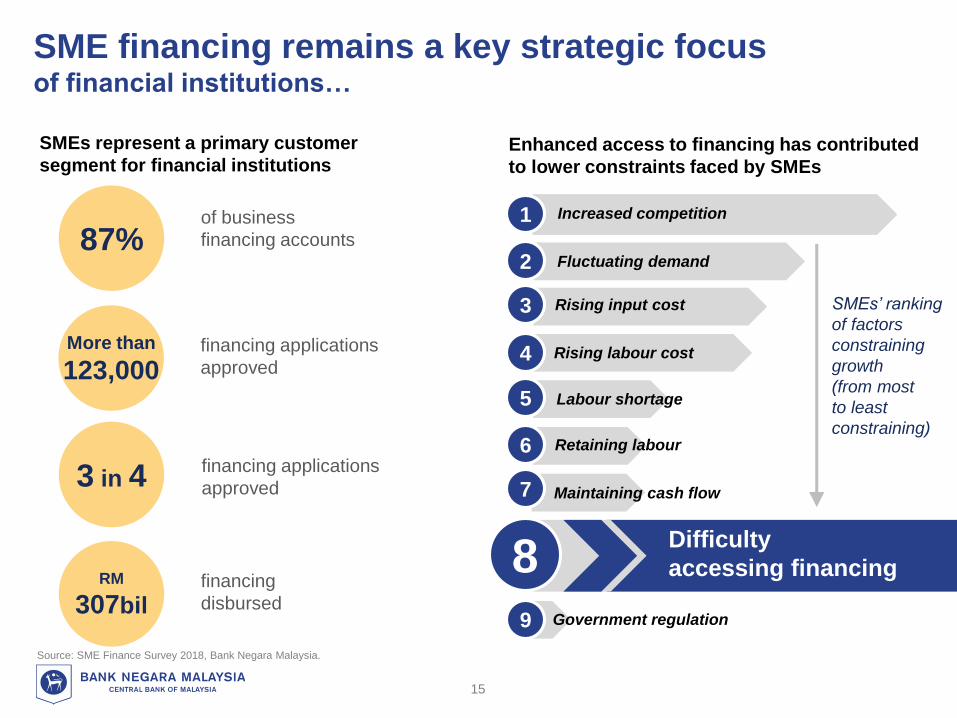
SME financing remains a key strategic focus of financial institutions…
SMEs represent a primary customer
segment for financial institutions
Source: SME Finance Survey 2018, Bank Negara Malaysia.
1 Increased competition
2 Fluctuating demand
3 Rising input cost
4 Rising labour cost
5 Labour shortage
6 Retaining labour
7 Maintaining cash flow
9 Government regulation
8Difficulty
accessing financing
SMEs’ ranking
of factors
constraining
growth
(from most
to least
constraining)
Enhanced access to financing has contributed
to lower constraints faced by SMEs
15
of business
financing accounts
financing
disbursed
financing applications
approved
87%
RM
307bil
3 in 4
More than
123,000
financing applications
approved
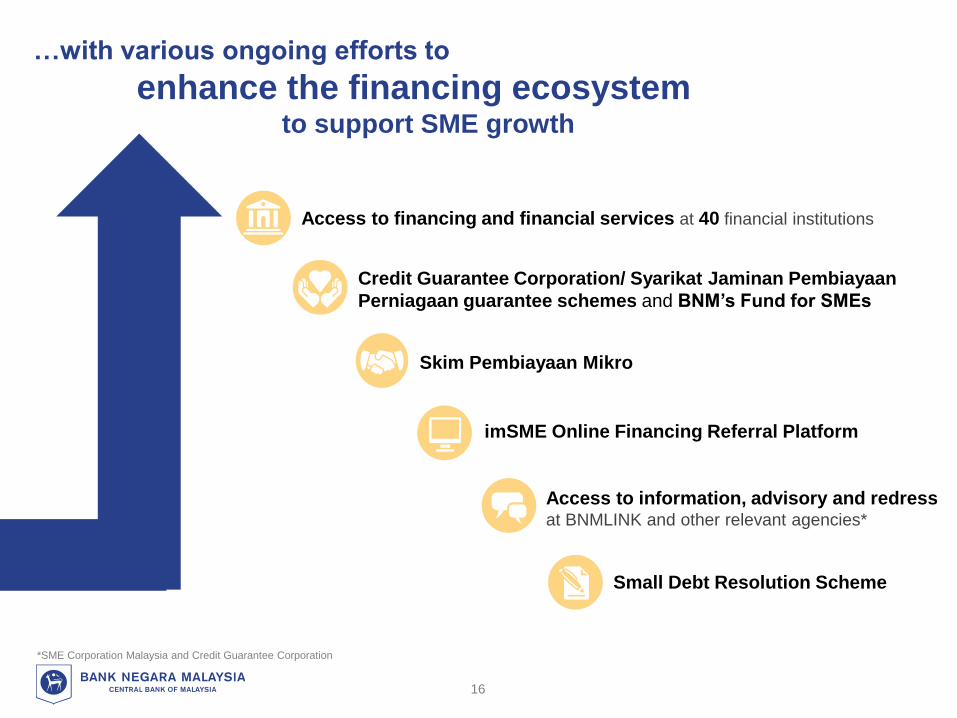
…with various ongoing efforts to
enhance the financing ecosystem to support SME growth
Credit Guarantee Corporation/ Syarikat Jaminan Pembiayaan
Perniagaan guarantee schemes and BNM’s Fund for SMEs
Skim Pembiayaan Mikro
imSME Online Financing Referral Platform
Access to information, advisory and redress at BNMLINK and other relevant agencies*
Small Debt Resolution Scheme
Access to financing and financial services at 40 financial institutions
16
*SME Corporation Malaysia and Credit Guarantee Corporation
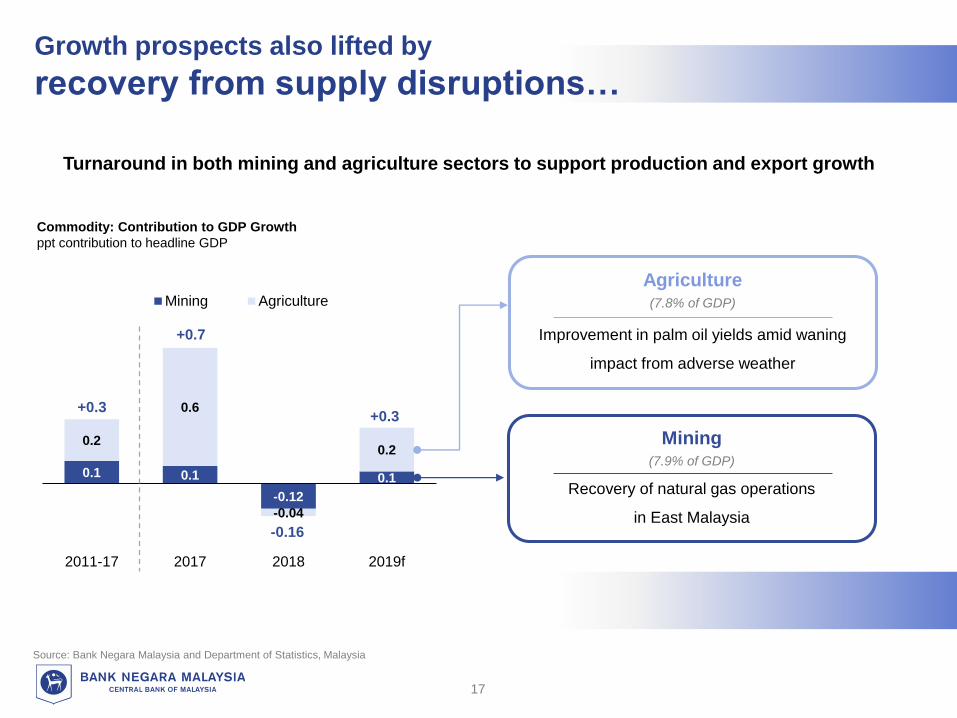
Growth prospects also lifted by
recovery from supply disruptions…
Source: Bank Negara Malaysia and Department of Statistics, Malaysia
Turnaround in both mining and agriculture sectors to support production and export growth
Commodity: Contribution to GDP Growth
ppt contribution to headline GDP
0.1 0.1
-0.12
0.1
0.2
0.6
-0.04
0.2
2011-17 2017 2018 2019f
Mining Agriculture
+0.7
-0.16
+0.3+0.3
Mining(7.9% of GDP)
Recovery of natural gas operations
in East Malaysia
Agriculture(7.8% of GDP)
Improvement in palm oil yields amid waning
impact from adverse weather
17

Primary-related(69%)
E&E(15%)
Transport (incl. aerospace)
(6%)
Others(10%)
…and
new manufacturing production facilities
Note: The manufacturing sector accounts for 23% of GDP in 2018
Source: Staff estimates based on news flow and industrial engagements
Additional production capacity in primary-related and E&E sub-sectors to support growth
Oil and Gas Value Chain
Deepen domestic economic
complexity by producing high value-
added specialty chemicals in
the longer term
Upstream
Midstream
Downstream
47% increase in refined petroleum
capacity
Contribution from RAPID
upon full capacity
2019 Sales Projection of New Manufacturing Capacity
% share of total
18
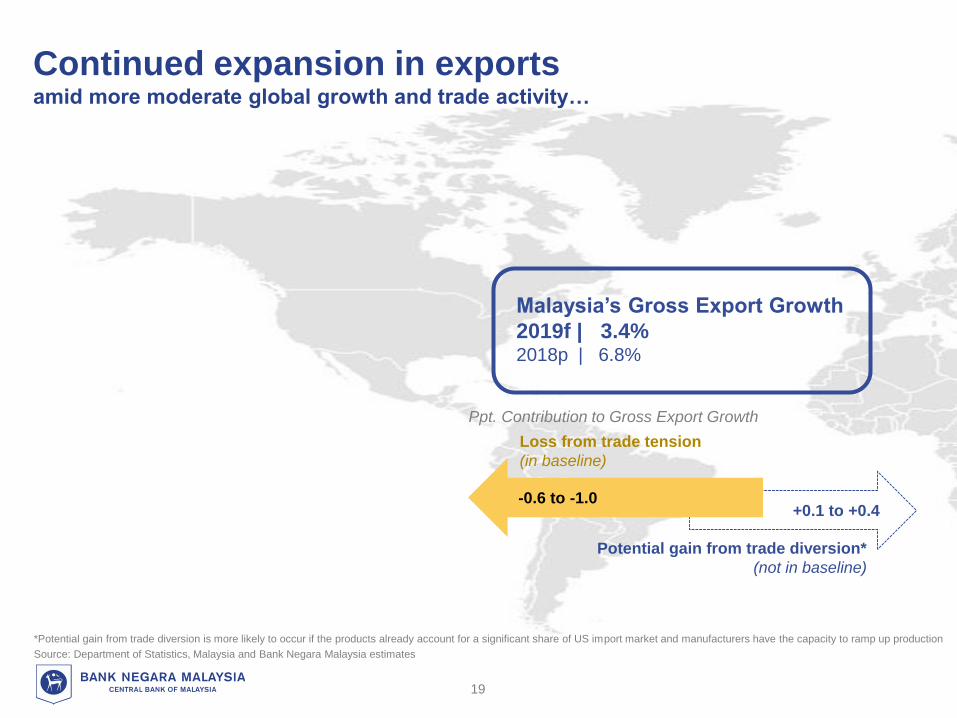
Malaysia’s Gross Export Growth
2019f | 3.4%2018p | 6.8%
Loss from trade tension
(in baseline)
Potential gain from trade diversion*
(not in baseline)
-0.6 to -1.0+0.1 to +0.4
Ppt. Contribution to Gross Export Growth
*Potential gain from trade diversion is more likely to occur if the products already account for a significant share of US import market and manufacturers have the capacity to ramp up production
Source: Department of Statistics, Malaysia and Bank Negara Malaysia estimates
19
Continued expansion in exports amid more moderate global growth and trade activity…
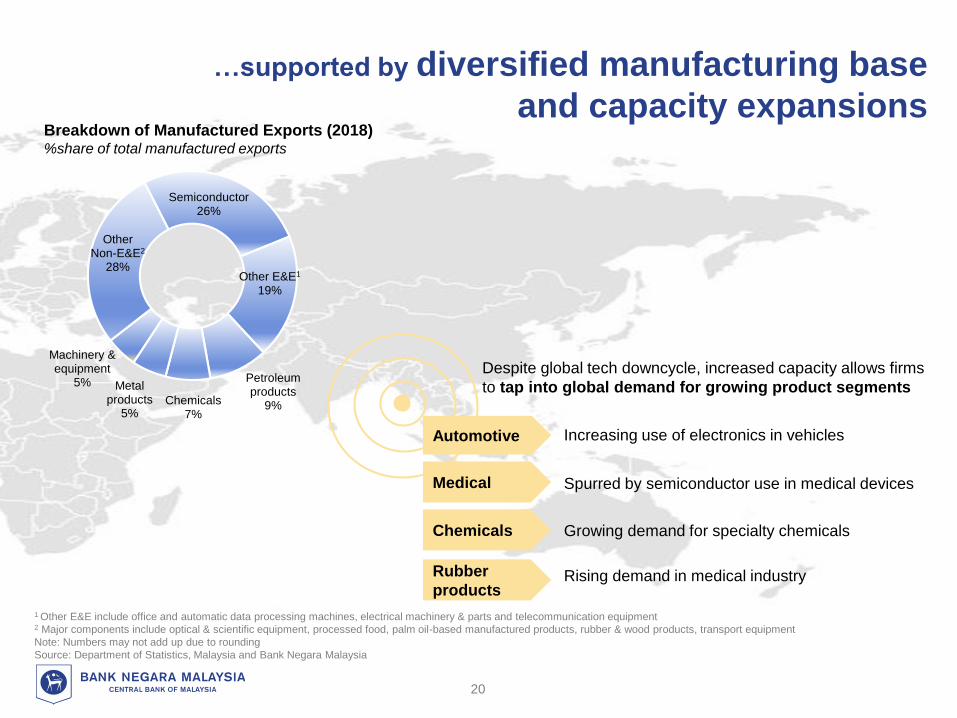
Semiconductor26%
Other E&E1
19%
Petroleum products
9%Chemicals7%
Metal products
5%
Machinery & equipment
5%
Other Non-E&E2
28%
Breakdown of Manufactured Exports (2018)%share of total manufactured exports
Despite global tech downcycle, increased capacity allows firms
to tap into global demand for growing product segments
Automotive
Medical
Increasing use of electronics in vehicles
Spurred by semiconductor use in medical devices
Chemicals
Rubber
products
Growing demand for specialty chemicals
Rising demand in medical industry
1 Other E&E include office and automatic data processing machines, electrical machinery & parts and telecommunication equipment2 Major components include optical & scientific equipment, processed food, palm oil-based manufactured products, rubber & wood products, transport equipment
Note: Numbers may not add up due to rounding
Source: Department of Statistics, Malaysia and Bank Negara Malaysia
20
…supported by diversified manufacturing base
and capacity expansions
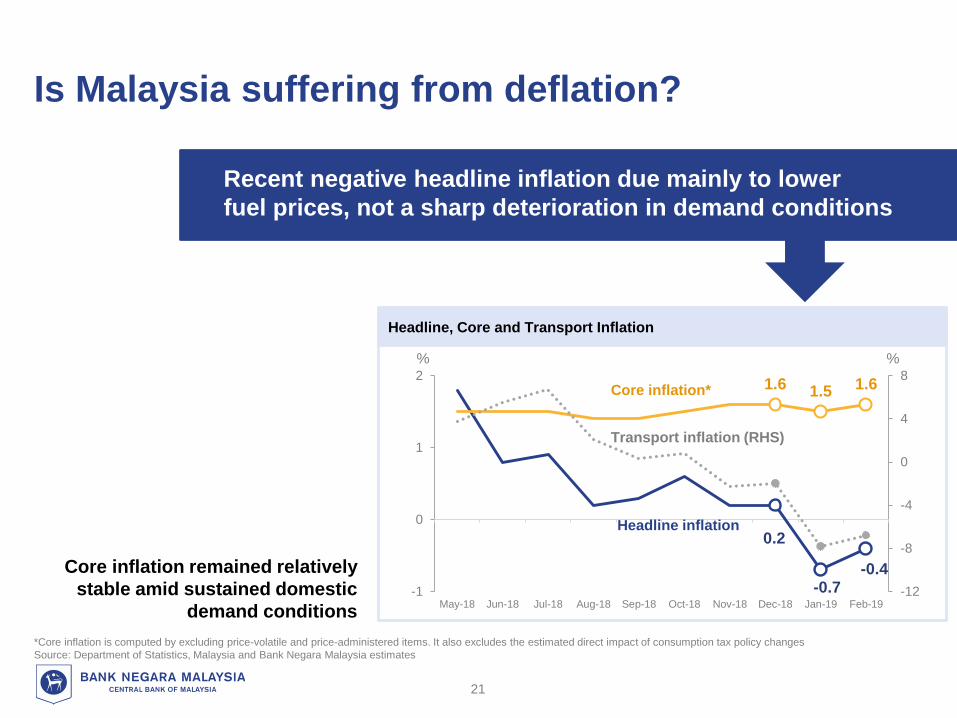
Headline, Core and Transport Inflation
Is Malaysia suffering from deflation?
21
0.2
-0.7-0.4
1.6 1.5 1.6
-12
-8
-4
0
4
8
-1
0
1
2
May-18 Jun-18 Jul-18 Aug-18 Sep-18 Oct-18 Nov-18 Dec-18 Jan-19 Feb-19
Core inflation*
Headline inflation
Transport inflation (RHS)
% %
Core inflation remained relatively
stable amid sustained domestic
demand conditions
*Core inflation is computed by excluding price-volatile and price-administered items. It also excludes the estimated direct impact of consumption tax policy changes
Source: Department of Statistics, Malaysia and Bank Negara Malaysia estimates
Recent negative headline inflation due mainly to lower
fuel prices, not a sharp deterioration in demand conditions
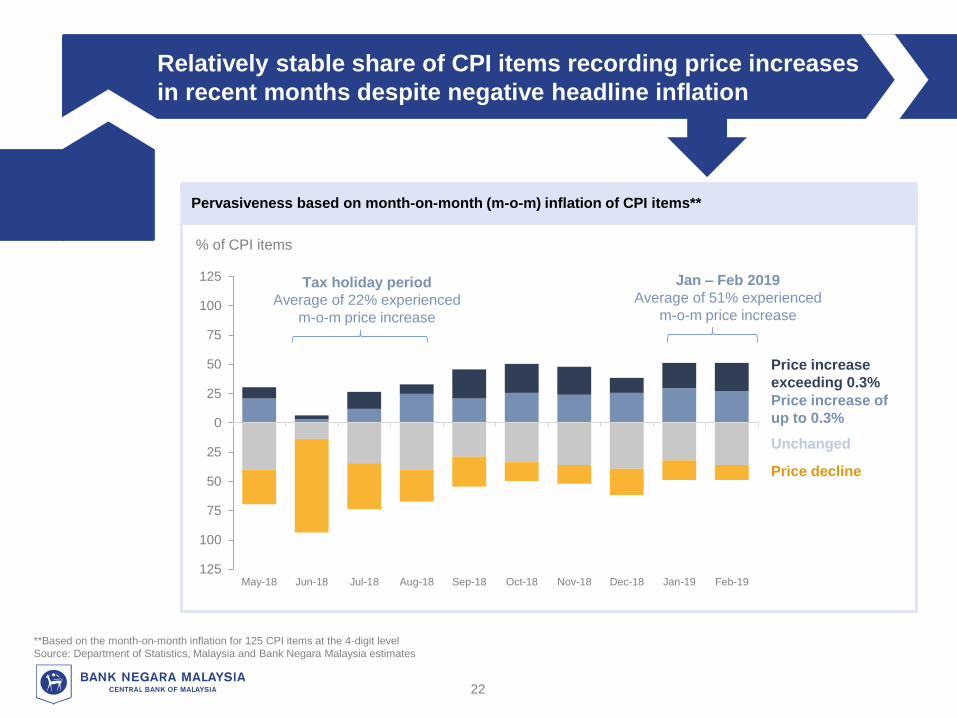
% of CPI items
125
100
75
50
25
0
25
50
75
100
125
May-18 Jun-18 Jul-18 Aug-18 Sep-18 Oct-18 Nov-18 Dec-18 Jan-19 Feb-19
Tax holiday period
Average of 22% experienced
m-o-m price increase
Price decline
Unchanged
Price increase of
up to 0.3%
Price increase
exceeding 0.3%
Jan – Feb 2019
Average of 51% experienced
m-o-m price increase
22
**Based on the month-on-month inflation for 125 CPI items at the 4-digit level
Source: Department of Statistics, Malaysia and Bank Negara Malaysia estimates
Relatively stable share of CPI items recording price increases
in recent months despite negative headline inflation
Pervasiveness based on month-on-month (m-o-m) inflation of CPI items**
*Average prices of UK Brent, West Texas Intermediate, and Dubai Fateh as forecasted by the IMF in its January 2019 update to the World Economic Outlook
Source: Department of Statistics, Malaysia and Bank Negara Malaysia estimates
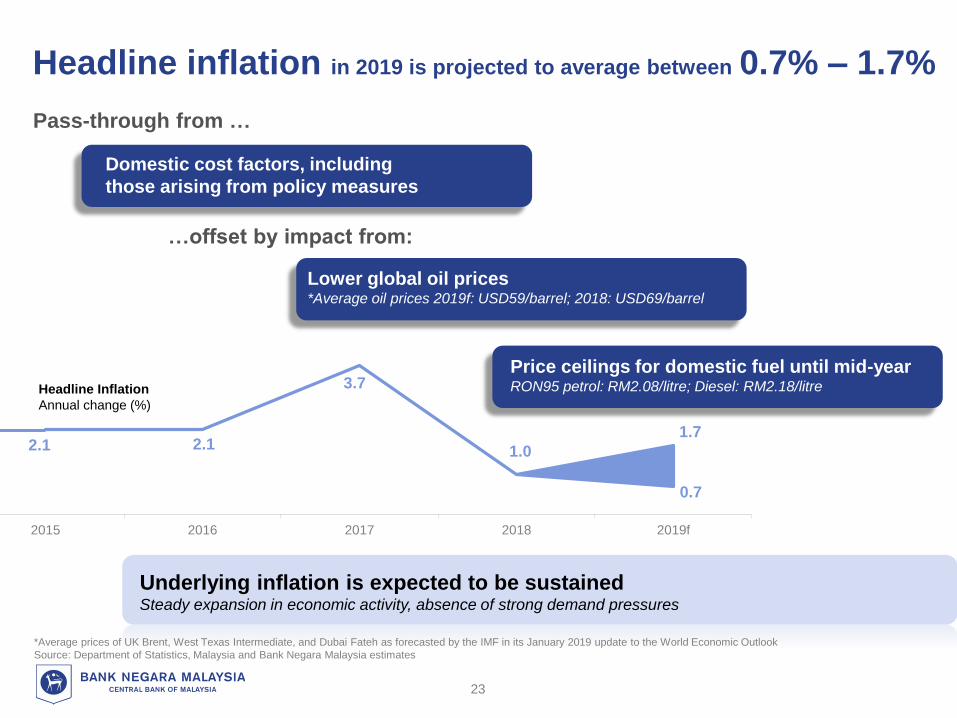
2015 2016 2017 2018 2019f
1.0
Headline Inflation
Annual change (%)
1.7
0.7
3.7
Headline inflation in 2019 is projected to average between
Underlying inflation is expected to be sustainedSteady expansion in economic activity, absence of strong demand pressures
0.7% – 1.7%
Pass-through from …
…offset by impact from:
Domestic cost factors, including
those arising from policy measures
Lower global oil prices*Average oil prices 2019f: USD59/barrel; 2018: USD69/barrel
Price ceilings for domestic fuel until mid-yearRON95 petrol: RM2.08/litre; Diesel: RM2.18/litre
23
2.12.1
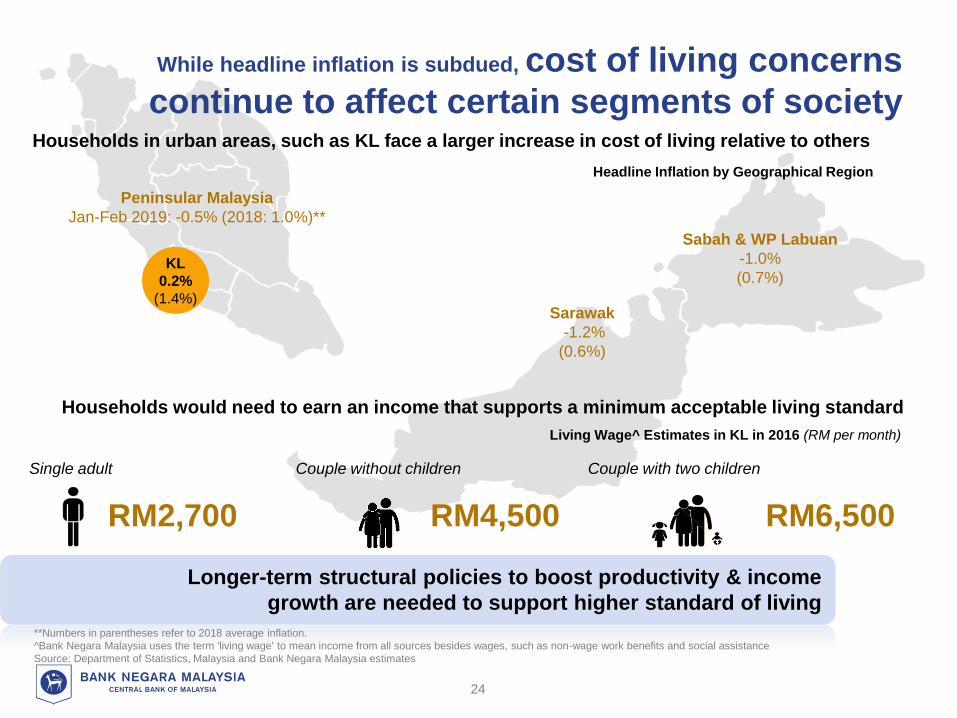
Households in urban areas, such as KL face a larger increase in cost of living relative to others
KL
0.2%
(1.4%)
Peninsular Malaysia
Jan-Feb 2019: -0.5% (2018: 1.0%)**
Headline Inflation by Geographical Region
**Numbers in parentheses refer to 2018 average inflation.
^Bank Negara Malaysia uses the term 'living wage' to mean income from all sources besides wages, such as non-wage work benefits and social assistance
Source: Department of Statistics, Malaysia and Bank Negara Malaysia estimates
Sarawak
-1.2%
(0.6%)
Sabah & WP Labuan
-1.0%
(0.7%)
Living Wage^ Estimates in KL in 2016 (RM per month)
Single adult
RM2,700
Couple without children
RM4,500
Couple with two children
RM6,500
Households would need to earn an income that supports a minimum acceptable living standard
24
While headline inflation is subdued, cost of living concerns
continue to affect certain segments of society
Longer-term structural policies to boost productivity & income
growth are needed to support higher standard of living
Productivity perspective
Equity perspective
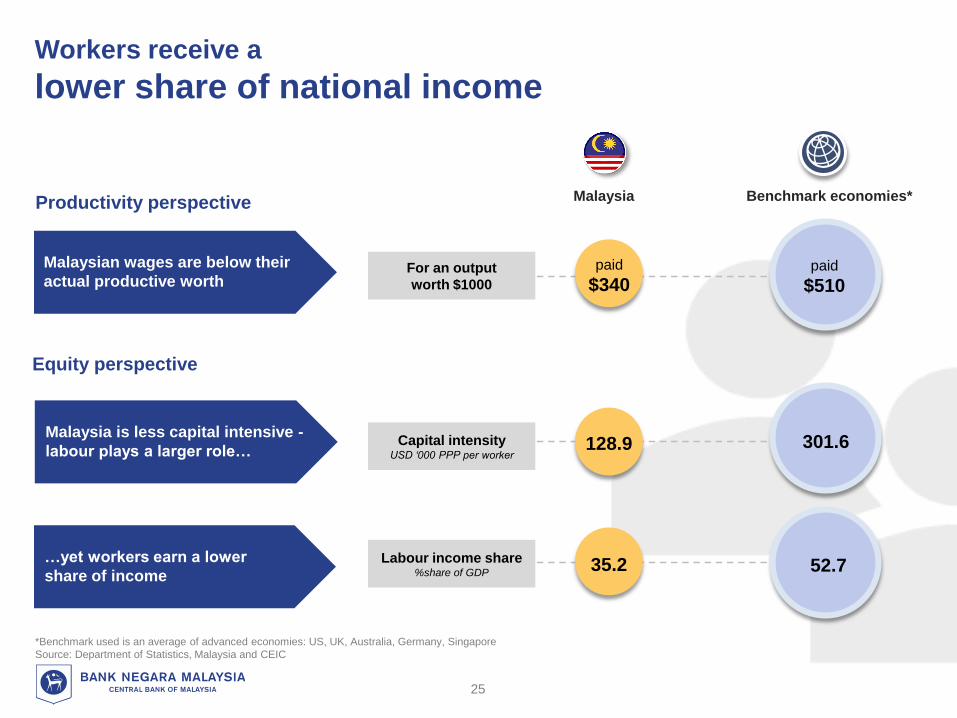
Workers receive a
lower share of national income
Capital intensityUSD ‘000 PPP per worker
Labour income share %share of GDP
128.9 301.6
35.2 52.7
Malaysian wages are below their
actual productive worth
Malaysia
*Benchmark used is an average of advanced economies: US, UK, Australia, Germany, Singapore
Source: Department of Statistics, Malaysia and CEIC
Benchmark economies*
For an output
worth $1000
paid
$340
Malaysia is less capital intensive -
labour plays a larger role…
…yet workers earn a lower
share of income
paid
$510
25
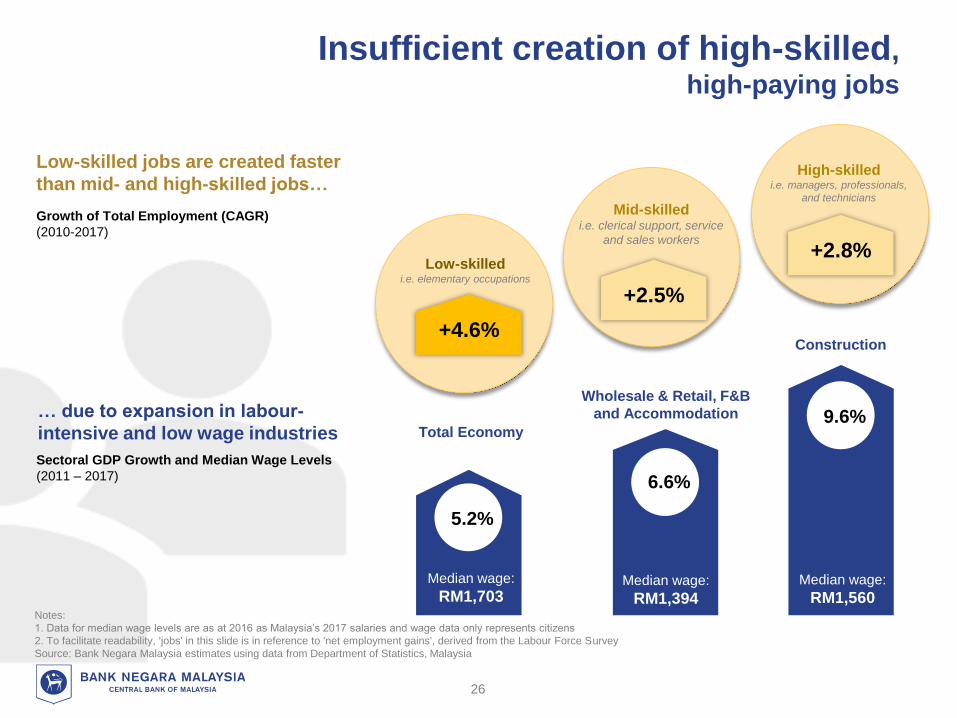
Insufficient creation of high-skilled, high-paying jobs
Low-skilled jobs are created faster
than mid- and high-skilled jobs…
… due to expansion in labour-
intensive and low wage industries
Notes:
1. Data for median wage levels are as at 2016 as Malaysia’s 2017 salaries and wage data only represents citizens
2. To facilitate readability, 'jobs' in this slide is in reference to 'net employment gains', derived from the Labour Force Survey
Source: Bank Negara Malaysia estimates using data from Department of Statistics, Malaysia
High-skilledi.e. managers, professionals,
and technicians
Low-skilledi.e. elementary occupations
Mid-skilledi.e. clerical support, service
and sales workers
Growth of Total Employment (CAGR)
(2010-2017)
+2.5%
+4.6%Construction
Sectoral GDP Growth and Median Wage Levels
(2011 – 2017)
Median wage:
RM1,560
9.6%Wholesale & Retail, F&B
and Accommodation
Median wage:
RM1,394
6.6%
Total Economy
Median wage:
RM1,703
5.2%
+2.8%
26
2019
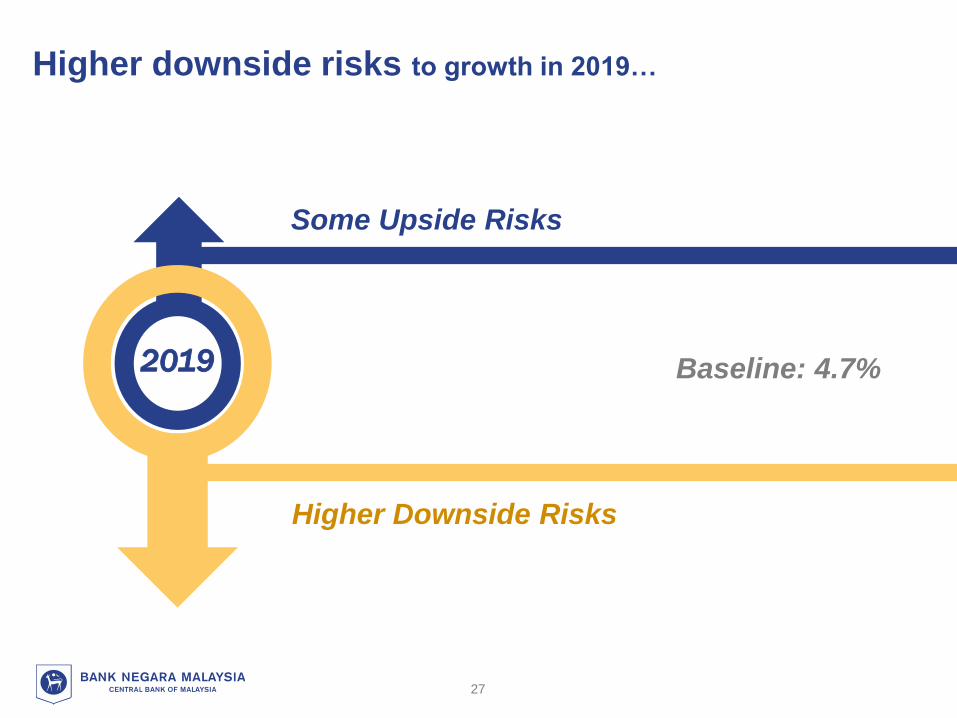
Higher downside risks to growth in 2019…
Baseline: 4.7%
Some Upside Risks
Higher Downside Risks
27
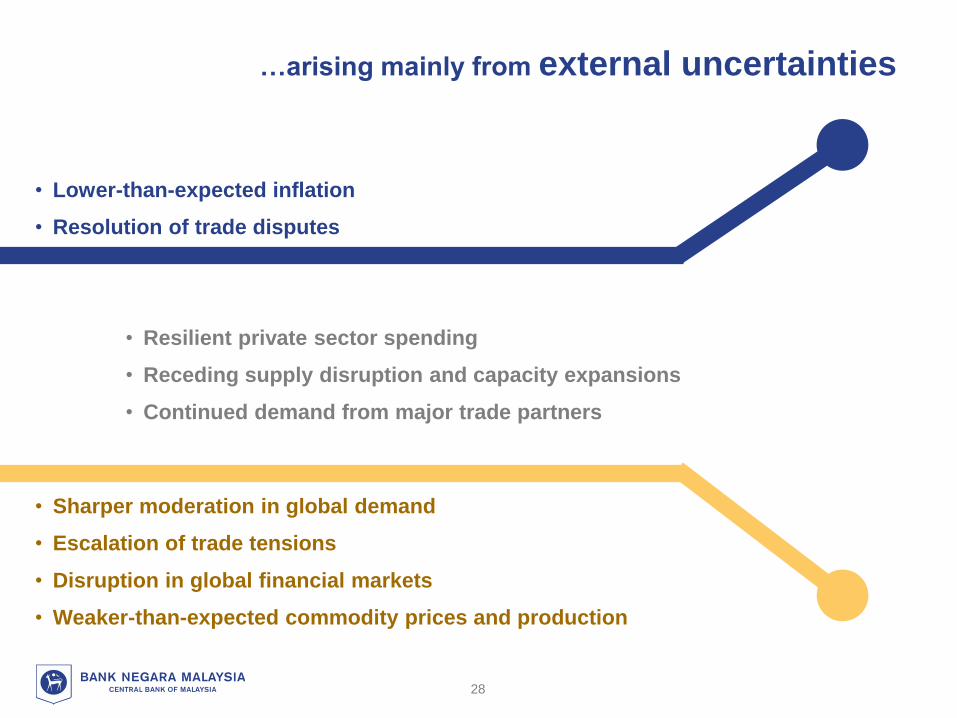
…arising mainly from external uncertainties
• Sharper moderation in global demand
• Escalation of trade tensions
• Disruption in global financial markets
• Weaker-than-expected commodity prices and production
• Resilient private sector spending
• Receding supply disruption and capacity expansions
• Continued demand from major trade partners
• Lower-than-expected inflation
• Resolution of trade disputes
28
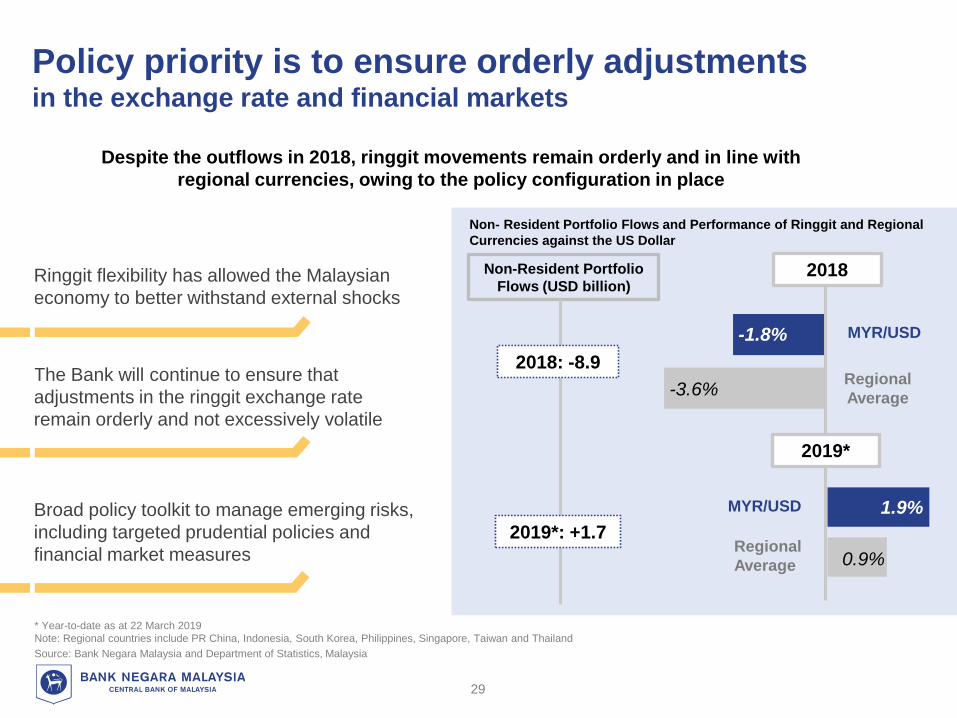
Policy priority is to ensure orderly adjustments in the exchange rate and financial markets
Non- Resident Portfolio Flows and Performance of Ringgit and Regional
Currencies against the US Dollar
* Year-to-date as at 22 March 2019
Note: Regional countries include PR China, Indonesia, South Korea, Philippines, Singapore, Taiwan and Thailand
Source: Bank Negara Malaysia and Department of Statistics, Malaysia
Ringgit flexibility has allowed the Malaysian
economy to better withstand external shocks
-1.8%
Despite the outflows in 2018, ringgit movements remain orderly and in line with
regional currencies, owing to the policy configuration in place
-3.6%
1.9%
0.9%
MYR/USD
Regional
Average
MYR/USD
Regional
Average
2018
2019*
29
The Bank will continue to ensure that
adjustments in the ringgit exchange rate
remain orderly and not excessively volatile
Broad policy toolkit to manage emerging risks,
including targeted prudential policies and
financial market measures
Non-Resident Portfolio
Flows (USD billion)
2018: -8.9
2019*: +1.7
Updated
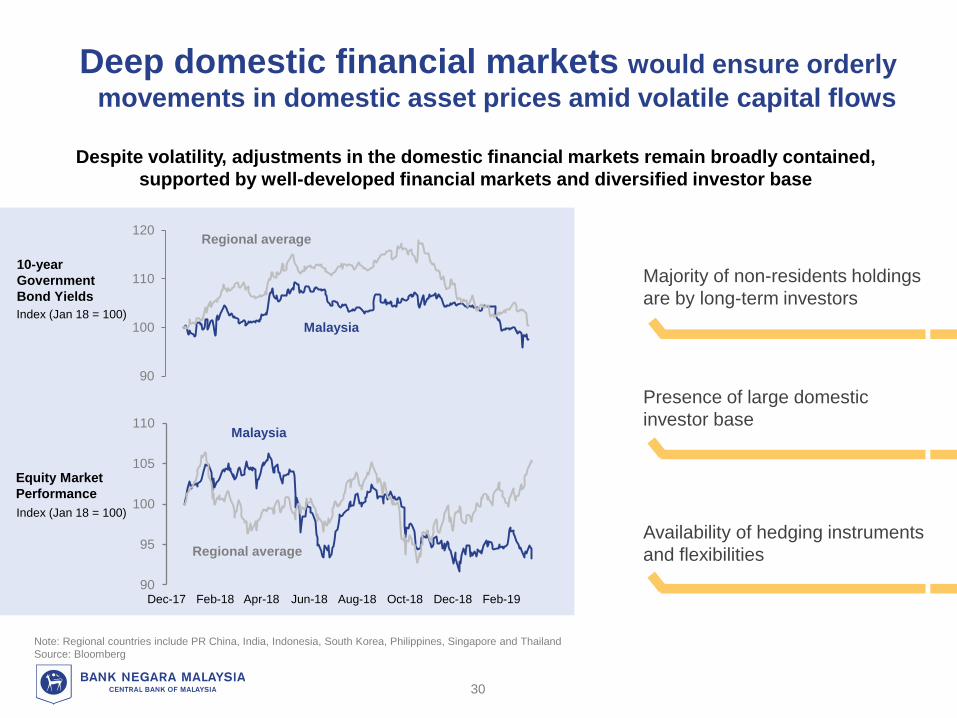
Deep domestic financial markets would ensure orderly
movements in domestic asset prices amid volatile capital flows
Note: Regional countries include PR China, India, Indonesia, South Korea, Philippines, Singapore and Thailand
Source: Bloomberg
Despite volatility, adjustments in the domestic financial markets remain broadly contained,
supported by well-developed financial markets and diversified investor base
Majority of non-residents holdings
are by long-term investors
Presence of large domestic
investor base
Availability of hedging instruments
and flexibilities
30
10-year
Government
Bond Yields
Equity Market
Performance
Index (Jan 18 = 100)
Index (Jan 18 = 100)
90
100
110
120
90
95
100
105
110
Dec-17 Feb-18 Apr-18 Jun-18 Aug-18 Oct-18 Dec-18 Feb-19
Regional average
Malaysia
Regional average
Malaysia
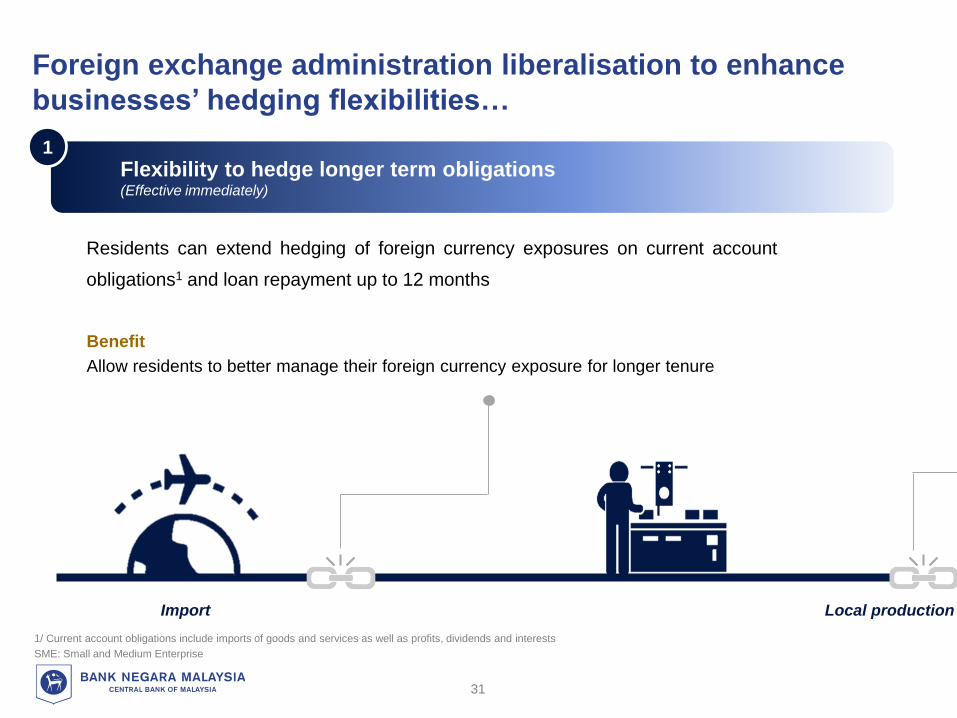
Import Local production chain
Flexibility to hedge longer term obligations(Effective immediately)
1
Foreign exchange administration liberalisation to enhance
businesses’ hedging flexibilities…
1/ Current account obligations include imports of goods and services as well as profits, dividends and interests
SME: Small and Medium Enterprise
31
Residents can extend hedging of foreign currency exposures on current account
obligations1 and loan repayment up to 12 months
Benefit
Allow residents to better manage their foreign currency exposure for longer tenure
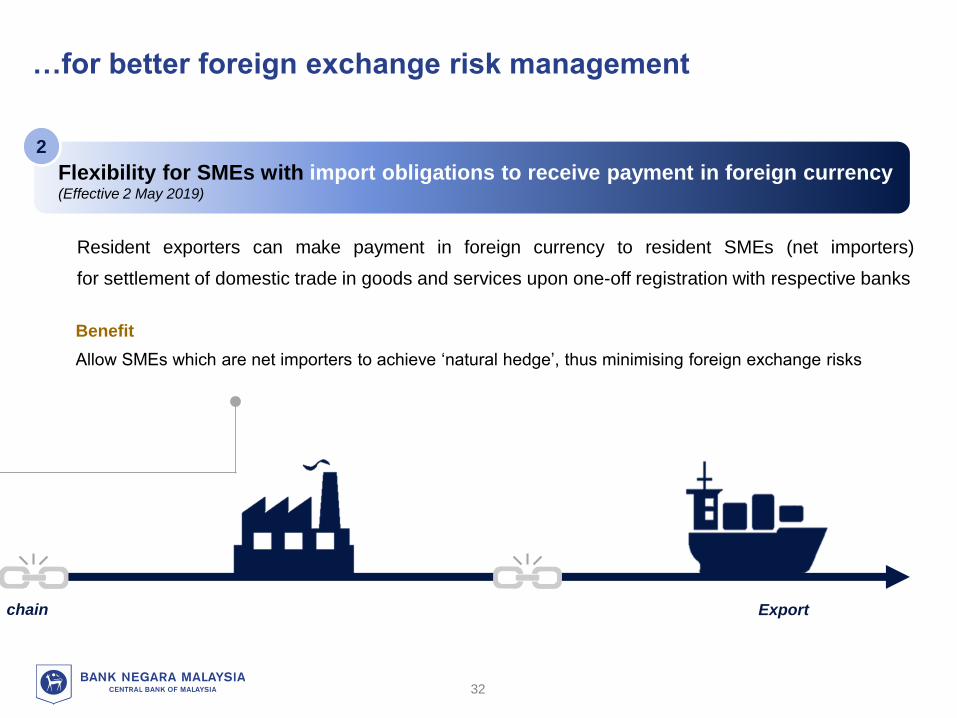
Exportchain
Resident exporters can make payment in foreign currency to resident SMEs (net importers)
for settlement of domestic trade in goods and services upon one-off registration with respective banks
Benefit
Allow SMEs which are net importers to achieve ‘natural hedge’, thus minimising foreign exchange risks
…for better foreign exchange risk management
2
32
Flexibility for SMEs with import obligations to receive payment in foreign currency(Effective 2 May 2019)
Source: Bank Negara Malaysia, IMF, and World Bank
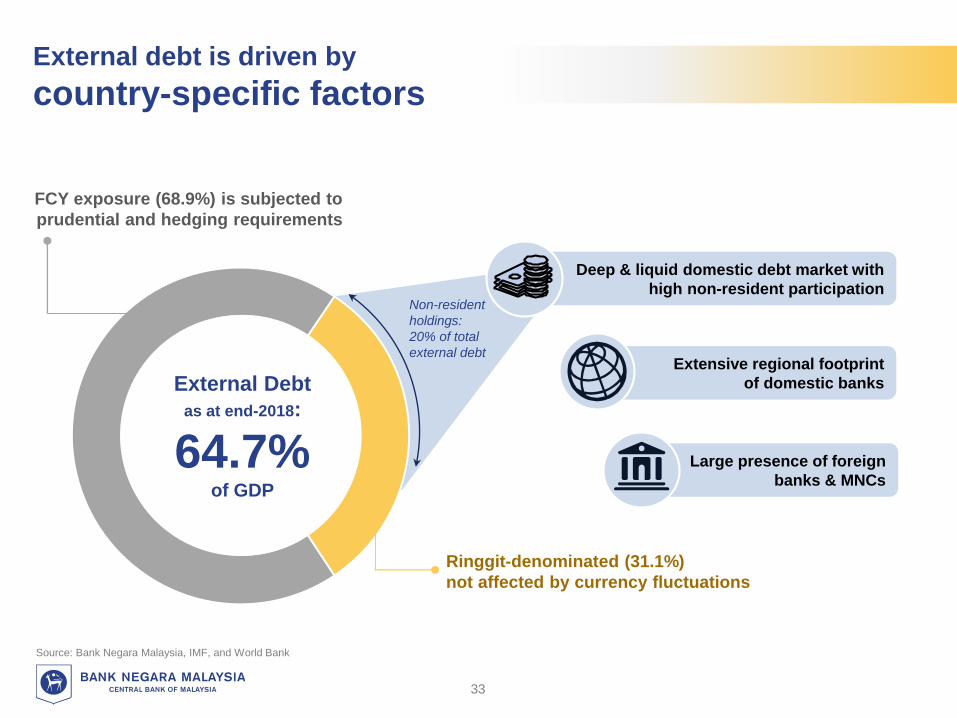
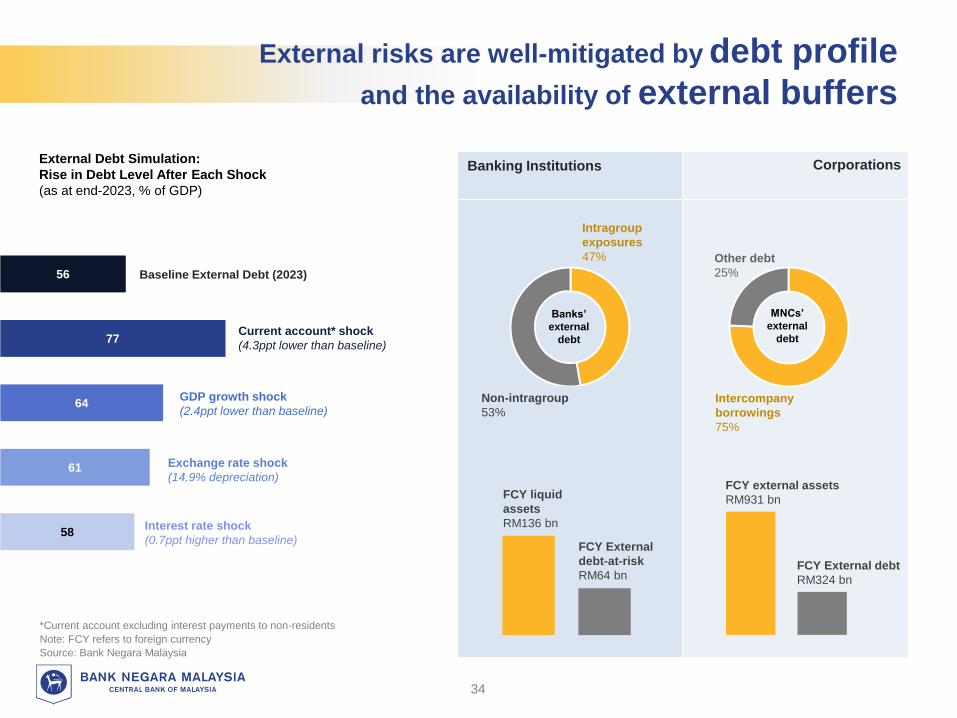
External debt is driven by
country-specific factors
33
Large presence of foreign
banks & MNCs
Extensive regional footprint
of domestic banks
Deep & liquid domestic debt market with
high non-resident participation
FCY exposure (68.9%) is subjected to
prudential and hedging requirements
Ringgit-denominated (31.1%)
not affected by currency fluctuations
Non-resident
holdings:
20% of total
external debt
External Debt
as at end-2018:
64.7% of GDP
*Current account excluding interest payments to non-residents
Note: FCY refers to foreign currency
Source: Bank Negara Malaysia
58
61
64
77
56
External Debt Simulation:
Rise in Debt Level After Each Shock
(as at end-2023, % of GDP)
Baseline External Debt (2023)
Interest rate shock
(0.7ppt higher than baseline)
Exchange rate shock
(14.9% depreciation)
GDP growth shock
(2.4ppt lower than baseline)
Current account* shock
(4.3ppt lower than baseline)
64.0%
Intragroup
exposures
47%
Banks’
external
debt
Non-intragroup
53%
FCY liquid
assets
RM136 bn
FCY External
debt-at-risk
RM64 bnFCY External debt
RM324 bn
FCY external assets
RM931 bn
Other debt
25%
MNCs’
external
debt
Intercompany
borrowings
75%
Banking Institutions Corporations
External risks are well-mitigated by debt profile
and the availability of external buffers
34
Baseline growth to remain steady between 4.3% - 4.8%
How will monetary policy support
sustainable growth with price stability
in 2019 and 2020?
35

• Close monitoring of global and domestic developments for the potential
impact to domestic growth, inflation and financial conditions is key
– Monetary policy considerations are complex and multifaceted
• Monetary operations will continue to ensure sufficient liquidity to support
financial intermediation activity
• At the current level of OPR, the stance of monetary policy remains
accommodative and supportive of economic activity
2.75
3.00
3.25
3.00
3.25
2011 2012 2013 2014 2015 2016 2017 2018 2019
Source: Bank Negara Malaysia
Overnight Policy Rate, %
36
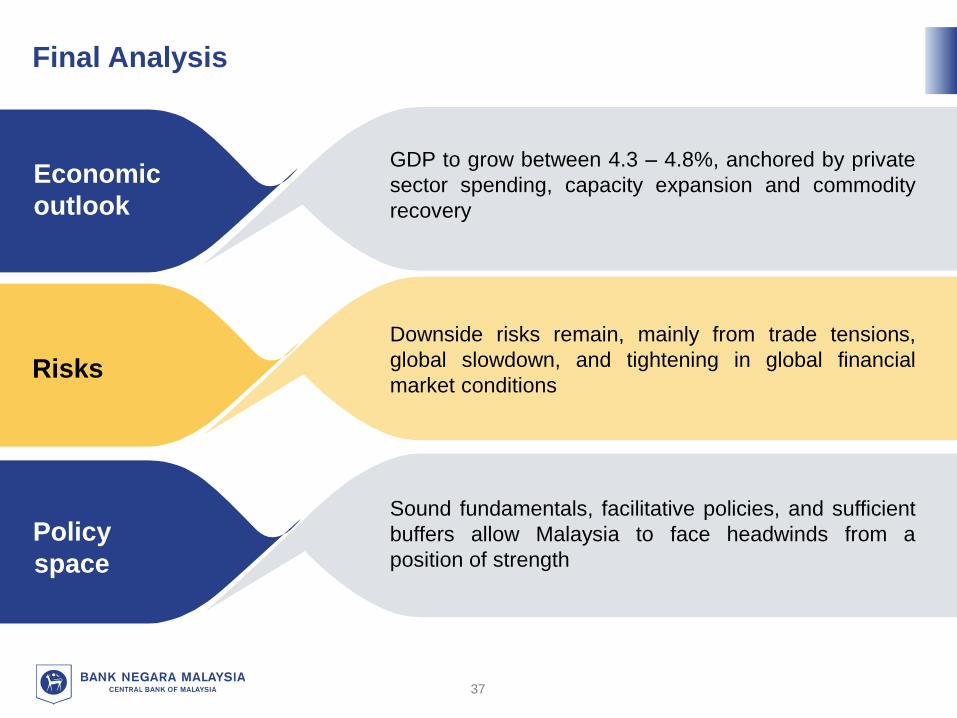
Final Analysis
GDP to grow between 4.3 – 4.8%, anchored by private
sector spending, capacity expansion and commodity
recovery
Economic
outlook
Risks
Downside risks remain, mainly from trade tensions,
global slowdown, and tightening in global financial
market conditions
Policy
space
Sound fundamentals, facilitative policies, and sufficient
buffers allow Malaysia to face headwinds from a
position of strength
37

Diversified
Economic Structure
Facilitative
PoliciesSufficient
Financial
Buffers
• Diversified trade, economic sectors and investments
• Private sector-led economy
• Business-friendly environment
• Accommodative monetary
policy
• Macroprudential measures
• Targeted Govt. measures to
households
• Deep financial markets
• Flexible exchange rate
• Adequate international reserves
• Sustained current account surplus
(2019f: 1.5 – 2.5% of GNI)
Solid economic foundation to support steady growth
38
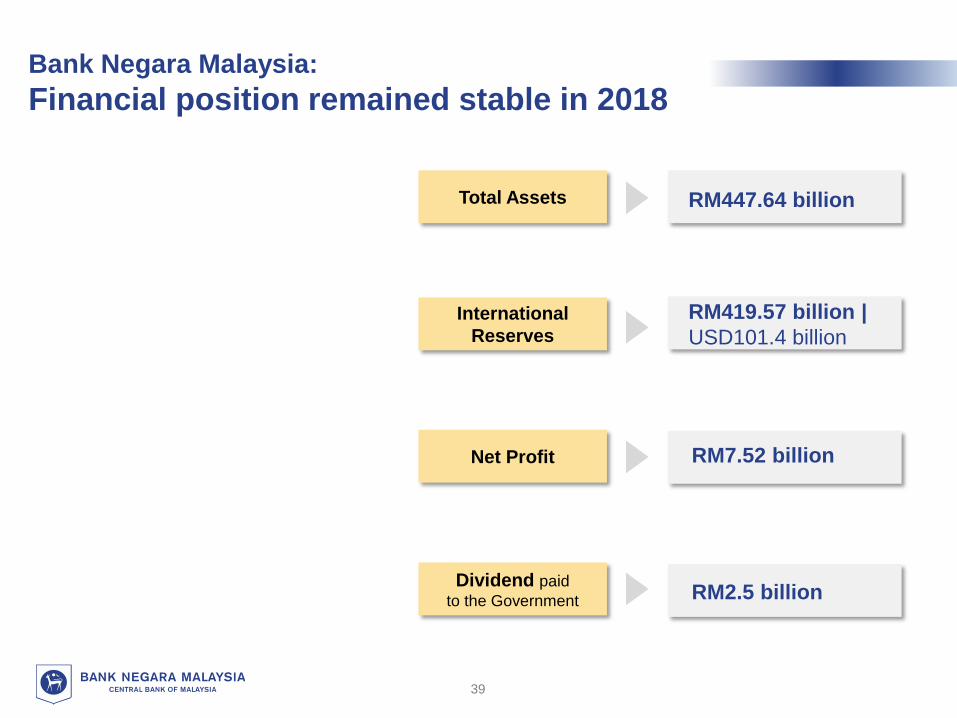
Bank Negara Malaysia:
Financial position remained stable in 2018
RM447.64 billion
RM7.52 billion
Total Assets
International
Reserves
Net Profit
Dividend paid
to the Government
RM419.57 billion |
USD101.4 billion
RM2.5 billion
39
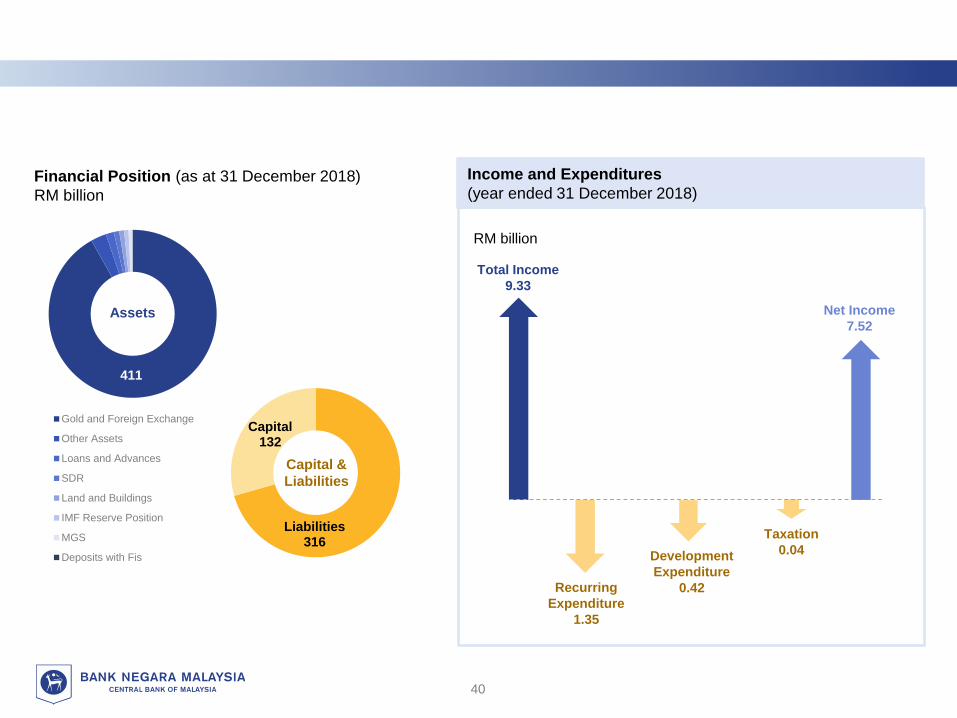
411
Gold and Foreign Exchange
Other Assets
Loans and Advances
SDR
Land and Buildings
IMF Reserve Position
MGS
Deposits with Fis
Liabilities316
Capital132
Financial Position (as at 31 December 2018)
RM billion
RM billion
Assets
Capital &
Liabilities
Total Income
9.33
Taxation
0.04Development
Expenditure
0.42Recurring
Expenditure
1.35
Net Income
7.52
Income and Expenditures
(year ended 31 December 2018)
40
BANK NEGARA MALAYSIA
2018 FINANCIAL STABILITY AND PAYMENT SYSTEMS REPORT
41
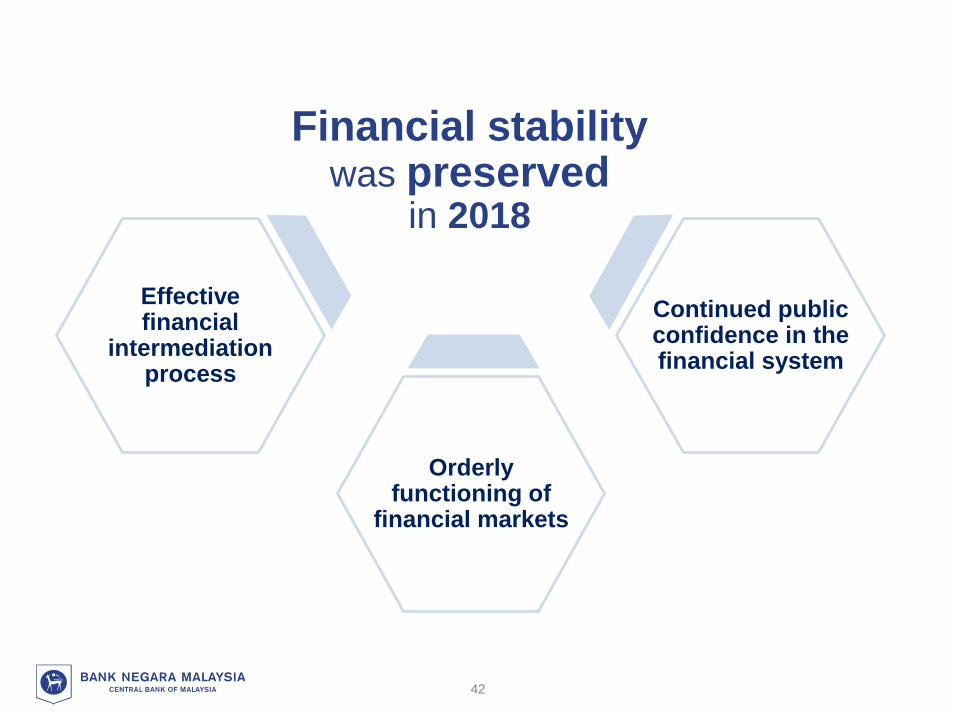
Financial stability was preserved
in 2018
Continued public confidence in the financial system
Orderly functioning of
financial markets
Effective financial
intermediation process
42
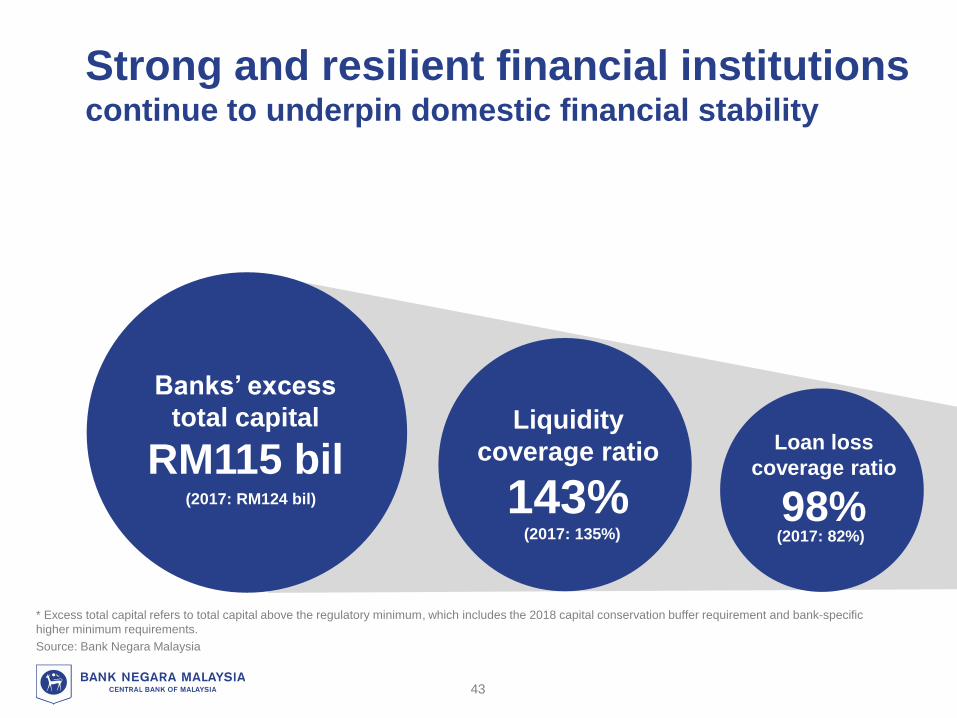
Strong and resilient financial institutions continue to underpin domestic financial stability
Banks’ excess
total capital
RM115 bilLiquidity
coverage ratio
143%
Loan loss
coverage ratio
98% (2017: 135%)
(2017: RM124 bil)
(2017: 82%)
* Excess total capital refers to total capital above the regulatory minimum, which includes the 2018 capital conservation buffer requirement and bank-specific
higher minimum requirements.
Source: Bank Negara Malaysia
43
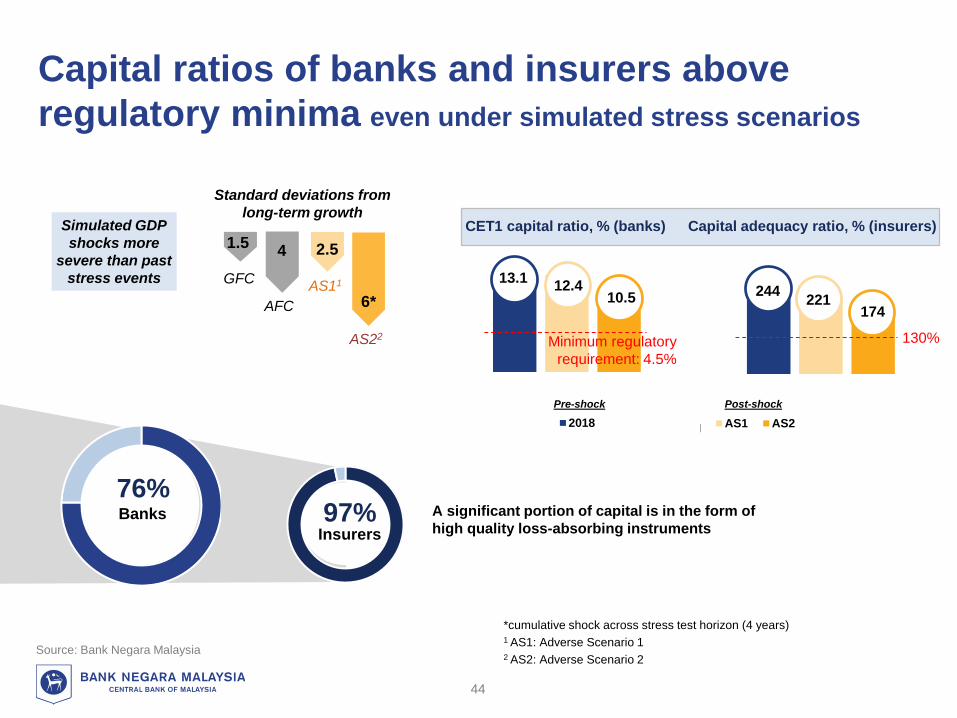
Capital ratios of banks and insurers above
regulatory minima even under simulated stress scenarios
Source: Bank Negara Malaysia
*cumulative shock across stress test horizon (4 years)1 AS1: Adverse Scenario 12 AS2: Adverse Scenario 2
13.1 12.410.56*
2.541.5
GFC
AFC
Simulated GDP
shocks more
severe than past
stress events
Standard deviations from
long-term growth
AS11
AS22
CET1 capital ratio, % (banks)
76%
Capital adequacy ratio, % (insurers)
13.112.4
10.5
Banks
111CET1 capital ratio (banks)2018 1…1…1…
CET1 capital ratio (banks)AS1 AS2
Pre-shock Post-shock
244221
174
244221
174
97% Insurers
A significant portion of capital is in the form of
high quality loss-absorbing instruments
Minimum regulatory
requirement: 4.5%
130%
44
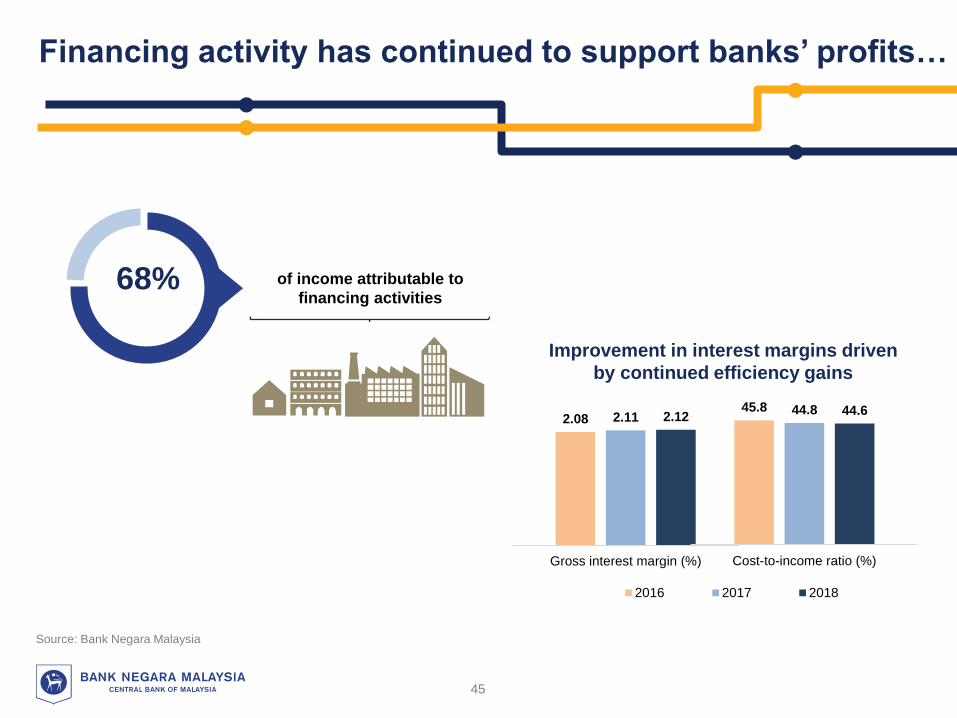
Financing activity has continued to support banks’ profits…
Source: Bank Negara Malaysia
68% of income attributable to
financing activities
Improvement in interest margins driven
by continued efficiency gains
2.08 2.11 2.12
Gross interest margin (%)
2016 2017 2018
45.8 44.8 44.6
Cost-to-income ratio (%)
45
…with profitability levels largely in line with rating and
regional peers
* Includes off-balance sheet items
Source: Bank Negara Malaysia
1.4% Return on assets
(2017: 1.5%)
12.6% Return on equity
(2017: 13.0%)
5.6% Loan growth
2.9% Pre-tax profit
Although profits grew at a
slower pace compared
to business activities
Total assets* Total equity
3.6%
5.9%
2018 annual growth2018 annual growth
46
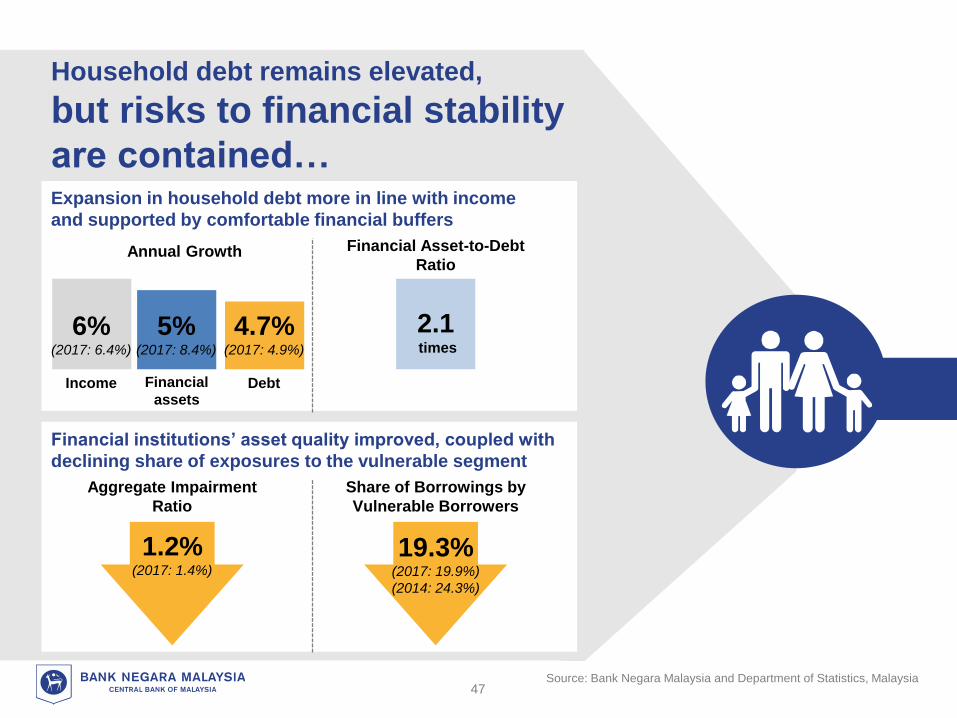
Household debt remains elevated,
but risks to financial stability
are contained…
Annual Growth
Share of Borrowings by
Vulnerable Borrowers
19.3%(2017: 19.9%)
(2014: 24.3%)
Aggregate Impairment
Ratio
Financial Asset-to-Debt
Ratio
4.7%(2017: 4.9%)
Debt
Expansion in household debt more in line with income
and supported by comfortable financial buffers
Financial institutions’ asset quality improved, coupled with
declining share of exposures to the vulnerable segment
2.1times
1.2%(2017: 1.4%)
6%(2017: 6.4%)
Income
5%(2017: 8.4%)
Financial
assets
Source: Bank Negara Malaysia and Department of Statistics, Malaysia47
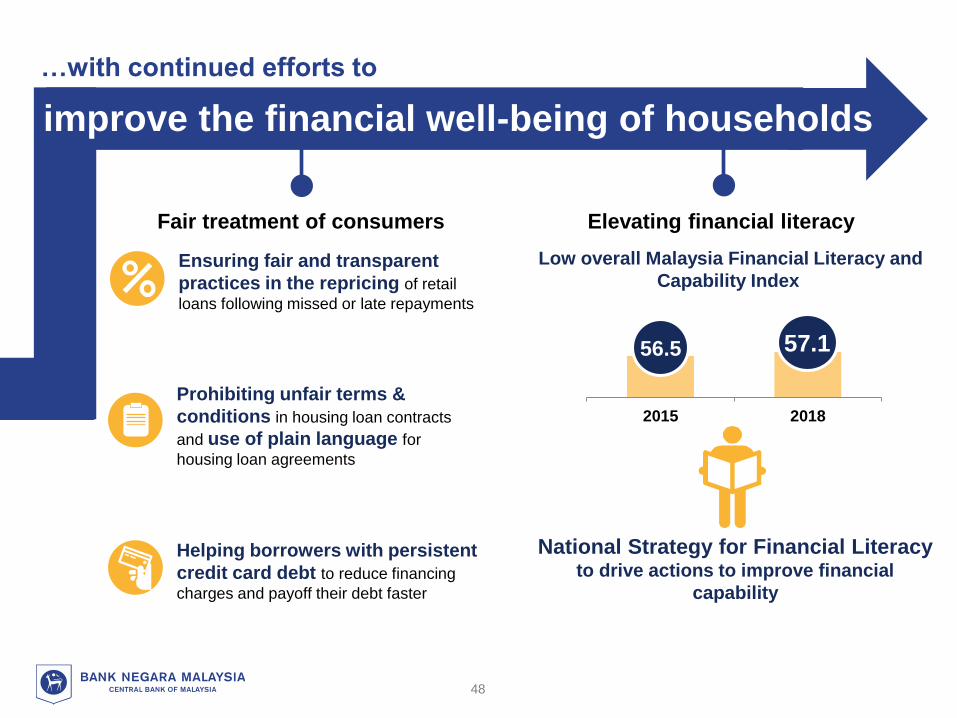
2015 2018
56.5 57.1
improve the financial well-being of households
…with continued efforts to
Ensuring fair and transparent
practices in the repricing of retail
loans following missed or late repayments
Prohibiting unfair terms &
conditions in housing loan contracts
and use of plain language for
housing loan agreements
Helping borrowers with persistent
credit card debt to reduce financing
charges and payoff their debt faster
Fair treatment of consumers Elevating financial literacy
Low overall Malaysia Financial Literacy and
Capability Index
National Strategy for Financial Literacy to drive actions to improve financial
capability
48
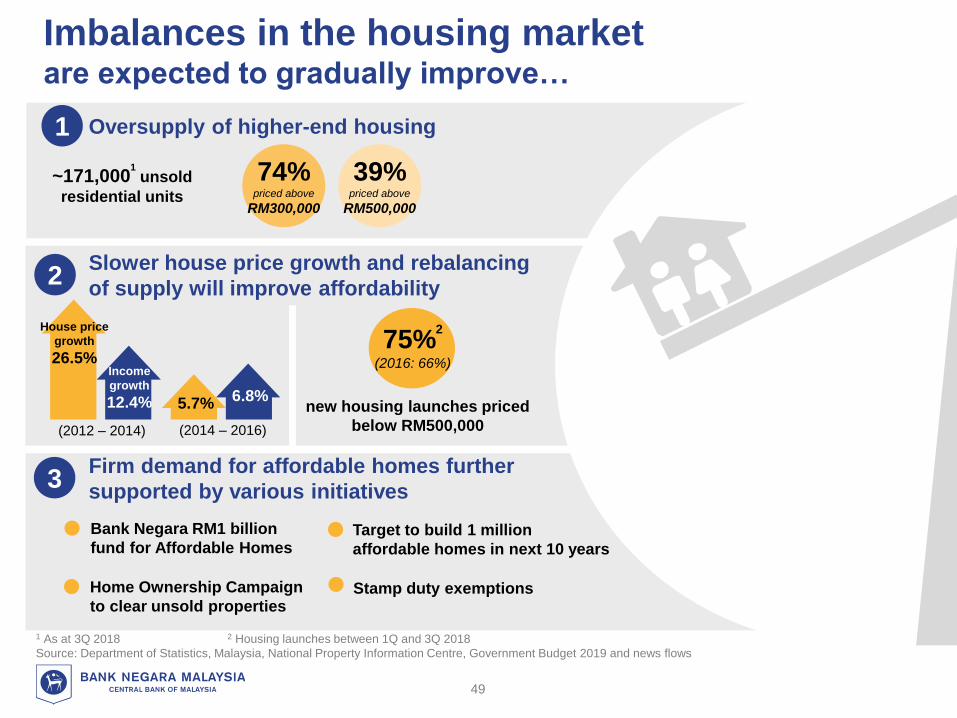
Imbalances in the housing marketare expected to gradually improve…
~171,0001
unsold
residential units
1 Oversupply of higher-end housing
2Slower house price growth and rebalancing
of supply will improve affordability
3Firm demand for affordable homes further
supported by various initiatives
75%2
(2016: 66%)
new housing launches priced
below RM500,000
Bank Negara RM1 billion
fund for Affordable Homes
Home Ownership Campaign
to clear unsold properties
Target to build 1 million
affordable homes in next 10 years
Stamp duty exemptions
1 As at 3Q 2018 2 Housing launches between 1Q and 3Q 2018
Source: Department of Statistics, Malaysia, National Property Information Centre, Government Budget 2019 and news flows
6.8
2012 - 2014 2014 - 2016
House price
growth
26.5%Income
growth
12.4% 5.7% 6.8%
(2014 – 2016)(2012 – 2014)
74%priced above
RM300,000
39%priced above
RM500,000
49
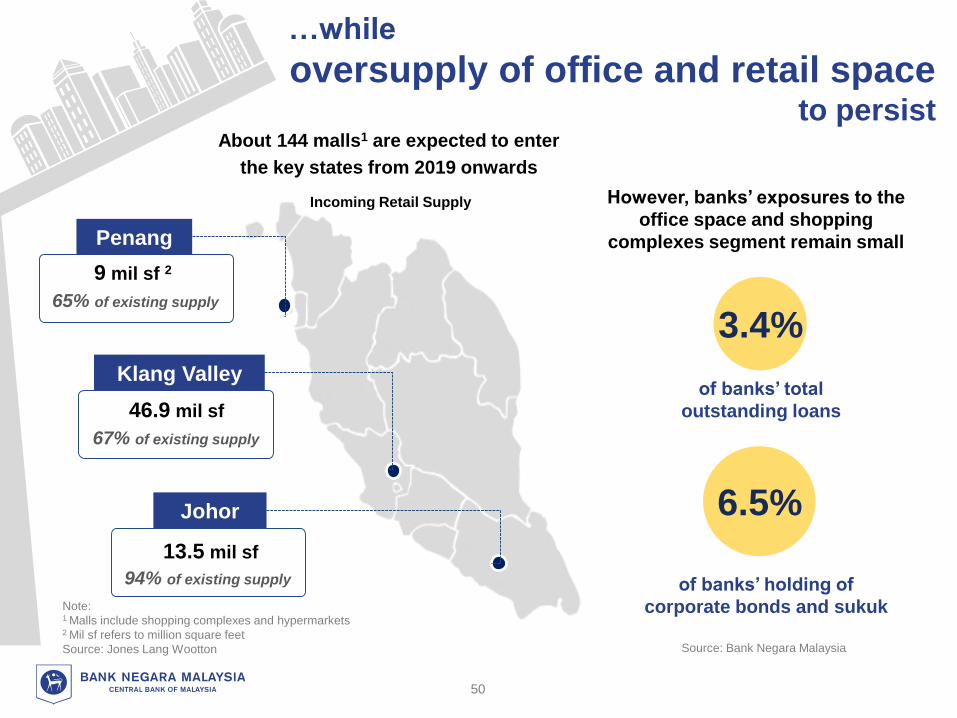
…while
oversupply of office and retail space to persist
Incoming Retail Supply
Johor
13.5 mil sf
94% of existing supply
Klang Valley
Penang
46.9 mil sf
67% of existing supply
9 mil sf 2
65% of existing supply
About 144 malls1 are expected to enter
the key states from 2019 onwards
Note: 1 Malls include shopping complexes and hypermarkets2 Mil sf refers to million square feet
Source: Jones Lang Wootton
However, banks’ exposures to the
office space and shopping
complexes segment remain small
3.4%
6.5%
of banks’ total
outstanding loans
of banks’ holding of
corporate bonds and sukuk
Source: Bank Negara Malaysia
50
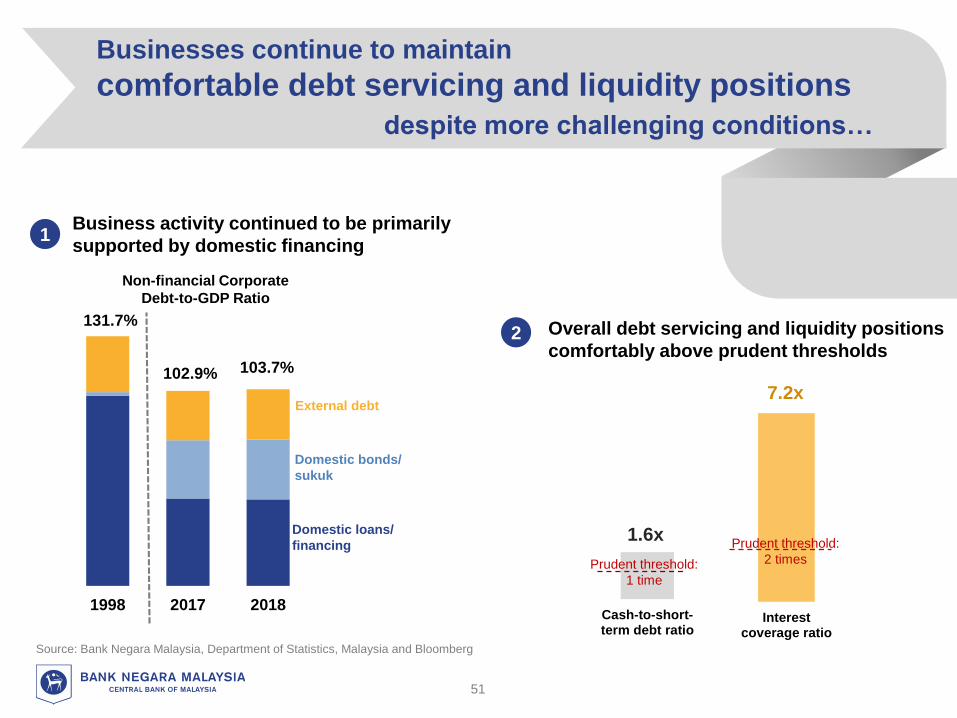
Businesses continue to maintain
comfortable debt servicing and liquidity positions
despite more challenging conditions…
Business activity continued to be primarily
supported by domestic financing1
1998 2017 2018
131.7%
102.9% 103.7%
Non-financial Corporate
Debt-to-GDP Ratio
Domestic loans/
financing
Domestic bonds/
sukuk
External debt
Overall debt servicing and liquidity positions
comfortably above prudent thresholds2
Interestcoverage ratio
Cash-to-short-term debt ratio
7.2x
1.6xPrudent threshold:
2 timesPrudent threshold:
1 time
Source: Bank Negara Malaysia, Department of Statistics, Malaysia and Bloomberg
51
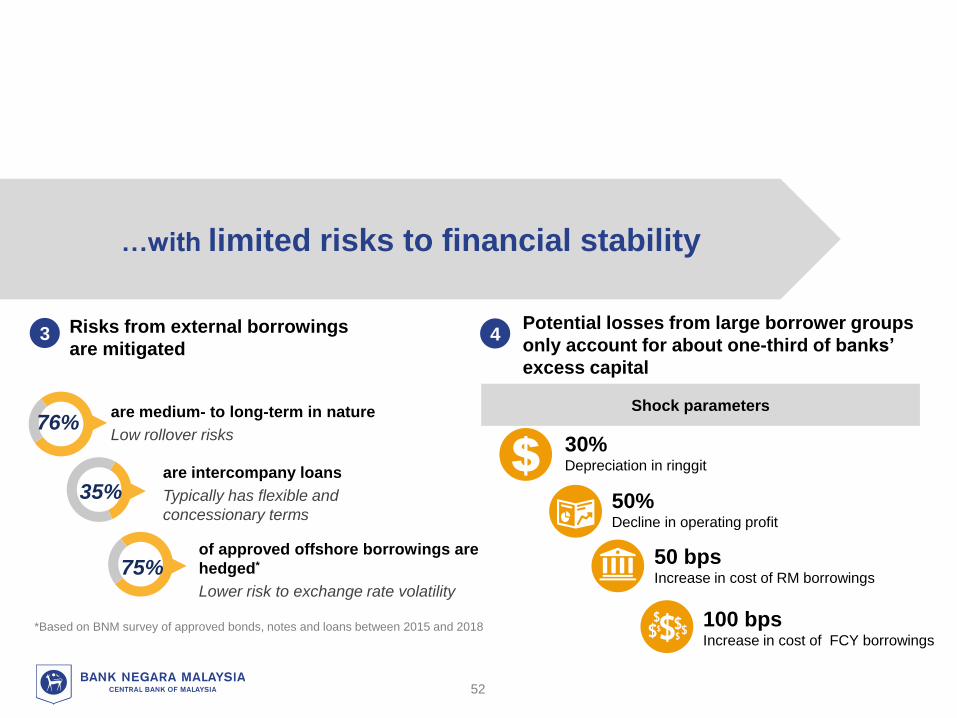
*Based on BNM survey of approved bonds, notes and loans between 2015 and 2018
…with limited risks to financial stability
are medium- to long-term in nature
Low rollover risks
are intercompany loans
Typically has flexible and
concessionary terms
of approved offshore borrowings are
hedged*
Lower risk to exchange rate volatility
76%
35%
75%
Potential losses from large borrower groups
only account for about one-third of banks’
excess capital
4Risks from external borrowings
are mitigated3
30%Depreciation in ringgit
50%Decline in operating profit
50 bpsIncrease in cost of RM borrowings
100 bpsIncrease in cost of FCY borrowings
Shock parameters
52
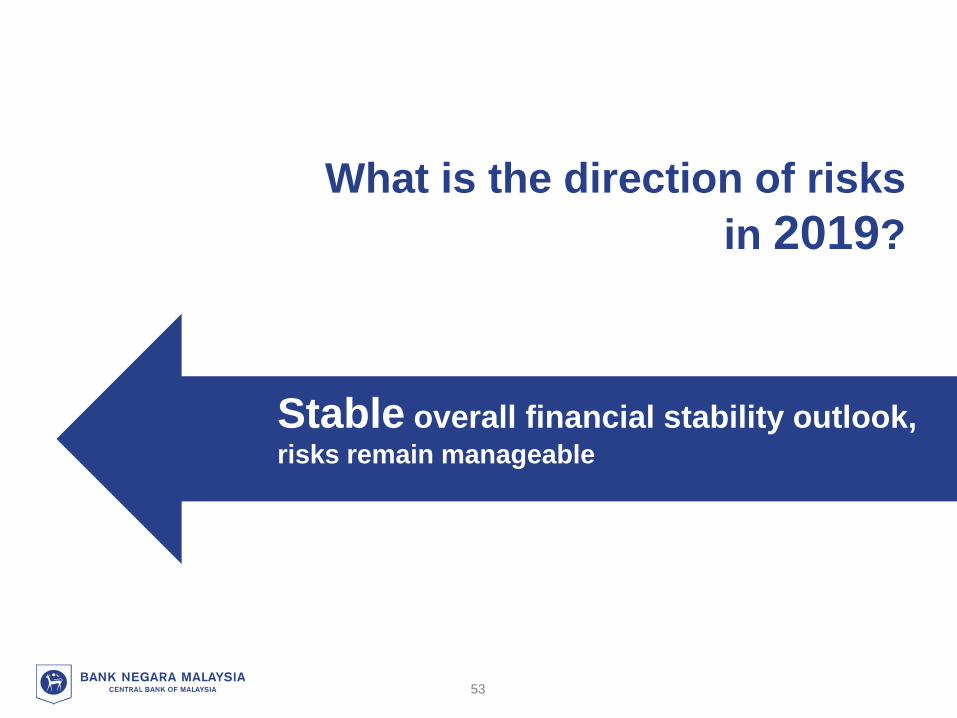
What is the direction of risks
in 2019?
Malaysia’s
GDP growth:
4.7%
Stable overall financial stability outlook,risks remain manageable
53
Pockets of risks continue to persist, but households largely
buffered by stable income and employment prospects
Healthy overall debt servicing and liquidity positions despite
continued challenging conditions for oil and gas, property and
construction sectors
Banks expected to remain resilient, even under adverse
macro-economic and financial conditions
Households
Financial Markets
Financial Institutions
Businesses
Unsold housing units may rise in the near term amid continuing
adjustments in supply towards more affordable segments. Risks
remain elevated in the office space and shopping complex segment
Property
Disorderly adjustments in global financial markets, unresolved trade tensions and geopolitical
events may trigger outflows. Strong domestic institutional investors and further development of
the onshore FX market will continue to support orderly market conditions
54
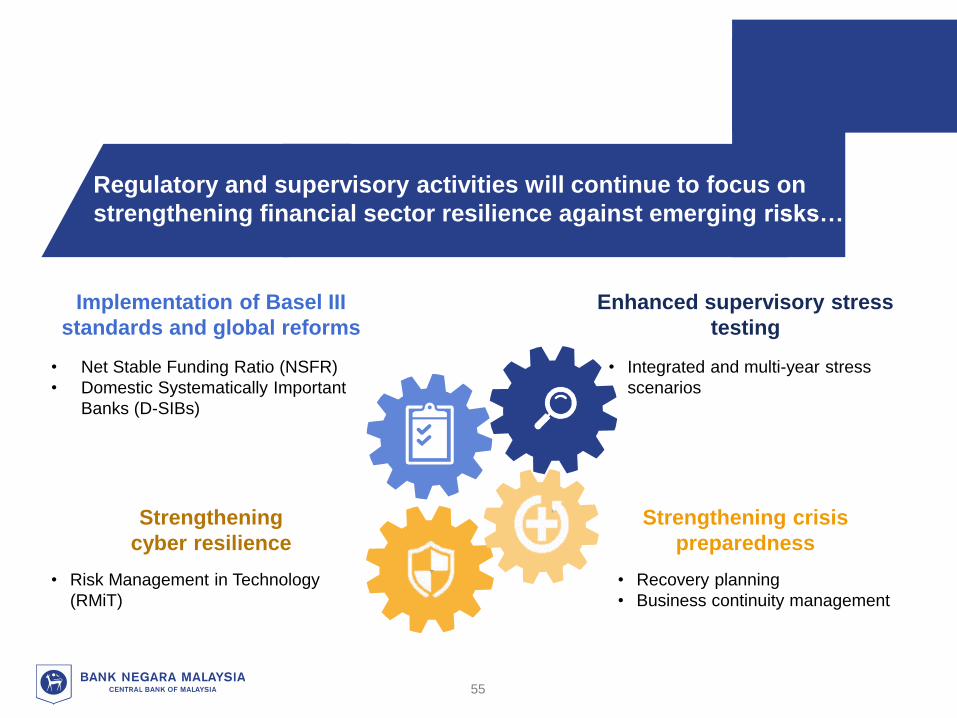
Enhanced supervisory stress
testing
• Integrated and multi-year stress
scenarios
Strengthening crisis
preparedness
• Recovery planning
• Business continuity management
Strengthening
cyber resilience
• Risk Management in Technology
(RMiT)
Implementation of Basel III
standards and global reforms
• Net Stable Funding Ratio (NSFR)
• Domestic Systematically Important
Banks (D-SIBs)
Regulatory and supervisory activities will continue to focus on
strengthening financial sector resilience against emerging risks…
55
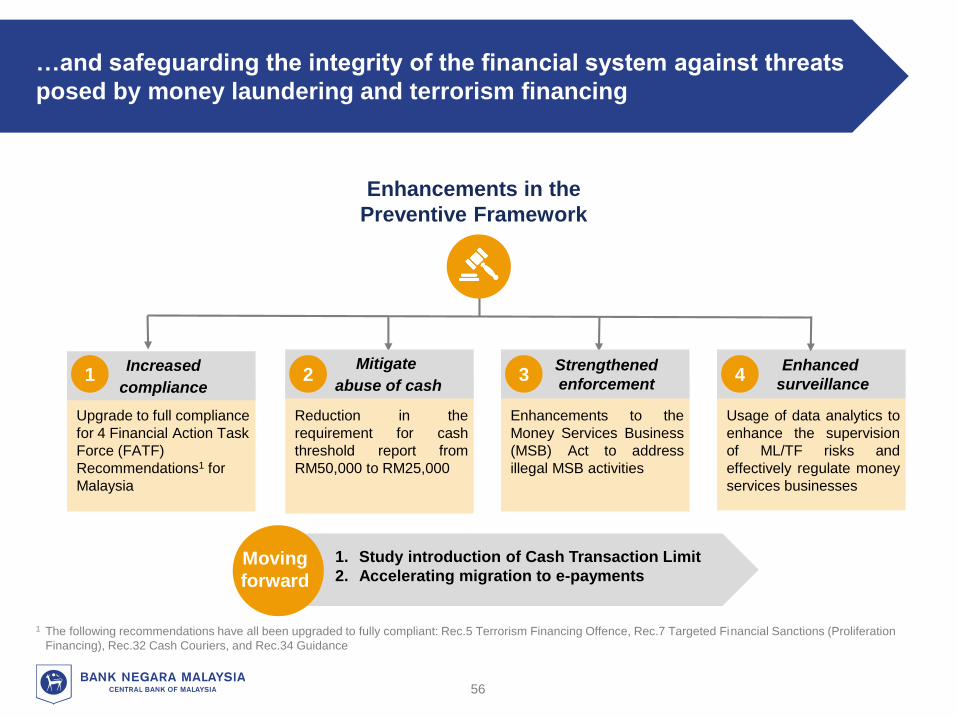
…and safeguarding the integrity of the financial system against threats
posed by money laundering and terrorism financing
Upgrade to full compliance
for 4 Financial Action Task
Force (FATF)
Recommendations1 for
Malaysia
1. Study introduction of Cash Transaction Limit
2. Accelerating migration to e-payments
Enhancements in the
Preventive Framework
Increased
compliance1
Moving
forward
Mitigate
abuse of cash2
Reduction in the
requirement for cash
threshold report from
RM50,000 to RM25,000
Strengthened
enforcement 3
Enhancements to the
Money Services Business
(MSB) Act to address
illegal MSB activities
1 The following recommendations have all been upgraded to fully compliant: Rec.5 Terrorism Financing Offence, Rec.7 Targeted Financial Sanctions (Proliferation
Financing), Rec.32 Cash Couriers, and Rec.34 Guidance
Enhanced
surveillance4
Usage of data analytics to
enhance the supervision
of ML/TF risks and
effectively regulate money
services businesses
56
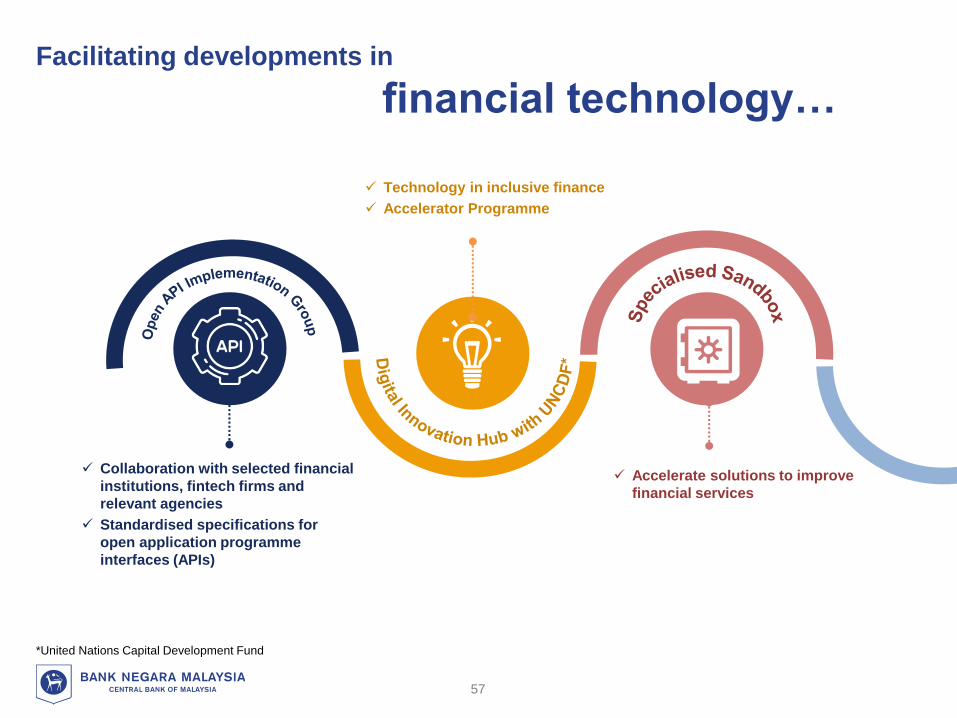
*United Nations Capital Development Fund
Collaboration with selected financial
institutions, fintech firms and
relevant agencies
Standardised specifications for
open application programme
interfaces (APIs)
Technology in inclusive finance
Accelerator Programme
Accelerate solutions to improve
financial services
Facilitating developments in
financial technology…
57
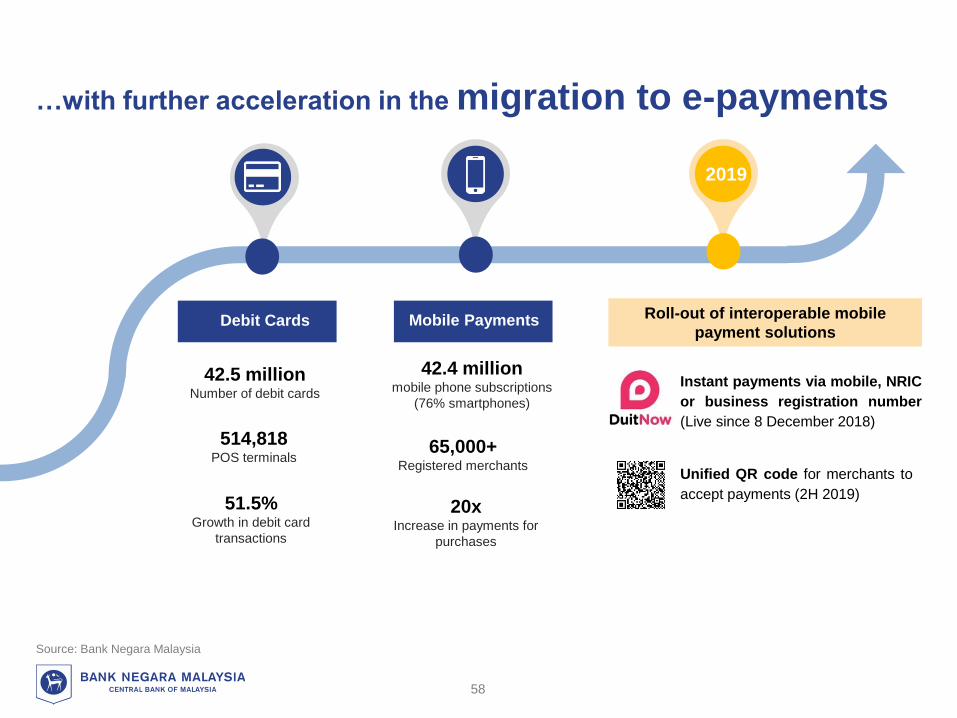
…with further acceleration in the migration to e-payments
Mobile Payments
42.4 millionmobile phone subscriptions
(76% smartphones)
65,000+Registered merchants
20xIncrease in payments for
purchases
42.5 millionNumber of debit cards
514,818POS terminals
51.5%Growth in debit card
transactions
Debit Cards
Instant payments via mobile, NRIC
or business registration number
(Live since 8 December 2018)
Unified QR code for merchants to
accept payments (2H 2019)
2019
Roll-out of interoperable mobile
payment solutions
Source: Bank Negara Malaysia
58

End of Presentation

Q&A Session

Additional Slides
Real GDP
by Expenditure
(Annual change, %)
2018 share1
(%)2018 2019f
Domestic demand 92.9 5.6 4.4
Private Expenditure 72.8 7.2 6.2
Consumption 55.5 8.1 6.6
Investment 17.4 4.5 4.9
Public Expenditure 20.1 0.1 -1.8
Consumption 12.8 3.3 1.2
Investment 7.3 -5.2 -7.1
Net Exports 8.4 13.4 0.1
Exports 70.6 1.5 0.1
Imports 62.2 0.1 0.0
Real GDP 100.0 4.7 4.3-4.8
1 Numbers may not add up due to rounding and exclusion of import dutiesp preliminaryf forecast
Source: Department of Statistics, Malaysia, Bank Negara Malaysia
Real GDP
by Economic Activity
(Annual change, %)
2018 share1
(%)2018p 2019f
Services 55.5 6.8 5.7
Manufacturing 23.0 5.0 4.8
Mining & Quarrying 7.9 -1.5 0.8
Agriculture 7.8 -0.4 2.8
Construction 4.5 4.2 3.0
Real GDP 100.0 4.7 4.3-4.8
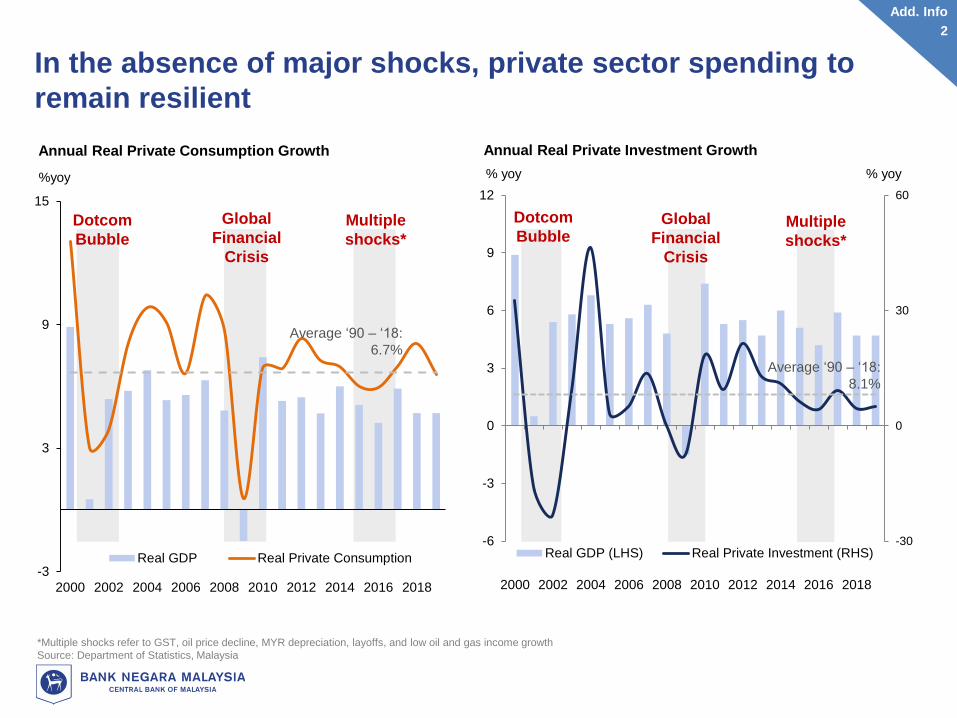
Private domestic demand remain a key driver of growth
Add. Info
1
Multiple
shocks*
Annual Real Private Consumption Growth
%yoy
Dotcom
Bubble
Annual Real Private Investment Growth
Dotcom
BubbleGlobal
Financial
Crisis
Multiple
shocks*
% yoy % yoy
-3
3
9
15
2000 2002 2004 2006 2008 2010 2012 2014 2016 2018
Real GDP Real Private Consumption
Global
Financial
Crisis
Average ‘90 – ‘18:
6.7%
-30
0
30
60
-6
-3
0
3
6
9
12
2000 2002 2004 2006 2008 2010 2012 2014 2016 2018
Real GDP (LHS) Real Private Investment (RHS)
Average ‘90 – ‘18:
8.1%
In the absence of major shocks, private sector spending to
remain resilient
*Multiple shocks refer to GST, oil price decline, MYR depreciation, layoffs, and low oil and gas income growth
Source: Department of Statistics, Malaysia
Add. Info
2
8.9
7.2
-5
20
45
70
95
120
145
-2
2
6
10
14
18
22
1Q08 2Q09 3Q10 4Q11 1Q13 2Q14 3Q15 4Q16 1Q18
Despite moderate sentiments, private consumption growth
to remain firm
Optimism threshold =100
MIER Consumer Sentiment Index (RHS)
Post-
Election
Strong
external
demand
Less optimistic consumer sentiments may not necessarily reflect weaker actual spending
Real private consumption
(‘90-’18 avg.: 6.7%)
*Multiple
shocks
Index%yoy
Global
Financial
Crisis
*Multiple shocks refer to GST, oil price decline, MYR depreciation, layoffs, and low oil and gas income growth
Source: Department of Statistics, Malaysia, MIER
Add. Info
3
L
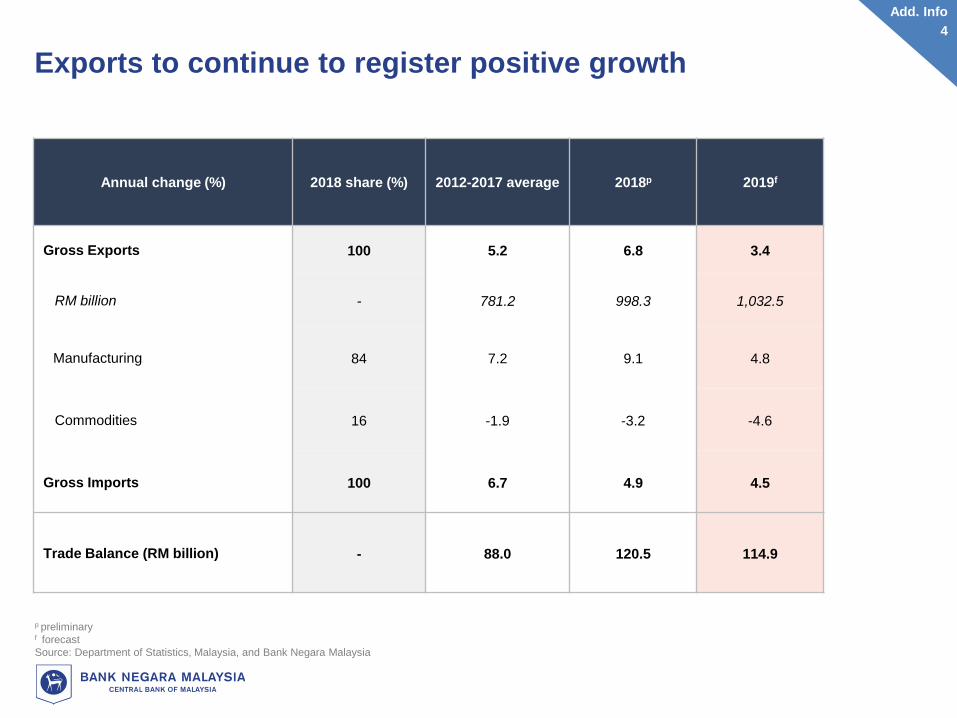
Exports to continue to register positive growth
Annual change (%) 2018 share (%) 2012-2017 average 2018p 2019f
Gross Exports 100 5.2 6.8 3.4
RM billion - 781.2 998.3 1,032.5
Manufacturing 84 7.2 9.1 4.8
Commodities 16 -1.9 -3.2 -4.6
Gross Imports 100 6.7 4.9 4.5
Trade Balance (RM billion) - 88.0 120.5 114.9
p preliminaryf forecast
Source: Department of Statistics, Malaysia, and Bank Negara Malaysia
Add. Info
4
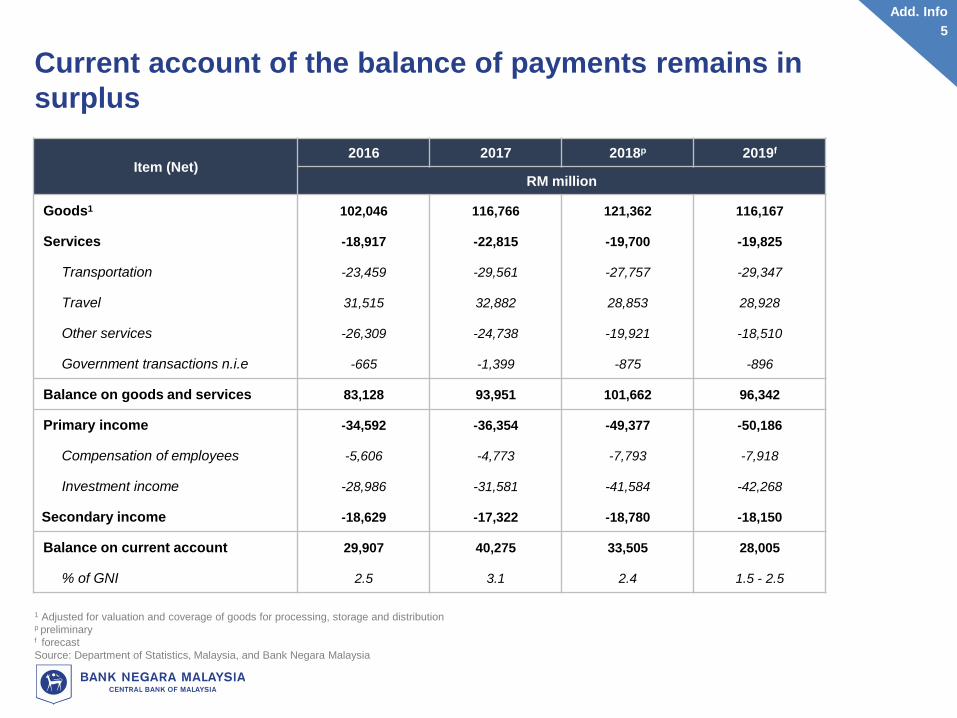
Current account of the balance of payments remains in
surplus
Item (Net)2016 2017 2018p 2019f
RM million
Goods1 102,046 116,766 121,362 116,167
Services -18,917 -22,815 -19,700 -19,825
Transportation -23,459 -29,561 -27,757 -29,347
Travel 31,515 32,882 28,853 28,928
Other services -26,309 -24,738 -19,921 -18,510
Government transactions n.i.e -665 -1,399 -875 -896
Balance on goods and services 83,128 93,951 101,662 96,342
Primary income -34,592 -36,354 -49,377 -50,186
Compensation of employees -5,606 -4,773 -7,793 -7,918
Investment income -28,986 -31,581 -41,584 -42,268
Secondary income -18,629 -17,322 -18,780 -18,150
Balance on current account 29,907 40,275 33,505 28,005
% of GNI 2.5 3.1 2.4 1.5 - 2.5
1 Adjusted for valuation and coverage of goods for processing, storage and distributionp preliminaryf forecast
Source: Department of Statistics, Malaysia, and Bank Negara Malaysia
Add. Info
5
1 In accordance with the Sixth Edition of the Balance of Payments and International Investment Position Manual (BPM6) by the International Monetary Fund (IMF), unless stated otherwisep preliminary
Source: Department of Statistics, Malaysia; and Bank Negara Malaysia
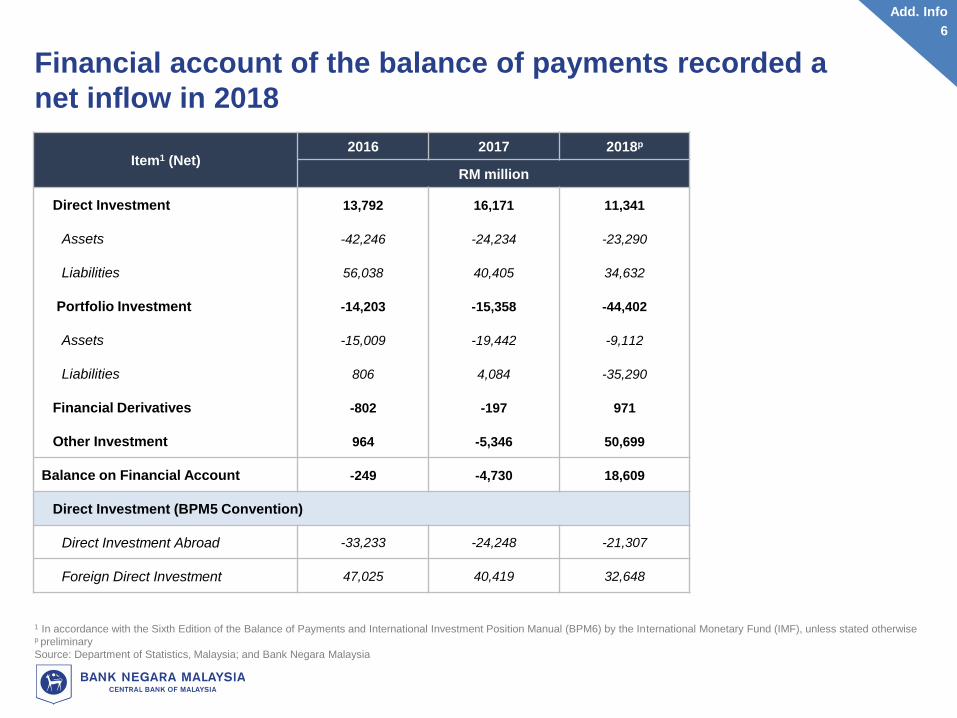
Financial account of the balance of payments recorded a
net inflow in 2018
Item1 (Net)2016 2017 2018p
RM million
Direct Investment 13,792 16,171 11,341
Assets -42,246 -24,234 -23,290
Liabilities 56,038 40,405 34,632
Portfolio Investment -14,203 -15,358 -44,402
Assets -15,009 -19,442 -9,112
Liabilities 806 4,084 -35,290
Financial Derivatives -802 -197 971
Other Investment 964 -5,346 50,699
Balance on Financial Account -249 -4,730 18,609
Direct Investment (BPM5 Convention)
Direct Investment Abroad -33,233 -24,248 -21,307
Foreign Direct Investment 47,025 40,419 32,648
Add. Info
6
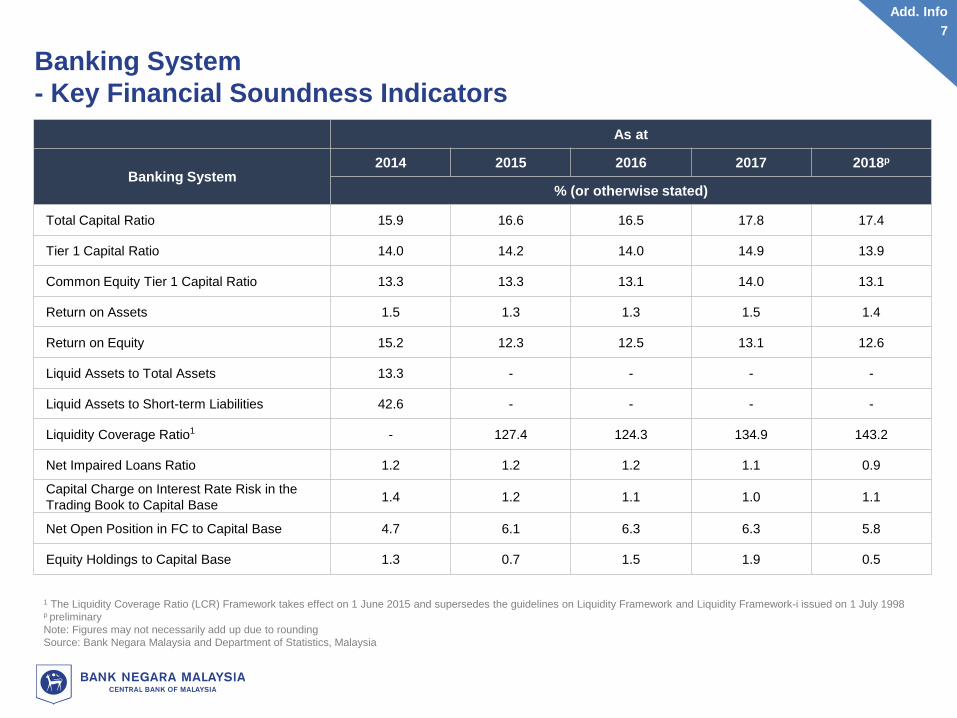
Banking System
- Key Financial Soundness Indicators
As at
Banking System2014 2015 2016 2017 2018p
% (or otherwise stated)
Total Capital Ratio 15.9 16.6 16.5 17.8 17.4
Tier 1 Capital Ratio 14.0 14.2 14.0 14.9 13.9
Common Equity Tier 1 Capital Ratio 13.3 13.3 13.1 14.0 13.1
Return on Assets 1.5 1.3 1.3 1.5 1.4
Return on Equity 15.2 12.3 12.5 13.1 12.6
Liquid Assets to Total Assets 13.3 - - - -
Liquid Assets to Short-term Liabilities 42.6 - - - -
Liquidity Coverage Ratio1 - 127.4 124.3 134.9 143.2
Net Impaired Loans Ratio 1.2 1.2 1.2 1.1 0.9
Capital Charge on Interest Rate Risk in the
Trading Book to Capital Base1.4 1.2 1.1 1.0 1.1
Net Open Position in FC to Capital Base 4.7 6.1 6.3 6.3 5.8
Equity Holdings to Capital Base 1.3 0.7 1.5 1.9 0.5
1 The Liquidity Coverage Ratio (LCR) Framework takes effect on 1 June 2015 and supersedes the guidelines on Liquidity Framework and Liquidity Framework-i issued on 1 July 1998p preliminary
Note: Figures may not necessarily add up due to rounding
Source: Bank Negara Malaysia and Department of Statistics, Malaysia
Add. Info
7
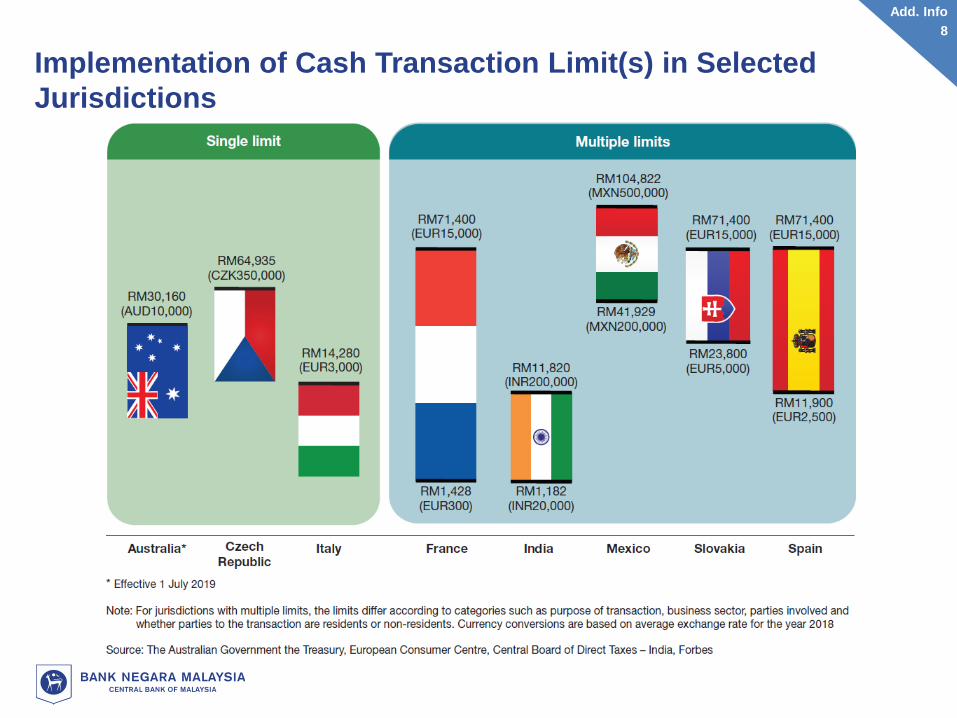
Implementation of Cash Transaction Limit(s) in Selected
Jurisdictions
Add. Info
8