asia pacific equity research - gamudagamuda.listedcompany.com/misc/research_reports/jp... · 9.6%...
TRANSCRIPT
www.jpmorganmarkets.com
Asia Pacific Equity Research28 March 2014
GamudaOverweightGAMU.KL, GAM MK
MRT Line 2 good news overshadowed by water restructuring fears
Price: M$4.64
Price Target: M$5.50
Malaysia
Construction
Hoy Kit Mak AC
(60-3) 2718-0713
Bloomberg JPMA MAK <GO>
JPMorgan Securities (Malaysia) Sdn. Bhd. (18146-X)
Vanice Siew
(603) 2718-0708
JPMorgan Securities (Malaysia) Sdn. Bhd. (18146-X)
Karen Li, CFA
(852) 2800-8589
J.P. Morgan Securities (Asia Pacific) Limited
YTD 1m 3m 12mAbs -3.4% 0.9% -4.0% 11.1%Rel -3.1% 0.1% -3.2% 0.3%
Gamuda Berhad (Reuters: GAMU.KL, Bloomberg: GAM MK)
M$ in mn, year-end Jul FY12A FY13A FY14E FY15E FY16ERevenue (M$ mn) 3,087 3,883 3,940 4,596 4,700Net Profit (M$ mn) 547 630 725 934 1,052EPS (M$) 0.26 0.30 0.32 0.41 0.47DPS (M$) 0.08 0.09 0.11 0.14 0.14Revenue growth (%) 15.5% 25.8% 1.5% 16.6% 2.3%EPS growth (%) 27.8% 15.1% 6.2% 28.9% 12.6%ROCE 7.1% 5.2% 5.6% 6.7% 7.1%ROE 14.2% 14.1% 14.9% 17.2% 17.2%P/E (x) 17.6 15.3 14.4 11.2 9.9P/BV (x) 2.4 2.0 1.9 1.7 1.6EV/EBITDA (x) 18.8 22.4 19.9 14.7 12.4Dividend Yield 1.7% 1.9% 2.4% 3.0% 3.0%Source: Company data, Bloomberg, J.P. Morgan estimates.
Company DataShares O/S (mn) 2,079Market Cap (M$ mn) 9,648Market Cap ($ mn) 2,925Price (M$) 4.64Date Of Price 27 Mar 14Free Float(%) 71.4%3M - Avg daily vol (mn) 6.413M - Avg daily val (M$ mn) 28.603M - Avg daily val ($ mn) 8.7FBMKLCI 1839.14Exchange Rate 3.30Price Target End Date 31-Dec-14Price Target (M$) 5.50
See page 9 for analyst certification and important disclosures, including non-US analyst disclosures.J.P. Morgan does and seeks to do business with companies covered in its research reports. As a result, investors should be aware that the firm may have a conflict of interest that could affect the objectivity of this report. Investors should consider this report as only a single factor in making their investment decision.
4.0
4.2
4.4
4.6
4.8
5.0
M$
Mar-13 Jun-13 Sep-13 Dec-13 Mar-14
Price Performance
GAMU.KL share price (M$)
FBMKLCI (rebased)
We attended an analysts’ briefing after release of the 2Q FY14 results. PDP role for the MRT Line 2 appears confirmed, but we believe this is overshadowed by the Selangor water sector restructuring fears with possible invocation of Section 114, which in our worst-case scenario would erode 9.6% from our SoTP valuation. We would view any potential share price weakness as an opportunity to accumulate.
2Q FY14 net profit of M$170MM was within our expectation. See “Gamuda: 2QFY14 results preview: Stronger sequential earnings growth expected”. 1H FY14 net profit accounted for 46% of our full year forecast, where we expect a stronger 2H on the back of favorable MRT Line 1 execution. Net profit rose 8.4% Y/Y on the back of stronger construction billings.
Management indicated that the Project Delivery Partner role for the M$25B MRT Line 2 has been approved by cabinet, and we believe it is awaiting an appointment letter from the MRT Corp. This is a major catalyst for Gamuda, in our view. The intention is to try and speed up the roll out of the project to 4Q 2015 from early 2016.
Good news for MRT Line 2 PDP role overshadowed by uncertainty about the potential invocation of Section 114 under WASIA. Although Section 114 does not confer the right for the takeover of water assets (Gamuda owns 40% in Splash), management believes there is uncertainty over concession/O&M returns. This puts at risk our M$0.53/share valuation for Gamuda’s 40% stake in Splash and Gamuda Water O&M, implying 9.6% downside risk to our SoTP valuation for Gamuda. The company views any forceful takeover of water concessionaires without adequate and mutually agreeable compensation as a breach of contract, and we believe that management will hold out against accepting any offer deemed detrimental to shareholders. It also has broader implications for the debt/capital market, in our view, due to the breach of sanctity of contracts (current and future).
2
Asia Pacific Equity Research28 March 2014
Hoy Kit Mak(60-3) [email protected]
Key catalysts for the stock price: Upside risks to our view: Downside risks to our view:
• Securing Project Delivery Partner and tunneling role for MRT Line 2 • Securing other railway infrastructure projects including Gemas-Johor Bahru electrified double tracking and High Speed Rail• Earnings surprise from favorable construction execution
• Vietnam property sales accelerates (very low expectations now)• Dividend surprises on the upside from potential concession asset sale • Construction and property margins exceed expectation on favorable execution
• Delays in projects award and execution• Sharp spikes in building material costs that affect margins• Lower-than-expected property sales
Key financial metrics FY13A FY14E FY15E FY16E Valuation and price target basis
Revenues (LC)
3,883.1
3,883.1
3,940.4
4,595.5 Our Dec-14 SoTP-based PT of M$5.50 assumes 18x P/E on CY15Econstruction earnings, in line with the historical average. Property division is valued based on16x P/E on CY15E property earnings, at a 10% discount to the implied sector average target P/E. Highway concessionaire Litrak (LTK MK), in which Gamuda has a 45.8% stake, is marked to market at M$4.40/share. Other concessions are valued based on DCF using a WACC of 9%, while its Indian toll concessions are based on a WACC of 15.4%.
Revenue growth (%) 25.8% 1.5% 16.6% 2.3%EBITDA (LC) 471.4 526.4 691.9 783.6
EBITDA margin (%) 12.1% 13.6% 17.6% 17.1%Tax rate (%) 20.6% 14.5% 14.9% 15.0%
Net profit (LC) 541.4 724.7 933.8 1051.7EPS (LC) 0.26 0.32 0.41 0.46
EPS growth (%) -1.2% 23.8% 27.4% 12.1% Chart to support valuation and price target
DPS (LC) 0.09 0.11 0.14 0.14
BVPS (LC) 2.3 2.4 2.6 2.9Sum of Parts Value
(M$ MM)M$/Share
Operating cash flow (LC mn)
(4.2)
268.1
118.7
204.2 Construction (includes MRT PDP fees NPV at WACC of 9%)
3,174.7
1.39
Free cash flow (LC mn)
(80.7)
(28.7)
(177.6)
(91.3)Property
6,284.5 2.76
Interest cover (X)
(127.0)
138.4
159.1
149.3 Litrak
1,012.3 0.44
Net margin (%) 13.9% 18.7% 23.7% 22.9% Malaysian toll concessions 908.5 0.40
Sales/assets (X)
0.42
0.39
0.42
0.40 Indian toll concessions 264.7 0.12
Debt/equity (%) 48.1% 48.6% 43.7% 39.1%Water concession
1,198.2 0.53
Net debt/equity (%) 14.0% 16.5% 16.1% 14.0%Net cash/(debt)
(215.8)
(0.09)
ROE (%) 14.1% 14.9% 17.2% 17.2%Total SoTP
12,627.0 5.55
Key model assumptions FY13A FY14E FY15E FY16E FD SoTP/share (M$) 5.55
New construction order (M$ B) - 7.9 4.5 - Dec14 SoTP/share (M$) 5.50
Construction PBT margin (%) 9.9 6.8 9 10.5New property sales (M$B) 1.8 1.9 1.9 1.9
Source: Bloomberg, Company and J.P. Morgan estimates. Source: Bloomberg, J.P. Morgan estimates.
Sensitivity analysis EBITDA EPS JPMe vs. consensus, change in estimatesSensitivity to FY14E FY15E FY14E FY15E EPS FY14E FY15EM$1b chg to new construction orders 6.8% 5.2% 3.7% 2.9% JPMe old 0.32 0.411ppt chg in construction PBT margin 4.0% 4.0% 2.2% 2.6% JPMe new 0.32 0.415% chg in property sales 1.7% 1.2% 0.9% 0.7% % chg 0% 0%1ppt chg in property PBT margin 2.8% 2.5% 1.5% 1.4% Consensus 0.31 0.34
Source: J.P. Morgan estimates. Source: Bloomberg, J.P. Morgan.
Construction sector peer comparison
As at: 27 Mar-14 Ticker Mkt cap Price Rating Target P/E (x) 2yr EPS CAGR ROE (%) Div Yld Net gearing(US$MM) (LC) (LC) CY14E CY15E 2013-2015E FY14E FY15E FY14E FY15E FY14E
Gamuda GAM MK 3,246 4.64 OW 5.50 12.8 10.7 21.3% 14.9 17.2 2.4% 3.0% 16.4%Hock Seng Lee HSL MK 291 1.74 NC - 9.9 9.5 9.3% 16.8 15.4 2.3% 2.4% -49.3%IJM Corp IJM MK 2,647 6.12 OW 7.40 13.4 11.3 25.5% 9.1 11.3 2.1% 2.1% 26.8%WCT Holdings WCTHG MK 708 2.14 N 2.30 12.3 11.5 30.5% 10.8 9.8 2.6% 3.9% 2.8%Weighted average 6,891 12.9 10.9 23.3% 12.4 14.1 2.3% 2.7% 16.2%
Source: Bloomberg, J.P. Morgan. Consensus estimates for non-covered (NC) stocks, J.P. Morgan estimates for all others.
3
Asia Pacific Equity Research28 March 2014
Hoy Kit Mak(60-3) [email protected]
Water asset restructuring uncertainty
Gamuda on Mar 10 rejected the Selangor state government’s unchanged offer to buy SPLASH, citing that the equity value offered of M$250.6MM is below its NAV of M$2.54B, which would have resulted in a divestment loss of M$920MM. With the latest lower offer price (see Gamuda: Yet another new twist to water sector restructuring, published 27 March), this suggests that even the equity value of M$250.6MM offered is at stake. It is also unclear what has happened to the M$2B Federal government ‘top up’ as per press reports earlier. The company is willing to accept international arbitration as proposed by the Selangor state, subject to ‘internationally accepted’ valuation methods.
The company views any forceful takeover of water concessionaires without adequate and mutually agreeable compensation as a breach of contract and we believe that management will hold out against accepting any offer deemed detrimental to shareholders. It also has broader implications for the debt/capital market, in our view, due to the breach of sanctity of contracts (current and future).
2Q FY14 results review
Table 1: Gamuda’s 2Q FY14 results summary
M$MM, YE Jul. 2QFY14 2QFY13 Y/Y change 1QFY14 Q/Q change 1HFY14 1HFY13 Y/Y changeRevenue 1,334 875 52% 1,206 11% 2,540 1,647 54%Pretax 221 202 9% 211 5% 432 385 12%Pretax margin (%) 17% 23% 18% 17% 23%
Core net profit 170 157 8% 165 3% 336 302 11%Core net profit margin (%) 13% 18% 14% 13% 18%Core FD EPS (M$ sen) 7.3 7.2 0% 7.1 2% 14.3 14.0 3%
Note: The earnings summary table above is before taking into effect of FRS 11. Source: Company
2Q FY14 net profit of M$170MM was within our expectation. 1H FY14 net profit accounted for 46% of our full year forecast, where we expect a stronger 2H on the back of favorable MRT Line 1 execution. Net profit rose 8.4% Y/Y on the back of stronger construction billings.
Adjusting for FRS11 accounting changes that saw joint venture profits being equity accounted instead, construction PBT margins expanded from 7.6% in 1QFY14 to 7.8% in 2QFY14.
Property division achieved lower new sales of M$405MM in 2QFY14 vs. M$575MM in 1QFY14, with M$1.7B unbilled sales. Management is confident of achieving M$1.9B new sales target for FY14 despite slowing Iskandar sales.
4
Asia Pacific Equity Research28 March 2014
Hoy Kit Mak(60-3) [email protected]
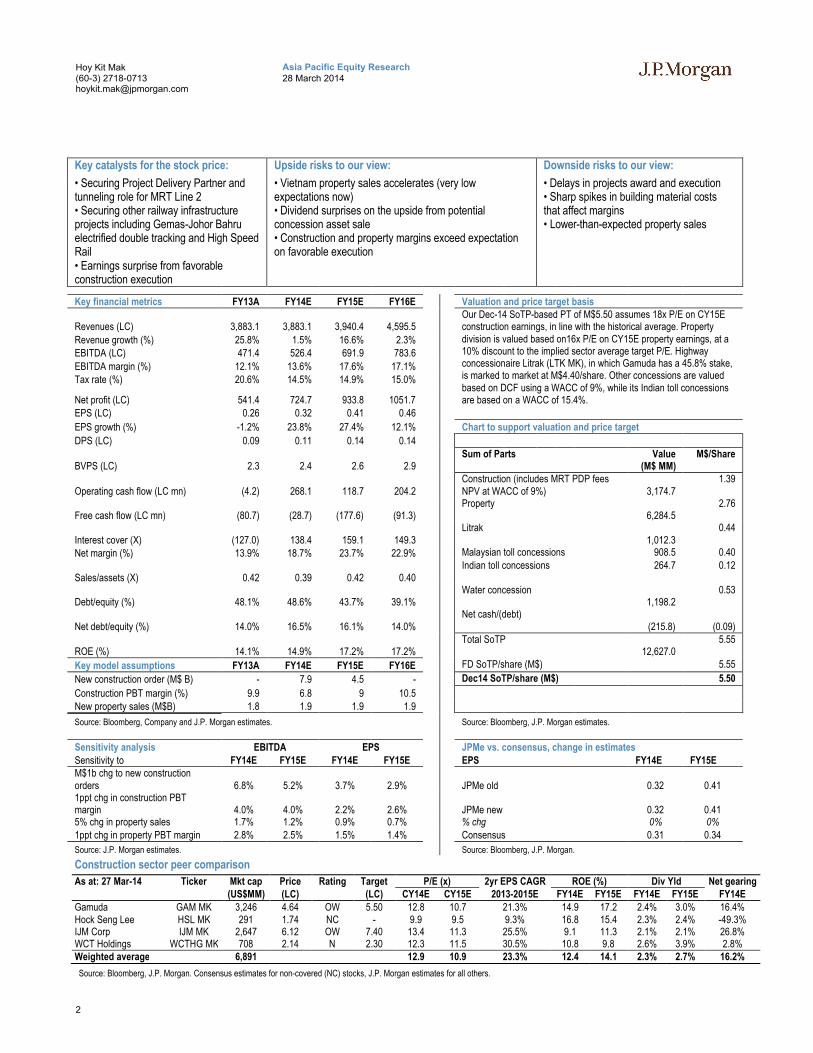
Figure 1: Gamuda’s headline earnings trend
Source: Company
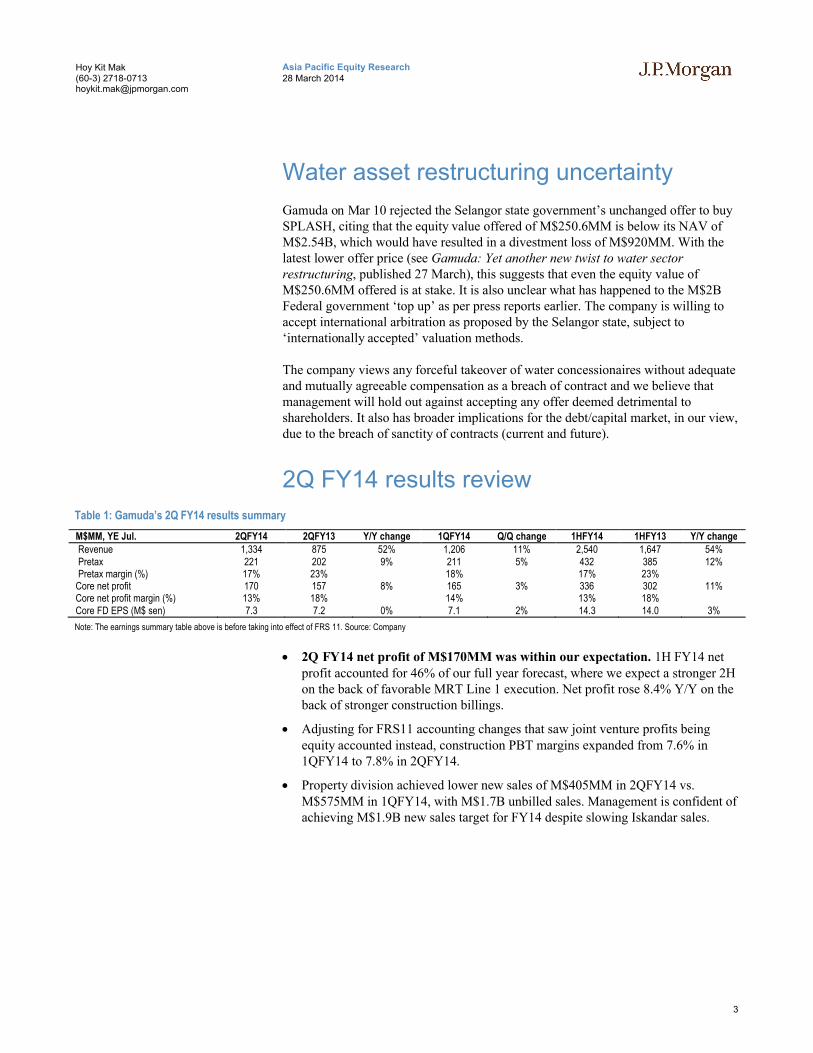
Figure 2: Gamuda’s construction PBT margin trend
Source: Company
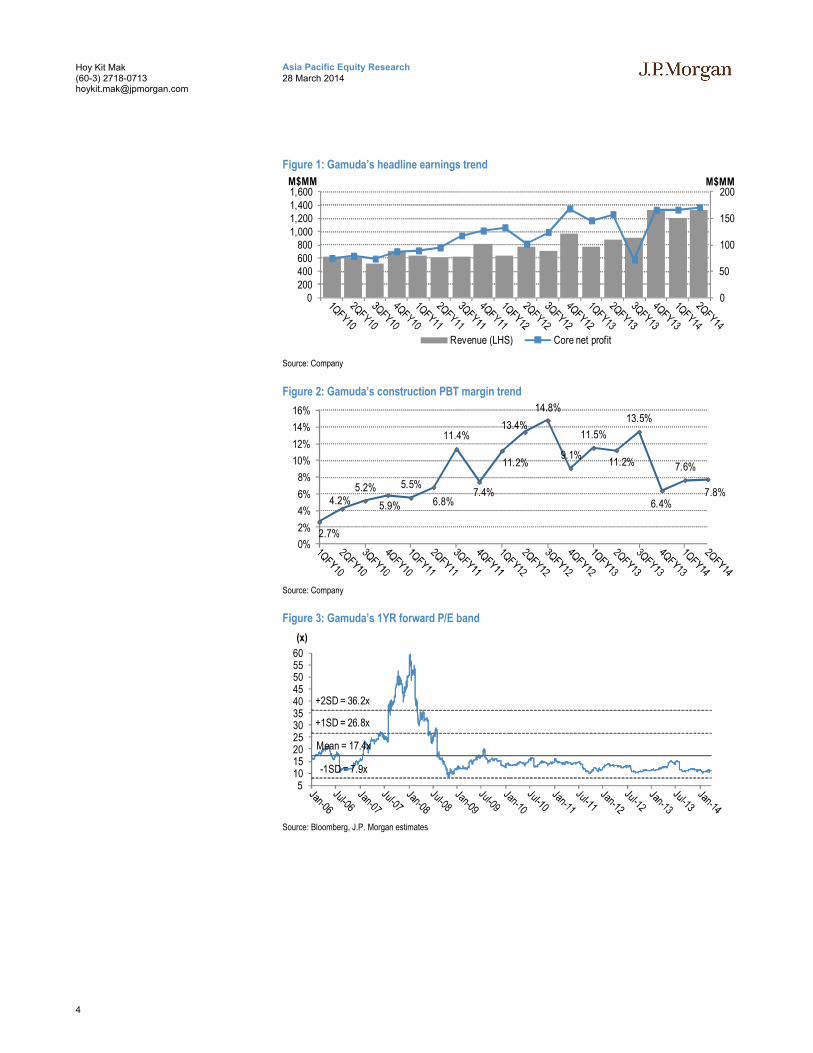
Figure 3: Gamuda’s 1YR forward P/E band
Source: Bloomberg, J.P. Morgan estimates
0
50
100
150
200
0200400600800
1,0001,2001,4001,600
M$MMM$MM
Revenue (LHS) Core net profit
2.7%
4.2%5.2%
5.9%
5.5%
6.8%
11.4%
7.4%
11.2%
13.4%
14.8%
9.1%
11.5%
11.2%
13.5%
6.4%
7.6%
7.8%
0%
2%
4%
6%
8%
10%
12%
14%
16%
Mean = 17.4x
-1SD = 7.9x
+1SD = 26.8x
+2SD = 36.2x
51015202530354045505560
(x)
5
Asia Pacific Equity Research28 March 2014
Hoy Kit Mak(60-3) [email protected]
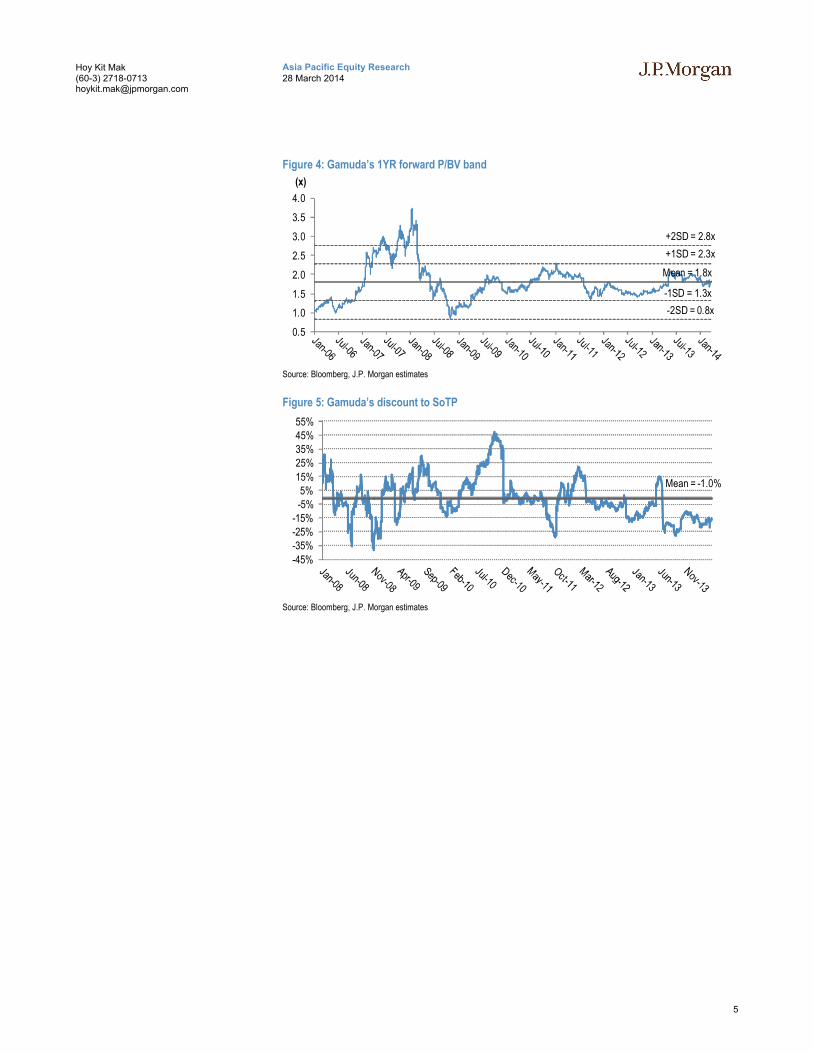
Figure 4: Gamuda’s 1YR forward P/BV band
Source: Bloomberg, J.P. Morgan estimates
Figure 5: Gamuda’s discount to SoTP
Source: Bloomberg, J.P. Morgan estimates
Mean = 1.8x
-2SD = 0.8x
-1SD = 1.3x
+1SD = 2.3x
+2SD = 2.8x
0.5
1.0
1.5
2.0
2.5
3.0
3.5
4.0
(x)
Mean = -1.0%
-45%
-35%-25%-15%
-5%5%
15%
25%35%45%55%
6
Asia Pacific Equity Research28 March 2014
Hoy Kit Mak(60-3) [email protected]
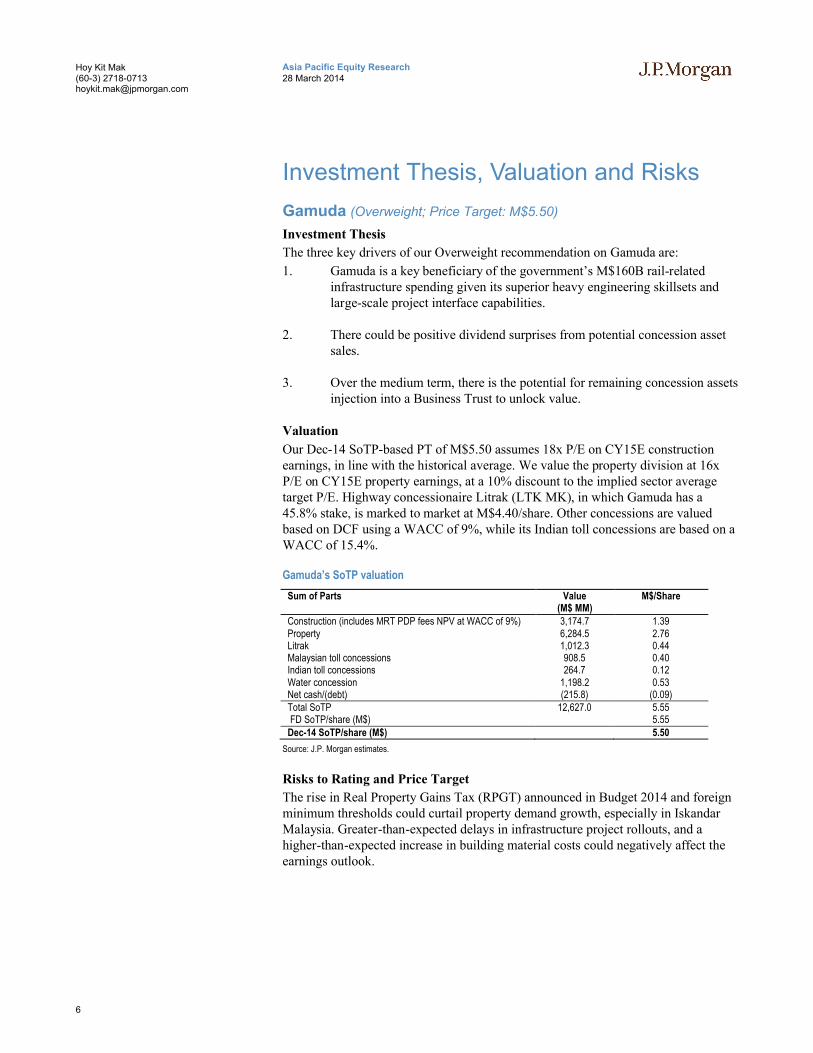
Investment Thesis, Valuation and Risks
Gamuda (Overweight; Price Target: M$5.50)
Investment Thesis
The three key drivers of our Overweight recommendation on Gamuda are:
1. Gamuda is a key beneficiary of the government’s M$160B rail-related infrastructure spending given its superior heavy engineering skillsets and large-scale project interface capabilities.
2. There could be positive dividend surprises from potential concession asset sales.
3. Over the medium term, there is the potential for remaining concession assets injection into a Business Trust to unlock value.
Valuation
Our Dec-14 SoTP-based PT of M$5.50 assumes 18x P/E on CY15E construction earnings, in line with the historical average. We value the property division at 16x P/E on CY15E property earnings, at a 10% discount to the implied sector average target P/E. Highway concessionaire Litrak (LTK MK), in which Gamuda has a 45.8% stake, is marked to market at M$4.40/share. Other concessions are valued based on DCF using a WACC of 9%, while its Indian toll concessions are based on a WACC of 15.4%.
Gamuda’s SoTP valuation
Sum of Parts Value (M$ MM)
M$/Share
Construction (includes MRT PDP fees NPV at WACC of 9%) 3,174.7 1.39Property 6,284.5 2.76Litrak 1,012.3 0.44Malaysian toll concessions 908.5 0.40Indian toll concessions 264.7 0.12Water concession 1,198.2 0.53Net cash/(debt) (215.8) (0.09)Total SoTP 12,627.0 5.55FD SoTP/share (M$) 5.55
Dec-14 SoTP/share (M$) 5.50
Source: J.P. Morgan estimates.
Risks to Rating and Price Target
The rise in Real Property Gains Tax (RPGT) announced in Budget 2014 and foreign minimum thresholds could curtail property demand growth, especially in Iskandar Malaysia. Greater-than-expected delays in infrastructure project rollouts, and a higher-than-expected increase in building material costs could negatively affect the earnings outlook.
7
Asia Pacific Equity Research28 March 2014
Hoy Kit Mak(60-3) [email protected]
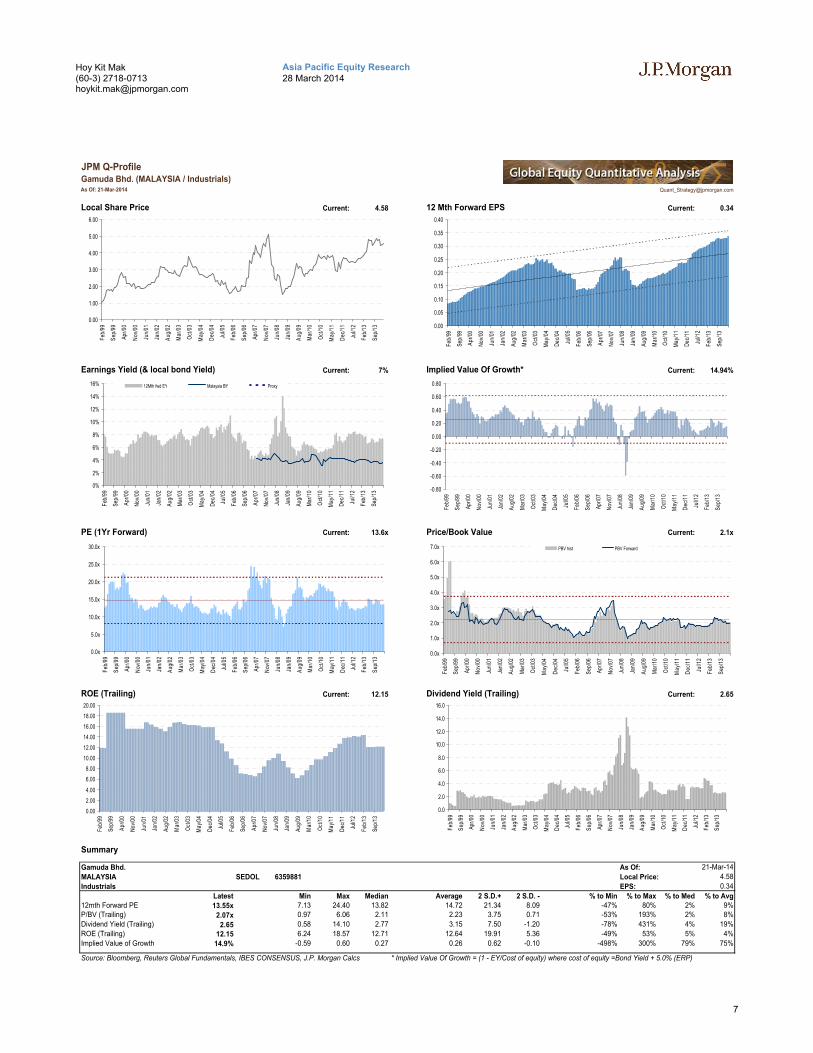
JPM Q-ProfileGamuda Bhd. (MALAYSIA / Industrials)As Of: 21-Mar-2014 [email protected]
Local Share Price Current: 4.58 12 Mth Forward EPS Current: 0.34
Earnings Yield (& local bond Yield) Current: 7% Implied Value Of Growth* Current: 14.94%
PE (1Yr Forward) Current: 13.6x Price/Book Value Current: 2.1x
ROE (Trailing) Current: 12.15 Dividend Yield (Trailing) Current: 2.65
Summary
Gamuda Bhd. 3184.84 As Of:
MALAYSIA 6.9638 SEDOL 6359881 Local Price: 4.58
Industrials Construction & Engineering EPS: 0.34
Latest Min Max Median Average 2 S.D.+ 2 S.D. - % to Min % to Max % to Med % to Avg12mth Forward PE 13.55x 7.13 24.40 13.82 14.72 21.34 8.09 -47% 80% 2% 9%P/BV (Trailing) 2.07x 0.97 6.06 2.11 2.23 3.75 0.71 -53% 193% 2% 8%
Dividend Yield (Trailing) 2.65 0.58 14.10 2.77 3.15 7.50 -1.20 -78% 431% 4% 19%
ROE (Trailing) 12.15 6.24 18.57 12.71 12.64 19.91 5.36 -49% 53% 5% 4%
Implied Value of Growth 14.9% -0.59 0.60 0.27 0.26 0.62 -0.10 -498% 300% 79% 75%
Source: Bloomberg, Reuters Global Fundamentals, IBES CONSENSUS, J.P. Morgan Calcs * Implied Value Of Growth = (1 - EY/Cost of equity) where cost of equity =Bond Yield + 5.0% (ERP)
21-Mar-14
0.00
0.05
0.10
0.15
0.20
0.25
0.30
0.35
0.40
Feb
/99
Sep
/99
Apr
/00
Nov
/00
Jun/
01
Jan/
02
Aug
/02
Mar
/03
Oct
/03
May
/04
Dec
/04
Jul/0
5
Feb
/06
Sep
/06
Apr
/07
Nov
/07
Jun/
08
Jan/
09
Aug
/09
Mar
/10
Oct
/10
May
/11
Dec
/11
Jul/1
2
Feb
/13
Sep
/13
0%
2%
4%
6%
8%
10%
12%
14%
16%
Feb
/99
Sep
/99
Apr
/00
Nov
/00
Jun/
01
Jan/
02
Aug
/02
Mar
/03
Oct
/03
May
/04
Dec
/04
Jul/0
5
Feb
/06
Sep
/06
Apr
/07
Nov
/07
Jun/
08
Jan/
09
Aug
/09
Mar
/10
Oct
/10
May
/11
Dec
/11
Jul/1
2
Feb
/13
Sep
/13
12Mth fwd EY Malaysia BY Proxy
0.00
1.00
2.00
3.00
4.00
5.00
6.00
Feb
/99
Sep
/99
Apr
/00
Nov
/00
Jun/
01
Jan/
02
Aug
/02
Mar
/03
Oct
/03
May
/04
Dec
/04
Jul/0
5
Feb
/06
Sep
/06
Apr
/07
Nov
/07
Jun/
08
Jan/
09
Aug
/09
Mar
/10
Oct
/10
May
/11
Dec
/11
Jul/1
2
Feb
/13
Sep
/13
-0.80
-0.60
-0.40
-0.20
0.00
0.20
0.40
0.60
0.80
Feb
/99
Sep
/99
Apr
/00
Nov
/00
Jun/
01
Jan/
02
Aug
/02
Mar
/03
Oct
/03
May
/04
Dec
/04
Jul/0
5
Feb
/06
Sep
/06
Apr
/07
Nov
/07
Jun/
08
Jan/
09
Aug
/09
Mar
/10
Oct
/10
May
/11
Dec
/11
Jul/1
2
Feb
/13
Sep
/13
0.0x
5.0x
10.0x
15.0x
20.0x
25.0x
30.0x
Feb
/99
Sep
/99
Apr
/00
Nov
/00
Jun/
01
Jan/
02
Aug
/02
Mar
/03
Oct
/03
May
/04
Dec
/04
Jul/0
5
Feb
/06
Sep
/06
Apr
/07
Nov
/07
Jun/
08
Jan/
09
Aug
/09
Mar
/10
Oct
/10
May
/11
Dec
/11
Jul/1
2
Feb
/13
Sep
/13
0.0x
1.0x
2.0x
3.0x
4.0x
5.0x
6.0x
7.0x
Feb
/99
Sep
/99
Apr
/00
Nov
/00
Jun/
01
Jan/
02
Aug
/02
Mar
/03
Oct
/03
May
/04
Dec
/04
Jul/0
5
Feb
/06
Sep
/06
Apr
/07
Nov
/07
Jun/
08
Jan/
09
Aug
/09
Mar
/10
Oct
/10
May
/11
Dec
/11
Jul/1
2
Feb
/13
Sep
/13
PBV hist PBV Forward
0.00
2.00
4.00
6.00
8.00
10.00
12.00
14.00
16.00
18.00
20.00
Feb
/99
Sep
/99
Apr
/00
Nov
/00
Jun/
01
Jan/
02
Aug
/02
Mar
/03
Oct
/03
May
/04
Dec
/04
Jul/0
5
Feb
/06
Sep
/06
Apr
/07
Nov
/07
Jun/
08
Jan/
09
Aug
/09
Mar
/10
Oct
/10
May
/11
Dec
/11
Jul/1
2
Feb
/13
Sep
/13
0.0
2.0
4.0
6.0
8.0
10.0
12.0
14.0
16.0
Feb
/99
Sep
/99
Apr
/00
Nov
/00
Jun/
01
Jan/
02
Aug
/02
Mar
/03
Oct
/03
May
/04
Dec
/04
Jul/0
5
Feb
/06
Sep
/06
Apr
/07
Nov
/07
Jun/
08
Jan/
09
Aug
/09
Mar
/10
Oct
/10
May
/11
Dec
/11
Jul/1
2
Feb
/13
Sep
/13
8
Asia Pacific Equity Research28 March 2014
Hoy Kit Mak(60-3) [email protected]
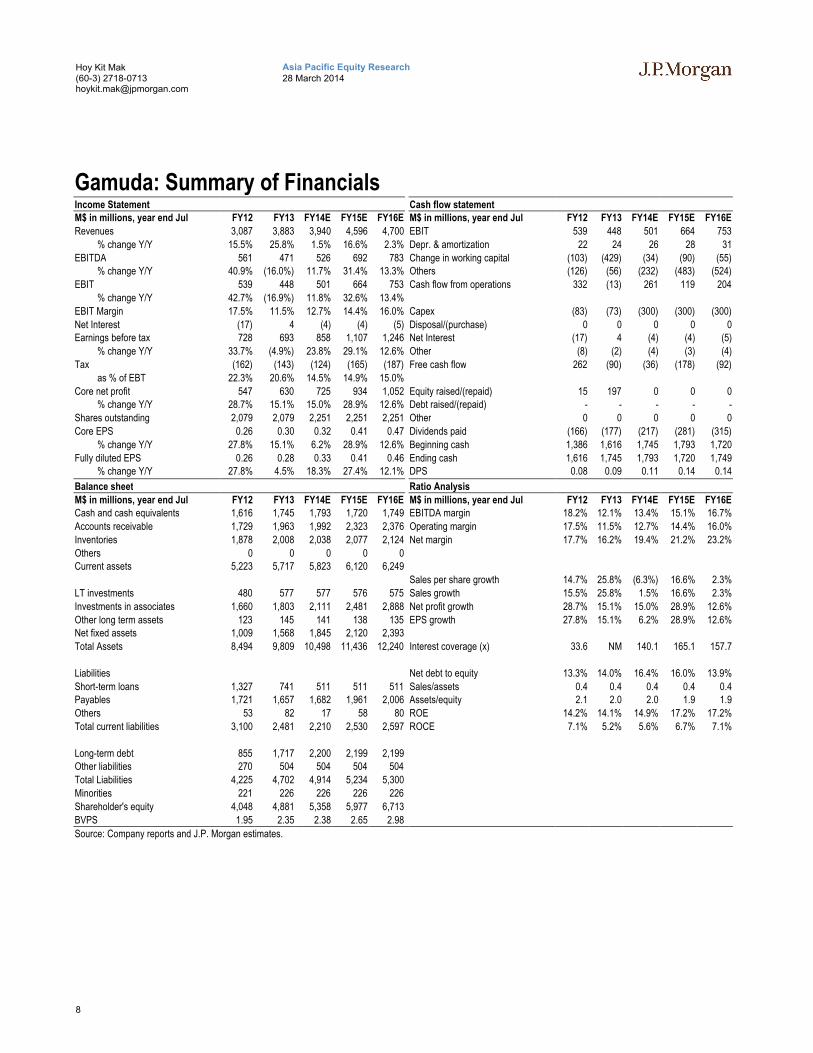
Gamuda: Summary of FinancialsIncome Statement Cash flow statementM$ in millions, year end Jul FY12 FY13 FY14E FY15E FY16E M$ in millions, year end Jul FY12 FY13 FY14E FY15E FY16E
Revenues 3,087 3,883 3,940 4,596 4,700 EBIT 539 448 501 664 753
% change Y/Y 15.5% 25.8% 1.5% 16.6% 2.3% Depr. & amortization 22 24 26 28 31
EBITDA 561 471 526 692 783 Change in working capital (103) (429) (34) (90) (55)% change Y/Y 40.9% (16.0%) 11.7% 31.4% 13.3% Others (126) (56) (232) (483) (524)
EBIT 539 448 501 664 753 Cash flow from operations 332 (13) 261 119 204
% change Y/Y 42.7% (16.9%) 11.8% 32.6% 13.4%
EBIT Margin 17.5% 11.5% 12.7% 14.4% 16.0% Capex (83) (73) (300) (300) (300)
Net Interest (17) 4 (4) (4) (5) Disposal/(purchase) 0 0 0 0 0Earnings before tax 728 693 858 1,107 1,246 Net Interest (17) 4 (4) (4) (5)
% change Y/Y 33.7% (4.9%) 23.8% 29.1% 12.6% Other (8) (2) (4) (3) (4)
Tax (162) (143) (124) (165) (187) Free cash flow 262 (90) (36) (178) (92)
as % of EBT 22.3% 20.6% 14.5% 14.9% 15.0%
Core net profit 547 630 725 934 1,052 Equity raised/(repaid) 15 197 0 0 0% change Y/Y 28.7% 15.1% 15.0% 28.9% 12.6% Debt raised/(repaid) - - - - -
Shares outstanding 2,079 2,079 2,251 2,251 2,251 Other 0 0 0 0 0
Core EPS 0.26 0.30 0.32 0.41 0.47 Dividends paid (166) (177) (217) (281) (315)
% change Y/Y 27.8% 15.1% 6.2% 28.9% 12.6% Beginning cash 1,386 1,616 1,745 1,793 1,720
Fully diluted EPS 0.26 0.28 0.33 0.41 0.46 Ending cash 1,616 1,745 1,793 1,720 1,749% change Y/Y 27.8% 4.5% 18.3% 27.4% 12.1% DPS 0.08 0.09 0.11 0.14 0.14
Balance sheet Ratio Analysis
M$ in millions, year end Jul FY12 FY13 FY14E FY15E FY16E M$ in millions, year end Jul FY12 FY13 FY14E FY15E FY16ECash and cash equivalents 1,616 1,745 1,793 1,720 1,749 EBITDA margin 18.2% 12.1% 13.4% 15.1% 16.7%
Accounts receivable 1,729 1,963 1,992 2,323 2,376 Operating margin 17.5% 11.5% 12.7% 14.4% 16.0%
Inventories 1,878 2,008 2,038 2,077 2,124 Net margin 17.7% 16.2% 19.4% 21.2% 23.2%
Others 0 0 0 0 0Current assets 5,223 5,717 5,823 6,120 6,249
. Sales per share growth 14.7% 25.8% (6.3%) 16.6% 2.3%
LT investments 480 577 577 576 575 Sales growth 15.5% 25.8% 1.5% 16.6% 2.3%
Investments in associates 1,660 1,803 2,111 2,481 2,888 Net profit growth 28.7% 15.1% 15.0% 28.9% 12.6%
Other long term assets 123 145 141 138 135 EPS growth 27.8% 15.1% 6.2% 28.9% 12.6%Net fixed assets 1,009 1,568 1,845 2,120 2,393
Total Assets 8,494 9,809 10,498 11,436 12,240 Interest coverage (x) 33.6 NM 140.1 165.1 157.7
.
Liabilities Net debt to equity 13.3% 14.0% 16.4% 16.0% 13.9%
Short-term loans 1,327 741 511 511 511 Sales/assets 0.4 0.4 0.4 0.4 0.4Payables 1,721 1,657 1,682 1,961 2,006 Assets/equity 2.1 2.0 2.0 1.9 1.9
Others 53 82 17 58 80 ROE 14.2% 14.1% 14.9% 17.2% 17.2%
Total current liabilities 3,100 2,481 2,210 2,530 2,597 ROCE 7.1% 5.2% 5.6% 6.7% 7.1%
.
Long-term debt 855 1,717 2,200 2,199 2,199Other liabilities 270 504 504 504 504
Total Liabilities 4,225 4,702 4,914 5,234 5,300
Minorities 221 226 226 226 226
Shareholder's equity 4,048 4,881 5,358 5,977 6,713
BVPS 1.95 2.35 2.38 2.65 2.98
Source: Company reports and J.P. Morgan estimates.
9
Asia Pacific Equity Research28 March 2014
Hoy Kit Mak(60-3) [email protected]
Analyst Certification: The research analyst(s) denoted by an “AC” on the cover of this report certifies (or, where multiple research analysts are primarily responsible for this report, the research analyst denoted by an “AC” on the cover or within the document individually certifies, with respect to each security or issuer that the research analyst covers in this research) that: (1) all of the views expressed in this report accurately reflect his or her personal views about any and all of the subject securities or issuers; and (2) no part of any of the research analyst's compensation was, is, or will be directly or indirectly related to the specific recommendations or views expressed by the research analyst(s) in this report. For all Korea-based research analysts listed on the front cover, they also certify, as per KOFIA requirements, that their analysis was made in good faith and that the views reflect their own opinion, without undue influence or intervention.
Important Disclosures
Client: J.P. Morgan currently has, or had within the past 12 months, the following company(ies) as clients: Gamuda.
Company-Specific Disclosures: Important disclosures, including price charts, are available for compendium reports and all J.P. Morgan–covered companies by visiting https://jpmm.com/research/disclosures, calling 1-800-477-0406, or e-mailing [email protected] with your request. J.P. Morgan’s Strategy, Technical, and Quantitative Research teams may screen companies not covered by J.P. Morgan. For important disclosures for these companies, please call 1-800-477-0406 or e-mail [email protected].
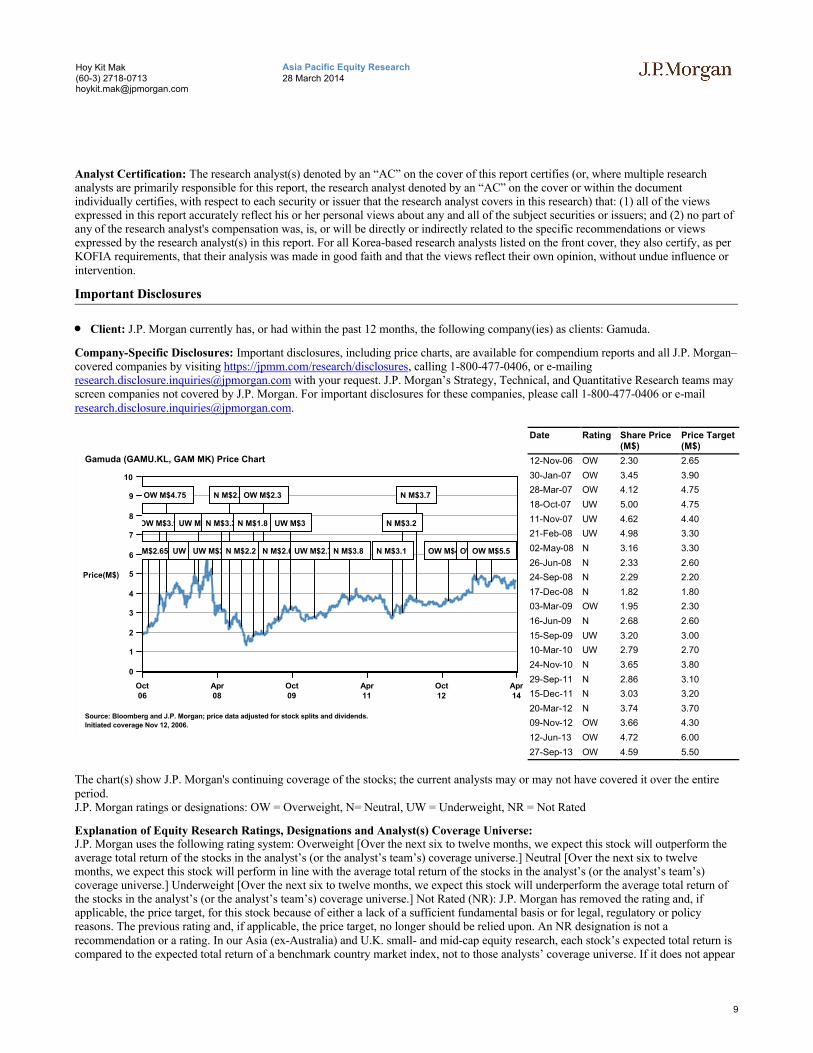
Date Rating Share Price (M$)
Price Target (M$)
12-Nov-06 OW 2.30 2.65
30-Jan-07 OW 3.45 3.90
28-Mar-07 OW 4.12 4.75
18-Oct-07 UW 5.00 4.75
11-Nov-07 UW 4.62 4.40
21-Feb-08 UW 4.98 3.30
02-May-08 N 3.16 3.30
26-Jun-08 N 2.33 2.60
24-Sep-08 N 2.29 2.20
17-Dec-08 N 1.82 1.80
03-Mar-09 OW 1.95 2.30
16-Jun-09 N 2.68 2.60
15-Sep-09 UW 3.20 3.00
10-Mar-10 UW 2.79 2.70
24-Nov-10 N 3.65 3.80
29-Sep-11 N 2.86 3.10
15-Dec-11 N 3.03 3.20
20-Mar-12 N 3.74 3.70
09-Nov-12 OW 3.66 4.30
12-Jun-13 OW 4.72 6.00
27-Sep-13 OW 4.59 5.50
The chart(s) show J.P. Morgan's continuing coverage of the stocks; the current analysts may or may not have covered it over the entire period. J.P. Morgan ratings or designations: OW = Overweight, N= Neutral, UW = Underweight, NR = Not Rated
Explanation of Equity Research Ratings, Designations and Analyst(s) Coverage Universe: J.P. Morgan uses the following rating system: Overweight [Over the next six to twelve months, we expect this stock will outperform the average total return of the stocks in the analyst’s (or the analyst’s team’s) coverage universe.] Neutral [Over the next six to twelve months, we expect this stock will perform in line with the average total return of the stocks in the analyst’s (or the analyst’s team’s) coverage universe.] Underweight [Over the next six to twelve months, we expect this stock will underperform the average total return of the stocks in the analyst’s (or the analyst’s team’s) coverage universe.] Not Rated (NR): J.P. Morgan has removed the rating and, if applicable, the price target, for this stock because of either a lack of a sufficient fundamental basis or for legal, regulatory or policy reasons. The previous rating and, if applicable, the price target, no longer should be relied upon. An NR designation is not a recommendation or a rating. In our Asia (ex-Australia) and U.K. small- and mid-cap equity research, each stock’s expected total return is compared to the expected total return of a benchmark country market index, not to those analysts’ coverage universe. If it does not appear
0
1
2
3
4
5
6
7
8
9
10
Price(M$)
Oct06
Apr08
Oct09
Apr11
Oct12
Apr14
Gamuda (GAMU.KL, GAM MK) Price Chart
OW M$4.75 N M$2.6OW M$2.3 N M$3.7
OW M$3.9UW M$4.4N M$3.3 N M$1.8 UW M$3 N M$3.2
OW M$2.65 UW M$4.75UW M$3.3N M$2.2 N M$2.6 UW M$2.7 N M$3.8 N M$3.1 OW M$4.3OW M$6OW M$5.5
Source: Bloomberg and J.P. Morgan; price data adjusted for stock splits and dividends.
Initiated coverage Nov 12, 2006.
10
Asia Pacific Equity Research28 March 2014
Hoy Kit Mak(60-3) [email protected]
in the Important Disclosures section of this report, the certifying analyst’s coverage universe can be found on J.P. Morgan’s research website, www.jpmorganmarkets.com.
Coverage Universe: Mak, Hoy Kit: Berjaya Sports Toto (BSTB.KL), Gamuda (GAMU.KL), IJM Corporation (IJMS.KL), MMC Corporation Berhad (MMCB.KL), Malaysia Airports Holdings Berhad (MAHB.KL), WCT Holdings Bhd (WCTE.KL)
J.P. Morgan Equity Research Ratings Distribution, as of January 1, 2014
Overweight(buy)
Neutral(hold)
Underweight(sell)
J.P. Morgan Global Equity Research Coverage 43% 45% 12%IB clients* 57% 49% 36%
JPMS Equity Research Coverage 43% 50% 7%IB clients* 75% 66% 59%
*Percentage of investment banking clients in each rating category.For purposes only of FINRA/NYSE ratings distribution rules, our Overweight rating falls into a buy rating category; our Neutral rating falls into a hold rating category; and our Underweight rating falls into a sell rating category. Please note that stocks with an NR designation are not included in the table above.
Equity Valuation and Risks: For valuation methodology and risks associated with covered companies or price targets for covered companies, please see the most recent company-specific research report at http://www.jpmorganmarkets.com, contact the primary analyst or your J.P. Morgan representative, or email [email protected].
Equity Analysts' Compensation: The equity research analysts responsible for the preparation of this report receive compensation based upon various factors, including the quality and accuracy of research, client feedback, competitive factors, and overall firm revenues.
Registration of non-US Analysts: Unless otherwise noted, the non-US analysts listed on the front of this report are employees of non-US affiliates of JPMS, are not registered/qualified as research analysts under NASD/NYSE rules, may not be associated persons of JPMS, and may not be subject to FINRA Rule 2711 and NYSE Rule 472 restrictions on communications with covered companies, public appearances, and trading securities held by a research analyst account.
Other Disclosures
J.P. Morgan ("JPM") is the global brand name for J.P. Morgan Securities LLC ("JPMS") and its affiliates worldwide. J.P. Morgan Cazenove is a marketing name for the U.K. investment banking businesses and EMEA cash equities and equity research businesses of JPMorgan Chase & Co. and its subsidiaries.
All research reports made available to clients are simultaneously available on our client website, J.P. Morgan Markets. Not all research content is redistributed, e-mailed or made available to third-party aggregators. For all research reports available on a particular stock, please contact your sales representative.
Options related research: If the information contained herein regards options related research, such information is available only to persons who have received the proper option risk disclosure documents. For a copy of the Option Clearing Corporation's Characteristics and Risks of Standardized Options, please contact your J.P. Morgan Representative or visit the OCC's website at http://www.optionsclearing.com/publications/risks/riskstoc.pdf
Legal Entities Disclosures U.S.: JPMS is a member of NYSE, FINRA, SIPC and the NFA. JPMorgan Chase Bank, N.A. is a member of FDIC. U.K.: JPMorgan Chase N.A., London Branch, is authorised by the Prudential Regulation Authority and is subject to regulation by the Financial Conduct Authority and to limited regulation by the Prudential Regulation Authority. Details about the extent of our regulation by the Prudential Regulation Authority are available from J.P. Morgan on request. J.P. Morgan Securities plc (JPMS plc) is a member of the London Stock Exchange and is authorised by the Prudential Regulation Authority and regulated by the Financial Conduct Authority and the Prudential Regulation Authority. Registered in England & Wales No. 2711006. Registered Office 25 Bank Street, London, E14 5JP. South Africa: J.P. Morgan Equities South Africa Proprietary Limited is a member of the Johannesburg Securities Exchange and is regulated by the Financial Services Board. Hong Kong: J.P. Morgan Securities (Asia Pacific) Limited (CE number AAJ321) is regulated by the Hong Kong Monetary Authority and the Securities and Futures Commission in Hong Kong. Korea: J.P. Morgan Securities (Far East) Ltd, Seoul Branch, is regulated by the Korea Financial Supervisory Service. Australia: J.P. Morgan Australia Limited (JPMAL) (ABN 52 002 888 011/AFS Licence No: 238188) is regulated by ASIC and J.P. Morgan Securities Australia Limited (JPMSAL) (ABN 61 003 245 234/AFS Licence No: 238066) is regulated by ASIC and is a Market, Clearing and Settlement Participant of ASX Limited and CHI-X. Taiwan: J.P.Morgan Securities (Taiwan) Limited is a participant of the Taiwan Stock Exchange (company-type) and regulated by the Taiwan Securities and Futures Bureau. India: J.P. Morgan India Private Limited, having its registered office at J.P. Morgan Tower, Off. C.S.T. Road, Kalina, Santacruz East, Mumbai - 400098, is a member of the National Stock Exchange of India Limited (SEBI Registration Number - INB 230675231/INF 230675231/INE 230675231) and Bombay Stock Exchange Limited (SEBI Registration Number - INB 010675237/INF 010675237) and is regulated by Securities and Exchange Board of India. Thailand: JPMorgan Securities (Thailand) Limited is a member of the Stock Exchange of Thailand and is regulated by the Ministry of Finance and the Securities and Exchange Commission. Indonesia: PT J.P. Morgan Securities Indonesia is a member of the Indonesia Stock Exchange and is regulated by the BAPEPAM LK. Philippines: J.P. Morgan Securities Philippines Inc. is a Trading Participant of the Philippine Stock Exchange and a member of the Securities Clearing Corporation of the Philippines and the Securities Investor Protection Fund. It is regulated by the Securities and Exchange Commission. Brazil: Banco J.P. Morgan S.A. is regulated by the Comissao de Valores Mobiliarios (CVM) and by the Central Bank of Brazil. Mexico: J.P. Morgan Casa de Bolsa, S.A. de C.V., J.P. Morgan Grupo Financiero is a member of the Mexican Stock Exchange and authorized to act as a broker dealer by the National Banking and
11
Asia Pacific Equity Research28 March 2014
Hoy Kit Mak(60-3) [email protected]
Securities Exchange Commission. Singapore: This material is issued and distributed in Singapore by J.P. Morgan Securities Singapore Private Limited (JPMSS) [MIC (P) 049/04/2013 and Co. Reg. No.: 199405335R] which is a member of the Singapore Exchange Securities Trading Limited and is regulated by the Monetary Authority of Singapore (MAS) and/or JPMorgan Chase Bank, N.A., Singapore branch (JPMCB Singapore) which is regulated by the MAS. Japan: JPMorgan Securities Japan Co., Ltd. is regulated by the Financial Services Agency in Japan. Malaysia: This material is issued and distributed in Malaysia by JPMorgan Securities (Malaysia) Sdn Bhd (18146-X) which is a Participating Organization of Bursa Malaysia Berhad and a holder of Capital Markets Services License issued by the Securities Commission in Malaysia. Pakistan: J. P. Morgan Pakistan Broking (Pvt.) Ltd is a member of the Karachi Stock Exchange and regulated by the Securities and Exchange Commission of Pakistan. Saudi Arabia: J.P. Morgan Saudi Arabia Ltd. is authorized by the Capital Market Authority of the Kingdom of Saudi Arabia (CMA) to carry out dealing as an agent, arranging, advising and custody, with respect to securities business under licence number 35-07079 and its registered address is at 8th Floor, Al-Faisaliyah Tower, King Fahad Road, P.O. Box 51907, Riyadh 11553, Kingdom of Saudi Arabia. Dubai: JPMorgan Chase Bank, N.A., Dubai Branch is regulated by the Dubai Financial Services Authority (DFSA) and its registered address is Dubai International Financial Centre - Building 3, Level 7, PO Box 506551, Dubai, UAE.
Country and Region Specific Disclosures U.K. and European Economic Area (EEA): Unless specified to the contrary, issued and approved for distribution in the U.K. and the EEA by JPMS plc. Investment research issued by JPMS plc has been prepared in accordance with JPMS plc's policies for managing conflicts of interest arising as a result of publication and distribution of investment research. Many European regulators require a firm to establish, implement and maintain such a policy. This report has been issued in the U.K. only to persons of a kind described in Article 19 (5), 38, 47 and 49 of the Financial Services and Markets Act 2000 (Financial Promotion) Order 2005 (all such persons being referred to as "relevant persons"). This document must not be acted on or relied on by persons who are not relevant persons. Any investment or investment activity to which this document relates is only available to relevant persons and will beengaged in only with relevant persons. In other EEA countries, the report has been issued to persons regarded as professional investors (or equivalent) in their home jurisdiction. Australia: This material is issued and distributed by JPMSAL in Australia to "wholesale clients" only. This material does not take into account the specific investment objectives, financial situation or particular needs of the recipient. The recipient of this material must not distribute it to any third party or outside Australia without the prior written consent of JPMSAL. For the purposes of this paragraph the term "wholesale client" has the meaning given in section 761G of the Corporations Act 2001. Germany: This material is distributed in Germany by J.P. Morgan Securities plc, Frankfurt Branch and J.P.Morgan Chase Bank, N.A., Frankfurt Branch which are regulated by the Bundesanstalt für Finanzdienstleistungsaufsicht. Hong Kong: The 1% ownership disclosure as of the previous month end satisfies the requirements under Paragraph 16.5(a) of the Hong Kong Code of Conduct for Persons Licensed by or Registered with the Securities and Futures Commission. (For research published within the first ten days of the month, the disclosure may be based on the month end data from two months prior.) J.P. Morgan Broking (Hong Kong) Limited is the liquidity provider/market maker for derivative warrants, callable bull bear contracts and stock options listed on the Stock Exchange of Hong Kong Limited. An updated list can be found on HKEx website: http://www.hkex.com.hk. Japan: There is a risk that a loss may occur due to a change in the price of the shares in the case of share trading, and that a loss may occur due to the exchange rate in the case of foreign share trading. In the case of share trading, JPMorgan Securities Japan Co., Ltd., will be receiving a brokerage fee and consumption tax (shouhizei) calculated by multiplying the executed price by the commission rate which was individually agreed between JPMorgan Securities Japan Co., Ltd., and the customer in advance. Financial Instruments Firms: JPMorgan Securities Japan Co., Ltd., Kanto Local Finance Bureau (kinsho) No. 82 Participating Association / Japan Securities Dealers Association, The Financial Futures Association of Japan, Type II Financial Instruments Firms Association and Japan Investment Advisers Association. Korea: This report may have been edited or contributed tofrom time to time by affiliates of J.P. Morgan Securities (Far East) Ltd, Seoul Branch. Singapore: JPMSS and/or its affiliates may have a holding in any of the securities discussed in this report; for securities where the holding is 1% or greater, the specific holding is disclosed in the Important Disclosures section above. India: For private circulation only, not for sale. Pakistan: For private circulation only, not for sale. New Zealand: This material is issued and distributed by JPMSAL in New Zealand only to persons whose principal business is the investment of money or who, in the course of and for the purposes of their business, habitually invest money. JPMSAL does not issue or distribute this material to members of "the public" as determined in accordance with section 3 of the Securities Act 1978. The recipient of this material must not distribute it to any third party or outside New Zealand without the prior written consent of JPMSAL. Canada: The information contained herein is not, and under no circumstances is to be construed as, a prospectus, an advertisement, a public offering, an offer to sell securities described herein, or solicitation of an offer to buy securities described herein, in Canada or any province or territory thereof. Any offer or sale of the securities described herein in Canada will be made only under an exemption from the requirements to file a prospectus with the relevant Canadian securities regulators and only by a dealer properly registered under applicable securities laws or, alternatively, pursuant to an exemption from the dealer registration requirement in the relevant province or territory of Canada in which such offer or sale is made. The information contained herein is under no circumstances to be construed as investment advice in any province or territory of Canada and is not tailored to the needs of the recipient. To the extent that the information contained herein references securities of an issuer incorporated, formed or created under the laws of Canada or a province or territory of Canada, any trades in such securities must be conducted through a dealer registered in Canada. No securities commission or similar regulatory authority in Canada has reviewed or in any way passed judgment upon these materials, the information contained herein or the merits of the securities described herein, and any representation to the contrary is an offence. Dubai: This report has been issued to persons regarded as professional clients as defined under the DFSA rules. Brazil: Ombudsman J.P. Morgan: 0800-7700847 / [email protected].
General: Additional information is available upon request. Information has been obtained from sources believed to be reliable but JPMorgan Chase & Co. or its affiliates and/or subsidiaries (collectively J.P. Morgan) do not warrant its completeness or accuracy except with respect to any disclosures relative to JPMS and/or its affiliates and the analyst's involvement with the issuer that is the subject of the research. All pricing is as of the close of market for the securities discussed, unless otherwise stated. Opinions and estimates constitute our judgment as of the date of this material and are subject to change without notice. Past performance is not indicative of future results. This material is not intended as an offer or solicitation for the purchase or sale of any financial instrument. The opinions and recommendations herein do not take into account individual client circumstances, objectives, or needs and are not intended as recommendations of particular securities, financial instruments or strategies to particular clients. The recipient of this report must make its own independent decisions regarding any securities or financial instruments mentioned herein. JPMS distributes in the U.S. research published by non-U.S. affiliates and accepts responsibility for its contents. Periodic updates may be provided on companies/industries based on company specific developments or announcements, market conditions or any other publicly available information. Clients should contact analysts and execute transactions through a J.P. Morgan subsidiary or affiliate in their home jurisdiction unless governing law permits otherwise.
"Other Disclosures" last revised December 7, 2013.

12
Asia Pacific Equity Research28 March 2014
Hoy Kit Mak(60-3) [email protected]
Copyright 2014 JPMorgan Chase & Co. All rights reserved. This report or any portion hereof may not be reprinted, sold or redistributed without the written consent of J.P. Morgan. #$J&098$#*P