9;.: . f / . f9# 8 . > 3eprints.uthm.edu.my/4720/1/muhamad_faizal_bin_abdul_jamil.pdfstatus...
TRANSCRIPT
DESIGN OPTIMIZATION OF ANN-BASED PATTERN RECOGNIZER
FOR MULTIVARIATE QUALITY CONTROL
MUHAMAD FAIZAL BIN ABDUL JAMIL
Tesis ini dikemukakan sebagai
memenuhi syarat penganugerahan
Ijazah Sarjana
Fakulti Kejuruteraan Mekanikal dan Pembuatan
Universiti Tun Hussein Onn Malaysia
MAY 2013
iv
ABSTRACT
In manufacturing industries, process variation is known to be major source of poor
quality. As such, process monitoring and diagnosis is critical towards continuous quality
improvement. This becomes more challenging when involving two or more correlated
variables or known as multivariate. Process monitoring refers to the identification of process
status either it is running within a statistically in-control or out-of-control condition, while
process diagnosis refers to the identification of the source variables of out-of-control process.
The traditional statistical process control (SPC) charting scheme are known to be effective in
monitoring aspects, but they are lack of diagnosis. In recent years, the artificial neural
network (ANN) based pattern recognition schemes has been developed for solving this issue.
The existing ANN model recognizers are mainly utilize raw data as input representation,
which resulted in limited performance. In order to improve the monitoring-diagnosis
capability, in this research, the feature based input representation shall be investigated using
empirical method in designing the ANN model recognizer.
v
ABSTRAK
Dalam industri pembuatan, variasi proses yang dikenalpasti sebagai sumber utama
masalah kualiti. Oleh itu, pemantauan proses dan diagnosis adalah penting ke arah
penambahbaikan kualiti yang berterusan. Ini menjadi lebih mencabar apabila melibatkan dua
atau lebih pembolehubah kaitan atau dikenali sebagai multivariat. Pemantauan proses
merujuk kepada pengenalan status proses sama ada ia sedang berjalan dalam statistik dalam
kawalan atau keadaan di luar kawalan, manakala diagnosis proses merujuk kepada
pengenalan pembolehubah proses sumber luar kawalan. Proses Kawalan Statistik (SPC)
menggunakan carta statistic tradisional diketahui berkesan dalam aspek pemantauan, tetapi
kekurangan dari aspek diagnosis. Dalam tahun-tahun kebelakangan ini, skim rangkaian
neural tiruan (ANN) berasaskan pengiktirafan corak telah dibangunkan untuk
menyelesaikan isu ini. Model pengenal (recognizer) rangkaian neural tiruan (ANN) yang
sedia ada kebanyakannya menggunakan data mentah sebagai perwakilan input, yang
menghasilkan prestasi yang terhad. Dalam usaha untuk meningkatkan keupayaan
pemantauan diagnosis, dalam kajian ini, ciri perwakilan input berasaskan akan disiasat
menggunakan kaedah empirikal dalam bentuk model ANN Pengenal.
vi
TABLE OF CONTENTS
CHAPTER PAGE
ACKNOWLEDGEMENTS iii
ABSTRACT iv
ABSTRAK v
TABLE OF CONTENTS vi
LIST OF TABLES ix
LIST OF FIGURES x
LIST OF ABBREVIATIONS xi
LIST OF SYMBOLS xii
LIST OF APPENDICES xiii
CHAPTER 1 : INTRODUCTION 1
1.1 Introduction
1.2 Statement of The Problem 3
1.3 Purpose of the research 3
1.4 Objectives 3
1.5 Scopes and key assumptions 4
1.6 Definitions of terms 5
1.7 Expected Outcomes 6
vii
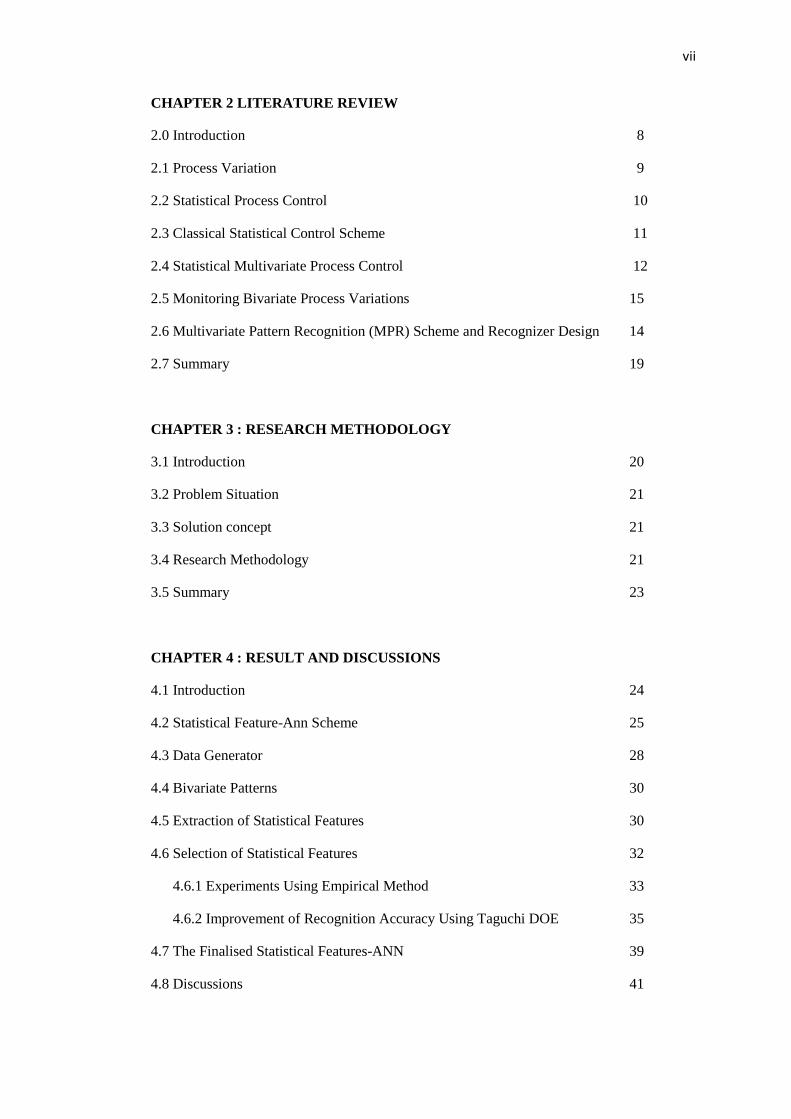
CHAPTER 2 LITERATURE REVIEW
2.0 Introduction 8
2.1 Process Variation 9
2.2 Statistical Process Control 10
2.3 Classical Statistical Control Scheme 11
2.4 Statistical Multivariate Process Control 12
2.5 Monitoring Bivariate Process Variations 15
2.6 Multivariate Pattern Recognition (MPR) Scheme and Recognizer Design 14
2.7 Summary 19
CHAPTER 3 : RESEARCH METHODOLOGY
3.1 Introduction 20
3.2 Problem Situation 21
3.3 Solution concept 21
3.4 Research Methodology 21
3.5 Summary 23
CHAPTER 4 : RESULT AND DISCUSSIONS
4.1 Introduction 24
4.2 Statistical Feature-Ann Scheme 25
4.3 Data Generator 28
4.4 Bivariate Patterns 30
4.5 Extraction of Statistical Features 30
4.6 Selection of Statistical Features 32
4.6.1 Experiments Using Empirical Method 33
4.6.2 Improvement of Recognition Accuracy Using Taguchi DOE 35
4.7 The Finalised Statistical Features-ANN 39
4.8 Discussions 41
viii
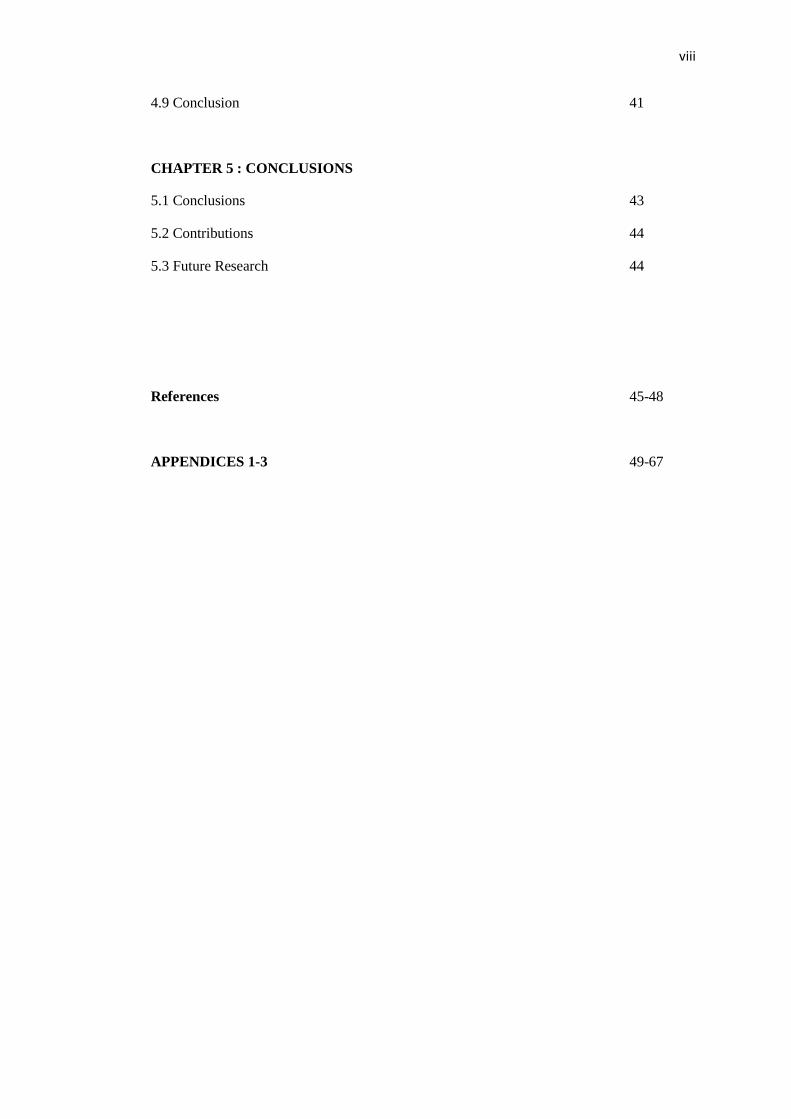
4.9 Conclusion 41
CHAPTER 5 : CONCLUSIONS
5.1 Conclusions 43
5.2 Contributions 44
5.3 Future Research 44
References 45-48
APPENDICES 1-3 49-67
ix
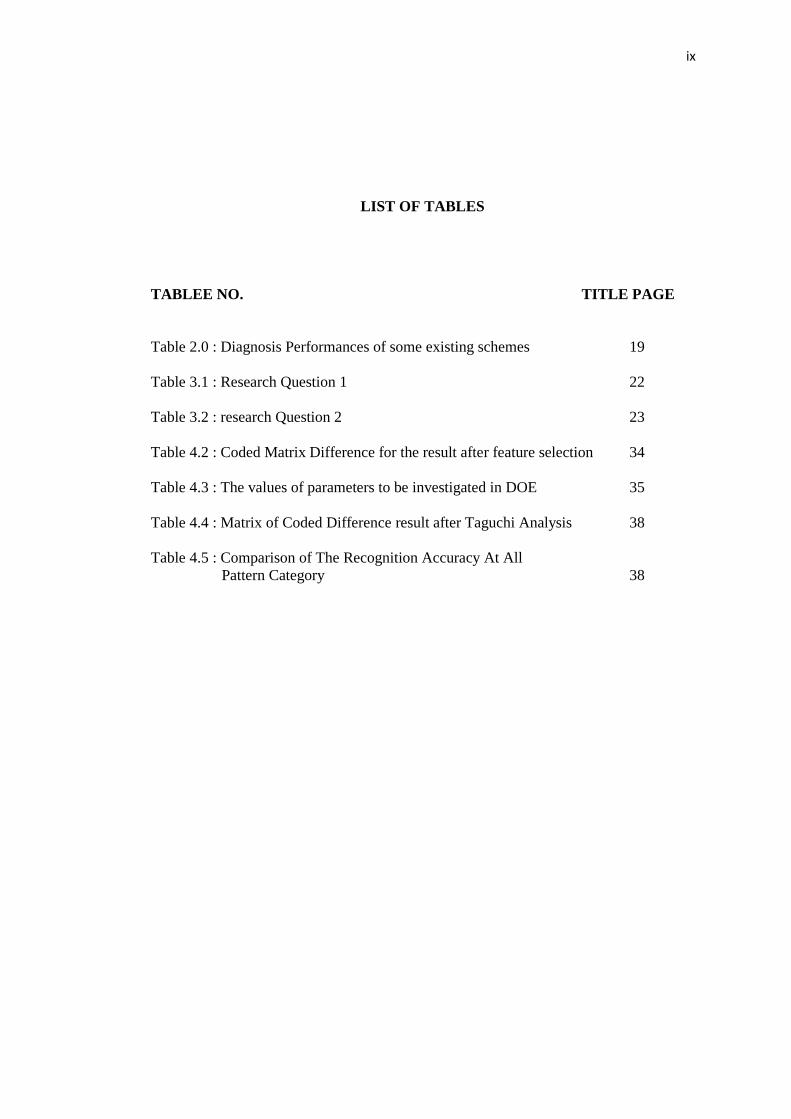
LIST OF TABLES
TABLEE NO. TITLE PAGE
Table 2.0 : Diagnosis Performances of some existing schemes 19
Table 3.1 : Research Question 1 22
Table 3.2 : research Question 2 23
Table 4.2 : Coded Matrix Difference for the result after feature selection 34
Table 4.3 : The values of parameters to be investigated in DOE 35
Table 4.4 : Matrix of Coded Difference result after Taguchi Analysis 38
Table 4.5 : Comparison of The Recognition Accuracy At All
Pattern Category 38
x
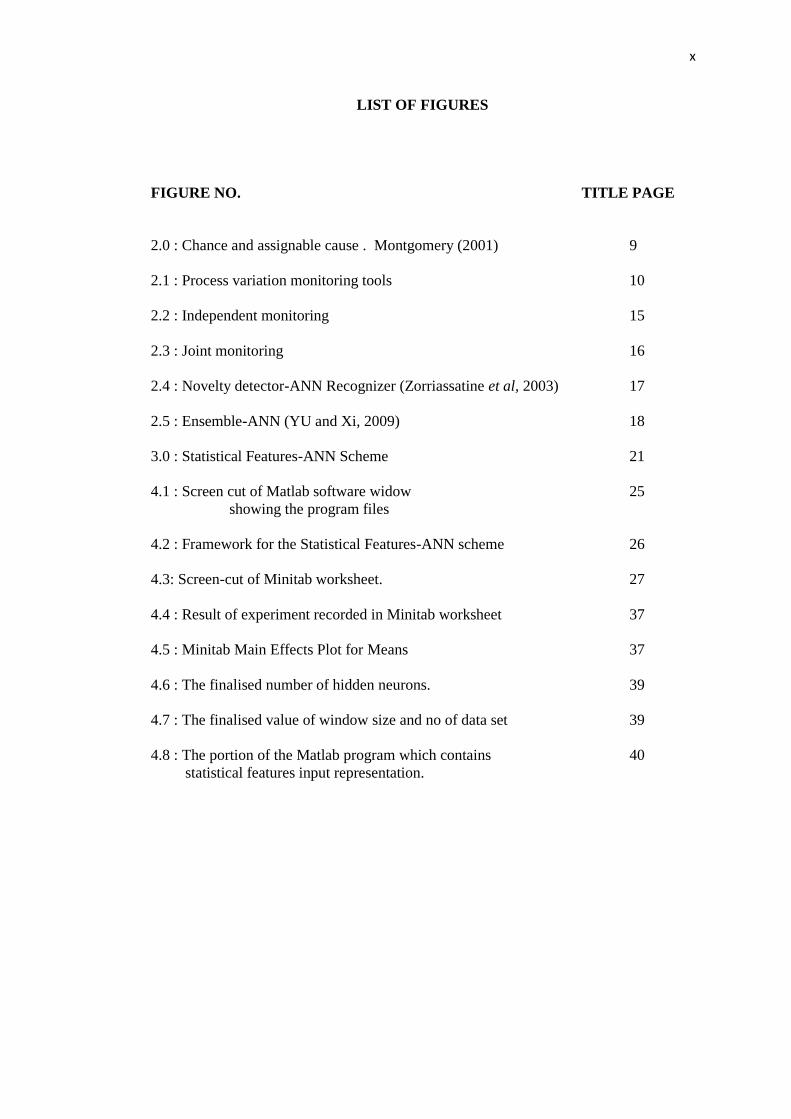
LIST OF FIGURES
FIGURE NO. TITLE PAGE
2.0 : Chance and assignable cause . Montgomery (2001) 9
2.1 : Process variation monitoring tools 10
2.2 : Independent monitoring 15
2.3 : Joint monitoring 16
2.4 : Novelty detector-ANN Recognizer (Zorriassatine et al, 2003) 17
2.5 : Ensemble-ANN (YU and Xi, 2009) 18
3.0 : Statistical Features-ANN Scheme 21
4.1 : Screen cut of Matlab software widow 25
showing the program files
4.2 : Framework for the Statistical Features-ANN scheme 26
4.3: Screen-cut of Minitab worksheet. 27
4.4 : Result of experiment recorded in Minitab worksheet 37
4.5 : Minitab Main Effects Plot for Means 37
4.6 : The finalised number of hidden neurons. 39
4.7 : The finalised value of window size and no of data set 39
4.8 : The portion of the Matlab program which contains 40
statistical features input representation.
xi
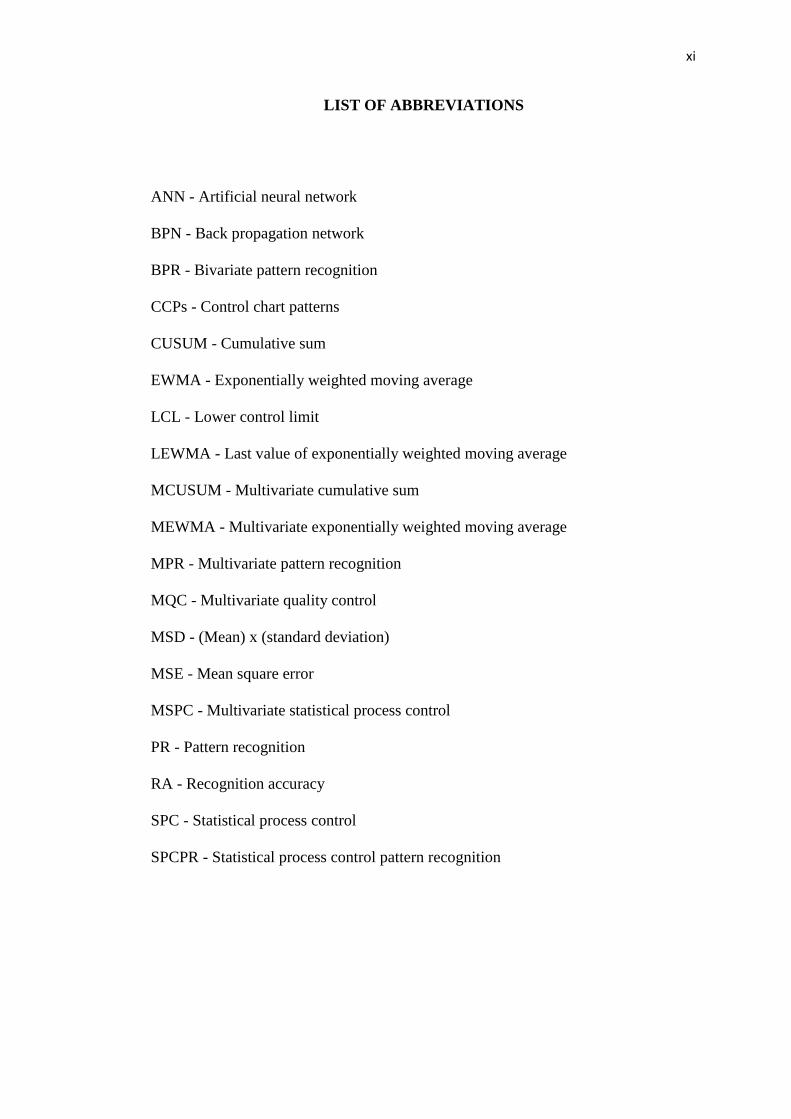
LIST OF ABBREVIATIONS
ANN - Artificial neural network
BPN - Back propagation network
BPR - Bivariate pattern recognition
CCPs - Control chart patterns
CUSUM - Cumulative sum
EWMA - Exponentially weighted moving average
LCL - Lower control limit
LEWMA - Last value of exponentially weighted moving average
MCUSUM - Multivariate cumulative sum
MEWMA - Multivariate exponentially weighted moving average
MPR - Multivariate pattern recognition
MQC - Multivariate quality control
MSD - (Mean) x (standard deviation)
MSE - Mean square error
MSPC - Multivariate statistical process control
PR - Pattern recognition
RA - Recognition accuracy
SPC - Statistical process control
SPCPR - Statistical process control pattern recognition
xii
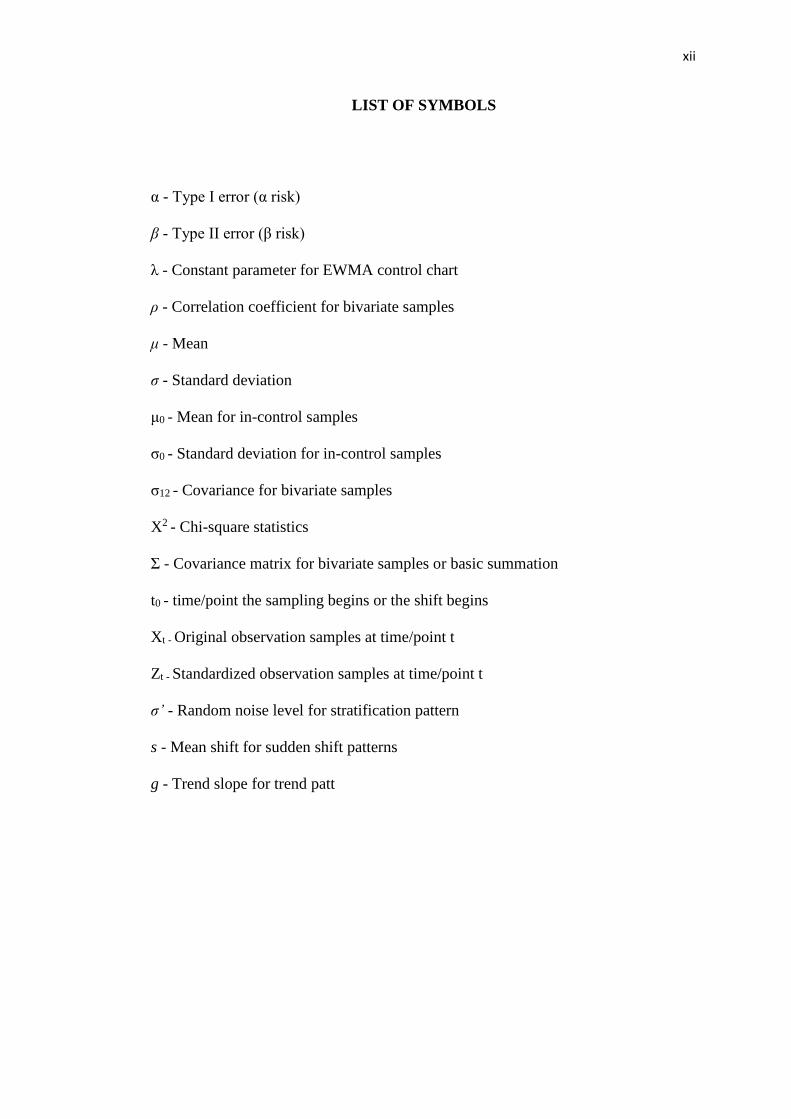
LIST OF SYMBOLS
α - Type I error (α risk)
β - Type II error (β risk)
λ - Constant parameter for EWMA control chart
ρ - Correlation coefficient for bivariate samples
μ - Mean
σ - Standard deviation
μ0 - Mean for in-control samples
σ0 - Standard deviation for in-control samples
σ12 - Covariance for bivariate samples
X2 - Chi-square statistics
Σ - Covariance matrix for bivariate samples or basic summation
t0 - time/point the sampling begins or the shift begins
Xt - Original observation samples at time/point t
Zt - Standardized observation samples at time/point t
σ’ - Random noise level for stratification pattern
s - Mean shift for sudden shift patterns
g - Trend slope for trend patt

xiii
LIST OF APPENDICES
APPENDIX TITLE PAGE
1 Tabulated Results of The Experiments 49
Using Empirical Method
2 MATLAB Program : Train_FB_ANN.m 50
3 MATLAB Program : Train_fDS01_ANN.m 57
1
CHAPTER 1
INTRODUCTION
1.1 Introduction
There are various definitions of quality; Dr. Armand Feugenbaum, states that
“Quality is a customer determination which is based on the customer’s experience
with the product or service, measured against his or her requirements – stated or
unstated, conscious or merely sensed, technically operational or entirely subjective –
and always representing a moving target in a competitive market” (Summers, 2007) .
High quality of product is the vital concern for most of the companies that will
survive in this highly competitive global market. One of the most effective
approaches to achieve high product quality is through the applications of Statistical
Process Control (SPC).
Statistical Process Control (SPC) has become an important approach or tool
for process industries until these days. Statistical process control (SPC) is a powerful
and commonly used tool to improve product quality by using statistical tools and
techniques to monitor, control and improve processes. The aim of SPC is to achieve
higher product quality and lower the production cost due to the minimization of the
defect product. One of the most commonly used tools is the statistical process
control chart developed by Dr. Walter A. Shewhart (Shewhart, 1931), which is
known as “The Control Chart”. Basically, a control chart is a plot of a process
characteristic, usually over time with statistically determined limits. When used for
monitoring process variation, it helps the user to determine the appropriate type of
action to take on the process.
2
Process variation has been known to be a major source of poor quality in
manufacturing industries. Monitoring process variation is important in the process of
achieving best quality of product, which involves the identification of process
status, either it is running within a statistically in-control or out-of-control condition.
Process diagnosis refers to the identification of the source of variables of out-of-
control process.
In reality, manufacturing processes involve two or more dependent variables,
and therefore an appropriate scheme is required to monitor and diagnose those
variables simultaneously. If this is the case, monitoring those variables separately
using univariate SPC would inevitably expose to the high possibility of false alarms
occurrence and this shall lead to wrong decision making which due to inaccurate
data. The suitable technique which shall be used in this case, is known as
Multivariate Quality Control (MQC). It is basically an extension of simple
univariate (one variable at a time) quality control.
3
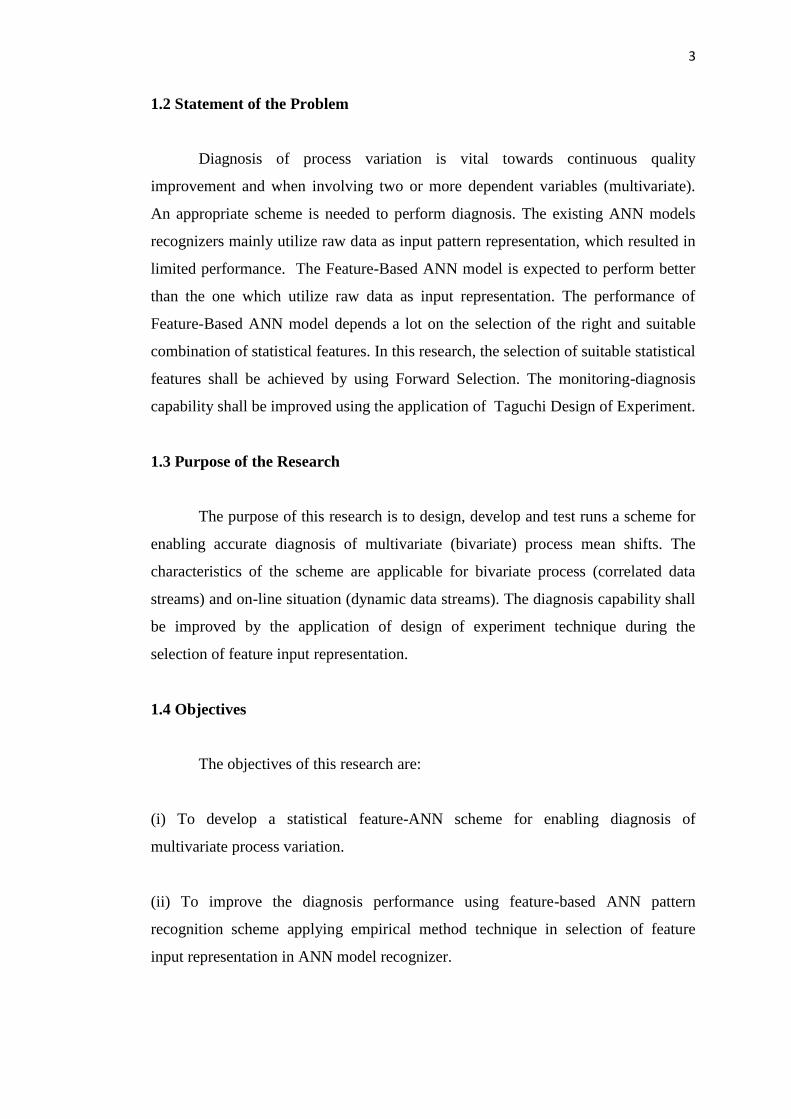
1.2 Statement of the Problem
Diagnosis of process variation is vital towards continuous quality
improvement and when involving two or more dependent variables (multivariate).
An appropriate scheme is needed to perform diagnosis. The existing ANN models
recognizers mainly utilize raw data as input pattern representation, which resulted in
limited performance. The Feature-Based ANN model is expected to perform better
than the one which utilize raw data as input representation. The performance of
Feature-Based ANN model depends a lot on the selection of the right and suitable
combination of statistical features. In this research, the selection of suitable statistical
features shall be achieved by using Forward Selection. The monitoring-diagnosis
capability shall be improved using the application of Taguchi Design of Experiment.
1.3 Purpose of the Research
The purpose of this research is to design, develop and test runs a scheme for
enabling accurate diagnosis of multivariate (bivariate) process mean shifts. The
characteristics of the scheme are applicable for bivariate process (correlated data
streams) and on-line situation (dynamic data streams). The diagnosis capability shall
be improved by the application of design of experiment technique during the
selection of feature input representation.
1.4 Objectives
The objectives of this research are:
(i) To develop a statistical feature-ANN scheme for enabling diagnosis of
multivariate process variation.
(ii) To improve the diagnosis performance using feature-based ANN pattern
recognition scheme applying empirical method technique in selection of feature
input representation in ANN model recognizer.
4
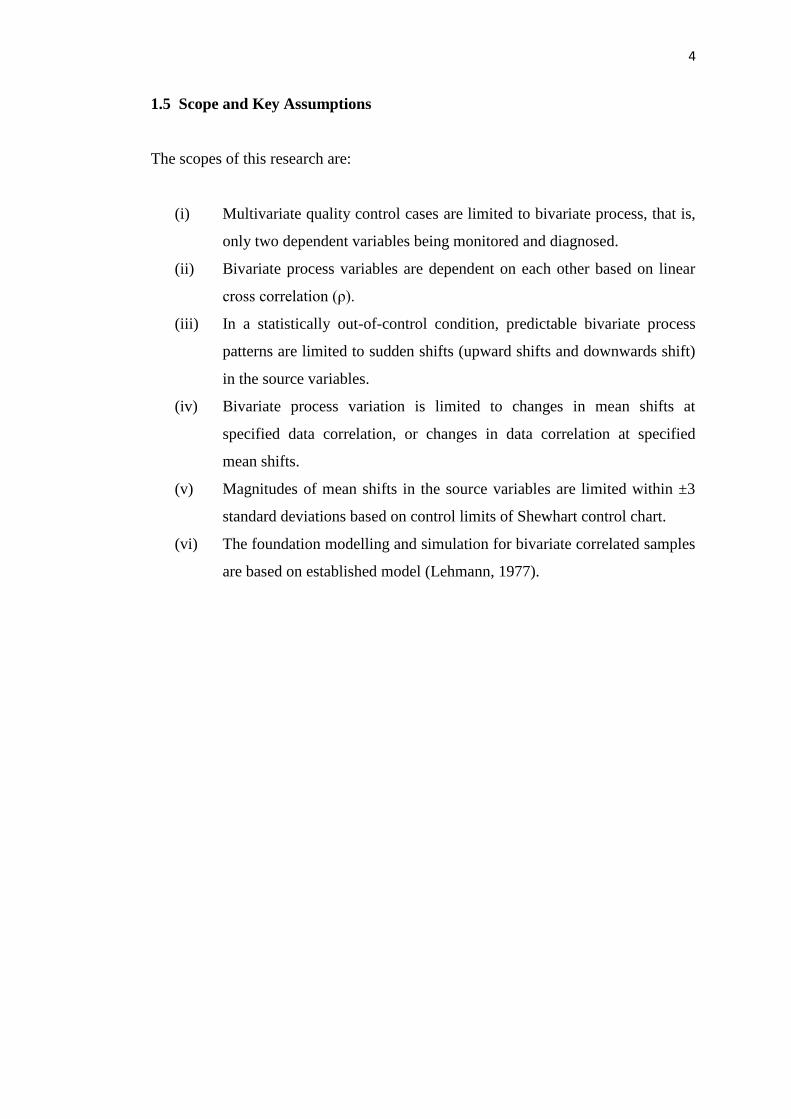
1.5 Scope and Key Assumptions
The scopes of this research are:
(i) Multivariate quality control cases are limited to bivariate process, that is,
only two dependent variables being monitored and diagnosed.
(ii) Bivariate process variables are dependent on each other based on linear
cross correlation (ρ).
(iii) In a statistically out-of-control condition, predictable bivariate process
patterns are limited to sudden shifts (upward shifts and downwards shift)
in the source variables.
(iv) Bivariate process variation is limited to changes in mean shifts at
specified data correlation, or changes in data correlation at specified
mean shifts.
(v) Magnitudes of mean shifts in the source variables are limited within ±3
standard deviations based on control limits of Shewhart control chart.
(vi) The foundation modelling and simulation for bivariate correlated samples
are based on established model (Lehmann, 1977).
5
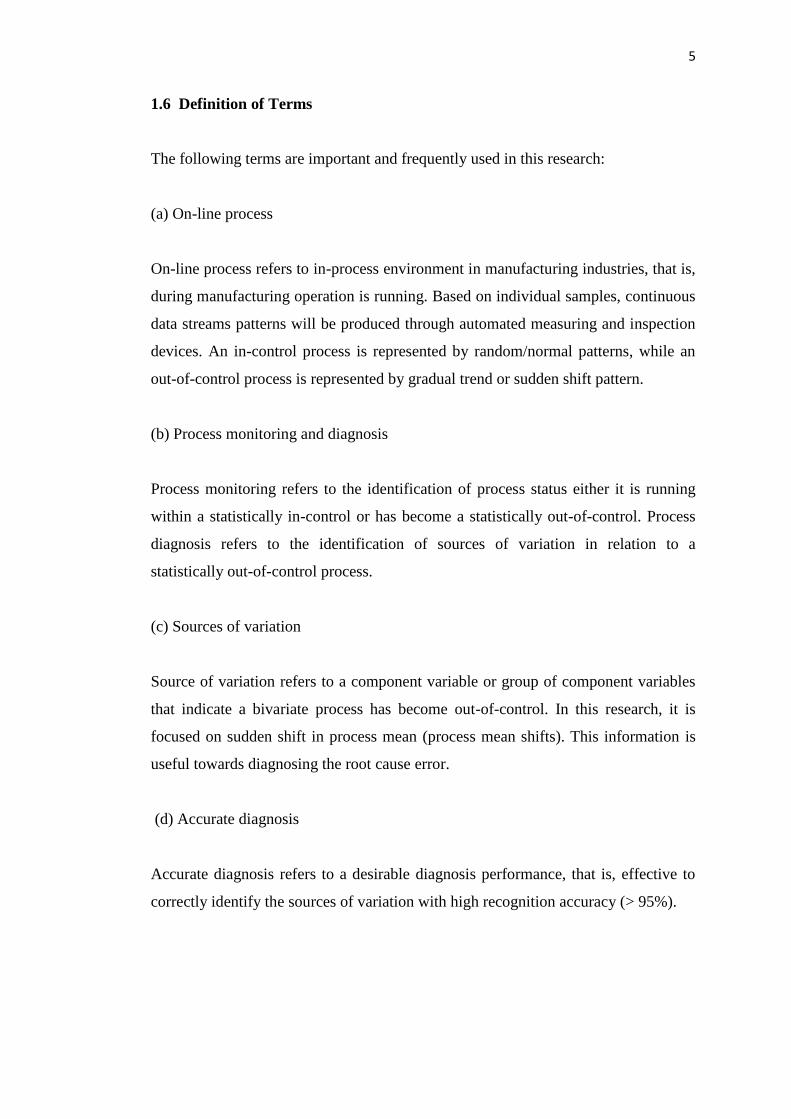
1.6 Definition of Terms
The following terms are important and frequently used in this research:
(a) On-line process
On-line process refers to in-process environment in manufacturing industries, that is,
during manufacturing operation is running. Based on individual samples, continuous
data streams patterns will be produced through automated measuring and inspection
devices. An in-control process is represented by random/normal patterns, while an
out-of-control process is represented by gradual trend or sudden shift pattern.
(b) Process monitoring and diagnosis
Process monitoring refers to the identification of process status either it is running
within a statistically in-control or has become a statistically out-of-control. Process
diagnosis refers to the identification of sources of variation in relation to a
statistically out-of-control process.
(c) Sources of variation
Source of variation refers to a component variable or group of component variables
that indicate a bivariate process has become out-of-control. In this research, it is
focused on sudden shift in process mean (process mean shifts). This information is
useful towards diagnosing the root cause error.
(d) Accurate diagnosis
Accurate diagnosis refers to a desirable diagnosis performance, that is, effective to
correctly identify the sources of variation with high recognition accuracy (> 95%).

6
(e) Control chart patterns (CCPs)
Control chart patterns refer to the patterns of univariate process data streams that can
be indicated graphically using Shewhart control chart.
(f) Bivariate patterns
Bivariate patterns refer to the unified patterns that are able to indicate the linear
correlation between two dependent variables. In this research, these patterns are
represented graphically using scatter diagrams.
(g) Pattern recognition
Pattern recognition is an operation of extracting information from an unknown
process data streams or signals, and assigning it to one of the prescribed classes or
categories (Haykin, 1999). In this research, it deals with bivariate patterns.
(h) Pattern recognition scheme
Pattern recognition scheme refers to a set of related procedures formulated and
presented in a unified manner for addressing the problem of control chart pattern
recognition (Hassan, 2002).
1.7 Expected Outcomes
The main outcome of this research would be a representative pattern
recognition scheme namely features-based ANN as a proof of improvement. The
intended scheme should be capable of identifying the sources of variables of
multivariate process variation.
The design strategy in developing an intended scheme involves application of
the existing methods and investigation on improved methods. The existing method
includes modelling of multivariate process samples and patterns, which is less

7
reported in this field. The improved methods include the design of statistical features
input pattern representation and an ANN model recognizer using empirical method.
8
CHAPTER 2
LITERATURE REVIEW
2.0 Introduction
This chapter provides a review on the existing researches related to the
subject of this thesis which includes a general review on process variation which is
known to be the source of poor quality and then followed by the use of SPC to
monitor univariate process variation and multivariate process variation. Also, the
limitation of multivariate quality control (MQC) and research works in multivariate
statistical process control (MSPC), and statistical process control pattern recognition
(SPCPR) schemes are also reviewed.
9
2.1 Process Variation
In manufacturing and service industries, the goal of most processes is to
produce products or provide services that exhibit little or no variation. Variation,
where no two items or services are exactly the same, exists in all processes
(Summers, 2006). Process variation and process precision are closely related,
whereby a process with little variation is said to be 'precise'. Most processes are
designed with controls that can be used to adjust the process mean, and hence
increase the accuracy. Reducing the amount of process variation is usually a difficult
task.
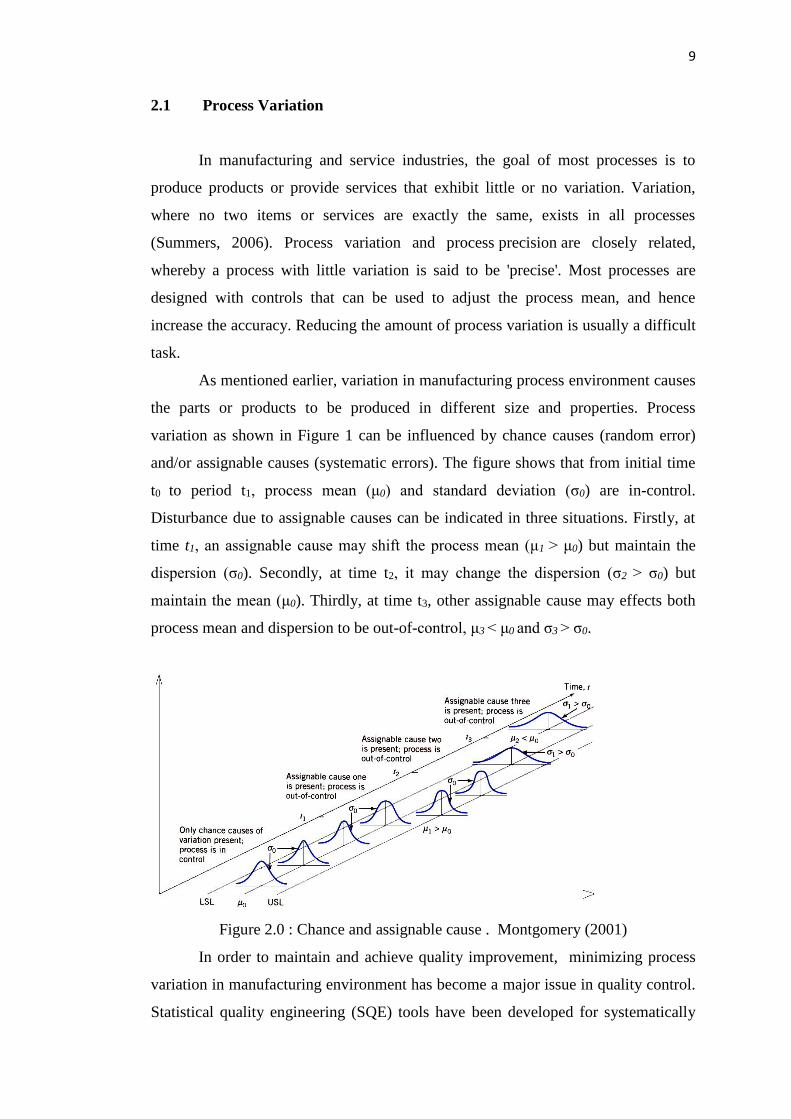
As mentioned earlier, variation in manufacturing process environment causes
the parts or products to be produced in different size and properties. Process
variation as shown in Figure 1 can be influenced by chance causes (random error)
and/or assignable causes (systematic errors). The figure shows that from initial time
t0 to period t1, process mean (μ0) and standard deviation (σ0) are in-control.
Disturbance due to assignable causes can be indicated in three situations. Firstly, at
time t1, an assignable cause may shift the process mean (μ1 > μ0) but maintain the
dispersion (σ0). Secondly, at time t2, it may change the dispersion (σ2 > σ0) but
maintain the mean (μ0). Thirdly, at time t3, other assignable cause may effects both
process mean and dispersion to be out-of-control, μ3 < μ0 and σ3 > σ0.
Figure 2.0 : Chance and assignable cause . Montgomery (2001)
In order to maintain and achieve quality improvement, minimizing process
variation in manufacturing environment has become a major issue in quality control.
Statistical quality engineering (SQE) tools have been developed for systematically

10
reducing variability in the key process variables or quality characteristics of the
product (Montgomery, 2001). Statistical process control (SPC) charting is one of the
SQE tools that useful for monitoring and diagnosing process variation.
2.2 Statistical Process Control (SPC)
In general, the use of statistical tools in monitoring process variation can be
visualised by Figure 2.1 below :
Figure 2.1 : Process variation monitoring tools
A primary tool used for SPC is the control chart. A control chart is a
graphical representation of certain descriptive statistics for specific quantitative
measurements of the process. In the following subsections, some widely used control
charts will be reviewed. The aim of statistical process control (SPC) is to achieve
higher quality of final product and lower the production loss due to defect product.
Process monitoring with control chart is a basic tool of statistical process control. It
monitors the behavior of a production process and signals the operator to take
necessary action when abnormal event occurs. A stable production process is the key
element of quality improvement. In this chapter, the traditional control chart –
Shewhart control charts, which is a univariate statistical process control technique
will be introduced.
11
2.3 Classical Statistical Control Schemes
The Shewhart X̅ control chart, Cumulative Sum (CUSUM) control chart, and
Exponentially Weighted Moving Average (EWMA) control chart are regarded as
classical control schemes. Classical statistical control techniques focus on the
monitoring of one quality variable at a time. In classical control schemes, an
assumption is made that the values of the process mean and variance are known prior
to the start of process monitoring.
A general model for the X̅ control chart is given as follows. Let x be a sample
statistic that measures some quality characteristic of interest, and suppose that the
mean of x is μx and the standard deviation of x is δx. Then the control limits of the X̅
control chart are μx ± Lδx where L is defined as the “distance” of the control limits
from the in-control mean, expressed in standard deviation units. If any point exceeds
the control limits, the process will be deemed out-of-control. Investigation and
corrective action are required to find and eliminate the assignable cause. A major
disadvantage of the X̅ control chart is that it can only use recent information, making
it relatively insensitive to small to moderate shifts. Two control charts are proposed
as excellent alternatives to the X̅ control chart when small to moderate shifts are of
primary interest. They are the CUSUM and EWMA control charts.
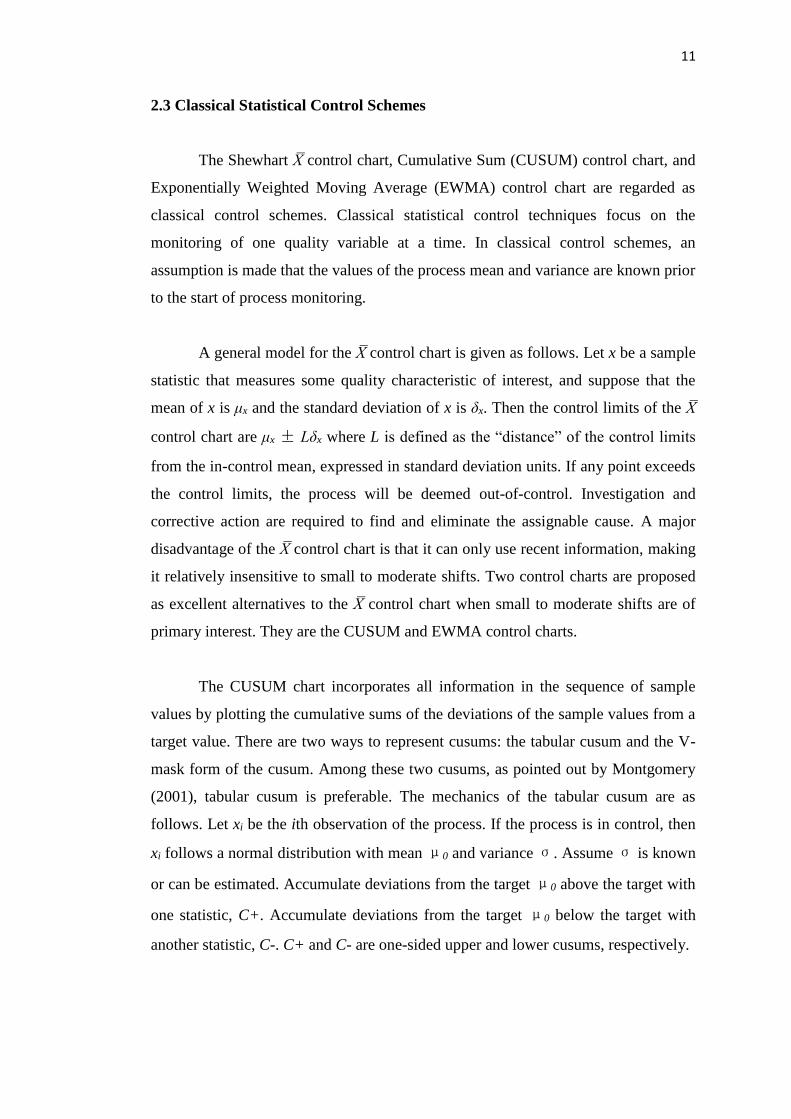
The CUSUM chart incorporates all information in the sequence of sample
values by plotting the cumulative sums of the deviations of the sample values from a
target value. There are two ways to represent cusums: the tabular cusum and the V-
mask form of the cusum. Among these two cusums, as pointed out by Montgomery
(2001), tabular cusum is preferable. The mechanics of the tabular cusum are as
follows. Let xi be the ith observation of the process. If the process is in control, then
xi follows a normal distribution with mean μ0 and variance σ. Assume σ is known
or can be estimated. Accumulate deviations from the target μ0 above the target with
one statistic, C+. Accumulate deviations from the target μ0 below the target with
another statistic, C-. C+ and C- are one-sided upper and lower cusums, respectively.
12
The statistics are computed as follows:
where starting values are 𝐶0+ = 𝐶0
− =0 and k is the reference value. If either statistic
( 𝐶0+ or 𝐶0
− ) exceeds a decision interval H, the process is considered to be out-of
control.
The Exponentially Weighted Moving Average (EWMA) control chart is
another control scheme useful for detecting small to moderate shifts. It is defined as
𝑧𝑖 = 𝜆𝑥𝑖 + (1 − 𝜆)𝑧𝑖−1 (2.3)
where 0 < λ ≤ 1 is a constant and the starting value is the process target, i.e., z0 =μ0.
The control limits are :
𝜇0 ± 𝐿𝛿√𝜆 [1−(1−𝜆)2𝑖]
(2−𝜆) (2.4)
where L is the width of the control limits. If any observation exceeds control limits,
an out-of-control condition happens.
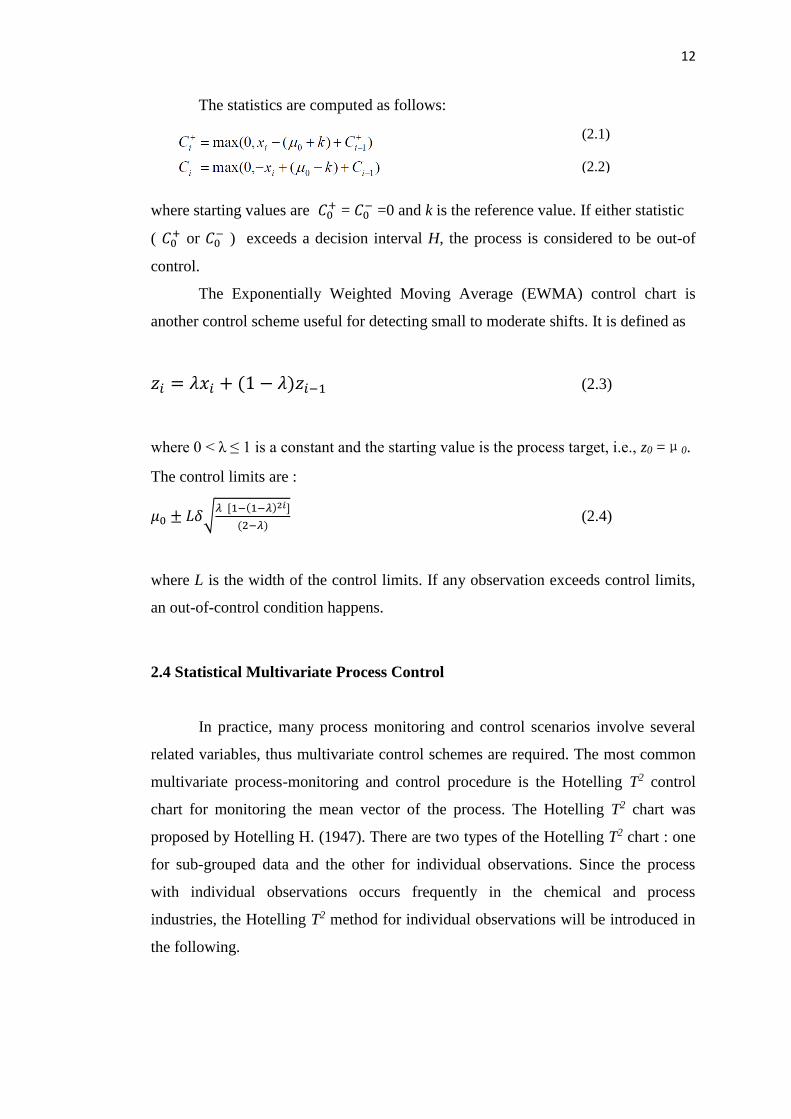
2.4 Statistical Multivariate Process Control
In practice, many process monitoring and control scenarios involve several
related variables, thus multivariate control schemes are required. The most common
multivariate process-monitoring and control procedure is the Hotelling T2 control
chart for monitoring the mean vector of the process. The Hotelling T2 chart was
proposed by Hotelling H. (1947). There are two types of the Hotelling T2 chart : one
for sub-grouped data and the other for individual observations. Since the process
with individual observations occurs frequently in the chemical and process
industries, the Hotelling T2 method for individual observations will be introduced in
the following.
(2.1)
(2.2)
13
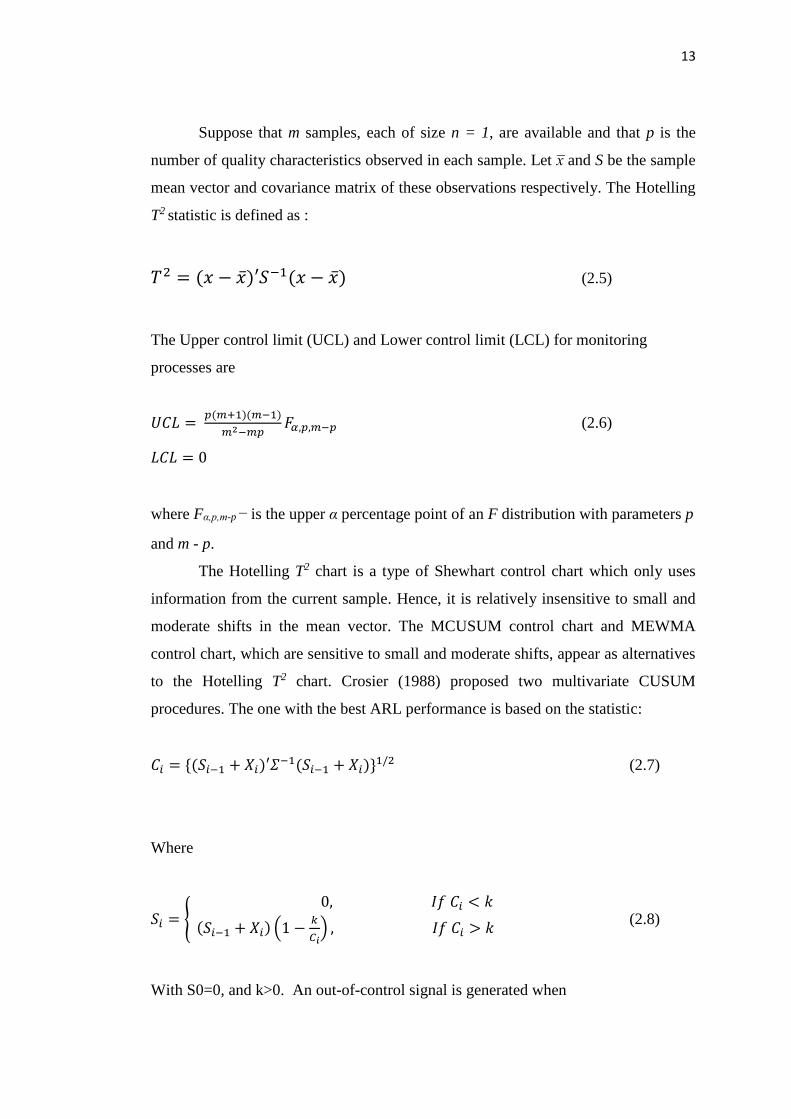
Suppose that m samples, each of size n = 1, are available and that p is the
number of quality characteristics observed in each sample. Let x̅ and S be the sample
mean vector and covariance matrix of these observations respectively. The Hotelling
T2 statistic is defined as :
𝑇2 = (𝑥 − �̅�)′𝑆−1(𝑥 − �̅�) (2.5)
The Upper control limit (UCL) and Lower control limit (LCL) for monitoring
processes are
𝑈𝐶𝐿 = 𝑝(𝑚+1)(𝑚−1)
𝑚2−𝑚𝑝𝐹𝛼,𝑝,𝑚−𝑝 (2.6)
𝐿𝐶𝐿 = 0
where Fα,p,m-p − is the upper α percentage point of an F distribution with parameters p
and m - p.
The Hotelling T2 chart is a type of Shewhart control chart which only uses
information from the current sample. Hence, it is relatively insensitive to small and
moderate shifts in the mean vector. The MCUSUM control chart and MEWMA
control chart, which are sensitive to small and moderate shifts, appear as alternatives
to the Hotelling T2 chart. Crosier (1988) proposed two multivariate CUSUM
procedures. The one with the best ARL performance is based on the statistic:
𝐶𝑖 = {(𝑆𝑖−1 + 𝑋𝑖)′𝛴−1(𝑆𝑖−1 + 𝑋𝑖)}1/2 (2.7)
Where
𝑆𝑖 = { 0, 𝐼𝑓 𝐶𝑖 < 𝑘
(𝑆𝑖−1 + 𝑋𝑖) (1 −𝑘
𝐶𝑖) , 𝐼𝑓 𝐶𝑖 > 𝑘
(2.8)
With S0=0, and k>0. An out-of-control signal is generated when
14
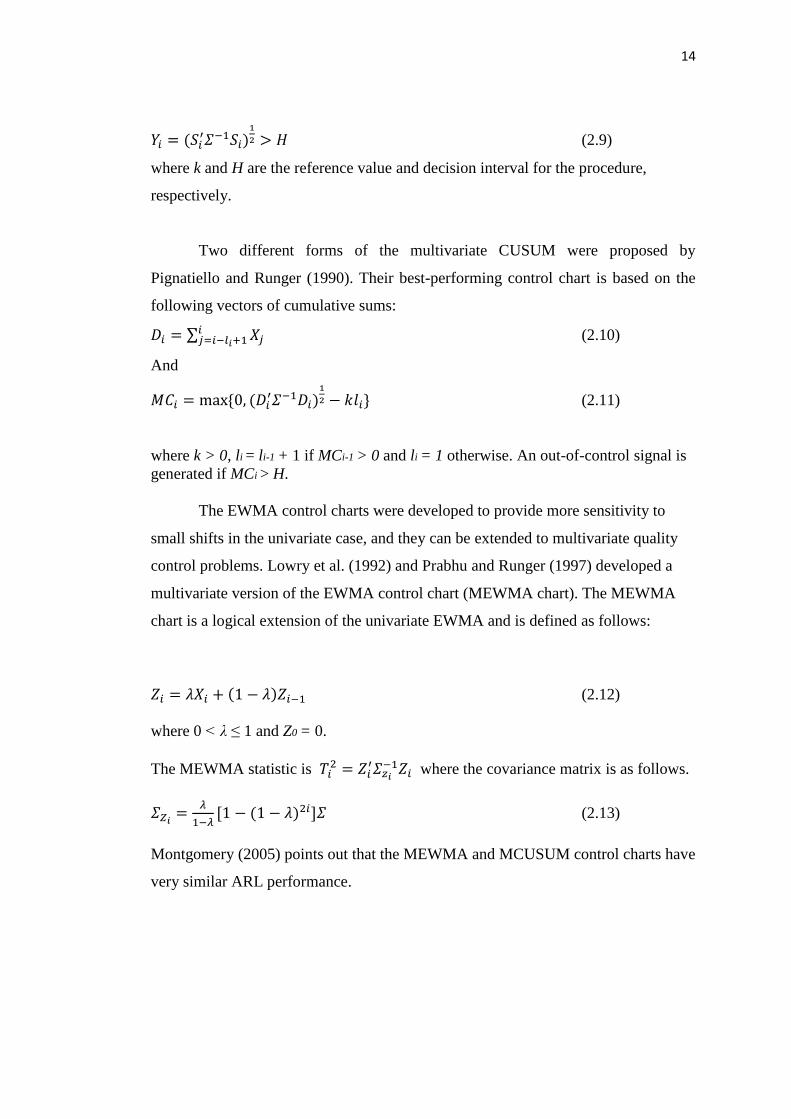
𝑌𝑖 = (𝑆𝑖′𝛴−1𝑆𝑖)
1
2 > 𝐻 (2.9)
where k and H are the reference value and decision interval for the procedure,
respectively.
Two different forms of the multivariate CUSUM were proposed by
Pignatiello and Runger (1990). Their best-performing control chart is based on the
following vectors of cumulative sums:
𝐷𝑖 = ∑ 𝑋𝑗𝑖𝑗=𝑖−𝑙𝑖+1 (2.10)
And
𝑀𝐶𝑖 = max {0, (𝐷𝑖′𝛴−1𝐷𝑖)
1
2 − 𝑘𝑙𝑖} (2.11)
where k > 0, li = li-1 + 1 if MCi-1 > 0 and li = 1 otherwise. An out-of-control signal is
generated if MCi > H.
The EWMA control charts were developed to provide more sensitivity to
small shifts in the univariate case, and they can be extended to multivariate quality
control problems. Lowry et al. (1992) and Prabhu and Runger (1997) developed a
multivariate version of the EWMA control chart (MEWMA chart). The MEWMA
chart is a logical extension of the univariate EWMA and is defined as follows:
𝑍𝑖 = 𝜆𝑋𝑖 + (1 − 𝜆)𝑍𝑖−1 (2.12)
where 0 < λ ≤ 1 and Z0 = 0.
The MEWMA statistic is 𝑇𝑖2 = 𝑍𝑖
′𝛴𝑧𝑖
−1𝑍𝑖 where the covariance matrix is as follows.
𝛴𝑍𝑖=
𝜆
1−𝜆[1 − (1 − 𝜆)2𝑖]𝛴 (2.13)
Montgomery (2005) points out that the MEWMA and MCUSUM control charts have
very similar ARL performance.
15
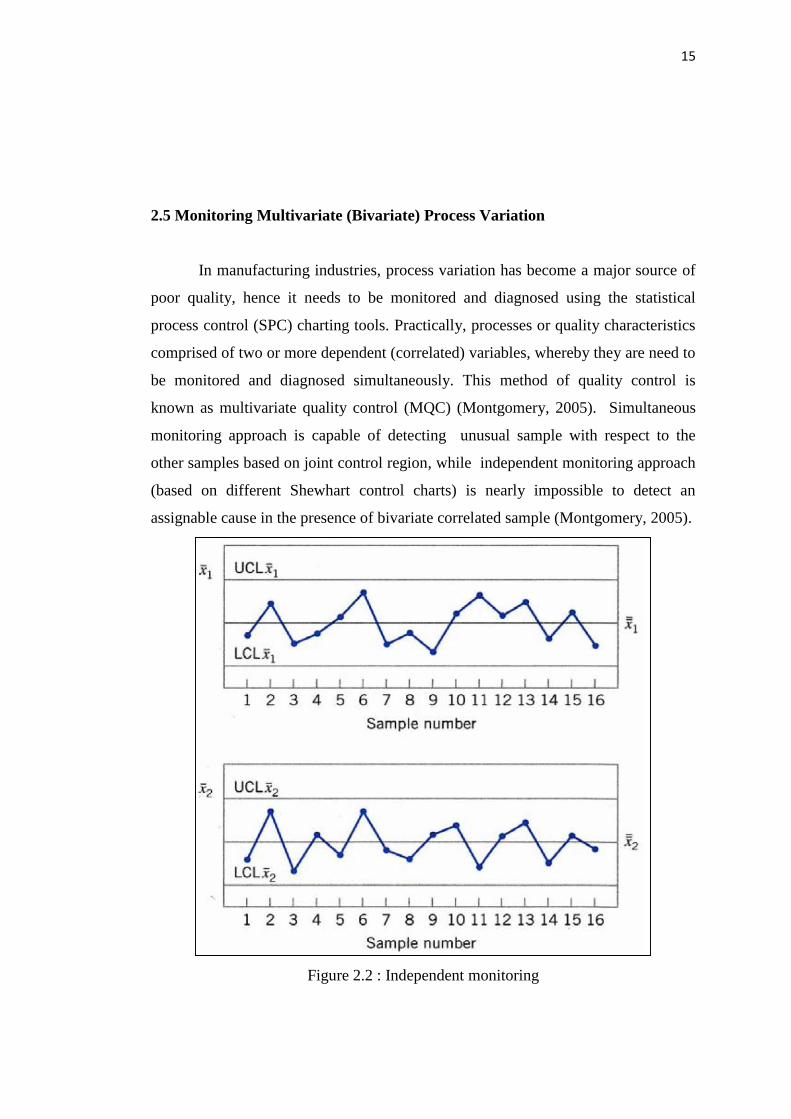
2.5 Monitoring Multivariate (Bivariate) Process Variation
In manufacturing industries, process variation has become a major source of
poor quality, hence it needs to be monitored and diagnosed using the statistical
process control (SPC) charting tools. Practically, processes or quality characteristics
comprised of two or more dependent (correlated) variables, whereby they are need to
be monitored and diagnosed simultaneously. This method of quality control is
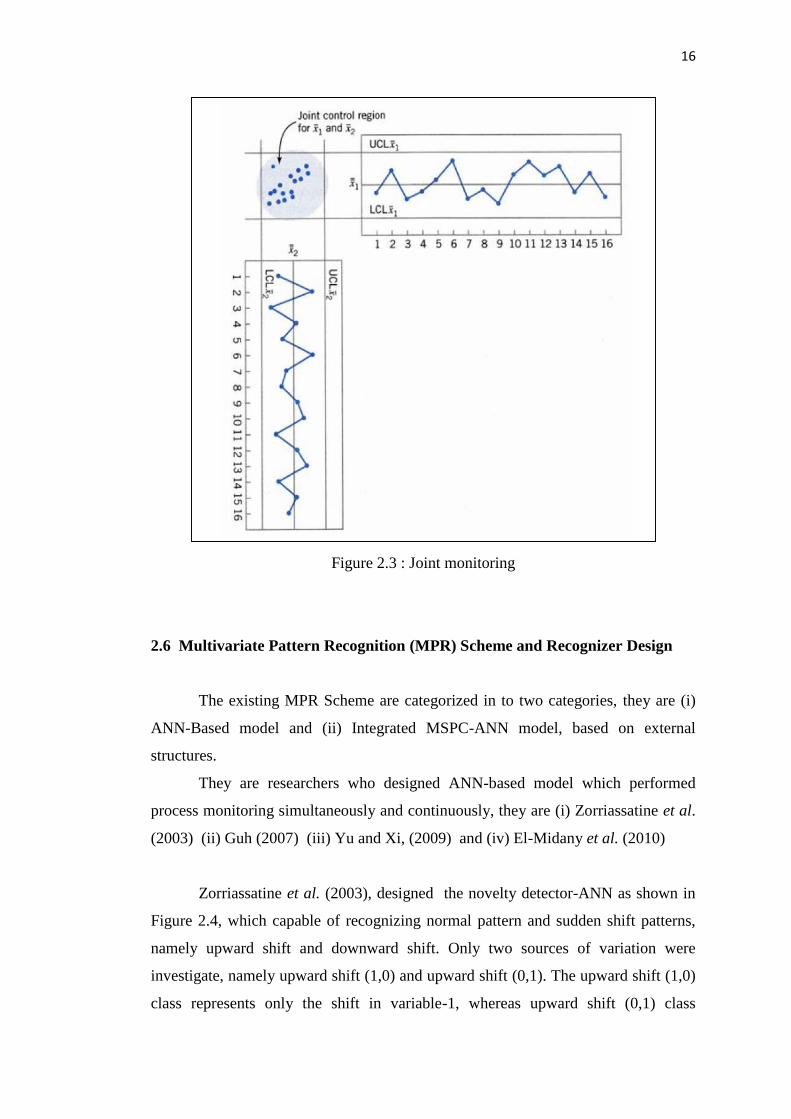
known as multivariate quality control (MQC) (Montgomery, 2005). Simultaneous
monitoring approach is capable of detecting unusual sample with respect to the
other samples based on joint control region, while independent monitoring approach
(based on different Shewhart control charts) is nearly impossible to detect an
assignable cause in the presence of bivariate correlated sample (Montgomery, 2005).
Figure 2.2 : Independent monitoring
16
Figure 2.3 : Joint monitoring
2.6 Multivariate Pattern Recognition (MPR) Scheme and Recognizer Design
The existing MPR Scheme are categorized in to two categories, they are (i)
ANN-Based model and (ii) Integrated MSPC-ANN model, based on external
structures.
They are researchers who designed ANN-based model which performed
process monitoring simultaneously and continuously, they are (i) Zorriassatine et al.
(2003) (ii) Guh (2007) (iii) Yu and Xi, (2009) and (iv) El-Midany et al. (2010)
Zorriassatine et al. (2003), designed the novelty detector-ANN as shown in
Figure 2.4, which capable of recognizing normal pattern and sudden shift patterns,
namely upward shift and downward shift. Only two sources of variation were
investigate, namely upward shift (1,0) and upward shift (0,1). The upward shift (1,0)
class represents only the shift in variable-1, whereas upward shift (0,1) class
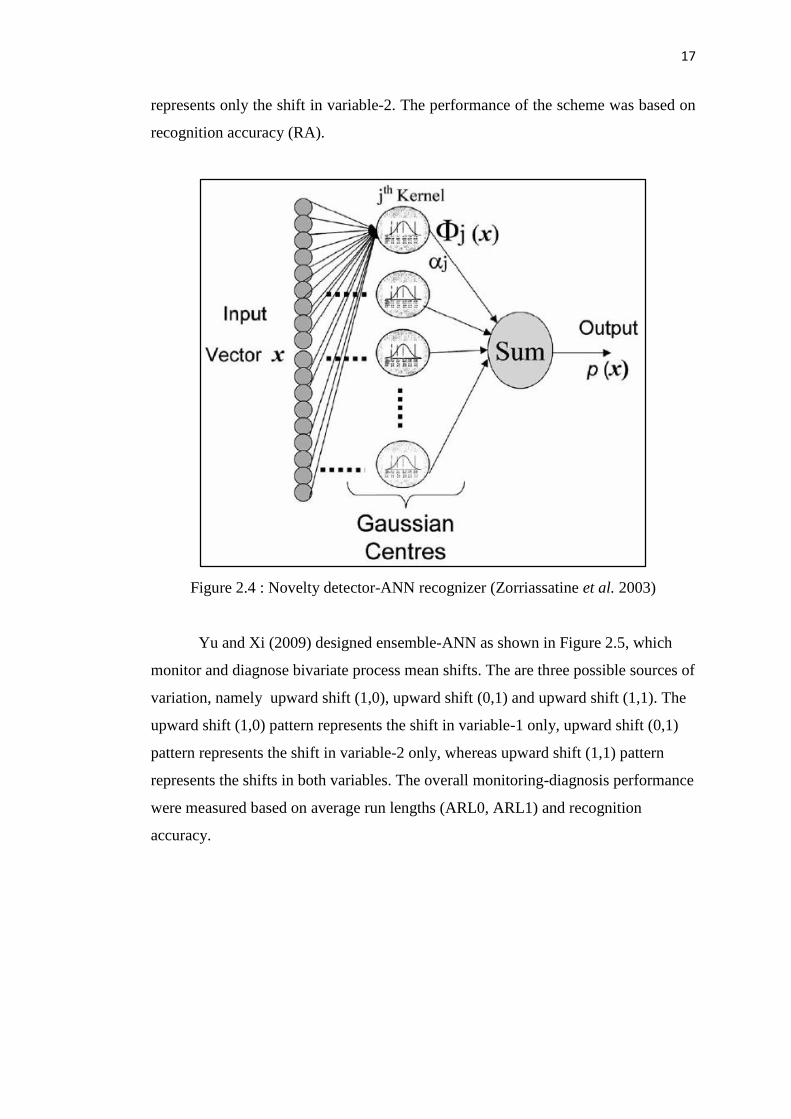
17
represents only the shift in variable-2. The performance of the scheme was based on
recognition accuracy (RA).
Figure 2.4 : Novelty detector-ANN recognizer (Zorriassatine et al. 2003)
Yu and Xi (2009) designed ensemble-ANN as shown in Figure 2.5, which
monitor and diagnose bivariate process mean shifts. The are three possible sources of
variation, namely upward shift (1,0), upward shift (0,1) and upward shift (1,1). The
upward shift (1,0) pattern represents the shift in variable-1 only, upward shift (0,1)
pattern represents the shift in variable-2 only, whereas upward shift (1,1) pattern
represents the shifts in both variables. The overall monitoring-diagnosis performance
were measured based on average run lengths (ARL0, ARL1) and recognition
accuracy.
18
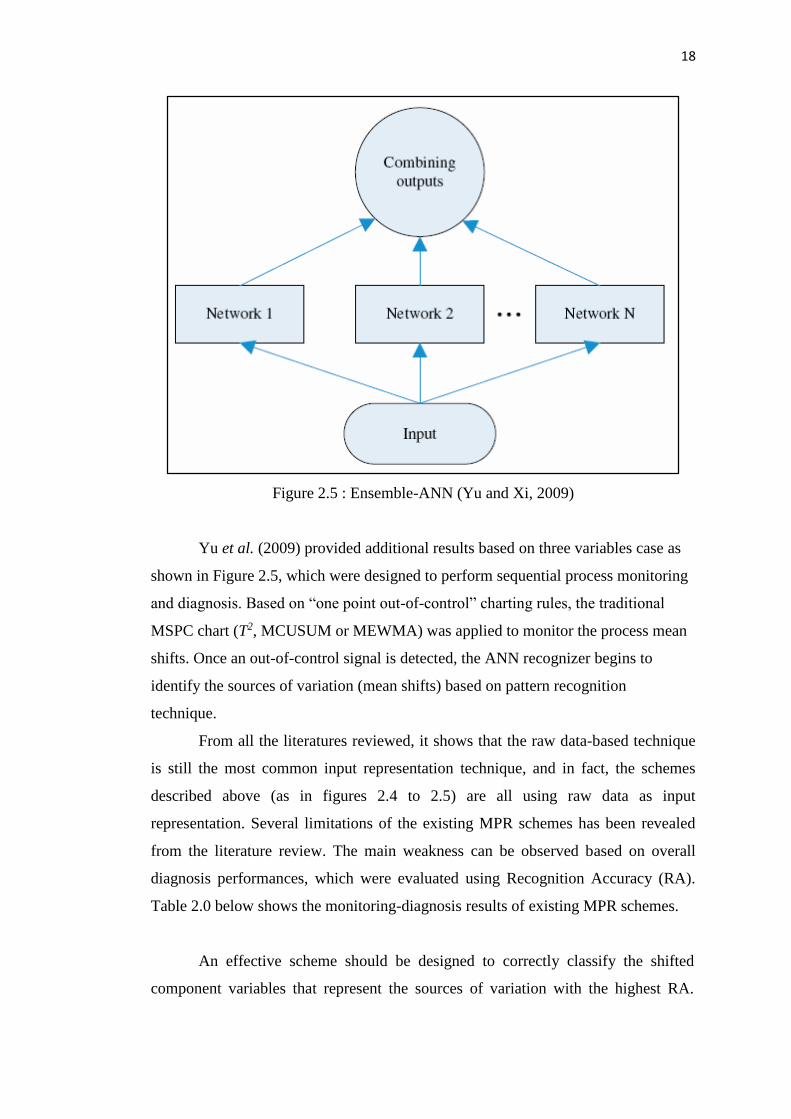
Figure 2.5 : Ensemble-ANN (Yu and Xi, 2009)
Yu et al. (2009) provided additional results based on three variables case as
shown in Figure 2.5, which were designed to perform sequential process monitoring
and diagnosis. Based on “one point out-of-control” charting rules, the traditional
MSPC chart (T2, MCUSUM or MEWMA) was applied to monitor the process mean
shifts. Once an out-of-control signal is detected, the ANN recognizer begins to
identify the sources of variation (mean shifts) based on pattern recognition
technique.
From all the literatures reviewed, it shows that the raw data-based technique
is still the most common input representation technique, and in fact, the schemes
described above (as in figures 2.4 to 2.5) are all using raw data as input
representation. Several limitations of the existing MPR schemes has been revealed
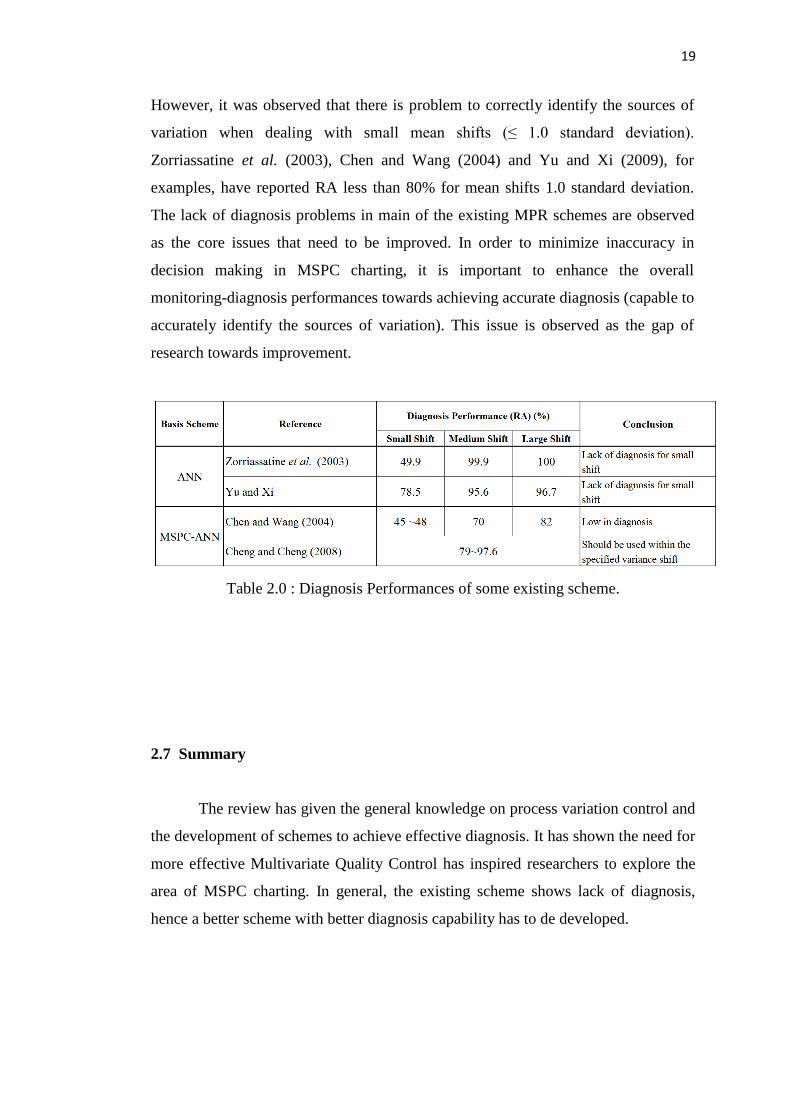
from the literature review. The main weakness can be observed based on overall
diagnosis performances, which were evaluated using Recognition Accuracy (RA).
Table 2.0 below shows the monitoring-diagnosis results of existing MPR schemes.
An effective scheme should be designed to correctly classify the shifted
component variables that represent the sources of variation with the highest RA.
19
However, it was observed that there is problem to correctly identify the sources of
variation when dealing with small mean shifts (≤ 1.0 standard deviation).
Zorriassatine et al. (2003), Chen and Wang (2004) and Yu and Xi (2009), for
examples, have reported RA less than 80% for mean shifts 1.0 standard deviation.
The lack of diagnosis problems in main of the existing MPR schemes are observed
as the core issues that need to be improved. In order to minimize inaccuracy in
decision making in MSPC charting, it is important to enhance the overall
monitoring-diagnosis performances towards achieving accurate diagnosis (capable to
accurately identify the sources of variation). This issue is observed as the gap of
research towards improvement.
Table 2.0 : Diagnosis Performances of some existing scheme.
2.7 Summary
The review has given the general knowledge on process variation control and
the development of schemes to achieve effective diagnosis. It has shown the need for
more effective Multivariate Quality Control has inspired researchers to explore the
area of MSPC charting. In general, the existing scheme shows lack of diagnosis,
hence a better scheme with better diagnosis capability has to de developed.
20
CHAPTER 3
RESEARCH METHODOLOGY
3.1 Introduction
The Literature Review section has focused on MSPC Charting schemes
developed for monitoring and diagnosis the bivariate/multivariate process variation,
which includes traditional charting MSPC such as T2, MCUSUM and MEWMA and
extended up to the discussion on the ANN-based pattern recognition (PR). The
existing ANN-Based PR schemes shows lack of diagnosis, or in another word they
lack the ability to identify correctly thesources of variation when dealing with small
mean shifts. The design strategy and research methodology in this research is
planned to realize the improvement of the current condition of existing ANN-Based
PR schemes.

21
3.2 Problem Situation
An effective scheme for diagnosis of bivariate process mean shifts should be
able identify the source of variation correctly. Any mistake or inaccuracy in
identifying the source of variations shall lead to wrong decision making and shall
increase the cost of quality due to reworks and waste produced. The existing scheme
have not achieved a desirable performance in diagnosis. The scheme which is
intended for such purpose is known as ANN-Based pattern recognition schemes.
Generally the main interest is on identifying the sources of variation. The existing
scheme is still lack of capability to identify the sources of variation when dealing
with small mean shifts, which is known as “lack of diagnosis”.
3.3 Solution Concept
To overcome the “lack of diagnosis” performance, it is necessary to develop a
scheme which capable to perform accurate diagnosis on the bivariate process mean
shifts.
3.4 Research Methodology
The research methodology has been designed to achieve the objectives of this
research as stated in Section 1.4 in Chapter 1.
Figure 3.0 : The Statistical Features-ANN scheme
22
The intended scheme is called Statistical Features-ANN scheme as in Figure
3.0. In the development of this scheme, attention shall be given on basic design for
accurate diagnosis operation, modelling of bivariate sampels and patterns, input
representation into an ANN recognizerm design and training of an ANN recognizer
and computation of diagnosis performance using Recognition Accuracy (RA). The
detail of the scheme shall be provided in Chapter 4. The development of the
Statistical Features-ANN also shall be focusing on internal design of the scheme, by
reducing dimensional input data using statistical features input representation. This
shall include the statistical features selection. Statistical features selection is crucial
in developing Statistical Features-ANN. The reason is because if too many statistical
features shall burden the ANN training process, while if too few statistical features
used shall result in insufficient representation. Therefore a minimal number of
statistical features used shall be investigated in this research.
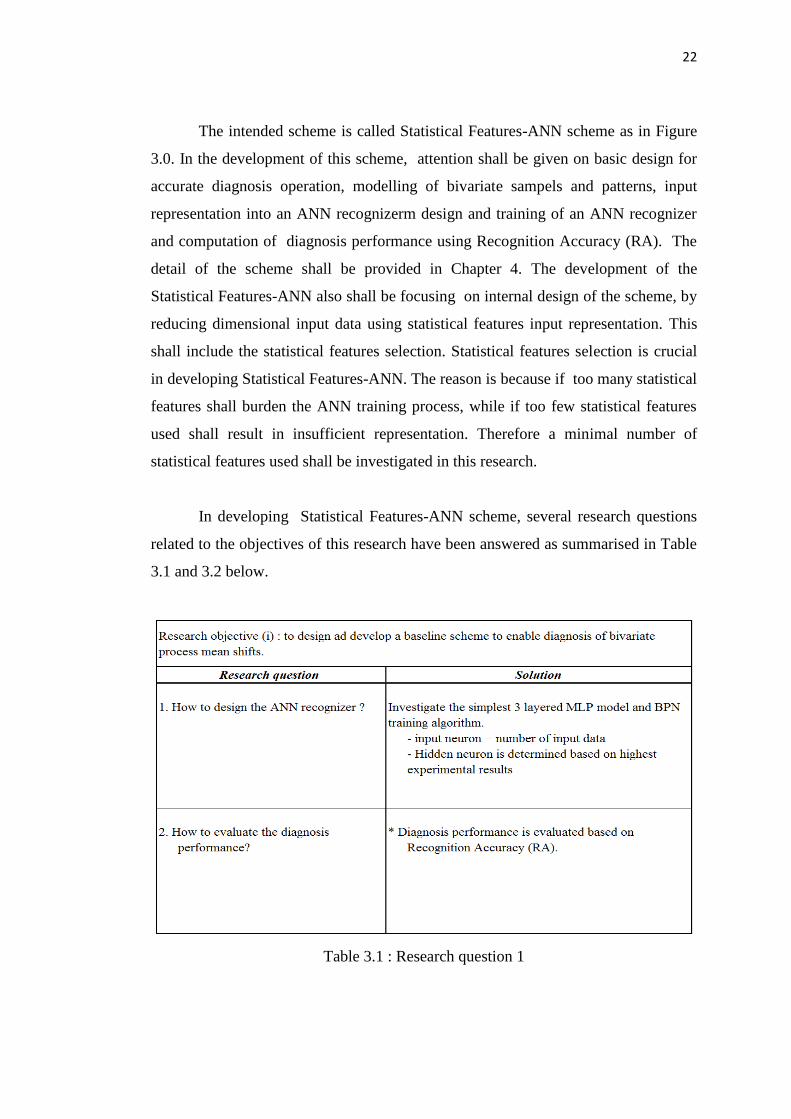
In developing Statistical Features-ANN scheme, several research questions
related to the objectives of this research have been answered as summarised in Table
3.1 and 3.2 below.
Table 3.1 : Research question 1
23
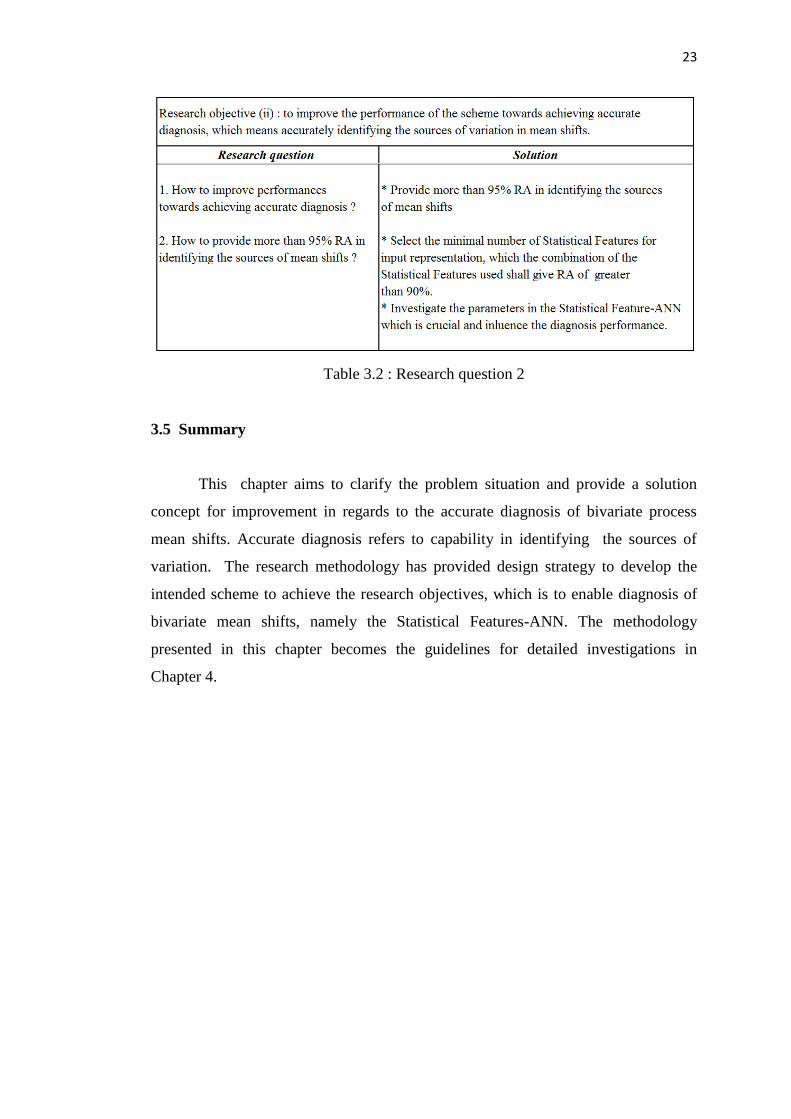
Table 3.2 : Research question 2
3.5 Summary
This chapter aims to clarify the problem situation and provide a solution
concept for improvement in regards to the accurate diagnosis of bivariate process
mean shifts. Accurate diagnosis refers to capability in identifying the sources of
variation. The research methodology has provided design strategy to develop the
intended scheme to achieve the research objectives, which is to enable diagnosis of
bivariate mean shifts, namely the Statistical Features-ANN. The methodology
presented in this chapter becomes the guidelines for detailed investigations in
Chapter 4.
24
CHAPTER 4
RESULT AND DISCUSSION
4.1 Introduction
In Chapter 2, it was clear that the existing scheme which use raw data as
input representation has poor performance of diagnosis the process mean shift. In
Chapter 3, the research methodology has outlined the research plan on the
development of Statistical Feature-ANN which is expected to have better diagnosis
capability than the existing scheme. In Chapter 4, the implementation of the research
methodology shall be reported.
Firstly, Chapter 4 shall cover the detail in development of the Statistical
Features-ANN scheme and this include the testing of the scheme. Secondly, Chapter
4 shall focus on the improvement on the Statistical Features-ANN through the
selection of minimal number of suitable statistical features which could result in the
high performance of diagnosis capability, which is evaluated using the value of
Recognition Accuracy (RA). The targeted value of Recognition Accuracy is greater
than 95%.
Chapter 4 shall be ended with discussions on the results and findings of the
research.
45
REFERENCES
Alt, F., “Multivariate Statistical Quality Control,” in The Encyclopedia of Statistical
Sciences, edited by Kotz, S., Johnson, N., and Read, C., (New York: John Wiley,
1985): 110-122.
Chakraborty, S., & Tah, D. (2006). Real time statistical process advisor for effective
quality control. Decision Support Systems, 42(2), 700–711.
Chen, L. H. and Wang, T. Y. (2004). “Artificial Neural Networks to Classify Mean
Shifts from Multivariate χ2 Chart Signals.” Computers and Industrial Engineering.
Vol. 47. pp. 195 − 205.
Cheng, C. S. (1997). “A Neural Network Approach for the Analysis of Control Chart
Patterns.” International Journal of Production Research. Vol. 35 No. 3. pp. 667 −
697.
Cheng, C. S. and Cheng, H. P. (2008). “Identifying the Source of Variance Shifts in
the Multivariate Process Using Neural Networks and Support Vector Machines.”
Expert Systems with Applications. Vol. 35 pp. 198 − 206.
Chih, W. H. and Rollier, D. A. (1994). “Diagnosis Characteristics for Bivariate
Pattern Recognition Scheme in SPC.” International Journal of Quality and Reliability
Management. Vol. 11 No. 1. pp. 53 − 66.
Chih, W. H. and Rollier, D. A. (1995). “A Methodology of Pattern Recognition
Schemes for Two Variables in SPC.” International Journal of Quality and Reliability
Management. Vol. 12 No. 3. pp. 86 − 107.
Crosier, R. B. (1988). “Multivariate Generalizations of Cumulative Sum Quality
Control Schemes.” Technometrics. Vol. 30. No. 3. pp. 291 − 303.
46
El-Midany, T. T., El-Baz, M. A. and Abd-Elwahed, M. S. (2010). “A Proposed
Framework for Control Chart Pattern Recognition in Multivariate Process Using
Artificial Neural Networks.” Expert Systems with Applications. Vol. 37. pp. 1035 −
1042.
Gauri, S. K., & Chakraborty, S. (2006). Feature-based recognition of control chart
patterns. Computers and Industrial Engineering, 51(4), 726–742.
Gauri, S. K., & Chakraborty, S. (2008). Improved recognition of control chart
patterns using artificial neural networks. International Journal of Advanced
Manufacturing Technology, 36(11–12), 1191–1201.
Guh, R. S. (2007). “On-Line Identification and Quantification of Mean Shifts in
Bivariate Processes Using a Neural Network-Based Approach.” Quality and
Reliability Engineering International. Vol. 23. pp. 367 − 385.
Guh, R. S. and Shiue, Y. R. (2005). “On-line Identification of Control Chart Patterns
Using Self-Organizing Approaches.” International Journal of Production Research.
Vol. 43 No. 6. pp. 1225 − 1254.
Hassan, A. (2002). “On-Line Recognition of Developing Control Chart Patterns.”
Universiti Teknologi Malaysia: Ph.D. Thesis.
Hassan, A., Nabi Baksh, M. S., Shaharoun, A. M. and Jamaluddin, H. (2006),
“Feature Selection for SPC Chart Pattern Recognition Using Fractional Factorial
Experimental Design,” 2nd I*IPROMS Virtual International Conference on
Intelligent Production Machines and Systems.
Haykin S (1999) “Neural Networks : A comprehensive foundation” (2nd Edition)
Upper Saddle Rever, New Jersey : Prentice Hall.
Hotelling, H. (1947). “Multivariate Quality Control. Techniques of Statistical
Analysis” New York: McGraw-Hill.
Jackson, J. E. (1991). “A User Guide to Principle Components.” New York: John
Wiley.
Kano, M., Nagao K., Hasebe, S., Hashimoto, I., Ohno, H., Strauss, R. and Bakshi, B.
R. (2002). “Comparison of Multivariate Statistical Process Monitoring Methods with
47
Applications to the Eastman Challenge Problem.” Computers and Chemical
Engineering. Vol. 26. pp. 161 − 174.
Lehmann, R.S. (1977) “Computer Simulation and modelling: An introduction”
London : Lawrence Erlbaum
Lowry, C. A., Woodall, W. H., Champ, C. W. and Rigdon, S. E. (1992). “A
Multivariate Exponentially Weighted Moving Average Control Chart.”
Technometrics. Vol. 34. No 1. pp. 46 − 53.
Masood, I., and Hassan, A., (2010), “Issues in Development of Artificial Neural
Network Based Control Chart Pattern Recognition Schemes”, European Journal of
Scientific Research, Vol. 39, No. 3, pp 336-355
Montgomery, D. C. (2005). “Introduction to Statistical Quality Control.” 4th. ed.
USA: John Wiley & Sons, Inc.
Niaki, S. T. A. and Abbasi, B. (2005). “Fault Diagnosis in Multivariate Control
Charts Using Artificial Neural Networks.” Quality and Reliability Engineering
International. Vol. 21. pp. 825 − 840.
Pham, D. T., & Wani, M. A. (1997). Feature-based control chart pattern
recognition.International Journal of Production Research, 35(7), 1875–1890.
Pignatiello, J. J. and Runger, G. C. (1990). “Comparison of Multivariate CUSUM
Charts.” Journal of Quality Technology. Vol. 22. No. 3 pp. 173 − 186.
Prabhu, S. S. and Runger, G. C. (1997). “Designing a Multivariate EWMA Control
Chart.” Journal of Quality Technology. Vol. 29 No. 1. pp. 8 − 15.
Sepulveda, A. and Nachlas, J. A. (1997). “A Simulation Approach to Multivariate
Quality Control.” Computers and Industrial Engineering. Vol. 33 No. 1 − 2. pp. 113
− 116.
Shewhart, W.A (1931) “Economic control of quality of manufactured product”.
USA: D Van Nostrand Company, Inc.
Summers, D.C.S (2006) “Quality”, 4th edition, USA: Prentice Hall
48
Wang, T. Y. and Chen, L. H. (2001). “Mean Shifts Detection and Classification in
Multivariate Process: A Neural-Fuzzy Approach.” Journal of Intelligence
Manufacturing. Vol. 13. pp. 211 − 221.
Yu, J. B. and Xi, L. F. (2009). “A Neural Network Ensemble-Based Model for On-
Line Monitoring and Diagnosis of Out-of-Control Signals in Multivariate
Manufacturing Processes.” Expert Systems with Applications. Vol. 36. pp. 909 −
921.
Yu, J. B., Xi, L. F. and Zhou, X. J. (2009). “Identifying Source(s) of Out-of-Control
Signals in Multivariate Manufacturing Processes Using Selective Neural Network
Ensemble.” Engineering Applications of Artificial Intelligence. Vol. 22. pp. 141 −
152.
Zorriassatine, F., Tannock, J. D. T. and O’Brien, C (2003). “Using Novelty Detection
to Identify Abnormalities Caused by Mean Shifts in Bivariate Processes.” Computers
and Industrial Engineering. Vol. 44. pp. 385 − 408.