ytl hospitality reitytlhospitalityreit.com/reports/ytlreitar2014.pdf · ytl hospitality reit 002...
TRANSCRIPT
YT
L HO
SPITA
LITY
REIT
ann
ual repo
rt 20
14
managed byPINTAR PROJEK SDN BHD 314009-W
11th FloorYeoh Tiong Lay Plaza55 Jalan Bukit Bintang55100 Kuala LumpurMalaysia
Tel • 603 2117 0088 603 2142 6633Fax • 603 2141 2703
www.ytlhospitalityreit.com
annual report 2014
the journey continues...
ContentsCorporateReview
FinancialStatements
002 Financial Highlights
004 Fund Performance
006 Chief Executive Officer’s Statement
012 Property Portfolio
038 Review of the Property Market
041 Notice of Annual General Meeting
042 Corporate Information
043 Profile of the Board of Directors
046 Statement on Corporate Governance
050 Analysis of Unitholdings
051 Statement of Interests of Directors of the Manager
053 Manager’s Report
065 Statement by Manager
065 Statutory Declaration
066 Trustee’s Report
067 Independent Auditors’ Report
069 Statements of Profit or Loss
072 Statements of Other Comprehensive Income
073 Statements of Financial Position
075 Statements of Changes in Net Asset Value
077 Statements of Cash Flows
079 Notes to the Financial Statements
130 Supplementary Information on the Disclosure of Realised and Unrealised Profits or Losses
• Form of Proxy
managed by
PINTAR PROJEK SDN BHD(314009-W)

YTL Hospitality REIT
002
2014 2013 2012 2011 2010
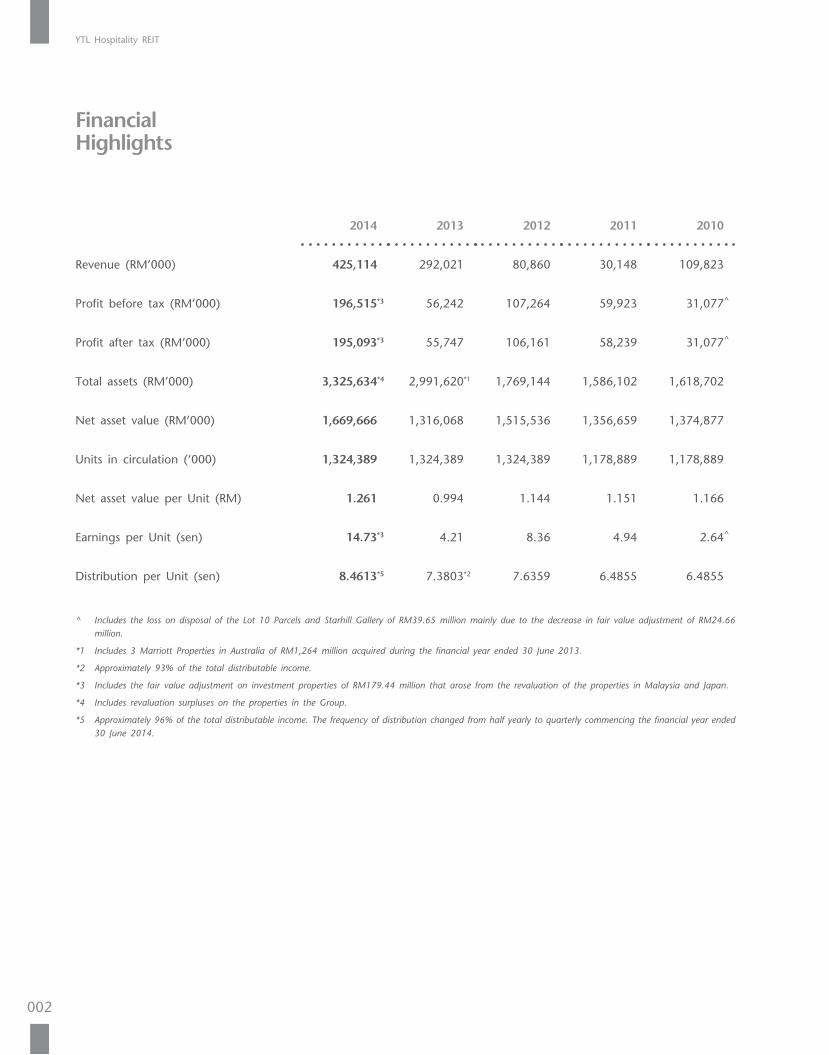
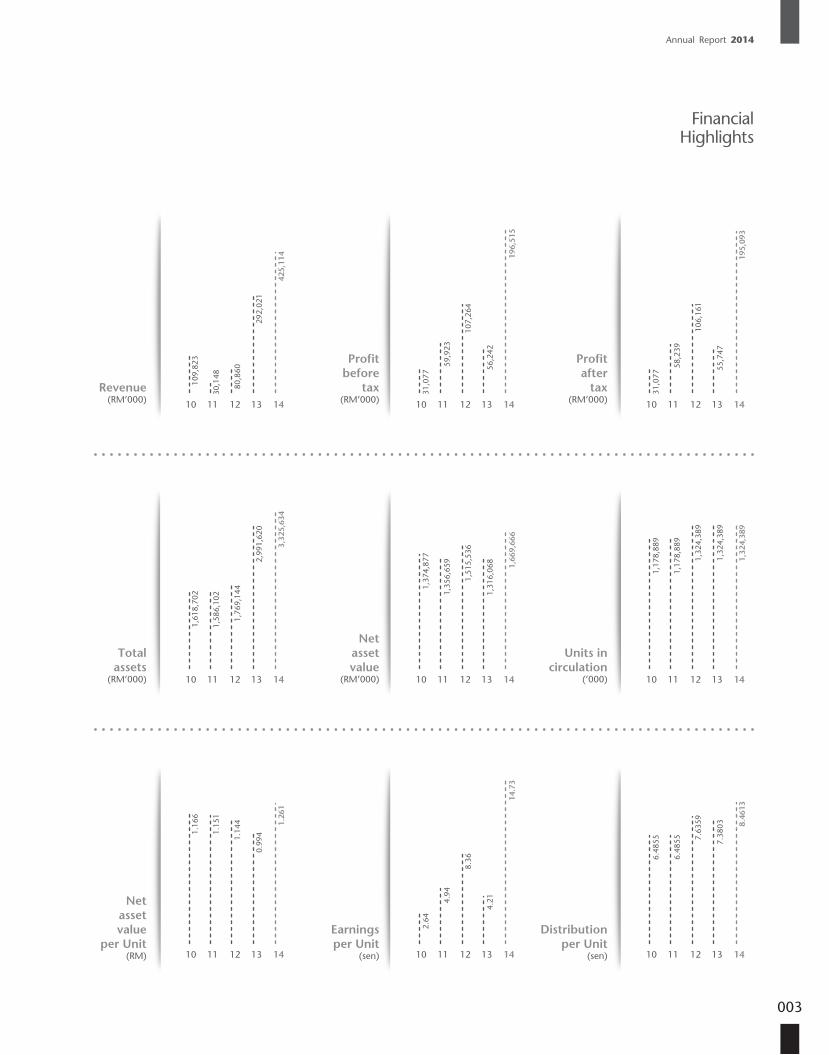
Revenue (RM’000) 425,114 292,021 80,860 30,148 109,823
Profit before tax (RM’000) 196,515*3 56,242 107,264 59,923 31,077^
Profit after tax (RM’000) 195,093*3 55,747 106,161 58,239 31,077^
Total assets (RM’000) 3,325,634*4 2,991,620*1 1,769,144 1,586,102 1,618,702
Net asset value (RM’000) 1,669,666 1,316,068 1,515,536 1,356,659 1,374,877
Units in circulation (‘000) 1,324,389 1,324,389 1,324,389 1,178,889 1,178,889
Net asset value per Unit (RM) 1.261 0.994 1.144 1.151 1.166
Earnings per Unit (sen) 14.73*3 4.21 8.36 4.94 2.64^
Distribution per Unit (sen) 8.4613*5 7.3803*2 7.6359 6.4855 6.4855
^ Includes the loss on disposal of the Lot 10 Parcels and Starhill Gallery of RM39.65 million mainly due to the decrease in fair value adjustment of RM24.66 million.
*1 Includes 3 Marriott Properties in Australia of RM1,264 million acquired during the financial year ended 30 June 2013.
*2 Approximately 93% of the total distributable income.
*3 Includes the fair value adjustment on investment properties of RM179.44 million that arose from the revaluation of the properties in Malaysia and Japan.
*4 Includes revaluation surpluses on the properties in the Group.
*5 Approximately 96% of the total distributable income. The frequency of distribution changed from half yearly to quarterly commencing the financial year ended 30 June 2014.
Financial Highlights
Annual Report 2014
003
FinancialHighlights
1413121110
109,
823
292,
021
30,1
48
80,8
60
425,
114
31,0
77
56,2
42
59,9
23
107,
264
196,
515
31,0
77
55,7
47
58,2
39
106,
161
195,
093
1,61
8,70
2
2,99
1,62
0
1,58
6,10
2
1,76
9,14
4
3,32
5,63
4
1,37
4,87
7
1,31
6,06
8
1,35
6,65
9
1,51
5,53
6
1,66
9,66
6
1,17
8,88
9
1,32
4,38
9
1,17
8,88
9
1,32
4,38
9
1,32
4,38
9
1.16
6
0.99
41.15
1
1.14
4 1.26
1
2.64
4.214.
94
8.36
14.7
3
6.48
55 7.38
03
6.48
55 7.63
59 8.46
13
1413121110 1413121110
1413121110 1413121110 1413121110
1413121110 1413121110 1413121110
Revenue(RM’000)
Profitbefore
tax(RM’000)
Profitafter
tax(RM’000)
Totalassets
(RM’000)
Netassetvalue
(RM’000)
Units incirculation
(’000)
Netassetvalue
per Unit(RM)
Earningsper Unit
(sen)
Distributionper Unit
(sen)
YTL Hospitality REIT
004
Fund Performance
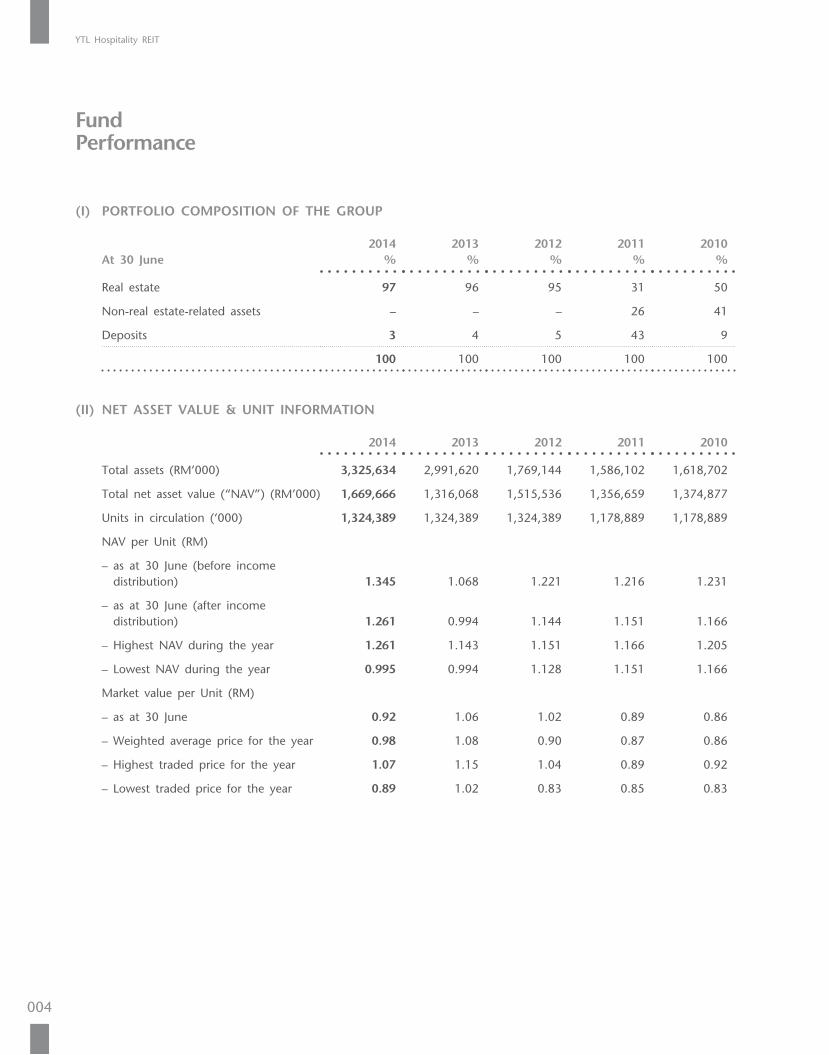
(I) PORTFOLIO COMPOSITION OF THE GROUP
At 30 June2014
%2013
%2012
%2011
%2010
%
Real estate 97 96 95 31 50
Non-real estate-related assets – – – 26 41
Deposits 3 4 5 43 9
100 100 100 100 100
(II) NET ASSET VALUE & UNIT INFORMATION
2014 2013 2012 2011 2010
Total assets (RM’000) 3,325,634 2,991,620 1,769,144 1,586,102 1,618,702
Total net asset value (“NAV”) (RM’000) 1,669,666 1,316,068 1,515,536 1,356,659 1,374,877
Units in circulation (‘000) 1,324,389 1,324,389 1,324,389 1,178,889 1,178,889
NAV per Unit (RM)
– as at 30 June (before income distribution) 1.345 1.068 1.221 1.216 1.231
– as at 30 June (after income distribution) 1.261 0.994 1.144 1.151 1.166
– Highest NAV during the year 1.261 1.143 1.151 1.166 1.205
– Lowest NAV during the year 0.995 0.994 1.128 1.151 1.166
Market value per Unit (RM)
– as at 30 June 0.92 1.06 1.02 0.89 0.86
– Weighted average price for the year 0.98 1.08 0.90 0.87 0.86
– Highest traded price for the year 1.07 1.15 1.04 0.89 0.92
– Lowest traded price for the year 0.89 1.02 0.83 0.85 0.83
Annual Report 2014
005
Fund Performance
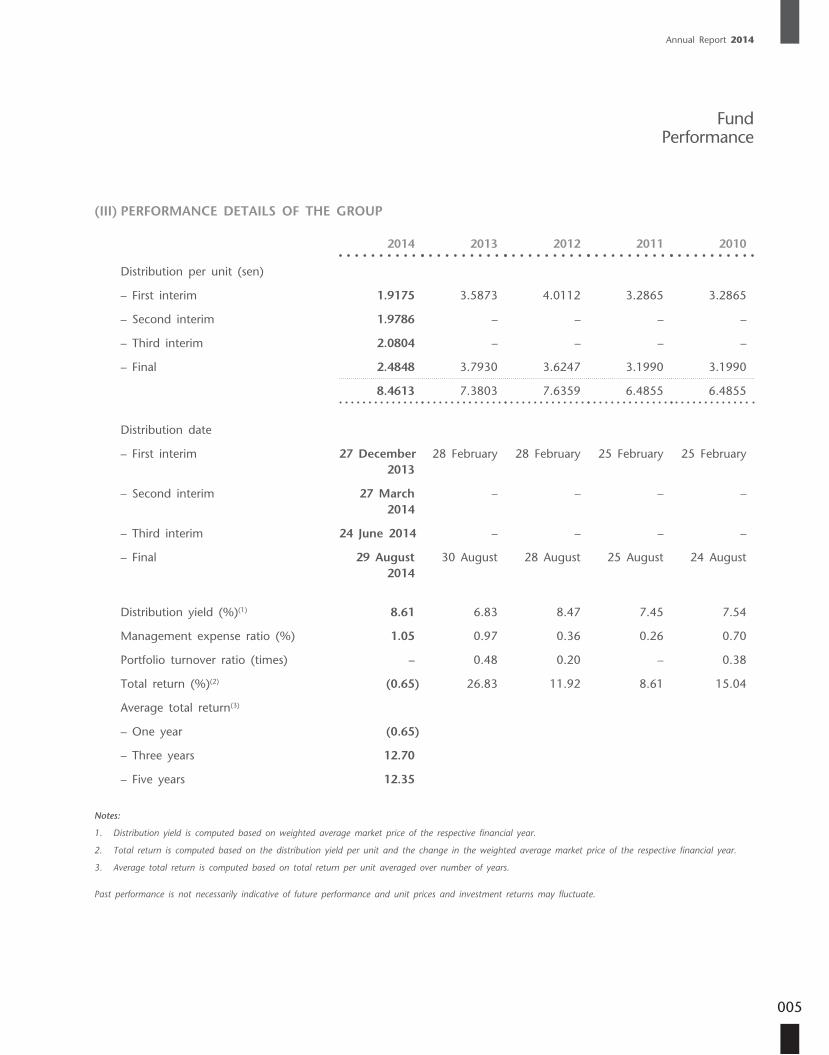
(III) PERFORMANCE DETAILS OF THE GROUP
2014 2013 2012 2011 2010
Distribution per unit (sen)
– First interim 1.9175 3.5873 4.0112 3.2865 3.2865
– Second interim 1.9786 – – – –
– Third interim 2.0804 – – – –
– Final 2.4848 3.7930 3.6247 3.1990 3.1990
8.4613 7.3803 7.6359 6.4855 6.4855
Distribution date
– First interim 27 December2013
28 February 28 February 25 February 25 February
– Second interim 27 March2014
– – – –
– Third interim 24 June 2014 – – – –
– Final 29 August2014
30 August 28 August 25 August 24 August
Distribution yield (%)(1) 8.61 6.83 8.47 7.45 7.54
Management expense ratio (%) 1.05 0.97 0.36 0.26 0.70
Portfolio turnover ratio (times) – 0.48 0.20 – 0.38
Total return (%)(2) (0.65) 26.83 11.92 8.61 15.04
Average total return(3)
– One year (0.65)
– Three years 12.70
– Five years 12.35
Notes:
1. Distribution yield is computed based on weighted average market price of the respective financial year.
2. Total return is computed based on the distribution yield per unit and the change in the weighted average market price of the respective financial year.
3. Average total return is computed based on total return per unit averaged over number of years.
Past performance is not necessarily indicative of future performance and unit prices and investment returns may fluctuate.
YTL Hospitality REIT
006
On behalf of the Board of Directors of Pintar Projek Sdn Bhd (“Pintar Projek” or the “Manager”), I have the pleasure of presenting to you the Annual Report and audited financial statements of YTL Hospitality REIT (“YTL REIT” or the “Trust”) and its subsidiaries (the “Group”) for the financial year ended 30 June 2014.
TAN SRI DATO’ (DR) FRANCIS YEOH SOCK PINGPSM, CBE, FICE, SIMP, DPMS, DPMP, JMN, JP
Chief Executive Officer
Chief Executive Officer’s Statement
Annual Report 2014
007
Following the completion of its transformation, YTL REIT now benefits fully from the strategic revenue structure of its properties and sees stable, medium to long term lease income from its Malaysian and Japanese portfolio and variable income from its Austral ian assets. This structure enables the Trust to insulate part of the portfolio from the cyclical nature of the hospitality industry, balanced with any potential upside generated from better performance in other parts of the portfolio.
FINANCIAL PERFORMANCE
For the financial year ended 30 June 2014, the Group recorded RM425.114 million and RM202.867 million of revenue and net property income, respectively representing an increase of 46% and 29% compared to RM292.021 million and RM156.975 million of revenue and net property income, respectively recorded in the preceding f inancial year ended 30 June 2013.
OVERVIEW
The Trust regis tered a s t rong performance for the financial year ended 30 June 2014, due mainly to the consolidation of results from the Sydney Harbour, Melbourne and Brisbane Marriott hotels in Australia for the full financial year, compared to 7 months last year. YTL REIT completed the acquisition of these 3 prime properties in November 2012, extending its geographic diversity to cover Malaysia, Japan and Australia. The total valuation of the Trust’s property portfolio now stands at RM3.15 billion.
On 11 December 2013, the Trust officially changed its name from Starhill Real Estate Investment Trust to YTL Hospitality REIT, marking the final step of its transformation into a pure-play hospitality REIT focused on a single class of hotel and hospitality-related assets.
The increase in revenue and net property income for the financial year ended 30 June 2014 was attributed mainly to the recognition of revenue generated by the Sydney Harbour, Brisbane and Melbourne Marriott hotels in Australia for a full financial year s ince the acquis i t ion on 29 November 2012.
The Group’s prof i t before tax increased by 249% from RM56.242 million recorded in the preceding financial year ended 30 June 2013 to RM196.515 million in the current financial year ended 30 June 2014, mainly due to the gain on fair value of investment properties during the current financial year ended 30 June 2014.
Meanwhile, the Group’s income available for distribution for the current financial year ended 30 June 2014 improved by 11% f rom RM105.183 million to RM117.142 million mainly due to the full financial year profit contribution from the three Marriott properties in Australia.
Chief Executive Officer’s Statement
YTL Hospitality REIT
008
CORPORATE DEVELOPMENTS
As reported last year, on 14 June 2013, the Manager announced a proposed placement of new units in YTL REIT to raise gross proceeds of up to RM800 million, a proposed increase in YTL REIT’s existing approved fund size from 1.324 billion units to a maximum of 2.125 billion units and a proposed increase in the Trust’s borrowing limit to 60% of its total asset value (collectively referred to as the “Proposals”). On 30 December 2013, Securities Commission Malaysia (“SC”) granted its approval for the listing of and quotation for the placement units on the Main Market of Bursa Malaysia Securities Berhad (“Bursa Securities”) and the proposed increase in fund size.
On 10 January 2014, Bursa Securities subsequently approved the listing of and quotation for up to 800.61 million placement units to be issued pursuant to the proposed placement. The Trust received approval for the P r o p o s a l s a n d t h e p r o p o s e d subscription of new units of up to RM310 million by YTL Corporation Berhad, an existing major unitholder of the Trust, at the meeting of unitholders held on 11 February
2014. The Trust received approval for a 6-month extension of time until 29 December 2014 to complete the proposed placement and proposed increase in fund size from the SC on 23 May 2014 and from Bursa Securities on 12 June 2014, and these corporate exercises are currently pending implementation.
PORTFOLIO REVIEW
Malaysian Portfolio
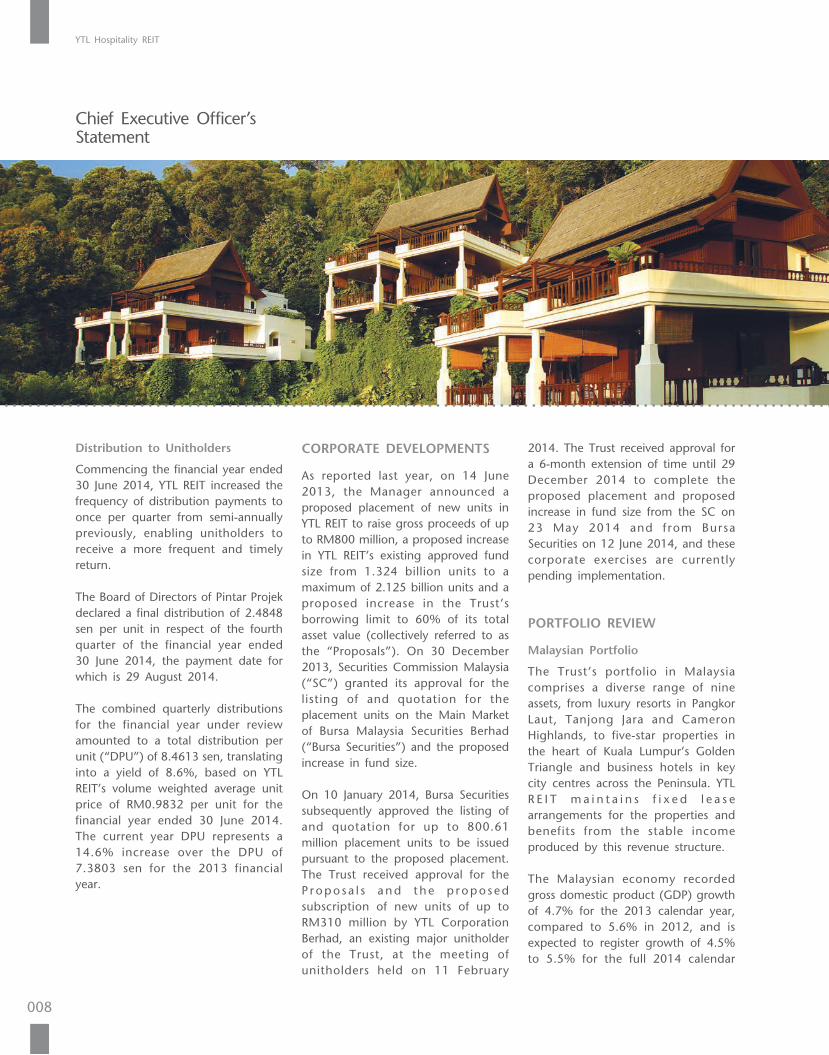
The Trust’s portfolio in Malaysia comprises a diverse range of nine assets, from luxury resorts in Pangkor Laut, Tanjong Jara and Cameron Highlands, to five-star properties in the heart of Kuala Lumpur’s Golden Triangle and business hotels in key city centres across the Peninsula. YTL R E I T m a i n t a i n s f i x e d l e a s e arrangements for the properties and benefits from the stable income produced by this revenue structure.
The Malaysian economy recorded gross domestic product (GDP) growth of 4.7% for the 2013 calendar year, compared to 5.6% in 2012, and is expected to register growth of 4.5% to 5.5% for the full 2014 calendar
Distribution to Unitholders
Commencing the financial year ended 30 June 2014, YTL REIT increased the frequency of distribution payments to once per quarter from semi-annually previously, enabling unitholders to receive a more frequent and timely return.
The Board of Directors of Pintar Projek declared a final distribution of 2.4848 sen per unit in respect of the fourth quarter of the financial year ended 30 June 2014, the payment date for which is 29 August 2014.
The combined quarterly distributions for the financial year under review amounted to a total distribution per unit (“DPU”) of 8.4613 sen, translating into a yield of 8.6%, based on YTL REIT’s volume weighted average unit price of RM0.9832 per unit for the financial year ended 30 June 2014. The current year DPU represents a 14.6% increase over the DPU of 7.3803 sen for the 2013 financial year.
Chief Executive Officer’s Statement
Annual Report 2014
009
year. Despite the weaker external environment in the first half of the year, domestic demand remained resilient, led by robust private sector activity. Meanwhile, the domestic tourism industry achieved a 2.8% growth in tourist arrivals to 25.7 million for the 2013 calendar year. Visit Malaysia Year 2014 was launched in January this year, with a target of attracting 28 million tourists for the full year, and has seen an increase in tourist arrivals of approximately 10% the first quarter of 2014 over the same period last year as programmes under this initiative get underway.
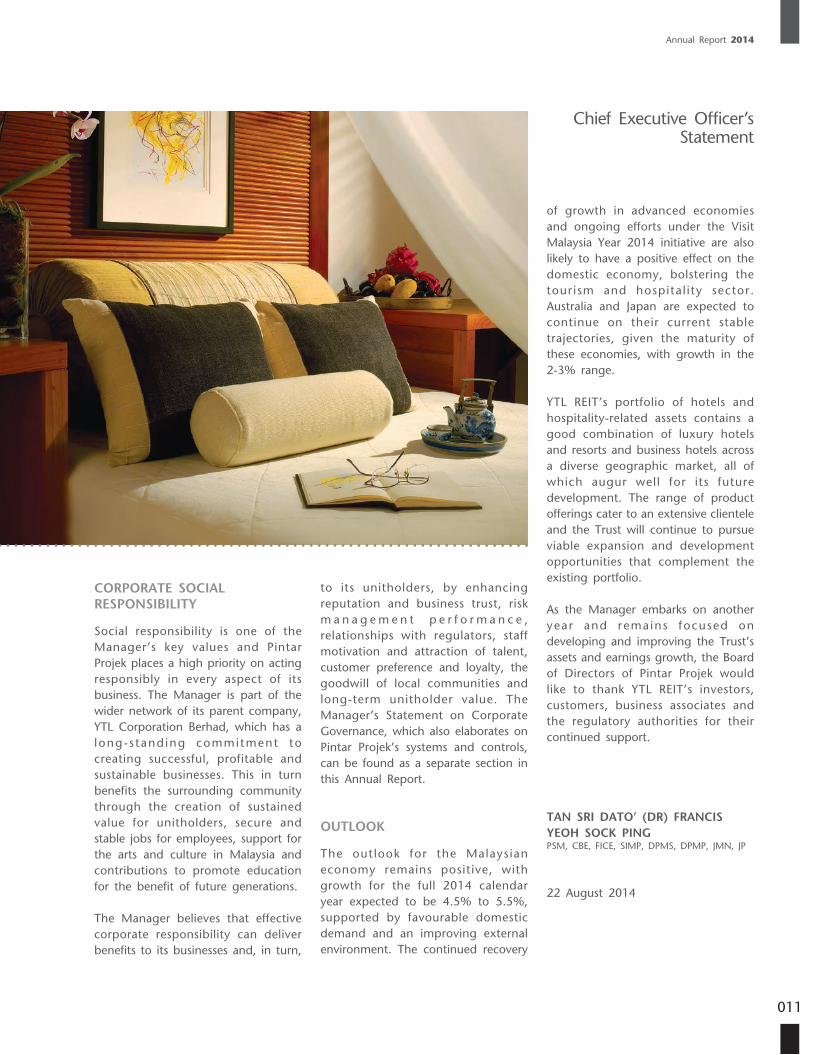
During the financial year under review, YTL REIT continued to see good results from the JW Marriott Hotel Kuala Lumpur, The Ritz-Carlton, Kuala Lumpur, and The Residences at The Ritz-Carlton, Kuala Lumpur. These three luxury properties are situated in the Golden Triangle which forms Kuala Lumpur’s premier commercial precinct and operate in close proximity to high-end retail destinations, such as Starhill Gallery, the Feast Village fine dining pavilion, the Carlton Conference Centre and Spa Village Kuala Lumpur, to ensure guests have access to a comprehensive collection of luxury amenities and services.
Similar high quality offerings can also be experienced across the Trust’s luxury resorts, comprising Pangkor Laut Resort on the west coast of the Peninsular, Tanjong Jara Resort on the east coast and Cameron Highlands Resort. These properties continue to draw affluent customers from Europe, the Americas and the Asia-Pacific rim.
Meanwhile, the Vistana chain of business hotels underwent a major re furb i shment and rebranding undertaken by its lessees during the year under review, successful ly upgrading the customer experience at these hotels which operate in Malaysia’s key business city centres in Kuala Lumpur, Kuantan and Penang.
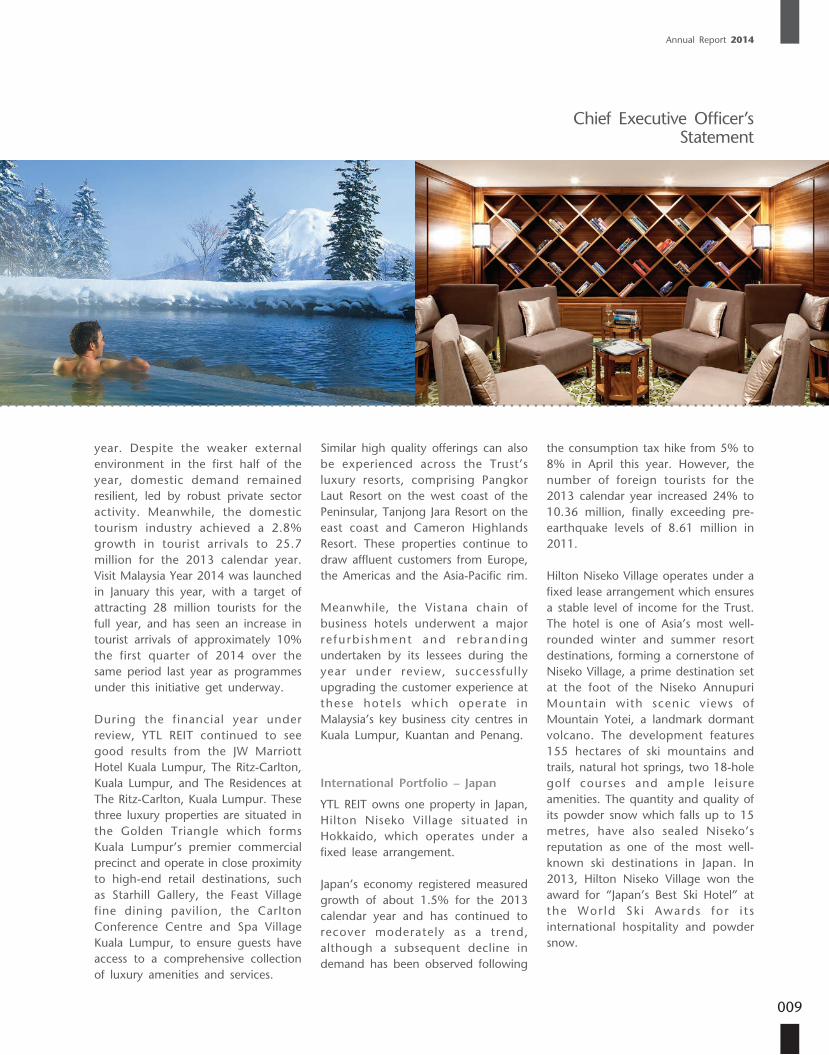
International Portfolio – Japan
YTL REIT owns one property in Japan, Hilton Niseko Village situated in Hokkaido, which operates under a fixed lease arrangement.
Japan’s economy registered measured growth of about 1.5% for the 2013 calendar year and has continued to recover moderately as a trend, although a subsequent decline in demand has been observed following
Chief Executive Officer’s Statement
the consumption tax hike from 5% to 8% in April this year. However, the number of foreign tourists for the 2013 calendar year increased 24% to 10.36 million, finally exceeding pre-earthquake levels of 8.61 million in 2011.
Hilton Niseko Village operates under a fixed lease arrangement which ensures a stable level of income for the Trust. The hotel is one of Asia’s most well-rounded winter and summer resort destinations, forming a cornerstone of Niseko Village, a prime destination set at the foot of the Niseko Annupuri Mountain with scenic views of Mountain Yotei, a landmark dormant volcano. The development features 155 hectares of ski mountains and trails, natural hot springs, two 18-hole golf courses and ample leisure amenities. The quantity and quality of its powder snow which falls up to 15 metres, have also sealed Niseko’s reputation as one of the most well-known ski destinations in Japan. In 2013, Hilton Niseko Village won the award for “Japan’s Best Ski Hotel” at the Wor ld Sk i Awards for i t s international hospitality and powder snow.
YTL Hospitality REIT
010
International Portfolio – Australia
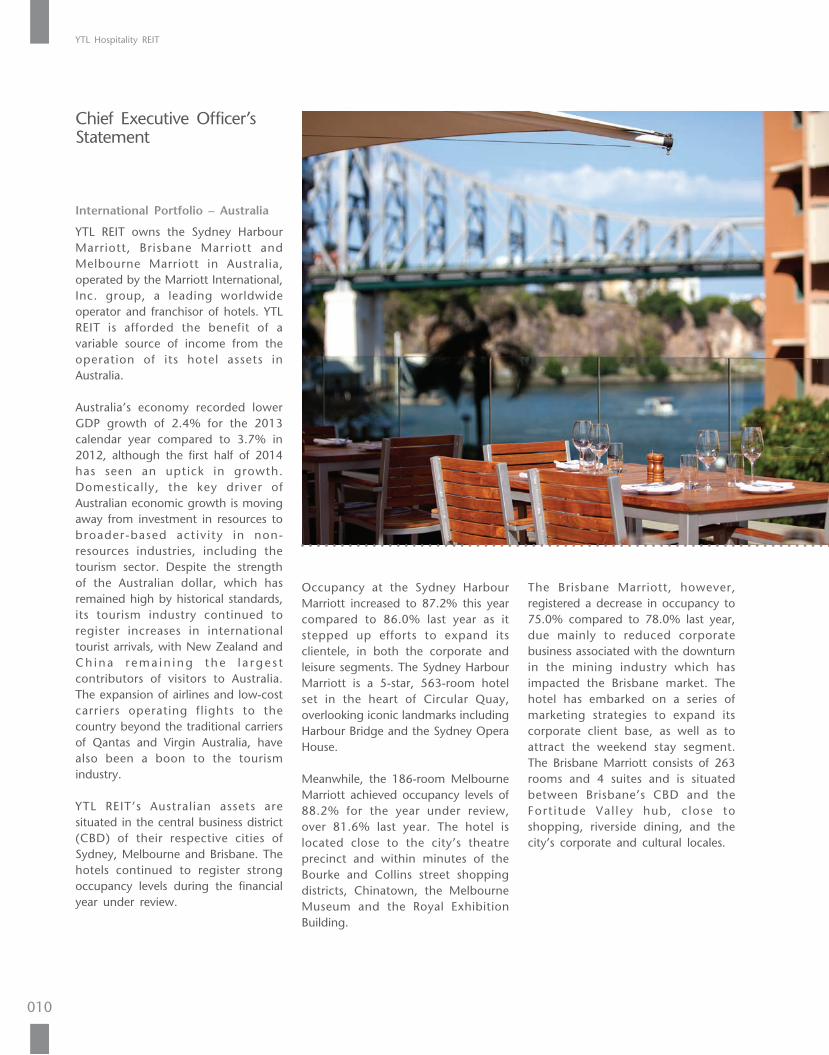
YTL REIT owns the Sydney Harbour Marriott, Brisbane Marriott and Melbourne Marriott in Australia, operated by the Marriott International, Inc. group, a leading worldwide operator and franchisor of hotels. YTL REIT is afforded the benefit of a variable source of income from the operation of its hotel assets in Australia.
Australia’s economy recorded lower GDP growth of 2.4% for the 2013 calendar year compared to 3.7% in 2012, although the first half of 2014 has seen an uptick in growth. Domestically, the key driver of Australian economic growth is moving away from investment in resources to broader-based act iv i ty in non-resources industries, including the tourism sector. Despite the strength of the Australian dollar, which has remained high by historical standards, its tourism industry continued to register increases in international tourist arrivals, with New Zealand and Ch ina r ema in ing the l a rge s t contributors of visitors to Australia. The expansion of airlines and low-cost carriers operating flights to the country beyond the traditional carriers of Qantas and Virgin Australia, have also been a boon to the tourism industry.
YTL REIT’s Australian assets are situated in the central business district (CBD) of their respective cities of Sydney, Melbourne and Brisbane. The hotels continued to register strong occupancy levels during the financial year under review.
Occupancy at the Sydney Harbour Marriott increased to 87.2% this year compared to 86.0% last year as it stepped up efforts to expand its clientele, in both the corporate and leisure segments. The Sydney Harbour Marriott is a 5-star, 563-room hotel set in the heart of Circular Quay, overlooking iconic landmarks including Harbour Bridge and the Sydney Opera House.
Meanwhile, the 186-room Melbourne Marriott achieved occupancy levels of 88.2% for the year under review, over 81.6% last year. The hotel is located close to the city’s theatre precinct and within minutes of the Bourke and Collins street shopping districts, Chinatown, the Melbourne Museum and the Royal Exhibition Building.
The Brisbane Marriott, however, registered a decrease in occupancy to 75.0% compared to 78.0% last year, due mainly to reduced corporate business associated with the downturn in the mining industry which has impacted the Brisbane market. The hotel has embarked on a series of marketing strategies to expand its corporate client base, as well as to attract the weekend stay segment. The Brisbane Marriott consists of 263 rooms and 4 suites and is situated between Brisbane’s CBD and the Fort i tude Val ley hub, c lose to shopping, riverside dining, and the city’s corporate and cultural locales.
Chief Executive Officer’s Statement
Annual Report 2014
011
to its unitholders, by enhancing reputation and business trust, risk m a n a g e m e n t p e r f o r m a n c e , relationships with regulators, staff motivation and attraction of talent, customer preference and loyalty, the goodwill of local communities and long-term unitholder value. The Manager’s Statement on Corporate Governance, which also elaborates on Pintar Projek’s systems and controls, can be found as a separate section in this Annual Report.
OUTLOOK
The outlook for the Malaysian economy remains positive, with growth for the full 2014 calendar year expected to be 4.5% to 5.5%, supported by favourable domestic demand and an improving external environment. The continued recovery
CORPORATE SOCIAL RESPONSIBILITY
Social responsibility is one of the Manager’s key values and Pintar Projek places a high priority on acting responsibly in every aspect of its business. The Manager is part of the wider network of its parent company, YTL Corporation Berhad, which has a long-s tand ing commitment to creating successful, profitable and sustainable businesses. This in turn benefits the surrounding community through the creation of sustained value for unitholders, secure and stable jobs for employees, support for the arts and culture in Malaysia and contributions to promote education for the benefit of future generations.
The Manager believes that effective corporate responsibility can deliver benefits to its businesses and, in turn,
Chief Executive Officer’s Statement
of growth in advanced economies and ongoing efforts under the Visit Malaysia Year 2014 initiative are also likely to have a positive effect on the domestic economy, bolstering the tourism and hospital i ty sector. Australia and Japan are expected to continue on their current stable trajectories, given the maturity of these economies, with growth in the 2-3% range.
YTL REIT’s portfolio of hotels and hospitality-related assets contains a good combination of luxury hotels and resorts and business hotels across a diverse geographic market, all of which augur well for its future development. The range of product offerings cater to an extensive clientele and the Trust will continue to pursue viable expansion and development opportunities that complement the existing portfolio.
As the Manager embarks on another year and remains focused on developing and improving the Trust’s assets and earnings growth, the Board of Directors of Pintar Projek would like to thank YTL REIT’s investors, customers, business associates and the regulatory authorities for their continued support.
TAN SRI DATO’ (DR) FRANCIS YEOH SOCK PINGPSM, CBE, FICE, SIMP, DPMS, DPMP, JMN, JP
22 August 2014
YTL Hospitality REIT
012
ABOUT YTL HOSPITALITY REIT
YTL Hospitality REIT has a market capita l isat ion of approximately RM1,220 million (as at 30 June 2014) and comprises prime hotel and hospitality-related properties. In Malaysia, these include the JW Marriott Hotel Kuala Lumpur, The Ritz-Carlton, Kuala Lumpur, The Residences at The Ritz-Carlton, Kuala Lumpur, the Pangkor Laut, Tanjong Jara and Cameron Highlands resorts and the Vistana chain of hotels in Kuala Lumpur, Penang and Kuantan. YTL Hospitality REIT’s international portfolio comprises Hilton Niseko Village in Japan and the Sydney Harbour, Brisbane and Melbourne Marriott hotels in Australia.
YTL Hospita l i ty REIT’s pr imary objectives are to provide unitholders with stable cash distributions with the potential for sustainable growth, principally from the ownership of properties, and to enhance long-term unit value. The Trust’s principal investment objective is to own and invest in real estate and real estate-related assets, whether directly or indirectly through the ownership of single-purpose companies whose principal assets comprise real estate.
YTL Hospitality REIT was listed on 16 December 2005 on the Main Market of Bursa Malaysia Securities Berhad under the name Starhill Real Estate Investment Trust, with a principal investment strategy of investing in a diversif ied portfol io of income-producing real estate, used primarily for retail, office and hospitality purposes, with particular focus on retail and hotel properties. Its portfolio consisted of 2 retail properties, Starhill Gallery and parcels in Lot 10 Shopping Centre, as well as a hotel property, the JW Marriott Hotel Kuala Lumpur. In 2007, the REIT acquired an additional hotel property comprising 60 units of serviced apartments, 4 levels of commercial podium and 2 levels of car parks located within The Residences at The Ritz-Carlton, Kuala Lumpur.
In 2009, the Trust embarked on a rationalisation exercise to reposition itself as a pure play hospitality REIT, focusing on a single class of hotel and hospitality-related assets. The first stage of the repositioning involved the disposal of the REIT’s retail portfolio (Starhill Gallery and parcels in Lot 10 Shopping Centre), which was completed in June 2010.
The REIT subsequently acquired 9 addi t iona l hote l propert ies in November and December 2011, namely, the Pangkor Laut, Tanjong Jara and Cameron Highlands resorts, The Ritz-Carlton, Kuala Lumpur, and the remainder of The Residences at The Ritz-Carlton, Kuala Lumpur, the Vistana chain of hotels in Kuala Lumpur, Penang and Kuantan, and Hilton Niseko Village in Japan. The REIT’s international portfolio was further enhanced with the acquisitions of the Sydney Harbour, Brisbane and Melbourne Marriott hotels in Australia in November 2012.
YTL Hospitality REIT was established by a trust deed entered into on 18 November 2005 (as restated by the deed dated 3 December 2013) between Pintar Projek Sdn Bhd (“Pintar Projek”) and Maybank Trustees Berhad, as manager and trustee, respectively, of YTL Hospitality REIT.
Property PortfolioOverview
013
Annual Report 2014
Property Portfolio
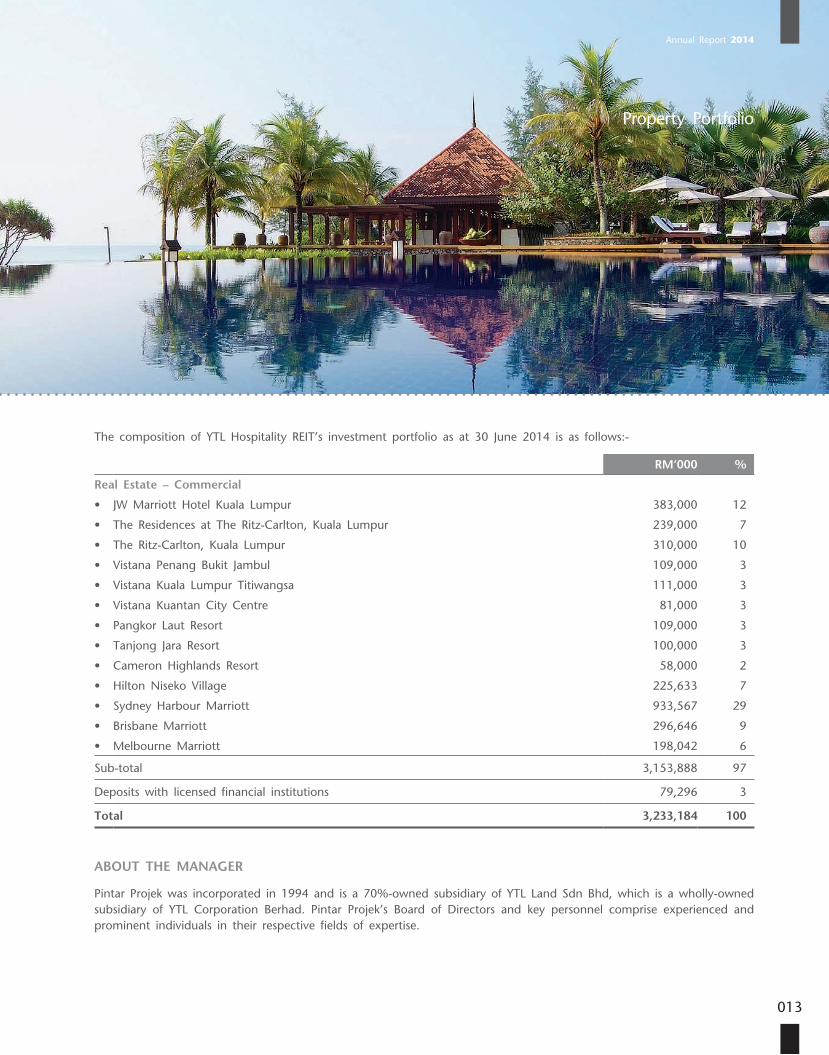
The composition of YTL Hospitality REIT’s investment portfolio as at 30 June 2014 is as follows:-
RM‘000 %
Real Estate – Commercial
• JW Marriott Hotel Kuala Lumpur 383,000 12
• The Residences at The Ritz-Carlton, Kuala Lumpur 239,000 7
• The Ritz-Carlton, Kuala Lumpur 310,000 10
• Vistana Penang Bukit Jambul 109,000 3
• Vistana Kuala Lumpur Titiwangsa 111,000 3
• Vistana Kuantan City Centre 81,000 3
• Pangkor Laut Resort 109,000 3
• Tanjong Jara Resort 100,000 3
• Cameron Highlands Resort 58,000 2
• Hilton Niseko Village 225,633 7
• Sydney Harbour Marriott 933,567 29
• Brisbane Marriott 296,646 9
• Melbourne Marriott 198,042 6
Sub-total 3,153,888 97
Deposits with licensed financial institutions 79,296 3
Total 3,233,184 100
ABOUT THE MANAGER
Pintar Projek was incorporated in 1994 and is a 70%-owned subsidiary of YTL Land Sdn Bhd, which is a wholly-owned subsidiary of YTL Corporation Berhad. Pintar Projek’s Board of Directors and key personnel comprise experienced and prominent individuals in their respective fields of expertise.
YTL Hospitality REIT
014
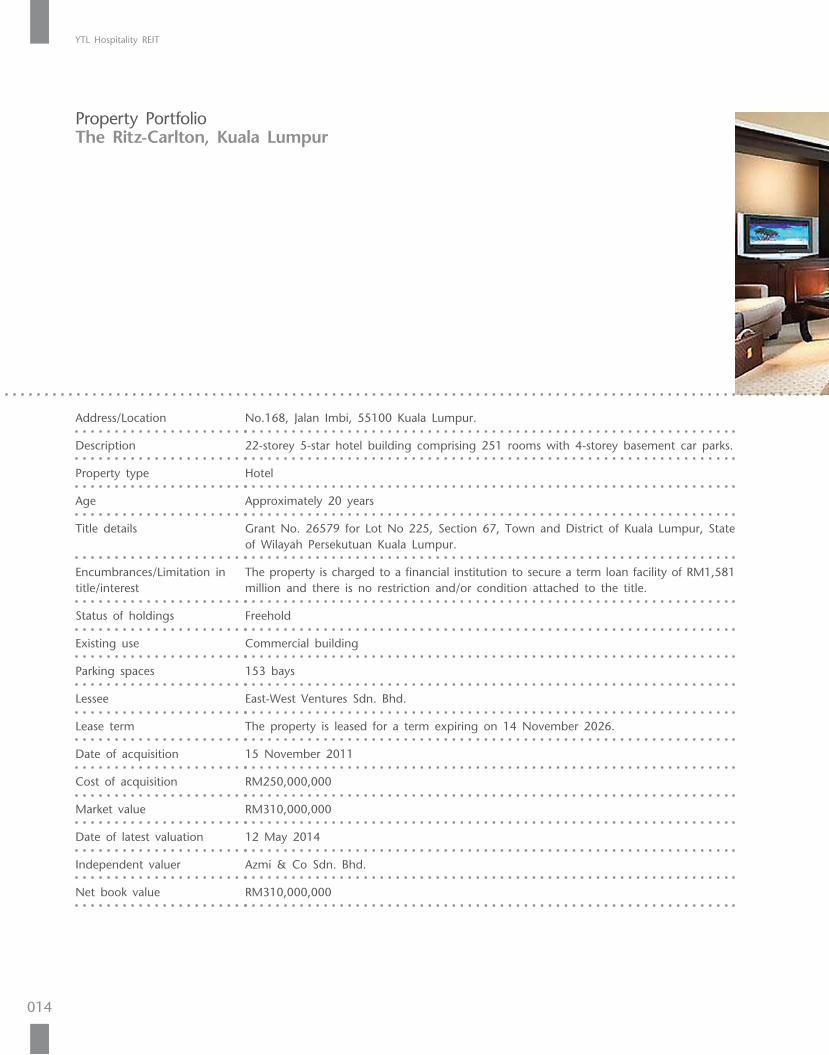
Property PortfolioThe Ritz-Carlton, Kuala Lumpur
Address/Location No.168, Jalan Imbi, 55100 Kuala Lumpur.
Description 22-storey 5-star hotel building comprising 251 rooms with 4-storey basement car parks.
Property type Hotel
Age Approximately 20 years
Title details Grant No. 26579 for Lot No 225, Section 67, Town and District of Kuala Lumpur, State of Wilayah Persekutuan Kuala Lumpur.
Encumbrances/Limitation in title/interest
The property is charged to a financial institution to secure a term loan facility of RM1,581 million and there is no restriction and/or condition attached to the title.
Status of holdings Freehold
Existing use Commercial building
Parking spaces 153 bays
Lessee East-West Ventures Sdn. Bhd.
Lease term The property is leased for a term expiring on 14 November 2026.
Date of acquisition 15 November 2011
Cost of acquisition RM250,000,000
Market value RM310,000,000
Date of latest valuation 12 May 2014
Independent valuer Azmi & Co Sdn. Bhd.
Net book value RM310,000,000

Annual Report 2014
015
Property Portfolio
YTL Hospitality REIT
016
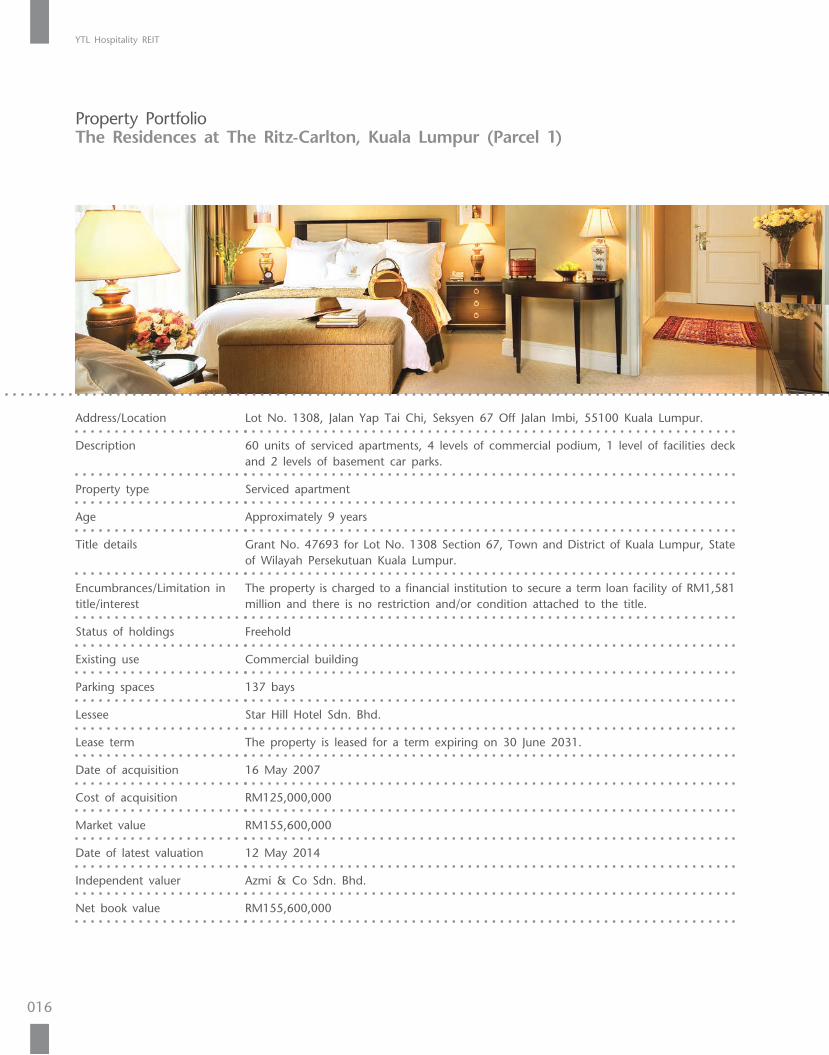
Property PortfolioThe Residences at The Ritz-Carlton, Kuala Lumpur (Parcel 1)
Address/Location Lot No. 1308, Jalan Yap Tai Chi, Seksyen 67 Off Jalan Imbi, 55100 Kuala Lumpur.
Description 60 units of serviced apartments, 4 levels of commercial podium, 1 level of facilities deck and 2 levels of basement car parks.
Property type Serviced apartment
Age Approximately 9 years
Title details Grant No. 47693 for Lot No. 1308 Section 67, Town and District of Kuala Lumpur, State of Wilayah Persekutuan Kuala Lumpur.
Encumbrances/Limitation in title/interest
The property is charged to a financial institution to secure a term loan facility of RM1,581 million and there is no restriction and/or condition attached to the title.
Status of holdings Freehold
Existing use Commercial building
Parking spaces 137 bays
Lessee Star Hill Hotel Sdn. Bhd.
Lease term The property is leased for a term expiring on 30 June 2031.
Date of acquisition 16 May 2007
Cost of acquisition RM125,000,000
Market value RM155,600,000
Date of latest valuation 12 May 2014
Independent valuer Azmi & Co Sdn. Bhd.
Net book value RM155,600,000
Annual Report 2014
017
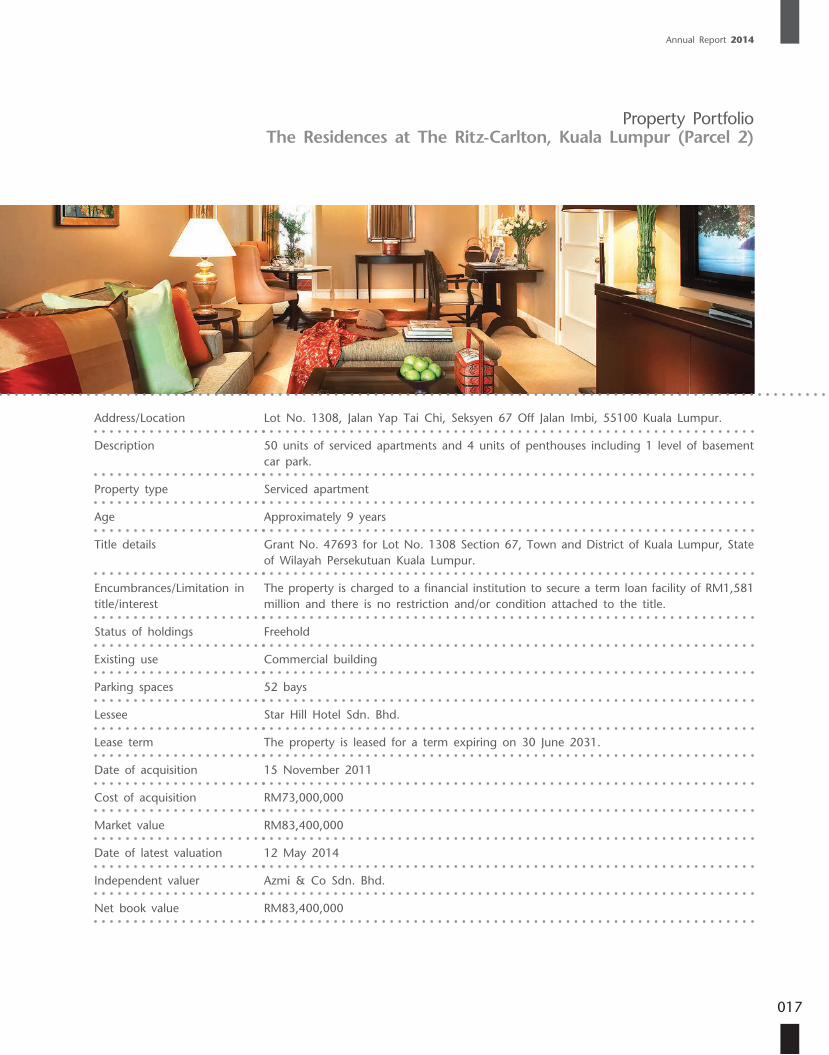
Property PortfolioThe Residences at The Ritz-Carlton, Kuala Lumpur (Parcel 2)
Address/Location Lot No. 1308, Jalan Yap Tai Chi, Seksyen 67 Off Jalan Imbi, 55100 Kuala Lumpur.
Description 50 units of serviced apartments and 4 units of penthouses including 1 level of basement car park.
Property type Serviced apartment
Age Approximately 9 years
Title details Grant No. 47693 for Lot No. 1308 Section 67, Town and District of Kuala Lumpur, State of Wilayah Persekutuan Kuala Lumpur.
Encumbrances/Limitation in title/interest
The property is charged to a financial institution to secure a term loan facility of RM1,581 million and there is no restriction and/or condition attached to the title.
Status of holdings Freehold
Existing use Commercial building
Parking spaces 52 bays
Lessee Star Hill Hotel Sdn. Bhd.
Lease term The property is leased for a term expiring on 30 June 2031.
Date of acquisition 15 November 2011
Cost of acquisition RM73,000,000
Market value RM83,400,000
Date of latest valuation 12 May 2014
Independent valuer Azmi & Co Sdn. Bhd.
Net book value RM83,400,000
YTL Hospitality REIT
018
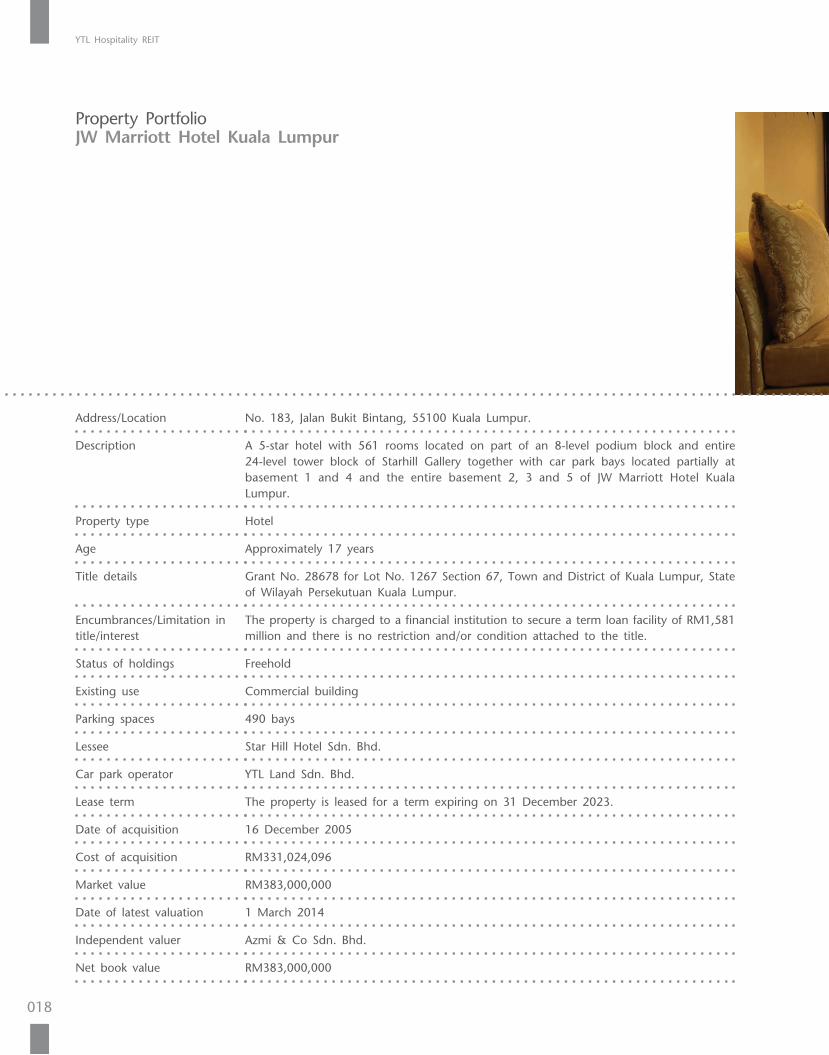
Address/Location No. 183, Jalan Bukit Bintang, 55100 Kuala Lumpur.
Description A 5-star hotel with 561 rooms located on part of an 8-level podium block and entire 24-level tower block of Starhill Gallery together with car park bays located partially at basement 1 and 4 and the entire basement 2, 3 and 5 of JW Marriott Hotel Kuala Lumpur.
Property type Hotel
Age Approximately 17 years
Title details Grant No. 28678 for Lot No. 1267 Section 67, Town and District of Kuala Lumpur, State of Wilayah Persekutuan Kuala Lumpur.
Encumbrances/Limitation in title/interest
The property is charged to a financial institution to secure a term loan facility of RM1,581 million and there is no restriction and/or condition attached to the title.
Status of holdings Freehold
Existing use Commercial building
Parking spaces 490 bays
Lessee Star Hill Hotel Sdn. Bhd.
Car park operator YTL Land Sdn. Bhd.
Lease term The property is leased for a term expiring on 31 December 2023.
Date of acquisition 16 December 2005
Cost of acquisition RM331,024,096
Market value RM383,000,000
Date of latest valuation 1 March 2014
Independent valuer Azmi & Co Sdn. Bhd.
Net book value RM383,000,000
Property PortfolioJW Marriott Hotel Kuala Lumpur
Annual Report 2014
019
Property Portfolio
YTL Hospitality REIT
020
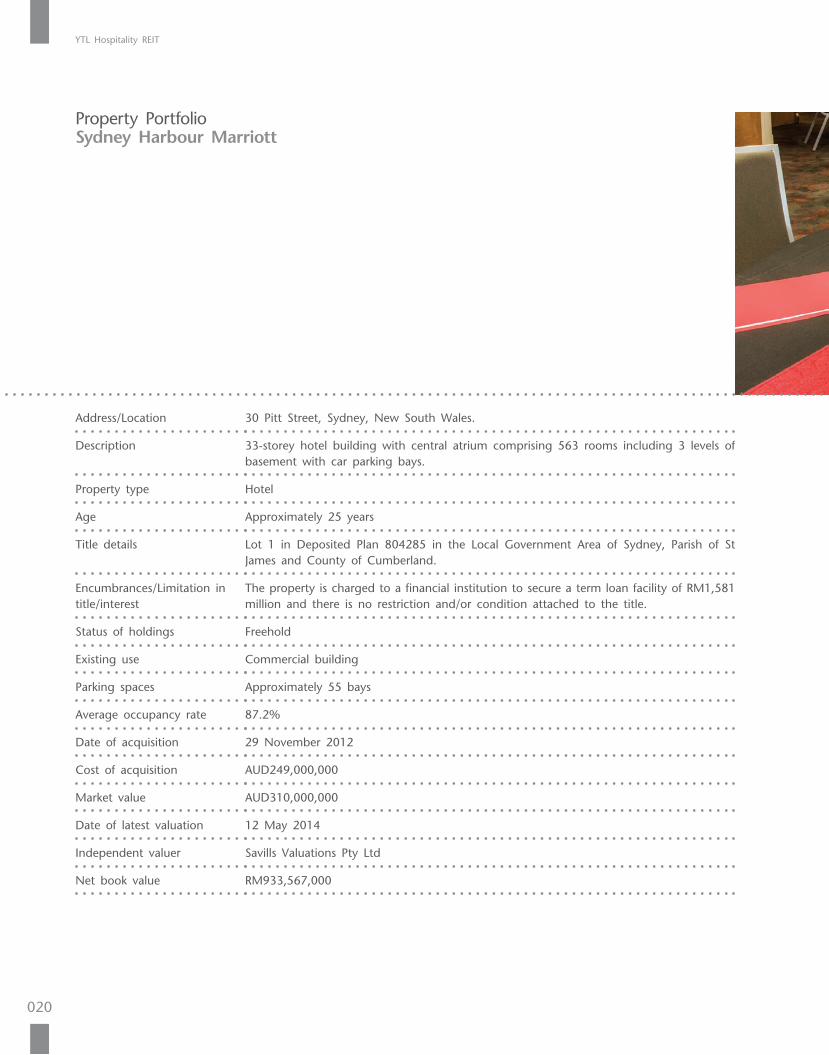
Property PortfolioSydney Harbour Marriott
Address/Location 30 Pitt Street, Sydney, New South Wales.
Description 33-storey hotel building with central atrium comprising 563 rooms including 3 levels of basement with car parking bays.
Property type Hotel
Age Approximately 25 years
Title details Lot 1 in Deposited Plan 804285 in the Local Government Area of Sydney, Parish of St James and County of Cumberland.
Encumbrances/Limitation in title/interest
The property is charged to a financial institution to secure a term loan facility of RM1,581 million and there is no restriction and/or condition attached to the title.
Status of holdings Freehold
Existing use Commercial building
Parking spaces Approximately 55 bays
Average occupancy rate 87.2%
Date of acquisition 29 November 2012
Cost of acquisition AUD249,000,000
Market value AUD310,000,000
Date of latest valuation 12 May 2014
Independent valuer Savills Valuations Pty Ltd
Net book value RM933,567,000
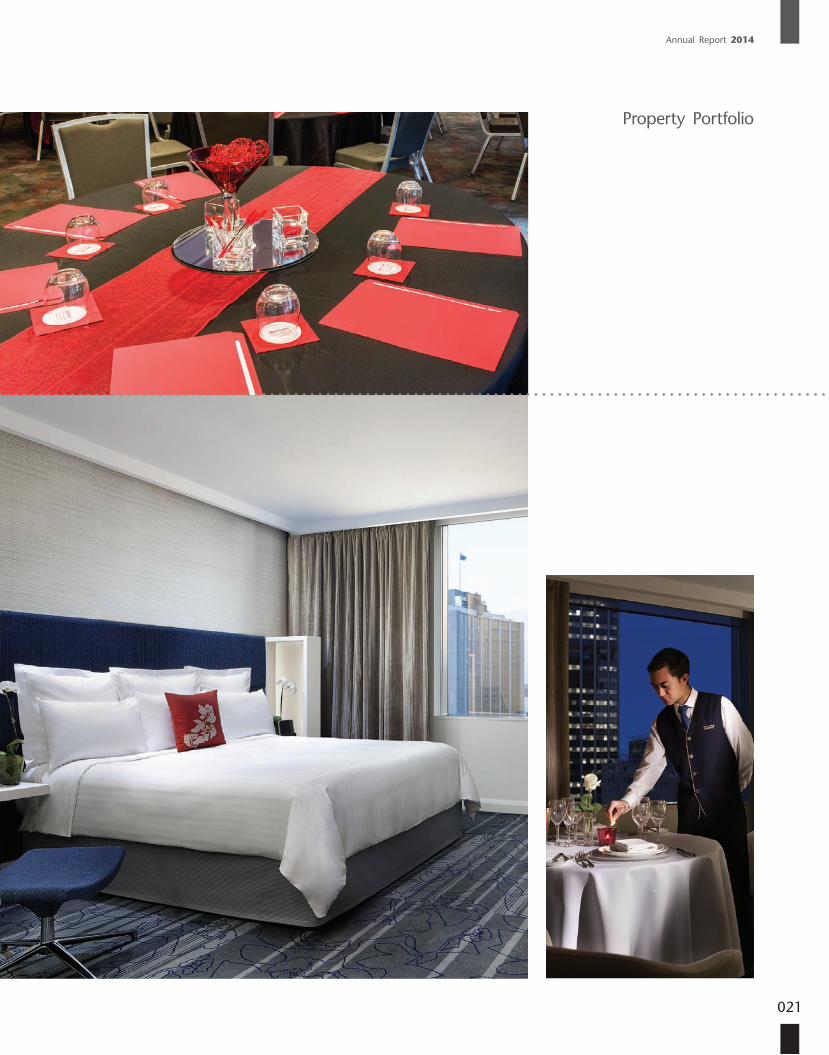
Annual Report 2014
021
Property Portfolio
YTL Hospitality REIT
022
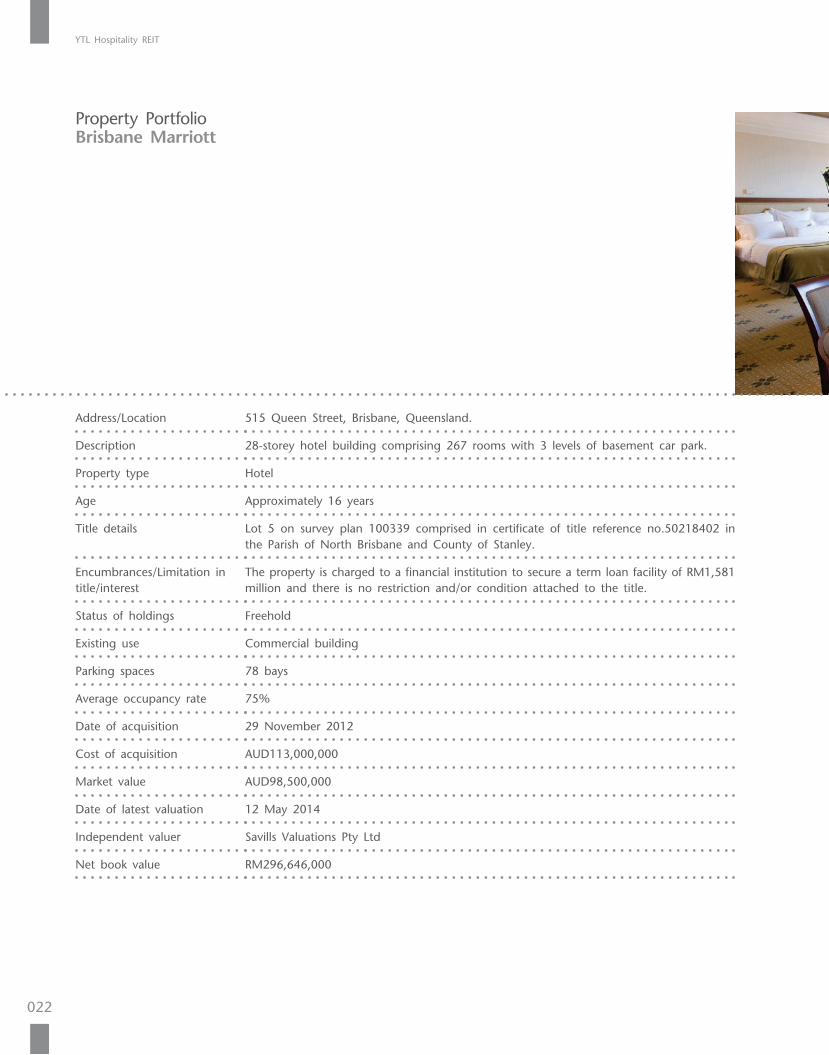
Property PortfolioBrisbane Marriott
Address/Location 515 Queen Street, Brisbane, Queensland.
Description 28-storey hotel building comprising 267 rooms with 3 levels of basement car park.
Property type Hotel
Age Approximately 16 years
Title details Lot 5 on survey plan 100339 comprised in certificate of title reference no.50218402 in the Parish of North Brisbane and County of Stanley.
Encumbrances/Limitation in title/interest
The property is charged to a financial institution to secure a term loan facility of RM1,581 million and there is no restriction and/or condition attached to the title.
Status of holdings Freehold
Existing use Commercial building
Parking spaces 78 bays
Average occupancy rate 75%
Date of acquisition 29 November 2012
Cost of acquisition AUD113,000,000
Market value AUD98,500,000
Date of latest valuation 12 May 2014
Independent valuer Savills Valuations Pty Ltd
Net book value RM296,646,000

Annual Report 2014
023
Property Portfolio
YTL Hospitality REIT
024
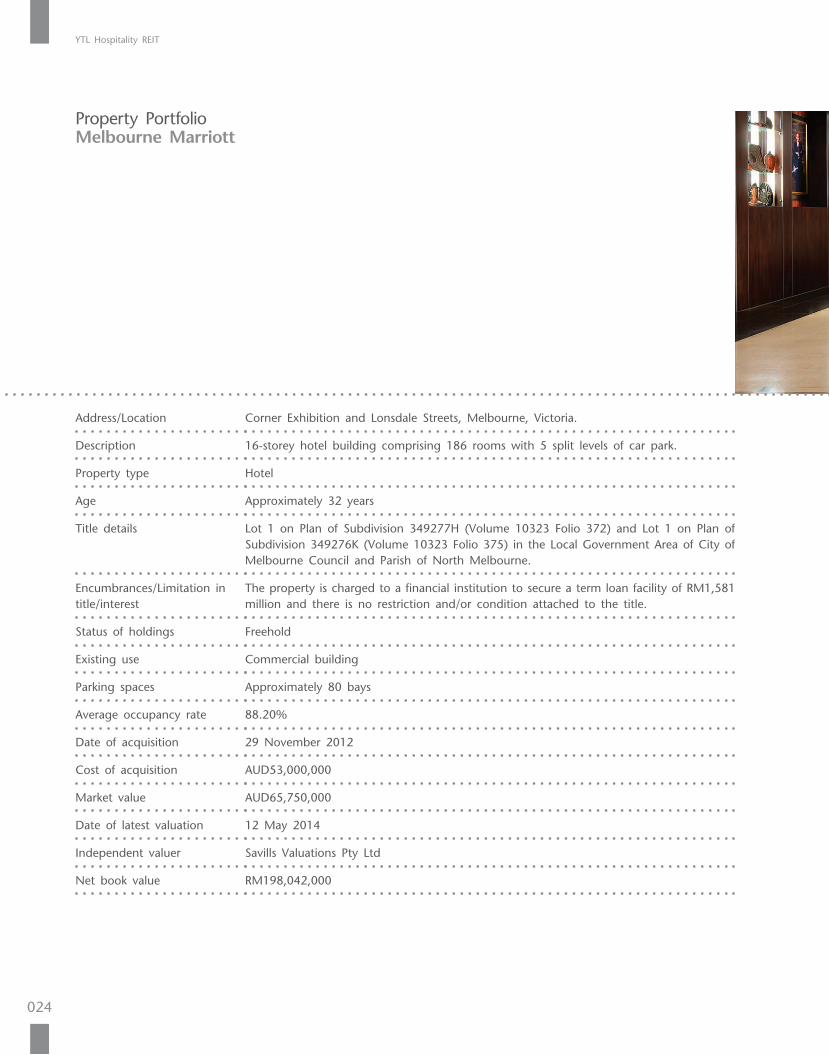
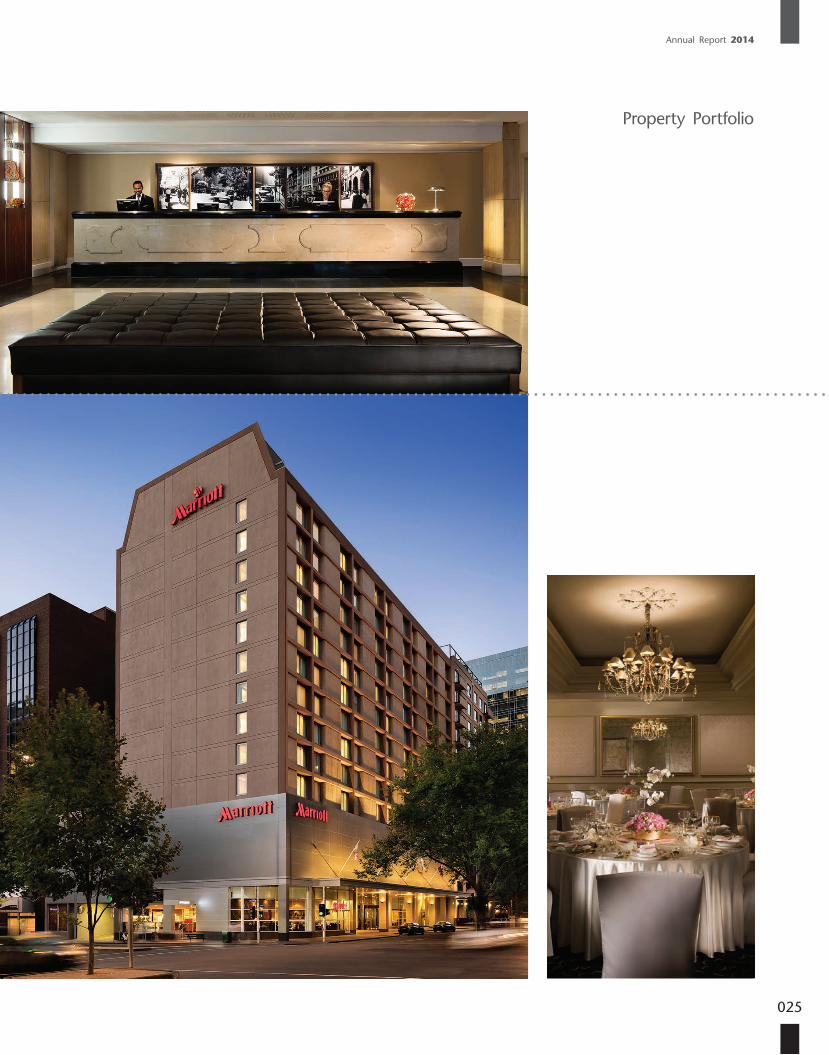
Property PortfolioMelbourne Marriott
Address/Location Corner Exhibition and Lonsdale Streets, Melbourne, Victoria.
Description 16-storey hotel building comprising 186 rooms with 5 split levels of car park.
Property type Hotel
Age Approximately 32 years
Title details Lot 1 on Plan of Subdivision 349277H (Volume 10323 Folio 372) and Lot 1 on Plan of Subdivision 349276K (Volume 10323 Folio 375) in the Local Government Area of City of Melbourne Council and Parish of North Melbourne.
Encumbrances/Limitation in title/interest
The property is charged to a financial institution to secure a term loan facility of RM1,581 million and there is no restriction and/or condition attached to the title.
Status of holdings Freehold
Existing use Commercial building
Parking spaces Approximately 80 bays
Average occupancy rate 88.20%
Date of acquisition 29 November 2012
Cost of acquisition AUD53,000,000
Market value AUD65,750,000
Date of latest valuation 12 May 2014
Independent valuer Savills Valuations Pty Ltd
Net book value RM198,042,000
Annual Report 2014
025
Property Portfolio
YTL Hospitality REIT
026
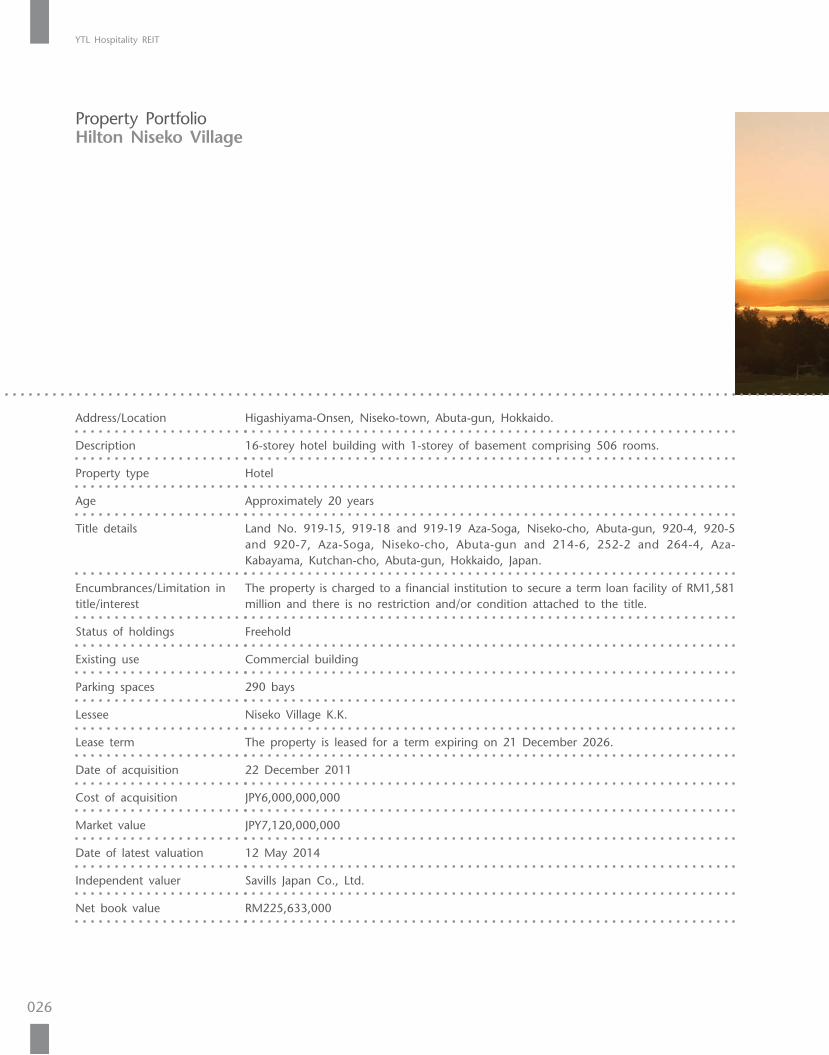
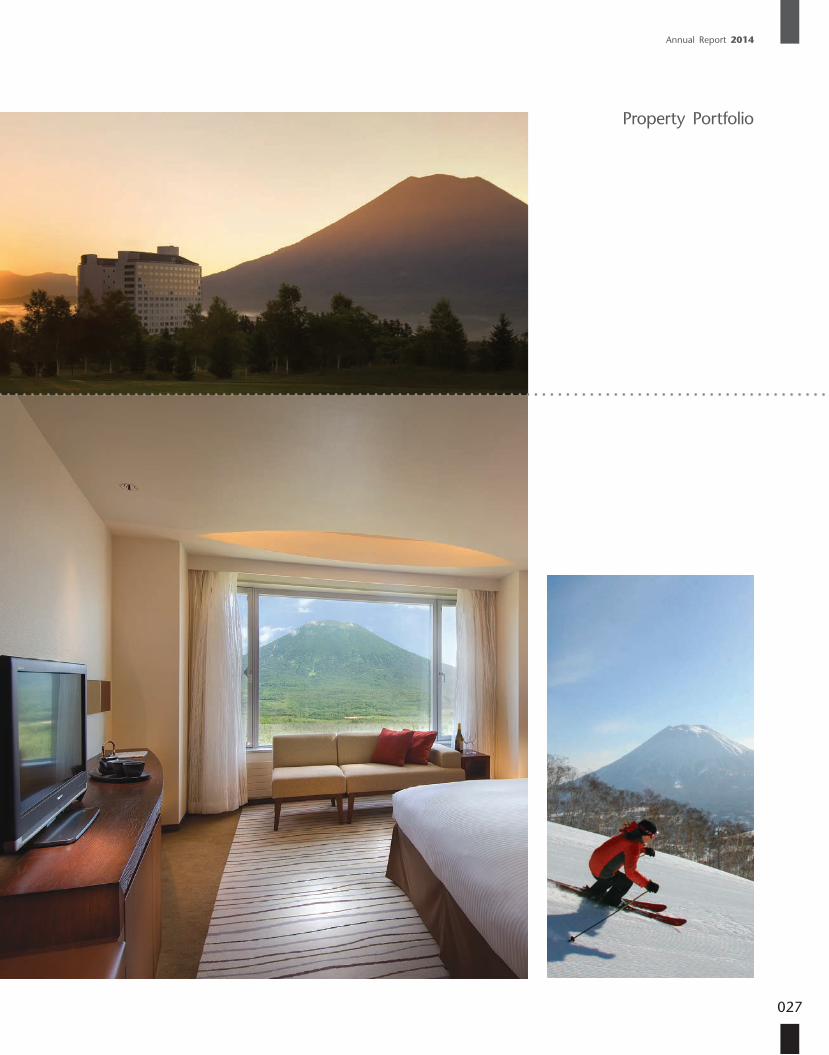
Property PortfolioHilton Niseko Village
Address/Location Higashiyama-Onsen, Niseko-town, Abuta-gun, Hokkaido.
Description 16-storey hotel building with 1-storey of basement comprising 506 rooms.
Property type Hotel
Age Approximately 20 years
Title details Land No. 919-15, 919-18 and 919-19 Aza-Soga, Niseko-cho, Abuta-gun, 920-4, 920-5 and 920-7, Aza-Soga, Niseko-cho, Abuta-gun and 214-6, 252-2 and 264-4, Aza-Kabayama, Kutchan-cho, Abuta-gun, Hokkaido, Japan.
Encumbrances/Limitation in title/interest
The property is charged to a financial institution to secure a term loan facility of RM1,581 million and there is no restriction and/or condition attached to the title.
Status of holdings Freehold
Existing use Commercial building
Parking spaces 290 bays
Lessee Niseko Village K.K.
Lease term The property is leased for a term expiring on 21 December 2026.
Date of acquisition 22 December 2011
Cost of acquisition JPY6,000,000,000
Market value JPY7,120,000,000
Date of latest valuation 12 May 2014
Independent valuer Savills Japan Co., Ltd.
Net book value RM225,633,000
Annual Report 2014
027
Property Portfolio
YTL Hospitality REIT
028
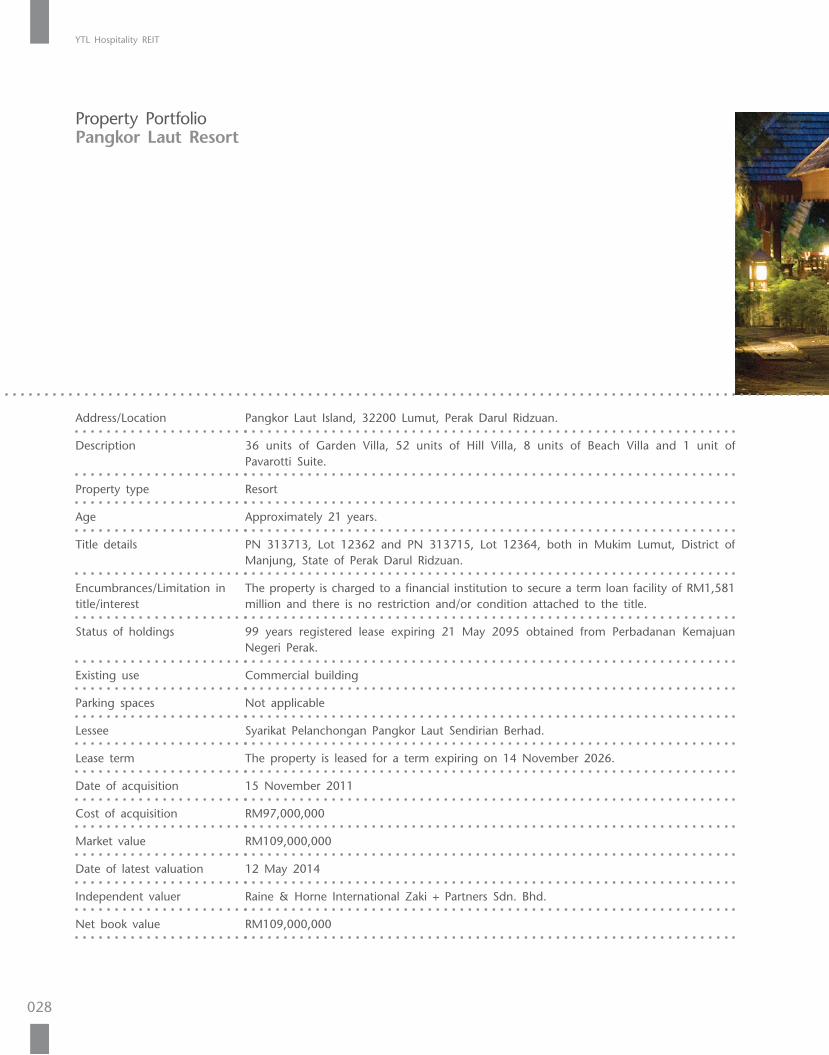
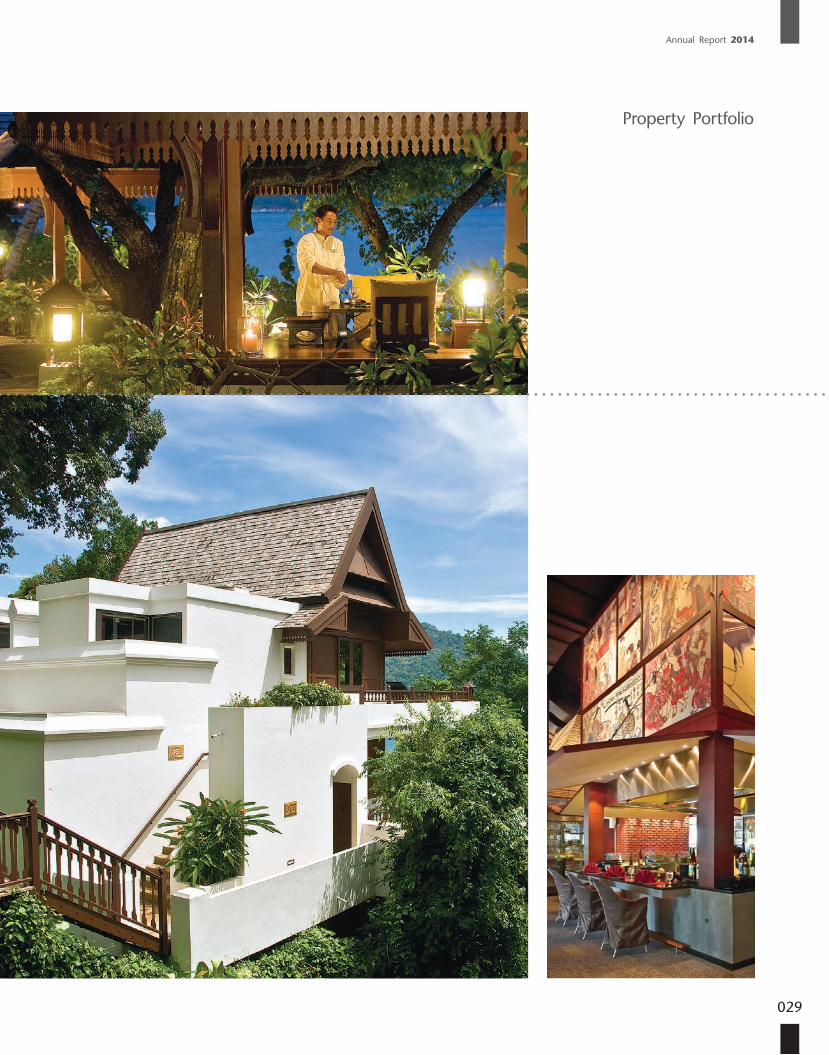
Property PortfolioPangkor Laut Resort
Address/Location Pangkor Laut Island, 32200 Lumut, Perak Darul Ridzuan.
Description 36 units of Garden Villa, 52 units of Hill Villa, 8 units of Beach Villa and 1 unit of Pavarotti Suite.
Property type Resort
Age Approximately 21 years.
Title details PN 313713, Lot 12362 and PN 313715, Lot 12364, both in Mukim Lumut, District of Manjung, State of Perak Darul Ridzuan.
Encumbrances/Limitation in title/interest
The property is charged to a financial institution to secure a term loan facility of RM1,581 million and there is no restriction and/or condition attached to the title.
Status of holdings 99 years registered lease expiring 21 May 2095 obtained from Perbadanan Kemajuan Negeri Perak.
Existing use Commercial building
Parking spaces Not applicable
Lessee Syarikat Pelanchongan Pangkor Laut Sendirian Berhad.
Lease term The property is leased for a term expiring on 14 November 2026.
Date of acquisition 15 November 2011
Cost of acquisition RM97,000,000
Market value RM109,000,000
Date of latest valuation 12 May 2014
Independent valuer Raine & Horne International Zaki + Partners Sdn. Bhd.
Net book value RM109,000,000
Annual Report 2014
029
Property Portfolio
YTL Hospitality REIT
030
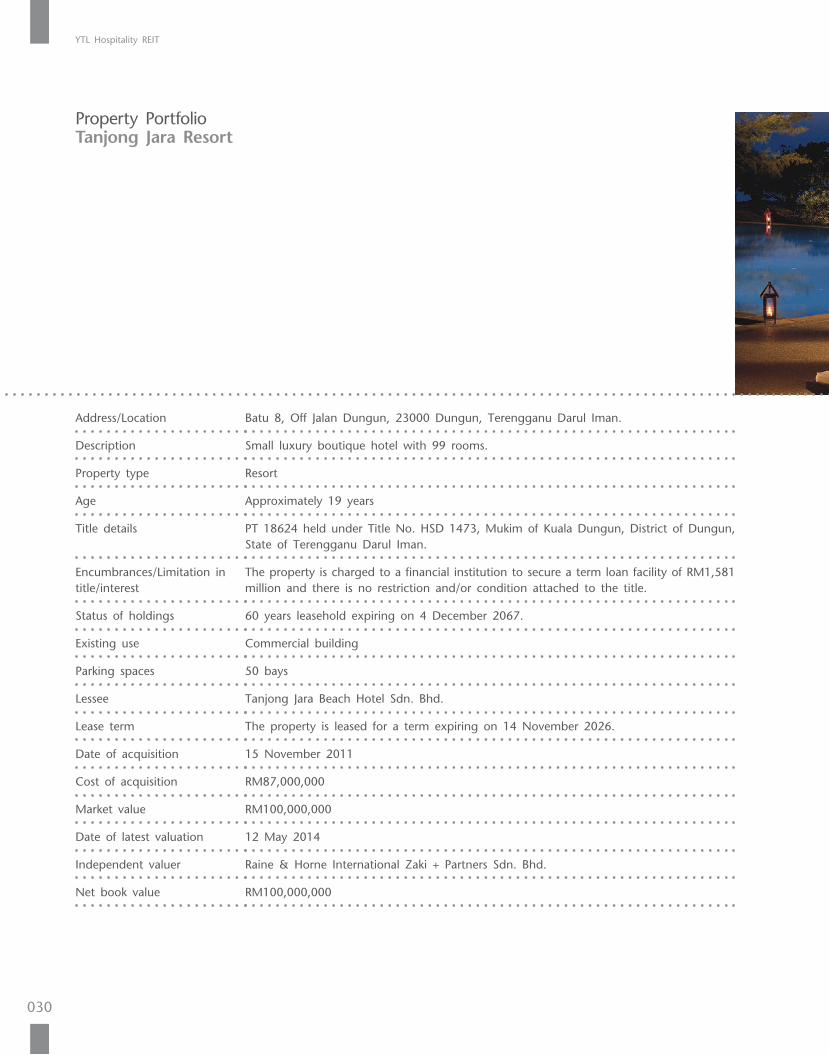
Property PortfolioTanjong Jara Resort
Address/Location Batu 8, Off Jalan Dungun, 23000 Dungun, Terengganu Darul Iman.
Description Small luxury boutique hotel with 99 rooms.
Property type Resort
Age Approximately 19 years
Title details PT 18624 held under Title No. HSD 1473, Mukim of Kuala Dungun, District of Dungun, State of Terengganu Darul Iman.
Encumbrances/Limitation in title/interest
The property is charged to a financial institution to secure a term loan facility of RM1,581 million and there is no restriction and/or condition attached to the title.
Status of holdings 60 years leasehold expiring on 4 December 2067.
Existing use Commercial building
Parking spaces 50 bays
Lessee Tanjong Jara Beach Hotel Sdn. Bhd.
Lease term The property is leased for a term expiring on 14 November 2026.
Date of acquisition 15 November 2011
Cost of acquisition RM87,000,000
Market value RM100,000,000
Date of latest valuation 12 May 2014
Independent valuer Raine & Horne International Zaki + Partners Sdn. Bhd.
Net book value RM100,000,000

Annual Report 2014
031
Property Portfolio
YTL Hospitality REIT
032
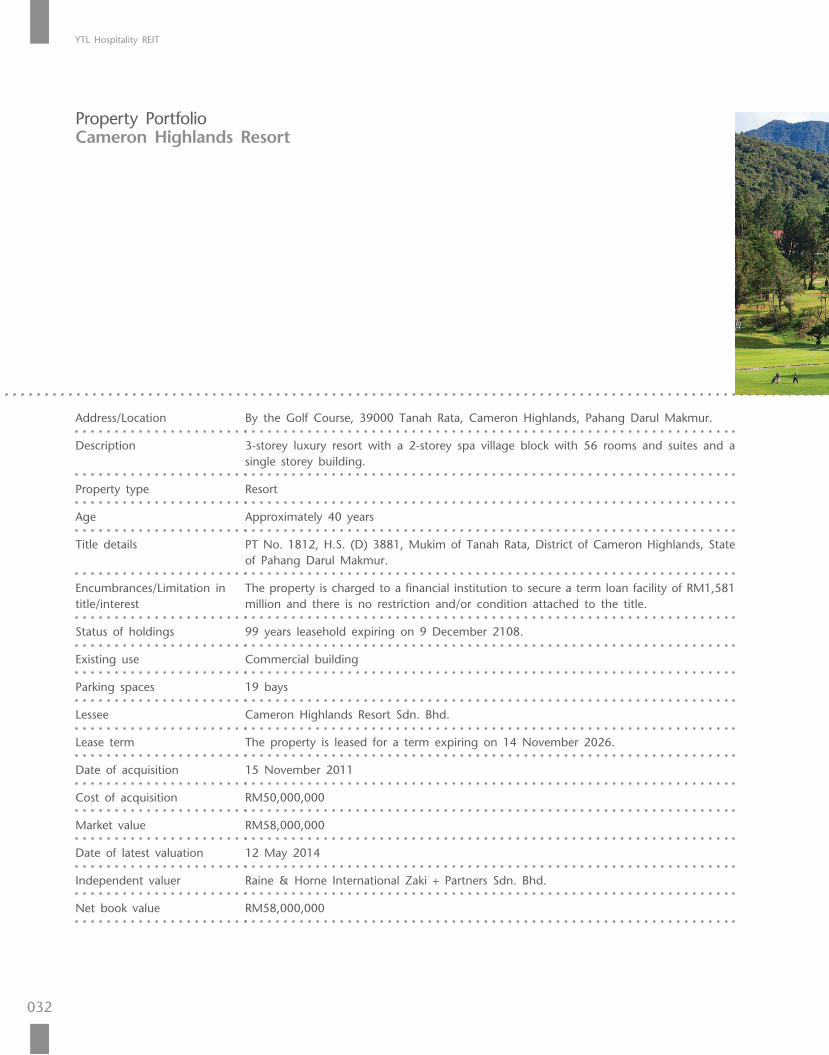
Property PortfolioCameron Highlands Resort
Address/Location By the Golf Course, 39000 Tanah Rata, Cameron Highlands, Pahang Darul Makmur.
Description 3-storey luxury resort with a 2-storey spa village block with 56 rooms and suites and a single storey building.
Property type Resort
Age Approximately 40 years
Title details PT No. 1812, H.S. (D) 3881, Mukim of Tanah Rata, District of Cameron Highlands, State of Pahang Darul Makmur.
Encumbrances/Limitation in title/interest
The property is charged to a financial institution to secure a term loan facility of RM1,581 million and there is no restriction and/or condition attached to the title.
Status of holdings 99 years leasehold expiring on 9 December 2108.
Existing use Commercial building
Parking spaces 19 bays
Lessee Cameron Highlands Resort Sdn. Bhd.
Lease term The property is leased for a term expiring on 14 November 2026.
Date of acquisition 15 November 2011
Cost of acquisition RM50,000,000
Market value RM58,000,000
Date of latest valuation 12 May 2014
Independent valuer Raine & Horne International Zaki + Partners Sdn. Bhd.
Net book value RM58,000,000

Annual Report 2014
033
Property Portfolio
YTL Hospitality REIT
034
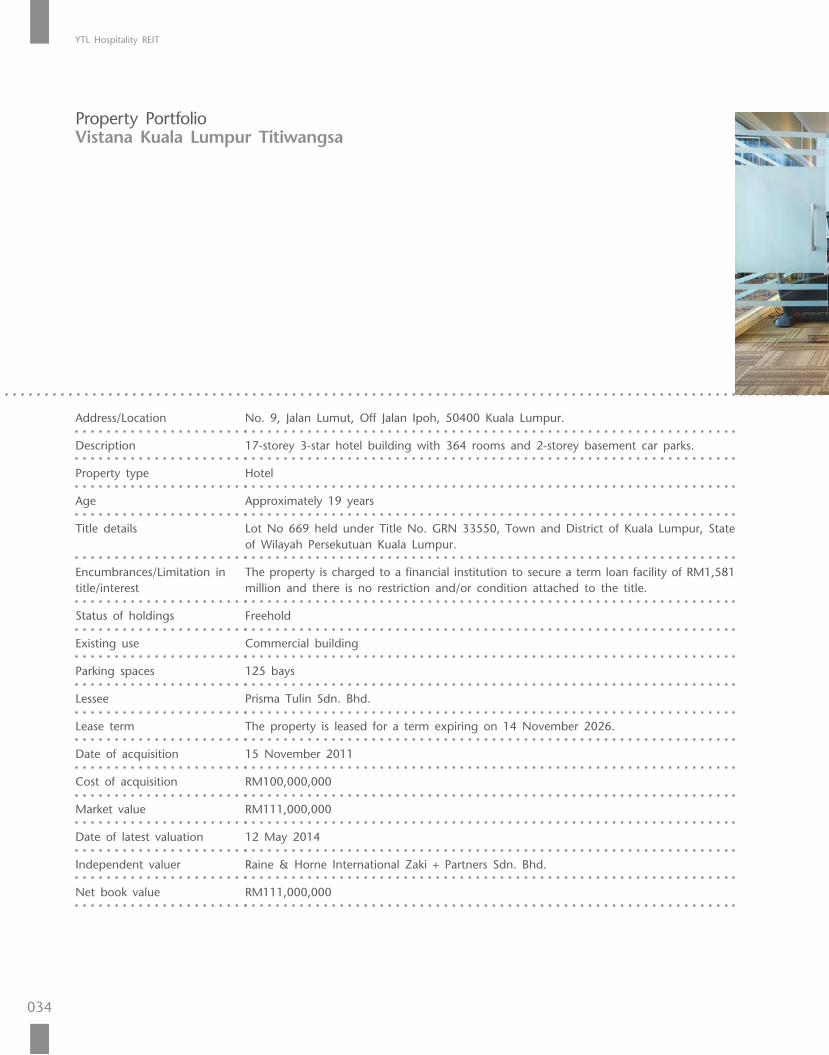
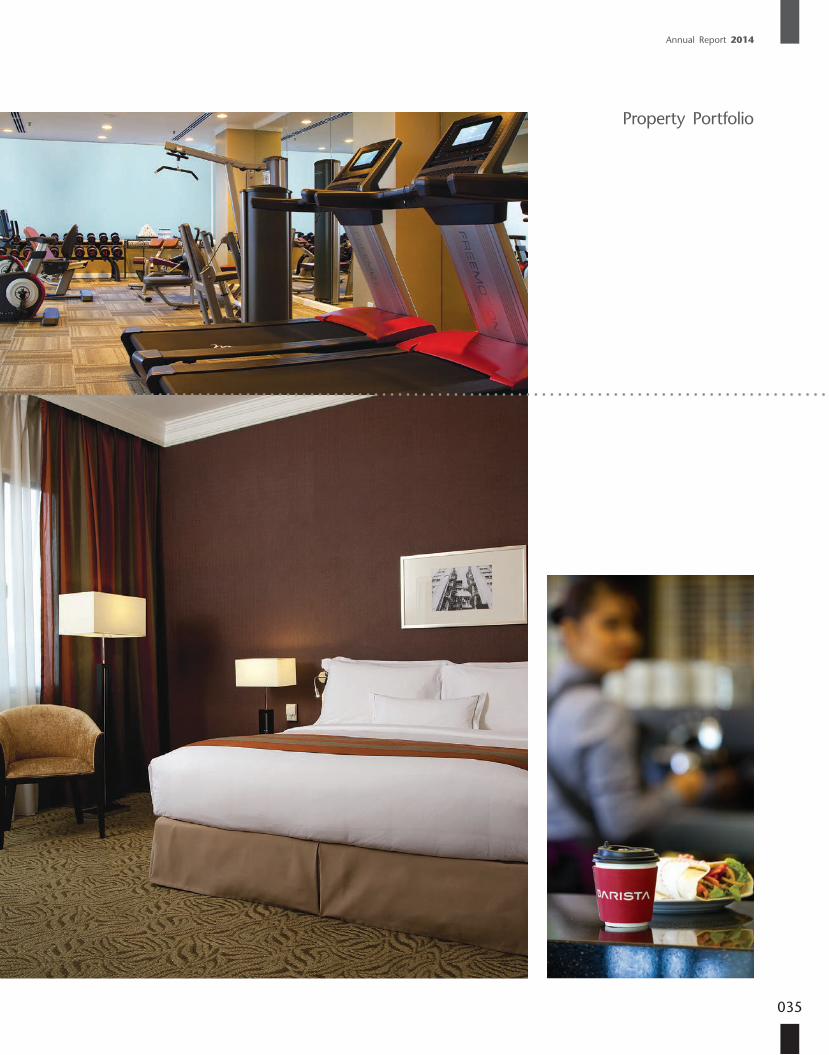
Property PortfolioVistana Kuala Lumpur Titiwangsa
Address/Location No. 9, Jalan Lumut, Off Jalan Ipoh, 50400 Kuala Lumpur.
Description 17-storey 3-star hotel building with 364 rooms and 2-storey basement car parks.
Property type Hotel
Age Approximately 19 years
Title details Lot No 669 held under Title No. GRN 33550, Town and District of Kuala Lumpur, State of Wilayah Persekutuan Kuala Lumpur.
Encumbrances/Limitation in title/interest
The property is charged to a financial institution to secure a term loan facility of RM1,581 million and there is no restriction and/or condition attached to the title.
Status of holdings Freehold
Existing use Commercial building
Parking spaces 125 bays
Lessee Prisma Tulin Sdn. Bhd.
Lease term The property is leased for a term expiring on 14 November 2026.
Date of acquisition 15 November 2011
Cost of acquisition RM100,000,000
Market value RM111,000,000
Date of latest valuation 12 May 2014
Independent valuer Raine & Horne International Zaki + Partners Sdn. Bhd.
Net book value RM111,000,000
Annual Report 2014
035
Property Portfolio
YTL Hospitality REIT
036
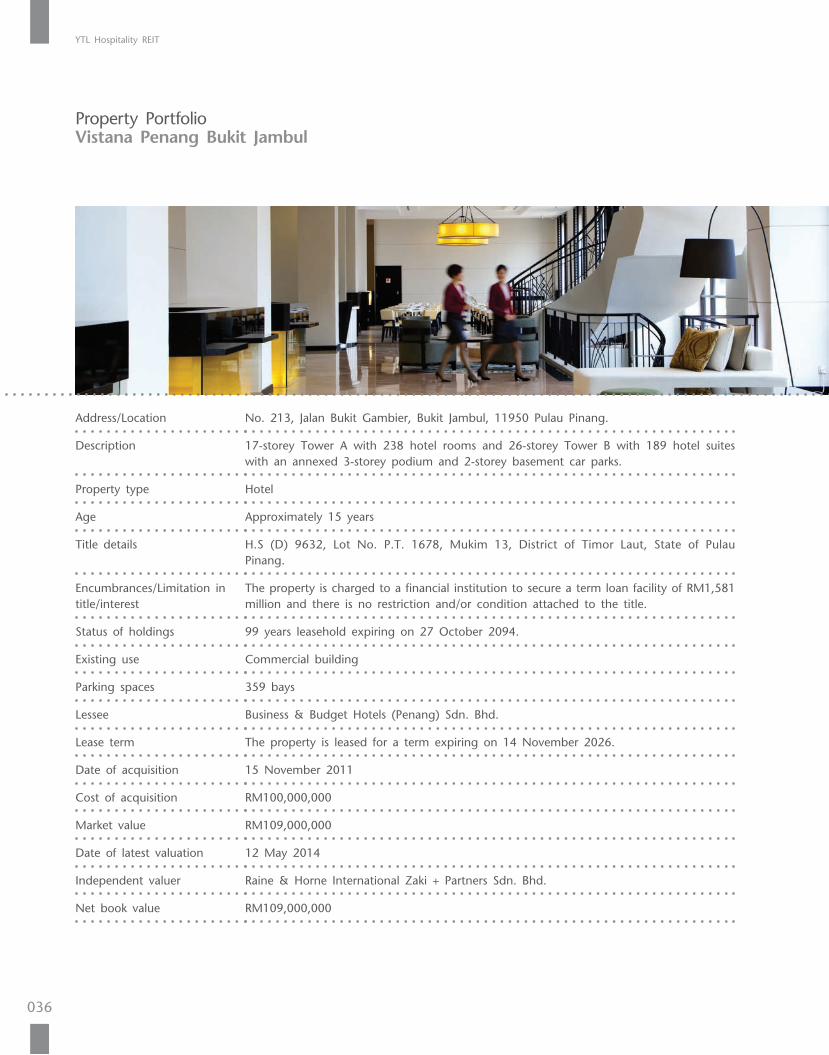
Property PortfolioVistana Penang Bukit Jambul
Address/Location No. 213, Jalan Bukit Gambier, Bukit Jambul, 11950 Pulau Pinang.
Description 17-storey Tower A with 238 hotel rooms and 26-storey Tower B with 189 hotel suites with an annexed 3-storey podium and 2-storey basement car parks.
Property type Hotel
Age Approximately 15 years
Title details H.S (D) 9632, Lot No. P.T. 1678, Mukim 13, District of Timor Laut, State of Pulau Pinang.
Encumbrances/Limitation in title/interest
The property is charged to a financial institution to secure a term loan facility of RM1,581 million and there is no restriction and/or condition attached to the title.
Status of holdings 99 years leasehold expiring on 27 October 2094.
Existing use Commercial building
Parking spaces 359 bays
Lessee Business & Budget Hotels (Penang) Sdn. Bhd.
Lease term The property is leased for a term expiring on 14 November 2026.
Date of acquisition 15 November 2011
Cost of acquisition RM100,000,000
Market value RM109,000,000
Date of latest valuation 12 May 2014
Independent valuer Raine & Horne International Zaki + Partners Sdn. Bhd.
Net book value RM109,000,000
Annual Report 2014
037
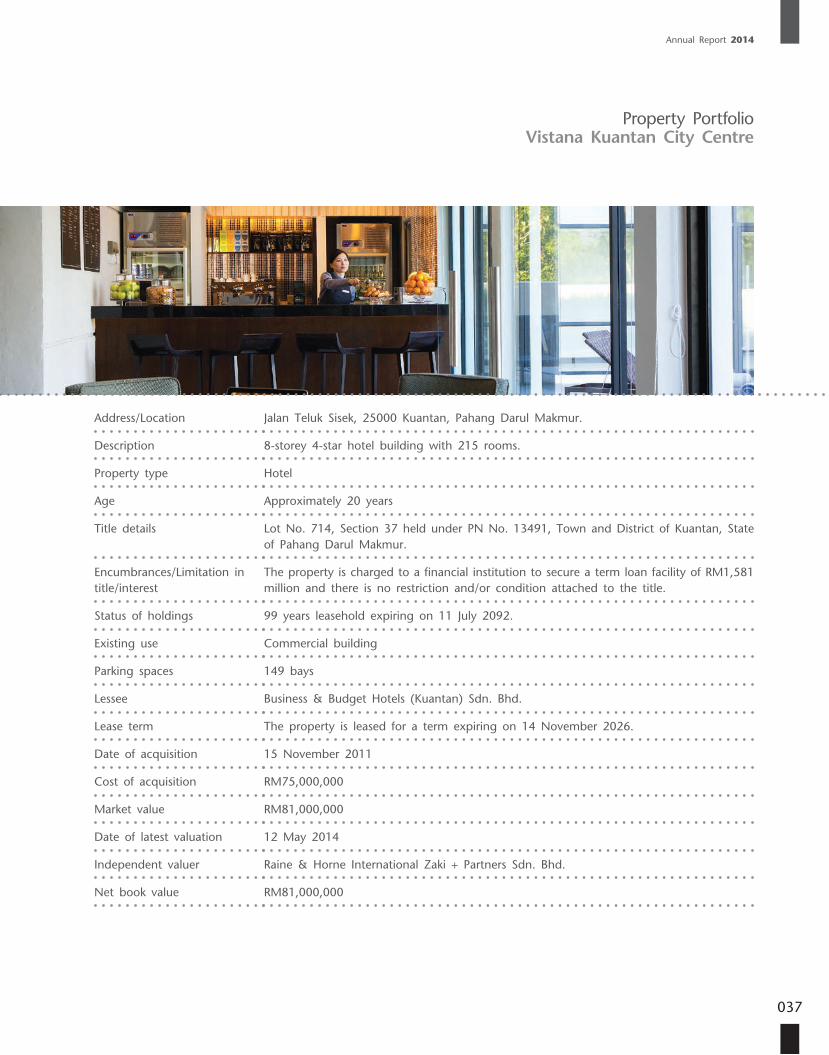
Property PortfolioVistana Kuantan City Centre
Address/Location Jalan Teluk Sisek, 25000 Kuantan, Pahang Darul Makmur.
Description 8-storey 4-star hotel building with 215 rooms.
Property type Hotel
Age Approximately 20 years
Title details Lot No. 714, Section 37 held under PN No. 13491, Town and District of Kuantan, State of Pahang Darul Makmur.
Encumbrances/Limitation in title/interest
The property is charged to a financial institution to secure a term loan facility of RM1,581 million and there is no restriction and/or condition attached to the title.
Status of holdings 99 years leasehold expiring on 11 July 2092.
Existing use Commercial building
Parking spaces 149 bays
Lessee Business & Budget Hotels (Kuantan) Sdn. Bhd.
Lease term The property is leased for a term expiring on 14 November 2026.
Date of acquisition 15 November 2011
Cost of acquisition RM75,000,000
Market value RM81,000,000
Date of latest valuation 12 May 2014
Independent valuer Raine & Horne International Zaki + Partners Sdn. Bhd.
Net book value RM81,000,000
YTL Hospitality REIT
038
Review of the Property Market
YTL Hospitality REIT and its subsidiaries (“Group”) own thirteen hospitality properties, nine (9) in Malaysia, three (3) in Australia and one (1) in Japan. With the Malaysian properties, four (4) are located in Kuala Lumpur, two (2) are located in Pahang and one (1) each is located in Perak, Terengganu and Penang. The three (3) Australian properties are located in the capital cit ies of Austral ia’s three most populous states, i.e. New South Wales, Victoria and Queensland. The Japanese property is located in the Niseko area of the island of Hokkaido.
1. MALAYSIA
A. ECONOMY
The Malaysian economy expanded by 4.7% in 2013 (2012: 5.6%), driven by the continued strong growth in domestic demand. Despite the weaker external environment in the first half of the year, domestic demand remained resilient throughout the year, led by robust private sector activity. Private consumption was supported mainly by favourable employment conditions and wage growth. Private investment was underpinned by capital spending in the mining, services and manufacturing sectors. The more moderate growth performance in 2013 was, to a large extent, attributable to developments in the external sector. Slower demand from the advanced and regional economies in the first half of the year contributed to the overall decline in real exports during the year. This was compounded by the continued expansion in real imports throughout 2013 arising from the sustained growth in domestic investment and consumption, which contributed to the contraction in net exports.
The Malaysian economy is expected to remain on a steady growth path in 2014, expanding by 4.5%-5.5%. Domestic demand will remain the key driver of growth, albeit at a more moderate pace. Private investment is forecast to register robust growth for the fifth consecutive year, driven by the ongoing implementation of multi-year projects and the improvement in external demand. Public investment is projected to register a higher growth, supported by both Government and public enterprise capital spending. P r i v a t e con sumpt i on w i l l be underpinned by healthy labour market conditions and sustained income growth. Publ ic consumption is anticipated to record a lower growth due to the ongoing fiscal consolidation.
(Source: Bank Negara Malaysia Annual Report 2013)
B. HOTEL MARKET
Despite the short-term impact from the reduction in Chinese tourist arrivals due to the Malaysia Airlines Flight MH370 incident, the occupancy rate of Malaysia’s hotels are expected to see steady growth in 2014. Chinese tourist arrivals accounted for about 7.3% of total tourist arrivals between January to March 2014, a slight dip from 7.6% during the same period in 2013. In terms of total tourist arrivals, Malaysia recorded a 10% increase between January to March 2014 when compared to the corresponding period in 2013. 3-star hotels will continue to see stagnant-to-modest improvements due to the stable outlook for the domestic tourism market. There are a number of ageing 4-star hotels which are experiencing diff icult ies in maintaining their occupancy levels due to competition
from newer hotels. The performance of 5-star hotels are expected to remain strong due to the healthy demand from international tourists and business travellers.
(Source: Azmi & Co Sdn Bhd, July 2014)
2. AUSTRALIA
A. ECONOMY
Gross Domestic Product grew in the March quarter by 1.1% compared to a 0.8% increase in the previous quarter underpinned by net exports and final consumption expenditure.
Labour market conditions have shown some signs of improvement in recent times with the most recent figures released in May 2014. Seasonally adjusted, unemployment increased by 3,200 persons to 717,100 in May. The number of people employed decreased by 4,800 to 11.564 million with full-time employment up 22,200 people and a fal l in part-t ime employment by 27,000 people. S e a s o n a l l y a d j u s t e d , t h e unemployment ra te rema ined re la t ive ly unchanged at 5 .8% compared to the previous month with a decrease in the participation r a t e f r o m 6 4 . 7 % t o 6 4 . 6 % . Employment growth has slowed considerably when compared to the strong growth during 2010 although with lower net migration compared to its peak in 2008, the growth of the labour supply has also slowed. Indicators of labour demand are consistent with relatively moderate growth of employment over the coming months.
Annual Report 2014
039
Review of the Property Market
In volume terms the trend estimate for Australian retail turnover increased 0.4% in April 2014 and seasonally adjusted turnover rose 0.2% compared to the previous month. The following industries experienced growth in retail trade in April 2014: Food retailing (0.3%), Household goods retailing (0.6%), Cafes, restaurants and takeaway food services (0.7%), Other retailing (0.2%) whilst Clothing, footwear and personal accessory retailing (-0.1%) fell in trend terms and Department stores (0.0%) was relatively unchanged. The household savings ratio continues to be elevated following consumer reactions to the Global Financial Crisis.
The official cash rate stands at 2.50% following a 25 basis points reduction in August 2013. The Reserve Bank of Australia reduced the cash rate by 25 basis points in May 2013, December, October and June 2012 and 50 basis points in the previous month. Rates were softened by 25 basis points in November and December 2011 after remaining unchanged since November 2010.
The Reserve Bank of Australia expects the economy to grow a little below trend in 2014 and gradually picking up to above-trend growth by the end of June 2016.
(Source: Savills Valuations Pty Ltd, June 2014)
B. HOTEL MARKET
AustraliaThe latest data available from Tourism Research Australia indicates that the outlook for international visitor arrivals to Australia remains encouraging. International visitor arrivals in the 12 months to September 2013 grew 5.2% over the previous corresponding period, significantly outpacing the average growth of the last decade. This growth has been largely led by the emerging Asian economies, particularly from China with visitors i nc rea s ing by 18% ove r the corresponding period 12 months ago. This was followed by Taiwan (12.2%), Singapore and India (both 11.5%), and Malaysia (11.4%). Indeed, Asian countries account for seven out of the top 10 regions for visitor growth.
Across Australia Revenue Per Available Room (“RevPAR”) increased by 3.2% to $132.36 in 2013 compared to 2012, which was driven by increases in Melbourne and Sydney, with a recovery in Cairns. Perth suffered a decline due to the mining industry scaling back but came off a strong 2012. Despite the well-publicised decline in trade in Brisbane, the city finished the year strongly (RevPAR up 7.1% in November and 10.9% in December) resulting in a relatively small RevPAR fall of 3.8%. The city clearly still has a shortage of hotel rooms and 2014 will see a spike in trade during the G20 summit in November.
(Source: Savills Valuations Pty Ltd, May 2014)
SydneySydney hotels have performed strongly over the last 12 months. RevPAR is up by 7.7% for the 12 months to March 2014 compared to the same period 2013. The Average Daily Rate (“ADR”) is up 4.8% over the same timeframe, and occupancy has increased 2 percentage points. All of these factors combined clearly point to a strong resurgence in the Sydney hotel market.
Hotels in Sydney are likely to continue to trade well and supply remains limited. Assuming that the Australian dollar continues to correct against the US dollar and other leading currencies, Australia will become more affordable for international tourists. This, combined with an increase in domestic travel due to the lower dollar, is expected to increase demand and higher rates in Australian hotels. Sydney is one of the “must visits” to Australia for overseas tourists therefore Sydney should benefit from an increasing number of visitors requiring overnight accommodation.
(Source: Savills Valuations Pty Ltd, May 2014)
BrisbaneIn line with rest of the Eastern Seaboard, visitor nights in Brisbane are forecast to record extremely strong growth over the next 10 years. Tourism Research Australia is currently forecasting growth to average 2.7% per annum during this period. Whilst this is slightly below the forecast average national growth rate of 2.9% per annum over the next decade, this is still a very strong outlook for demand in Brisbane.
YTL Hospitality REIT
040
Review of the Property Market
Occupancy rates over the last two years have remained relatively stable. This is also true of ADR, which are currently average $184 over the last 12 months. RevPAR has actually decreased by 0.2% to $143 over the same timeframe. This makes Brisbane the poorest performing market of the Eastern Seaboard, but the fall is starting to level off and there are signs of improvement.
(Source: Savills Valuations Pty Ltd, May 2014)
MelbourneSimilar to Sydney, hotels in Melbourne have performed well on a year-on-year basis. According to the latest data available from Smith Travel Research, RevPAR is up by 4.4% over the last 12 months (March 2013 compared to March 2014), ADR are up 2.4% over the same timeframe, and occupancy levels remain strong.
Sydney has a good spread of midweek corporate and weekend leisure demand, which helps keep occupancy above 85% for the year and avoid major lulls in trade during the holiday season. Due to higher supply in Melbourne, occupancy occasionally falls below 75%. More hotels are planned in Melbourne, which should prevent occupancy reaching the levels experienced in Sydney.
(Source: Savills Valuations Pty Ltd, May 2014)
3. JAPAN
A. ECONOMY
Japan’s economy has been continuing to recover moderately. Japan’s real GDP expanded for a fifth consecutive quarter in Q1/2014 at a rate of 1.6% QoQ, or 6.7% on an annualised basis.
Influencing this movement was the national consumption tax increase from 5% to 8%, which came into effect on 1 April and spurred a front-loaded increase in housing investment and private consumption. As of July, the Bank of Japan (BOJ) asserted that Japan’s economy continues to recover moderately, although a decline in demand subsequent to the consumption tax hike has been observed.
Japan’s unemployment rate rose 0.2 points in June after hitting a 16-year low of 3.5% in May. Nonetheless, the ratio of job offers to job seekers remained positive at 1.10 – its highest rate since June 1992 – suggesting more people have started seeking work as they see the labour market improving. Total wages picked up a marginal 0.6% YoY on average in May, with a higher 1.4% growth rate for regular employees. Although still negative in real terms, wage appreciation fostered by labour shortages in certain industries is expected to help the economy rebound in the third quarter from the tax-related slump in consumer spending. Under these circumstances, BOJ expects industrial production to follow a moderate growth trend, with CPI increasing at a rate of around 1.25% YoY for some time.
(Source: Savills Japan Co., Ltd., August 2014)
B. HOTEL MARKET
JapanAlthough the number of foreign visitors dropped in 2009 due to the worldwide recession caused by the Lehman Shock, it showed a strong recovery in 2010. Due to the Great East Japan Earthquake and the accident of Fukushima nuclear plant, the number of foreign visitors dropped sharply again in March and April 2011. However, the number of
foreign visitors for sightseeing recovered in 2012 almost to the same level of 2010.
The promotional campaign by the Japanese government, a weak yen, and worldwide economic improvement accelerated the recovering trend in 2013. The annual visitors of over 10 million in 2013 was the highest and the first time in history of Japan. Although territorial and historical disputes with China and South Korea remain, the stable increase of visitors would be expected considering the growing number of visitors from other Asian countries.
(Source: Savills Japan Co., Ltd., May 2014)
NisekoThe total number of over-night stay in the Niseko area has dramatically increased in 10 years. Although the Great East Japan Earthquake in 2011 refrained foreign visitors from coming to the Niseko area in a short term, it did not affect so much to the resort hotels in the Niseko area because the disaster happened in March, which was the end of winter season, and it had completely recovered in 2012 owing to its far distance from Fukushima prefecture.
(Source: Savills Japan Co., Ltd., May 2014)
4. CONCLUDING COMMENTS
Despite the challenges in some markets, we are confident that our proactive asset management, financial, marketing and operations strategy will continue to be able to mitigate the relevant risks and enhance the value of the properties and improve the yields and returns of the Group.
Annual Report 2014
041
Notice of Annual General Meeting
NOTICE IS HEREBY GIVEN THAT the Second Annual General Meeting of YTL Hospitality REIT (“Trust”) will be held at Starhill 2, Level 4, JW Marriott Hotel Kuala Lumpur, 183 Jalan Bukit Bintang, 55100 Kuala Lumpur on Monday, the 15th day of September, 2014 at 3.00 p.m. to transact the following business:-
ORDINARY BUSINESS
To lay before the meeting the Audited Financial Statements for the financial year ended 30 June Please refer2014 together with the Reports attached thereon. Explanatory Note A
By Order of the Boardof Pintar Projek Sdn Bhd(Manager for YTL Hospitality REIT)
Ho Say KengCompany Secretary
Kuala Lumpur22 August 2014
Notes:-
1. A unitholder entitled to attend the meeting may appoint a proxy to attend instead of him. A proxy may, but need not, be a unitholder of YTL Hospitality REIT. A unitholder other than an authorised nominee shall not be entitled to appoint more than one proxy to attend the same meeting and where such unitholder appoints more than one proxy to attend the same meeting, such appointment shall be invalid.
2. Where a unitholder is an authorised nominee as defined under the Securities Industry (Central Depositories) Act, 1991, it may appoint at least one proxy (but not more than two proxies) in respect of each securities account it holds in units standing to the credit of the said securities account.
3. Where a unitholder is an exempt authorised nominee which holds units in the Trust for multiple beneficial owners in one securities account (“Omnibus Account”), there is no limit to the number of proxies which the exempt authorised nominee may appoint in respect of each Omnibus Account it holds.
4. The form of proxy and the Power of Attorney or other authority (if any) under which it is signed or notarially certified copy thereof must be lodged at the office of Pintar Projek Sdn Bhd at 11th Floor, Yeoh Tiong Lay Plaza, 55 Jalan Bukit Bintang, 55100 Kuala Lumpur, not less than 48 hours before the time appointed for the meeting or any adjourned meeting thereof.
5. In the case of a corporation, the form of proxy should be executed under its common seal or under the hand of some officer of the corporation duly authorised in writing on its behalf.
6. For the purpose of determining the unitholders who shall be entitled to attend the meeting, the Manager shall request Bursa Malaysia Depository Sdn Bhd, in accordance with Section 34(1) of the Securities Industry (Central Depositories) Act, 1991 to issue a General Meeting Record of Depositors as at 8 September 2014. Only a depositor whose name appears on the General Meeting Record of Depositors as at 8 September 2014 shall be entitled to attend the said meeting or appoint proxy to attend on his behalf.
Explanatory Note A
There shall be no voting on the aforesaid Ordinary Business given that the laying of the Audited Financial Statements for the financial year ended 30 June 2014 of YTL Hospitality REIT together with the Reports attached thereon before the Unitholders at the Annual General Meeting is meant for discussion only in accordance with Clause 15.33A of the Guidelines on Real Estate Investment Trusts issued by the Securities Commission Malaysia.
YTL Hospitality REIT
042
MANAGER
Pintar Projek Sdn Bhd
MANAGER’S REGISTERED OFFICE/PRINCIPAL PLACE OF BUSINESS
11th Floor, Yeoh Tiong Lay Plaza55 Jalan Bukit Bintang55100 Kuala LumpurTel • 603-2117 0088/
603-2142 6633Fax • 603-2141 2703
BOARD OF DIRECTORS OF THE MANAGER
Chief Executive OfficerTan Sri Dato’ (Dr) Francis Yeoh Sock PingPSM, CBE, FICE, SIMP, DPMS, DPMP, JMN, JPHon LLD (Nottingham), Hon DEng (Kingston),BSc (Hons) Civil Engineering, FFB, F Inst D, MBIM, RIM
Executive DirectorsDato’ Yeoh Seok KianDSSABSc (Hons) Bldg, MCIOB, FFB
Dato’ Mark Yeoh Seok KahDSSALLB (Hons)
Dato’ Hj Mohamed Zainal Abidin Bin Hj Abdul KadirDPMP, PMP, AMN, PPN, PJK, OStJ, JP
Yeoh Keong ShyanLLB (Hons)
Independent Non-Executive DirectorsDato’ (Dr) Yahya Bin IsmailDPMJ, DPCM, DPMP, KMN, PPTBachelor of Veterinary Science
Dato’ Ahmad Fuaad Bin Mohd DahalanABS, DIMP, SIMPBA (Hons)
Eu Peng Meng @ Leslie EuBCom, FCILT
MANAGEMENT TEAM
Datin Kathleen Chew Wai LinLegal Advisor
Ho Say KengAccountant/Company Secretary
Eoon Whai SanGeneral Manager
COMPANY SECRETARY OF THE MANAGER
Ho Say Keng
TRUSTEE
Maybank Trustees Berhad8th Floor, Menara Maybank100 Jalan Tun Perak50050 Kuala LumpurTel • 603-2078 8363Fax • 603-2070 9387Email • [email protected]
REGISTRAR
Pintar Projek Sdn Bhd11th Floor, Yeoh Tiong Lay Plaza55 Jalan Bukit Bintang55100 Kuala LumpurTel • 603-2117 0088/
603-2142 6633Fax • 603-2141 2703
AUDITORS
HLB Ler Lum (AF 0276)Chartered Accountants(A member of HLB International)
PRINCIPAL BANKERS OF THE FUND
AmBank (M) BerhadMalayan Banking BerhadOCBC Bank (Malaysia) Berhad
STOCK EXCHANGE LISTING
Bursa Malaysia Securities BerhadMain Market (16.12.2005)
Corporate Information
Annual Report 2014
043
TAN SRI DATO’ (DR) FRANCIS YEOH SOCK PING
Malaysian, aged 60, has been the Chief Executive Officer and Executive Director of Pintar Projek Sdn Bhd since 10 March 2005. Tan Sri Francis studied at Kingston University in the United Kingdom, where he obtained a Bachelor of Science (Hons) Degree in Civil Engineering and was conferred an Honorary Doctorate of Engineering in 2004. On 9 July 2014, Tan Sri Francis was conferred an Honorary Degree of Doctor of Laws from University of Nottingham. He became the Managing Director of YTL Corporation Berhad Group in 1988 which, under his stewardship, has grown from a single listed company into a force comprising five listed entities ie. YTL Corporation Berhad, YTL Power International Berhad, YTL Land & Development Berhad, YTL e-Solutions Berhad and YTL Hospitality REIT.
He is presently the Managing Director of YTL Corporation Berhad, YTL Power International Berhad and YTL Land & Development Berhad, all listed on the Main Market of Bursa Malaysia Securities Berhad. He is the Executive Chairman and Managing Director of YTL e-Solutions Berhad which is listed on the ACE Market of Bursa Malaysia Securities Berhad. He is also the Executive Chairman of YTL Starhill Global REIT Management Limited, the manager of Starhill Global REIT, a vehicle listed on the Main Board of the Singapore Exchange Securities Trading Limited (SGX-ST). Tan Sri Francis sits on the boards of several public companies such as YTL Cement Berhad and YTL Industries Berhad, and private uti l i t ies companies
including Wessex Water Limited and Wessex Water Services Limited in Eng land and Wa les , and YTL PowerSeraya Pte Limited in Singapore. He also sits on the board of trustees of YTL Foundation. Tan Sri Francis is also an Independent Non-Executive Director of The Hong Kong and Shanghai Banking Corporat ion Limited.
He is a Founder Member of the Malaysian Business Council and The Capital Markets Advisory Council, member of The Nature Conservancy Asia Pacific Council and the Asia Business Council, Trustee of the Asia Society and Chairman for South East Asia of the International Friends of the Louvre. He is also a member of the Advisory Council of London Business School, Wharton School and INSEAD. He served as a member of the Barclays Asia-Pacific Advisory Committee from 2005 to 2012.
He was ranked by both Fortune and Businessweek magazines as Asia’s 25 Most Powerful and Influential Business Personalities and one of Asia’s Top Executives by Asiamoney. He won the inaugural Ernst & Young’s Master Entrepreneur in Malaysia in 2002 and was named as Malaysia’s CEO of the Year by CNBC Asia Pacific in 2005.
In 2006, he was awarded the Commander of the Most Excellent Order of the British Empire (CBE) by Her Majesty Queen Elizabeth II, and received a prestigious professional accolade when made a Fellow of the Institute of Civil Engineers in London in 2008. He was the Primus Inter Pares Honouree of the 2010 Oslo Business for Peace Award, for his advocacy of socially responsible
business ethics and practices. The Award was conferred by a panel of Nobel Laureates in Oslo, home of the Nobel Peace Prize. He also received the Corporate Social Responsibility Award at CNBC’s 9th Asia Business Leaders Awards 2010.
DATO’ YEOH SEOK KIAN
Malaysian, aged 56, has been an Executive Director of Pintar Projek Sdn Bhd since 10 March 2005. He graduated from Heriot-Watt University, Edinburgh, United Kingdom in 1981 with a Bachelor of Science (Hons) Degree in Building. He attended the Advance Management Programme conducted by Wharton Business School, University of Pennsylvania in 1984. Dato’ Yeoh is a Fellow of the Faculty of Building, United Kingdom, as well as a Member of the Chartered Institute of Building (UK). He is also the Deputy Managing Director of YTL Corporation Berhad and YTL Power International Berhad and the Executive Director of YTL Land & Development Berhad, all listed on the Main Market of Bursa Malaysia Securities Berhad. Dato’ Yeoh also serves on the boards of other public companies such as YTL Cement Berhad, YTL Industries Berhad and The Kuala Lumpur Performing Arts Centre, and private utilities companies, Wessex Water Limited in England and Wales and YTL PowerSeraya Pte Limited in Singapore, as well as YTL Starhill Global REIT Management Limited, the manager of Starhill Global REIT, a vehicle listed on the Main Board of the Singapore Exchange Securities Trading Limited (SGX-ST).
Profile of the Board of Directors
YTL Hospitality REIT
044
DATO’ (DR) YAHYA BIN ISMAIL
Malaysian, aged 86, has been an Independent Non-Executive Director of Pintar Projek Sdn Bhd since 18 May 2005. He was formerly with the Government and his last appointment was the Director General of the National Livestock Authority Malaysia. He was with the Totalisator Board Malaysia from 1982 to 1990 and served as its Chairman since 1986. Dato’ Yahya is a Director of YTL Corporation Berhad and YTL Power International Berhad, both listed on the Main Market of Bursa Malaysia Securities Berhad. He also sits on the board of Metroplex Berhad.
DATO’ AHMAD FUAAD BIN MOHD DAHALAN
Malaysian, aged 64, was appointed to the Board on 17 January 2012 as an Independent Non-Executive Director. Dato’ Ahmad Fuaad holds a Bachelor of Arts (Hons) degree from the University of Malaya. He was attached with Wisma Putra, Ministry of Foreign Affairs as Malaysian Civil Service (“MCS”) Officer in April 1973 before joining Malaysia Airlines in July 1973. While in Malaysia Airlines, Dato’ Ahmad Fuaad served various posts and his last position was as the Managing Director. He was formerly a director of Lembaga Penggalakan Pelanchongan Malaysia, Malaysia Industry-Government Group for High Technology and Malaysia Airports Holdings Berhad. Currently, Dato’ Ahmad Fuaad is the Chairman of Tokio Marine Insurans (Malaysia) Berhad and a Director of Hong Leong Capital Berhad and YTL e-Solutions Berhad, both listed on the Main Market of Bursa Malaysia Securities Berhad.
DATO’ MARK YEOH SEOK KAH
Malaysian, aged 49, has been an Executive Director of Pintar Projek Sdn Bhd since 17 January 2012. He graduated from King’s College, University of London, with an LLB (Hons) and was subsequently called to the Bar at Gray’s Inn, London, in 1988. Dato’ Mark Yeoh joined YTL Group in 1989 and is presently the Executive Director responsible for the YTL Hotels and Resorts Division. In addition, he is also part of YTL Power’s Mergers & Acquisitions Team and was involved in the acquisition of ElectraNet SA (Australia), Wessex Water Limited (UK), P.T. Jawa Power (Indonesia) and PowerSeraya Limited (Singapore). He serves as an Executive Director of YTL Corporation Berhad and YTL Power International Berhad, both listed on the Main Market of Bursa Malaysia Securities Berhad. He is also a board member of YTL Cement Berhad and private utilities companies, Wessex Water Limited and Wessex Water Services Limited in Eng land and Wa les , and YTL PowerSeraya Pte Limited in Singapore.
DATO’ HJ MOHAMED ZAINAL ABIDIN BIN HJ ABDUL KADIR
Malaysian, aged 74, has been an Executive Director of Pintar Projek Sdn Bhd since 10 March 2005. He qualified as a teacher in 1963 from the Day Training Centre for Teaching in Ipoh, Perak, and was in the teaching profession from 1964 to 1981 prior to entering the business arena as a property developer in May 1981. Dato’ Hj Mohamed Zainal Abidin also sits on the boards of several reputable private limited companies involved in construction, property development and resort operations such as Pakatan Perakbina Sdn Bhd, Seri Yakin Sdn Bhd and Syarikat Pelanchongan Pangkor Laut Sendirian Berhad.
EU PENG MENG @ LESLIE EU
Malaysian, aged 79, has been an Independent Non-Executive Director of Pintar Projek Sdn Bhd since 10 March 2005. Mr Leslie Eu graduated with a Bachelor of Commerce degree from the University College Dublin, Ireland. He is a Fellow of the Chartered Institute of Logistics and Transport and was one of the founding directors of Global Maritime Ventures Berhad. He has been in the shipping business for more than 50 years. He was the f irst Chief Executive Off icer of Malaysian International Shipping Corpora t ion Berhad f rom the
Profile of the Board of Directors
Annual Report 2014
045
company’s inception in 1969 until his early retirement in 1985. He was a Board Member of Lembaga Pelabuhan Kelang from 1970 to 1999 and Lloyd’s Register of Shipping (Malaysia) Bhd from 1983 to 2009. In 1995, he was presented the Straits Shipper Transport Personality award by the Minister of Transport. He was appointed by the United Nations Conference on Trade and Development as one of the 13 experts to assist the developing nations in establishing their maritime fleets. Mr Leslie Eu presently serves on the boards of YTL Corporation Berhad, YTL Land & Development Berhad and YTL Cement Berhad.
YEOH KEONG SHYAN
Malaysian, aged 28, has been an Executive Director of Pintar Projek Sdn Bhd since 18 January 2011. He graduated from the University of Nottingham with an LLB (Hons) in 2008. He obtained the Capital Markets and Financial Advisory Services (CMFAS) Certification in 2010. He joined YTL Group in 2009 and is presently engaged in the YTL Hotels and Resorts as well as the Property Development Divisions.
Profile of the Board of Directors
Notes:
1. Family Relationship with any Director and/or Major Unitholder Tan Sri Dato’ (Dr) Francis Yeoh Sock Ping, Dato’ Yeoh Seok Kian and Dato’ Mark Yeoh Seok Kah
are siblings. Tan Sri Dato’ Seri (Dr) Yeoh Tiong Lay, the father of Tan Sri Dato’ (Dr) Francis Yeoh Sock Ping, Dato’ Yeoh Seok Kian and Dato’ Mark Yeoh Seok Kah, is a deemed major shareholder of YTL Corporation Berhad, which is a major unitholder of YTL Hospitality REIT. Mr Yeoh Keong Shyan is a son of Tan Sri Dato’ (Dr) Francis Yeoh Sock Ping. Save as disclosed herein, none of the Directors of the Manager has any family relationship with any other directors and/or major unitholders of YTL Hospitality REIT.
2. Conflict of Interest Save for the Director’s interest in YTL Hospitality REIT (as disclosed under Directors’ Interests in
the Manager’s Report) and the transactions with companies related to the Manager (as disclosed in the notes to the financial statements), no conflict of interest has arisen during the financial year under review.
3. Conviction for Offences None of the Directors of the Manager has been convicted for any offences other than traffic
offences within the past ten (10) years.
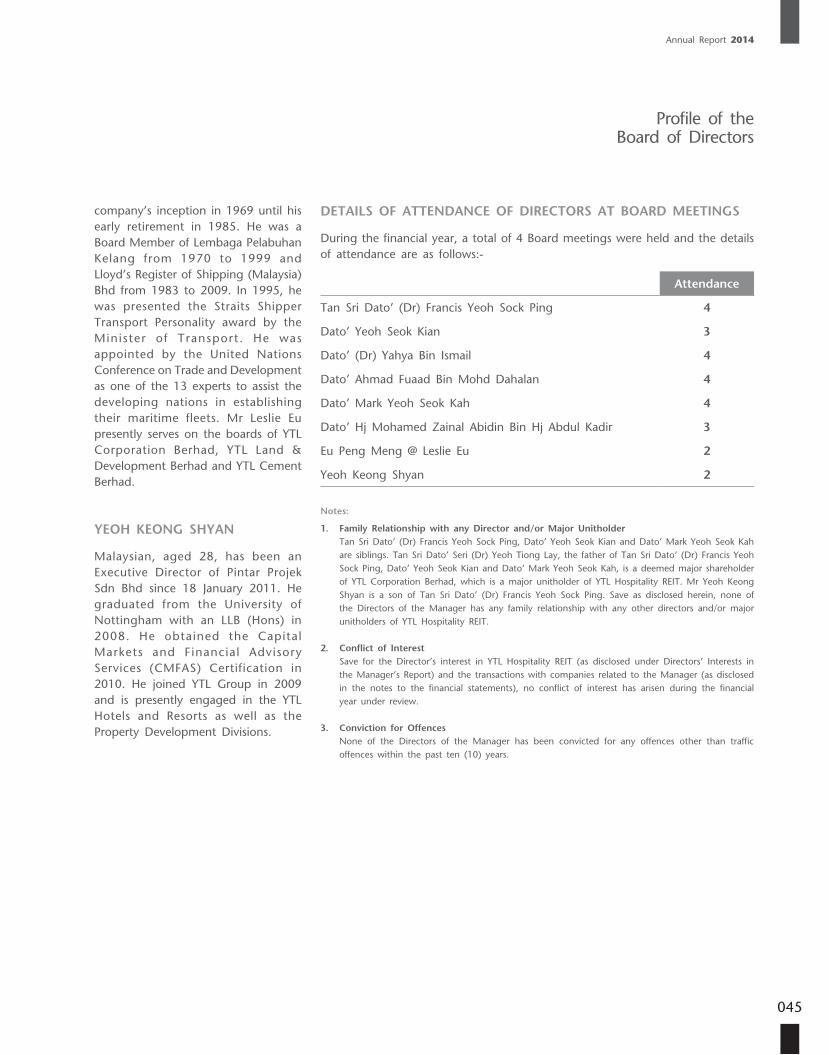
DETAILS OF ATTENDANCE OF DIRECTORS AT BOARD MEETINGS
During the financial year, a total of 4 Board meetings were held and the details of attendance are as follows:-
Attendance
Tan Sri Dato’ (Dr) Francis Yeoh Sock Ping 4
Dato’ Yeoh Seok Kian 3
Dato’ (Dr) Yahya Bin Ismail 4
Dato’ Ahmad Fuaad Bin Mohd Dahalan 4
Dato’ Mark Yeoh Seok Kah 4
Dato’ Hj Mohamed Zainal Abidin Bin Hj Abdul Kadir 3
Eu Peng Meng @ Leslie Eu 2
Yeoh Keong Shyan 2
YTL Hospitality REIT
046
YTL Hospitality REIT (“YTL REIT” or “Trust) was established on 18 November 2005 pursuant to a trust deed (as restated by the deed dated 3 December 2013) (“Deed”) entered into between Pintar Projek Sdn Bhd (“PPSB” or “Manager”) and Maybank Trustees Berhad (“Trustee”), as the manager and trustee, respectively, of the Trust. YTL REIT has been listed on the Main Market of Bursa Malaysia Securities Berhad (“Bursa Securities”) since 16 December 2005.
The Board of Directors of PPSB (“Board”) is firmly committed to ensuring that the Manager implements and operates good corporate governance practices in its overall management of the Trust and its subsidiaries (“YTL REIT Group”). In implementing its system of corporate governance, the Directors have been guided by the measures set out in the Guidelines on Real Estate Investment Trusts (“REIT Guidelines”) issued by the Securities Commission Malaysia (“SC”), the Main Market Listing Requirements of Bursa Securities (“Listing Requirements”) and the Malaysian Code on Corporate Governance 2012 (“Code”).
THE ROLE OF THE MANAGER
YTL REIT is managed and administered by PPSB, who has the primary objectives of: (a) providing unitholders of the Trust (“Unitholders”) with stable cash distributions with the potential for sustainable growth, principally from the ownership of properties; and (b) enhancing the long-term value of YTL REIT’s units (“Units”).
The Manager is required to ensure that the business and operations of YTL REIT are carried on and conducted in a proper, diligent and efficient manner, and in accordance with acceptable and efficacious business practices in the real estate investment trust industry in Malaysia. Subject to the provisions of the Deed, the Manager has full and complete powers of management and must manage YTL REIT (including all assets and liabilities of the Trust) for the benefit of its Unitholders.
The Board recognises that an effective corporate governance framework is critical in order to achieve these objectives, to fulfil its duties and obligations and to ensure that YTL REIT continues to perform strongly.
The general functions, duties and responsibilities of the Manager include the following:
(a) to manage the YTL REIT Group’s assets and liabilities for the benefit of Unitholders;
(b) to be responsible for the day-to-day management of the YTL REIT Group;
(c) to carry out activities in relation to the assets of the YTL REIT Group in accordance with the provisions of the Deed;
(d) to set the strategic direction of the YTL REIT Group and submit proposals to the Trustee on the acquisition, divestment or enhancement of assets of the YTL REIT Group;
(e) to issue an annual report and quarterly reports of YTL REIT to Unitholders within 2 months of YTL REIT’s financial year end and the end of the periods covered, respectively; and
(f) to ensure that the YTL REIT Group is managed within the ambit of the Deed, the Capital Markets and Services Act 2007 (as amended) and other securities laws, the Listing Requirements, the REIT Guidelines and other applicable laws.
CONFLICTS OF INTEREST AND RELATED PARTY TRANSACTIONS
The Deed provides that the Manager, the Trustee and any delegate of either of them shall avoid conflicts of interest arising or, if conflicts arise, shall ensure that the YTL REIT Group is not disadvantaged by the transaction concerned. The Manager must not make improper use of its position in managing the YTL REIT Group to gain, directly or indirectly, an advantage for itself or for any other person or to cause detriment to the interests of Unitholders.
In order to deal with any conflict-of-interest situations that may arise, any related party transaction, dealing, investment or appointment carried out for or on behalf of the YTL REIT Group involving parties related to the Trust must be executed on terms that are the best available to the Trust and which are no less favourable than an arm’s length transaction between independent parties.
The Manager may not act as principal in the sale and purchase of real estate, securities and any other assets to and from the YTL REIT Group. “Acting as principal” includes a reference to:
(a) dealing in or entering into a transaction on behalf of a person associated with the Manager;
(b) acting on behalf of a corporation in which the Manager has a controlling interest; or
(c) the Manager acting on behalf of a corporation in which the Manager’s interest and the interests of its Directors together constitute a controlling interest.
Statement on Corporate Governancefor the financial year ended 30 June 2014
Annual Report 2014
047
Statement on Corporate Governance
for the financial year ended 30 June 2014
In addition, the Manager must not, without the prior approval of the Trustee, invest any moneys available for investment under the Deed in any securities, real estate or other assets in which the Manager or any officer of the Manager has a financial interest or from which the Manager or any officer of the Manager derives a benefit.
In dealing with any related party transactions that may arise, no real estate may be acquired from, or disposed to, a related party of the Manager unless the following criteria are satisfied:
(a) A valuation must be undertaken of the real estate by an approved valuer, in accordance with the Deed, and a valuation report given to the Trustee where the date of valuation must not be more than 6 months before the date of the sale and purchase agreement provided that since the last valuation, no circumstances have arisen to materially affect the valuation and that, where applicable, the valuation has not been revised by the SC;
(b) All related party transactions involving real estate must be transacted at a price equivalent to the value assessed in the valuation report, consented to by the Trustee and consistent with the investment objectives and strategy of the Trust; and
(c) the real estate may be transacted at a price other than as specified in (b) above provided that:
(i) for acquisitions, the price is not more than 110% of the value assessed in the valuation report referred to in (a) above;
(ii) for disposals, the price is not less than 90% of the value assessed in the valuation report referred to in (a) above; and
(d) the Trustee provides a written confirmation that the transaction is based on normal commercial terms, at arm’s length and not prejudicial to the Unitholders’ interests.
The Manager must inform Unitholders through an announcement to Bursa Securities of the Trustee’s written confirmation. Where the transaction is conditional upon the approval of Unitholders, such approval must be sought prior to completion of the transaction.
In this regard, the Manager adheres strictly to the provisions of the REIT Guidelines which prohibit the Manager and its related parties from voting their Units at any meeting of Unitholders convened unless an exemption is obtained from the SC.
ROLES & RESPONSIBILITIES OF THE BOARD
The Manager is led and managed by an experienced Board with a wide and varied range of expertise. This broad spectrum of skills and experience gives added strength to the leadership, thus ensuring the Manager is under the oversight and guidance of an accountable and competent Board. The Directors recognise the key role they play in charting the strategic direction, development and control of the Manager. Key elements of the Board’s stewardship responsibilities include those set out in the Code:
• Reviewing and adopting strategic plans for the YTL REIT Group;
• Overseeing the conduct of the YTL REIT Group’s business operations and financial performance;
• Identifying the principal risks affecting the YTL REIT Group’s businesses and maintaining a sound system of internal control and mitigation measures;
• Succession planning;
• Overseeing the development and implementation of Unitholder communication policies; and
• Reviewing the adequacy and integrity of the YTL REIT Group’s management information and internal control system.
The Chief Executive Officer and Executive Directors are accountable to the Board for the profitability and development of the YTL REIT Group, consistent with the primary aim of enhancing long-term Unitholder value. The Independent Non-Executive Directors have the experience and business acumen necessary to carry sufficient weight in the Board’s decisions and the presence of these Independent Non-Executive Directors brings an additional element of balance to the Board as they do not participate in the day-to-day running of YTL REIT.
The differing roles of Executive and Non-Executive Directors are delineated, both having fiduciary duties to Unitholders. Executive Directors have a direct responsibility for business operations whereas Non-Executive Directors have the necessary skill and experience to bring an independent and objective judgment to bear on issues of strategy, performance and resources brought before the Board. The Executive Directors are responsible for the Manager’s operations and for ensuring that the strategies proposed by the executive management are fully discussed and examined, and take account of the long term interests of the Unitholders.
YTL Hospitality REIT
048
Statement on Corporate Governancefor the financial year ended 30 June 2014
Board meetings are scheduled with due notice in advance at least four times a year in order to review and approve the interim and annual financial statements. Additional meetings may also be convened on an ad-hoc basis when significant issues arise relating to the Trust. The Board met four times during the financial year ended 30 June 2014.
The Directors have full and unrestricted access to all information pertaining to the business and affairs of the YTL REIT Group to enable them to discharge their duties. Prior to Board meetings, all Directors receive the agenda together with a comprehensive set of Board papers containing information relevant to the business of the meeting. This allows the Directors to obtain further explanations or clarifications, where necessary, in order to be properly briefed before each meeting.
All Directors have full access to the advice and services of the Company Secretary who ensures that Board procedures are adhered to at all times during meetings and advises the Board on matters including corporate governance issues and the Directors’ responsibilities in complying with relevant legislation and regulations. The Company Secretary works very closely with management for timely and appropriate information, which will then be passed on to the Directors. In accordance with the Board’s procedures, deliberations and conclusions in Board meetings are recorded by the Company Secretary, who ensures that accurate and proper records of the proceedings of Board meetings and resolutions passed are recorded and kept in the statutory register at the registered office of the Manager.
COMPOSITION & INDEPENDENCE OF THE BOARD
The Board currently has 8 Directors comprising 5 executive members and 3 non-executive members, all of whom are independent. This is in compliance with the provisions of the Listing Requirements and the REIT Guidelines for at least one-third of the Board to be independent.
The appointment of Directors is undertaken by the Board as a whole. The Chief Executive Off icer makes recommendations on the suitability of candidates nominated for appointment to the Board and, thereafter, the final decision lies with the entire Board to ensure that the resulting mix of experience and expertise of members of the Board is sufficient to address the issues affecting the Manager. In its deliberations, the Board is required to take into account the integrity, professionalism, skill, knowledge, expertise and experience of the proposed candidate.
Directors’ remuneration is decided in line with the objective recommended by the Code to determine the remuneration for Directors so as to attract and retain Directors of the calibre needed to successfully carry on the Manager’s operations. The Executive Directors’ remuneration consists of basic salary, other emoluments and other customary benefits as appropriate to a senior management member. In general, the component parts of remuneration are structured so as to link rewards to the overall performance of YTL REIT. In the case of Non-Executive Directors, the level of remuneration reflects the contribution, experience and responsibilities undertaken by the particular non-executive concerned.
BOARD COMMITMENT
The Directors are fully cognisant of the importance and value of attending seminars, training programmes and conferences in order to update themselves on developments and changes in the REIT industry, as well as wider economic, financial and governance issues to enhance their skills, knowledge and expertise in their respective fields. The Board will continue to evaluate and determine the training needs of its Directors on an ongoing basis.
Throughout the financial year under review, the Directors attended various conferences, programmes and speaking engagements covering areas that included corporate governance, information technology, leadership, legal, finance and business management which they collectively or individually considered useful in discharging their stewardship responsibilities. The conferences, seminars and training programmes attended by one or more of the Directors covered the following areas:-
• Corporate Governance
– Integrating Corporate Governance with Business Acumen & Corporate Disclosure
• Information Technology
– Mobile World Congress 2014
• Leadership, Legal, Finance and Business Management
– Dialogue on Sustainability & Diversity
– Encouraging Private Participation in Asia’s Infrastructure Development
– Goods and Services Tax
– Finance for Non-Finance Managers
– Infrastructure, Power & Utilities Roundtable
– Leveraging the Private Sector to Accelerate Infrastructure Development in Asia
Annual Report 2014
049
Statement on Corporate Governance
for the financial year ended 30 June 2014
– Personal Data Protection Act 2010 and The Competition Act 2010: Implications on Capital Market
– Roundtable Discussion on Financial Reporting
– YTL Leadership Conference 2013
INTEGRITY IN FINANCIAL REPORTING
The Directors are responsible for ensuring that financial statements of the Trust are drawn up in accordance with applicable approved accounting standards in Malaysia, the provisions of the Companies Act 1965, the REIT Guidelines and the Deed. In presenting the financial statements, the Manager has used appropriate accounting policies, consistently applied and supported by reasonable and prudent judgments and estimates. The Directors also strive to ensure that financial reporting presents a fair and understandable assessment of the position and prospects of YTL REIT. Interim financial statements are reviewed and approved by the Directors prior to release to the relevant regulatory authorities.
RISK MANAGEMENT & INTERNAL CONTROL
The Manager’s internal audit function is undertaken by the Internal Audit department of its parent company, YTL Corporation Berhad (“YTLIA”). YTLIA reports directly to the Audit Committee of YTL Corporation Berhad and to the Board on matters pertaining to the Manager and the Trust.
The activities of the internal audit function during the year under review included:-
• Developing the annual internal audit plan and proposing this plan to the Board;
• Conducting scheduled internal audit engagements, focusing primarily on the effectiveness of internal controls and recommending improvements where necessary;
• Conducting follow-up reviews to assess if appropriate action has been taken to address issues highlighted in audit reports; and
• Presenting audit findings to the Board for consideration.
None of the weaknesses or issues identified during the review for the financial year has resulted in non-compliance with any relevant policies or procedures, listing requirements or recommended industry practices that would require disclosure in the Trust’s Annual Report.
The Manager’s system of internal control will continue to be reviewed, enhanced and updated in line with changes in the operating environment. The Board will seek regular assurance on the continuity and effectiveness of the internal control system through independent appraisals by YTLIA. The Board is of the view that the current system of internal control in place is effective to safeguard the interests of the YTL REIT Group.
The Board has established a formal and transparent arrangement for maintaining an appropriate relationship with the auditors of YTL REIT. YTL REIT’s auditors report their findings to members of the Board as part of the audit process on the statutory financial statements each financial year. From time to time, the auditors highlight matters that require attention to the Board.
CORPORATE DISCLOSURE & COMMUNICATION WITH SHAREHOLDERS
The Manager values dialogue with Unitholders and investors as a means of effective communication that enables the Board to convey information about the YTL REIT Group’s performance, corporate strategy and other matters affecting Unitholders’ interests. The Board recognises the importance of timely dissemination of information to Unitholders and, accordingly, ensures that they are well informed of any major developments of YTL REIT. Such information is communicated through the annual report, the Trust’s various disclosures and announcements to Bursa Securities, including quarterly and annual results, and the corporate website.
Corporate information, annual financial results, governance information, business reviews and future plans are disseminated through the Annual Report, whilst current corporate developments are communicated via the company’s website, www.ytlhospitalityreit.com, in addition to prescribed information, including financial results, announcements, circulars, prospectuses and notices, which is released through the official website of Bursa Securities.
The Chief Executive Officer and Executive Directors meet with analysts, institutional Unitholders and investors throughout the year to provide updates on strategies and new developments. However, price-sensitive information and information that may be regarded as undisclosed material information about YTL REIT is not disclosed in these sessions until after the requisite announcements to Bursa Securities have been made.
This statement was approved by the Board on 31 July 2014.
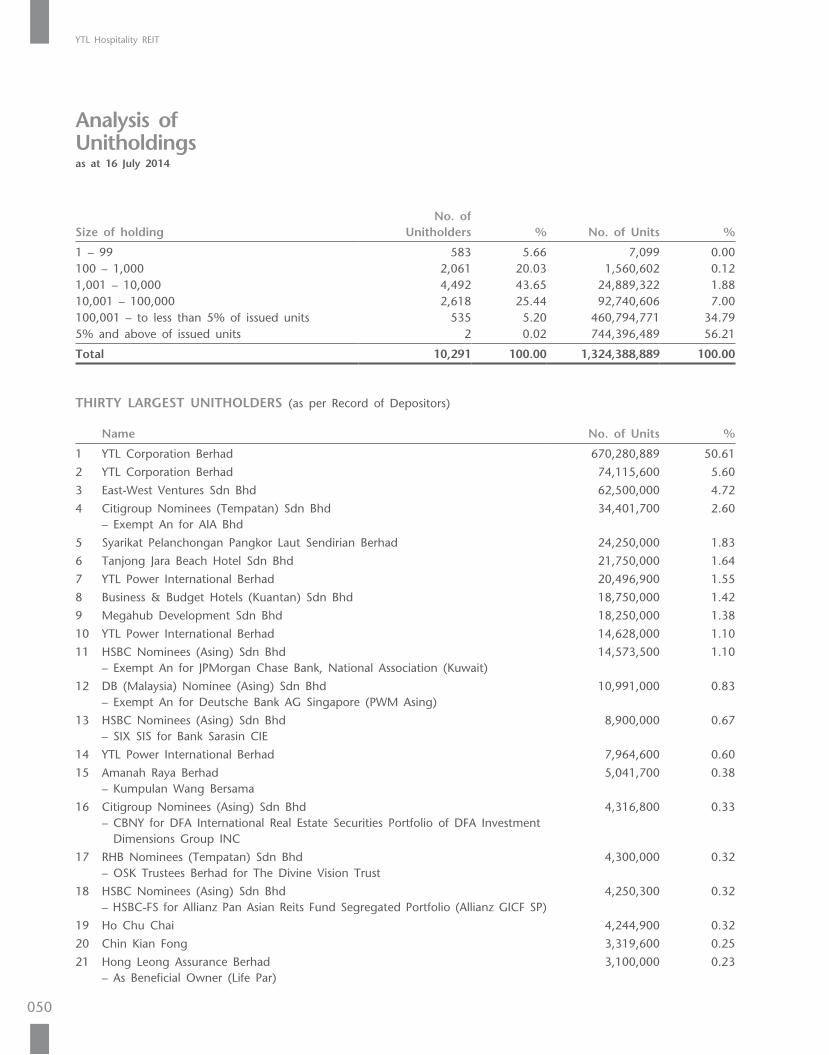
YTL Hospitality REIT
050
Size of holdingNo. of
Unitholders % No. of Units %
1 – 99 583 5.66 7,099 0.00100 – 1,000 2,061 20.03 1,560,602 0.121,001 – 10,000 4,492 43.65 24,889,322 1.8810,001 – 100,000 2,618 25.44 92,740,606 7.00100,001 – to less than 5% of issued units 535 5.20 460,794,771 34.795% and above of issued units 2 0.02 744,396,489 56.21
Total 10,291 100.00 1,324,388,889 100.00
THIRTY LARGEST UNITHOLDERS (as per Record of Depositors)
Name No. of Units %
1 YTL Corporation Berhad 670,280,889 50.61
2 YTL Corporation Berhad 74,115,600 5.60
3 East-West Ventures Sdn Bhd 62,500,000 4.72
4 Citigroup Nominees (Tempatan) Sdn Bhd– Exempt An for AIA Bhd
34,401,700 2.60
5 Syarikat Pelanchongan Pangkor Laut Sendirian Berhad 24,250,000 1.83
6 Tanjong Jara Beach Hotel Sdn Bhd 21,750,000 1.64
7 YTL Power International Berhad 20,496,900 1.55
8 Business & Budget Hotels (Kuantan) Sdn Bhd 18,750,000 1.42
9 Megahub Development Sdn Bhd 18,250,000 1.38
10 YTL Power International Berhad 14,628,000 1.10
11 HSBC Nominees (Asing) Sdn Bhd– Exempt An for JPMorgan Chase Bank, National Association (Kuwait)
14,573,500 1.10
12 DB (Malaysia) Nominee (Asing) Sdn Bhd– Exempt An for Deutsche Bank AG Singapore (PWM Asing)
10,991,000 0.83
13 HSBC Nominees (Asing) Sdn Bhd– SIX SIS for Bank Sarasin CIE
8,900,000 0.67
14 YTL Power International Berhad 7,964,600 0.60
15 Amanah Raya Berhad– Kumpulan Wang Bersama
5,041,700 0.38
16 Citigroup Nominees (Asing) Sdn Bhd– CBNY for DFA International Real Estate Securities Portfolio of DFA Investment
Dimensions Group INC
4,316,800 0.33
17 RHB Nominees (Tempatan) Sdn Bhd– OSK Trustees Berhad for The Divine Vision Trust
4,300,000 0.32
18 HSBC Nominees (Asing) Sdn Bhd– HSBC-FS for Allianz Pan Asian Reits Fund Segregated Portfolio (Allianz GICF SP)
4,250,300 0.32
19 Ho Chu Chai 4,244,900 0.32
20 Chin Kian Fong 3,319,600 0.25
21 Hong Leong Assurance Berhad– As Beneficial Owner (Life Par)
3,100,000 0.23
Analysis of Unitholdingsas at 16 July 2014
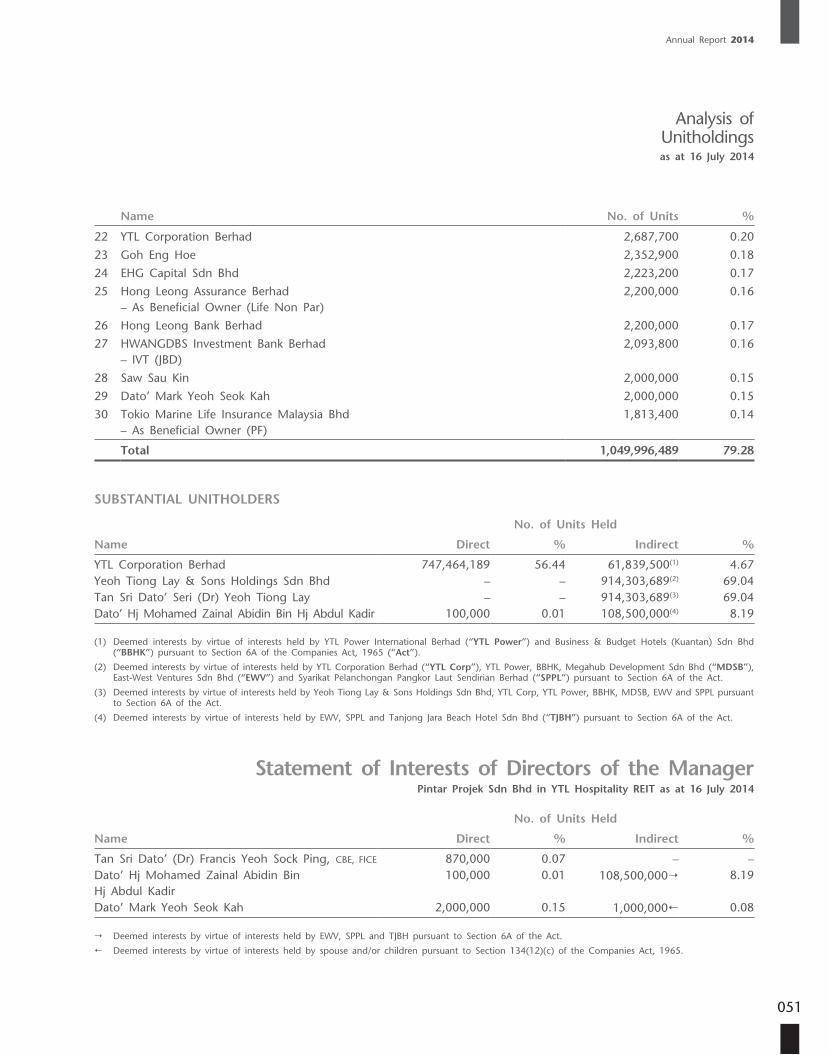
Annual Report 2014
051
Name No. of Units %
22 YTL Corporation Berhad 2,687,700 0.20
23 Goh Eng Hoe 2,352,900 0.18
24 EHG Capital Sdn Bhd 2,223,200 0.17
25 Hong Leong Assurance Berhad– As Beneficial Owner (Life Non Par)
2,200,000 0.16
26 Hong Leong Bank Berhad 2,200,000 0.17
27 HWANGDBS Investment Bank Berhad– IVT (JBD)
2,093,800 0.16
28 Saw Sau Kin 2,000,000 0.15
29 Dato’ Mark Yeoh Seok Kah 2,000,000 0.15
30 Tokio Marine Life Insurance Malaysia Bhd– As Beneficial Owner (PF)
1,813,400 0.14
Total 1,049,996,489 79.28
SUBSTANTIAL UNITHOLDERS
No. of Units Held
Name Direct % Indirect %
YTL Corporation Berhad 747,464,189 56.44 61,839,500(1) 4.67Yeoh Tiong Lay & Sons Holdings Sdn Bhd – – 914,303,689(2) 69.04Tan Sri Dato’ Seri (Dr) Yeoh Tiong Lay – – 914,303,689(3) 69.04Dato’ Hj Mohamed Zainal Abidin Bin Hj Abdul Kadir 100,000 0.01 108,500,000(4) 8.19
(1) Deemed interests by virtue of interests held by YTL Power International Berhad (“YTL Power”) and Business & Budget Hotels (Kuantan) Sdn Bhd (“BBHK”) pursuant to Section 6A of the Companies Act, 1965 (“Act”).
(2) Deemed interests by virtue of interests held by YTL Corporation Berhad (“YTL Corp”), YTL Power, BBHK, Megahub Development Sdn Bhd (“MDSB”), East-West Ventures Sdn Bhd (“EWV”) and Syarikat Pelanchongan Pangkor Laut Sendirian Berhad (“SPPL”) pursuant to Section 6A of the Act.
(3) Deemed interests by virtue of interests held by Yeoh Tiong Lay & Sons Holdings Sdn Bhd, YTL Corp, YTL Power, BBHK, MDSB, EWV and SPPL pursuant to Section 6A of the Act.
(4) Deemed interests by virtue of interests held by EWV, SPPL and Tanjong Jara Beach Hotel Sdn Bhd (“TJBH”) pursuant to Section 6A of the Act.
Statement of Interests of Directors of the ManagerPintar Projek Sdn Bhd in YTL Hospitality REIT as at 16 July 2014
No. of Units Held
Name Direct % Indirect %
Tan Sri Dato’ (Dr) Francis Yeoh Sock Ping, CBE, FICE 870,000 0.07 – –Dato’ Hj Mohamed Zainal Abidin Bin Hj Abdul Kadir
100,000 0.01 108,500,000 8.19
Dato’ Mark Yeoh Seok Kah 2,000,000 0.15 1,000,000 0.08
Deemed interests by virtue of interests held by EWV, SPPL and TJBH pursuant to Section 6A of the Act.
Deemed interests by virtue of interests held by spouse and/or children pursuant to Section 134(12)(c) of the Companies Act, 1965.
Analysis of Unitholdingsas at 16 July 2014
FinancialStatements
053 Manager’s Report
065 Statement by Manager
065 Statutory Declaration
066 Trustee’s Report
067 Independent Auditors’ Report
069 Statements of Profit or Loss
072 Statements of Other Comprehensive Income
073 Statements of Financial Position
075 Statements of Changes in Net Asset Value
077 Statements of Cash Flows
079 Notes to the Financial Statements
130 Supplementary Information on the Disclosure of Realised and Unrealised Profits or Losses
Annual Report 2014
053
The Directors of Pintar Projek Sdn. Bhd., the Manager of YTL Hospitality REIT (the “Trust”), is pleased to present the Report to Unitholders of YTL Hospitality REIT together with the audited financial statements of YTL Hospitality REIT and its subsidiaries (the “Group”) for the financial year ended 30 June 2014.
PRINCIPAL ACTIVITY OF THE MANAGER
The principal activity of the Manager is the management of real estate investment trusts. There has been no significant change in the nature of this activity during the financial year under review.
THE TRUST AND ITS INVESTMENT OBJECTIVE
YTL Hospitality REIT was established on 18 November 2005 pursuant to a trust deed dated 18 November 2005 (“Deed”) between the Manager and Maybank Trustees Berhad (“Trustee”) and is categorised as a real property fund. During the financial year, the Deed was replaced by a restated deed dated 3 December 2013 (“Restated Deed”) entered into between the Manager and the Trustee.
YTL Hospitality REIT was listed on the Main Market of Bursa Malaysia Securities Berhad on 16 December 2005 and is an income and growth type fund. The investment objective of YTL Hospitality REIT is to own and invest in real estate and real estate-related assets, whether directly or indirectly through the ownership of single-purpose companies whose principal assets comprise real estate. The investment portfolio of YTL Hospitality REIT in Malaysia as at 30 June 2014 comprise JW Marriott Hotel Kuala Lumpur, The Residences at The Ritz-Carlton, Kuala Lumpur, Cameron Highlands Resort, Vistana Penang Bukit Jambul, Vistana Kuala Lumpur Titiwangsa, Vistana Kuantan City Centre, The Ritz-Carlton, Kuala Lumpur, part of Pangkor Laut Resort and Tanjong Jara Resort. Hilton Niseko Village was acquired through the Trust’s subsidiary, namely Starhill REIT Niseko G.K., a company incorporated in Japan while the Australian subsidiaries acquired Sydney Harbour Marriott, Brisbane Marriott and Melbourne Marriott (“Australian Properties”).
BENCHMARK RELEVANT TO THE GROUP
Management Expense Ratio (“MER”)
2014 2013
MER for the financial year 1.05% 0.97%
MER is calculated based on the total of all the fees and expenses incurred by YTL Hospitality REIT Group in the financial year and deducted directly from the income (including the manager’s fees, the trustee’s fee, the auditors’ remuneration and other professional fees and expenses) and all the expenses not recovered from and/or charged to the Group (including the costs of printing, stationery and postage), to the average net asset value of the Group during the financial year calculated on a quarterly basis.
Since the basis of calculating MER can vary among real estate investment trusts, there is no sound basis for providing an accurate comparison of YTL Hospitality REIT Group’s MER against other real estate investment trusts.
Manager’s Report
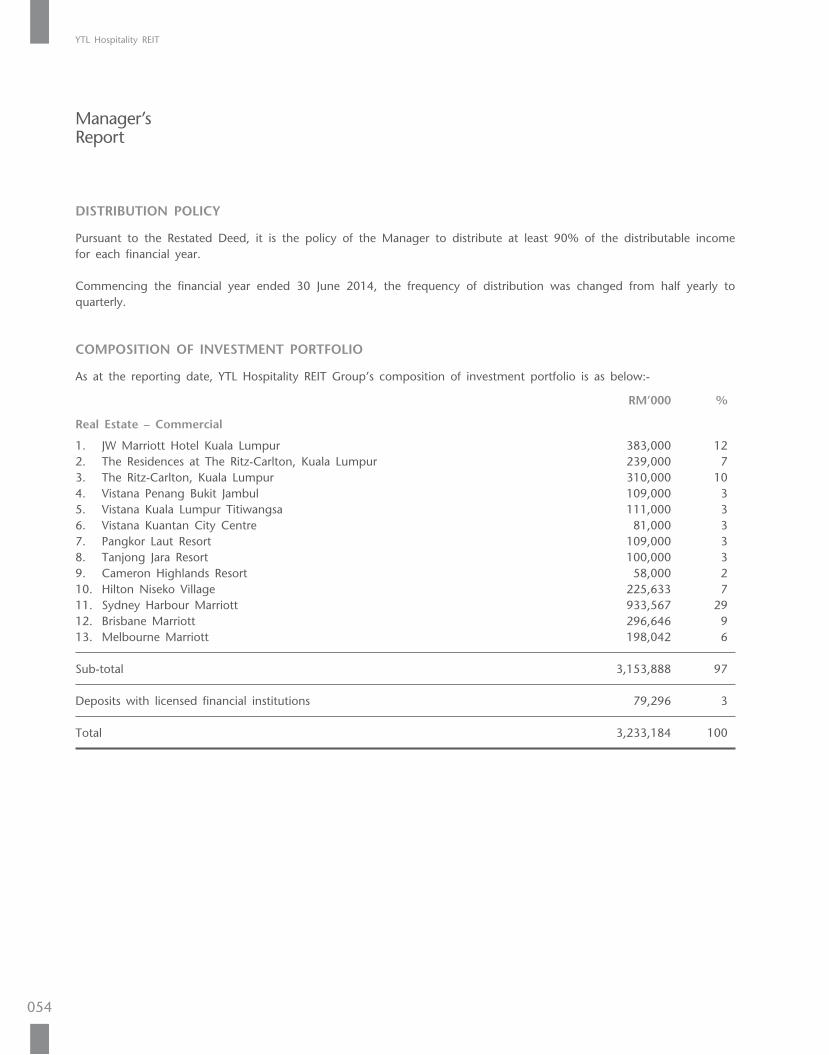
YTL Hospitality REIT
054
DISTRIBUTION POLICY
Pursuant to the Restated Deed, it is the policy of the Manager to distribute at least 90% of the distributable income for each financial year.
Commencing the financial year ended 30 June 2014, the frequency of distribution was changed from half yearly to quarterly.
COMPOSITION OF INVESTMENT PORTFOLIO
As at the reporting date, YTL Hospitality REIT Group’s composition of investment portfolio is as below:-
RM’000 %
Real Estate – Commercial
1. JW Marriott Hotel Kuala Lumpur 383,000 122. The Residences at The Ritz-Carlton, Kuala Lumpur 239,000 73. The Ritz-Carlton, Kuala Lumpur 310,000 104. Vistana Penang Bukit Jambul 109,000 35. Vistana Kuala Lumpur Titiwangsa 111,000 36. Vistana Kuantan City Centre 81,000 37. Pangkor Laut Resort 109,000 38. Tanjong Jara Resort 100,000 39. Cameron Highlands Resort 58,000 210. Hilton Niseko Village 225,633 711. Sydney Harbour Marriott 933,567 2912. Brisbane Marriott 296,646 913. Melbourne Marriott 198,042 6
Sub-total 3,153,888 97
Deposits with licensed financial institutions 79,296 3
Total 3,233,184 100
Manager’s Report
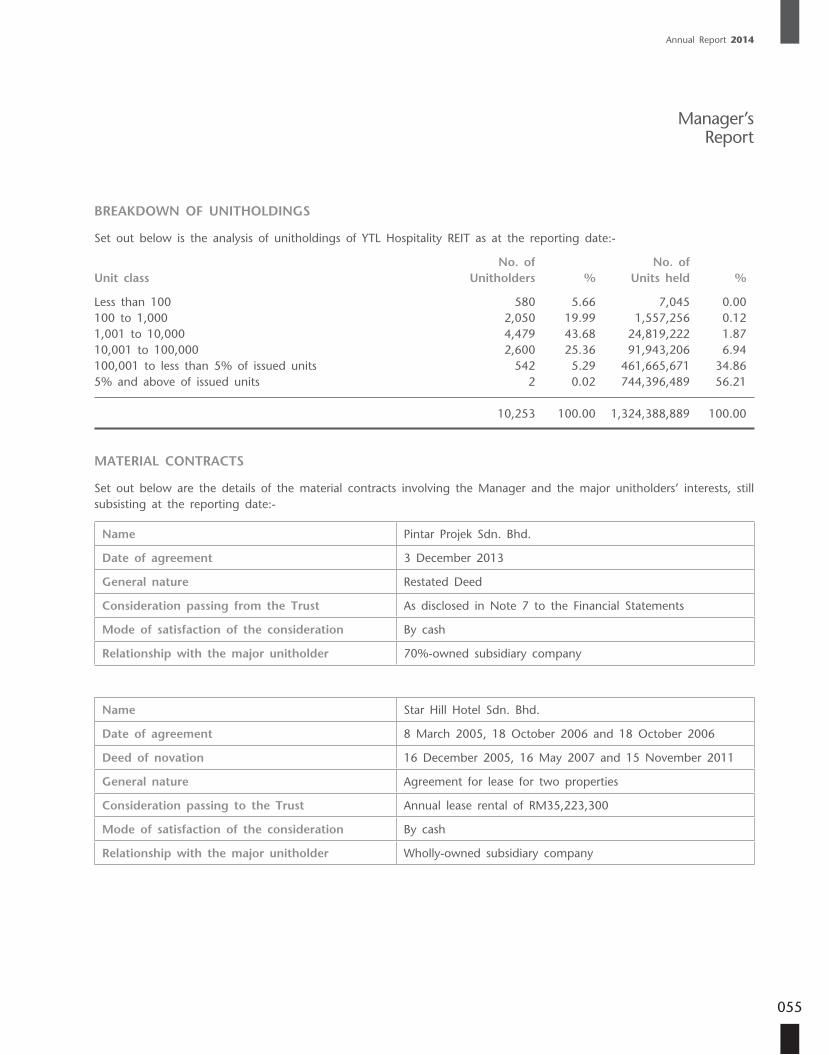
Annual Report 2014
055
Manager’s Report
BREAKDOWN OF UNITHOLDINGS
Set out below is the analysis of unitholdings of YTL Hospitality REIT as at the reporting date:-
No. of No. ofUnit class Unitholders % Units held %
Less than 100 580 5.66 7,045 0.00100 to 1,000 2,050 19.99 1,557,256 0.121,001 to 10,000 4,479 43.68 24,819,222 1.8710,001 to 100,000 2,600 25.36 91,943,206 6.94100,001 to less than 5% of issued units 542 5.29 461,665,671 34.865% and above of issued units 2 0.02 744,396,489 56.21
10,253 100.00 1,324,388,889 100.00
MATERIAL CONTRACTS
Set out below are the details of the material contracts involving the Manager and the major unitholders’ interests, still subsisting at the reporting date:-
Name Pintar Projek Sdn. Bhd.
Date of agreement 3 December 2013
General nature Restated Deed
Consideration passing from the Trust As disclosed in Note 7 to the Financial Statements
Mode of satisfaction of the consideration By cash
Relationship with the major unitholder 70%-owned subsidiary company
Name Star Hill Hotel Sdn. Bhd.
Date of agreement 8 March 2005, 18 October 2006 and 18 October 2006
Deed of novation 16 December 2005, 16 May 2007 and 15 November 2011
General nature Agreement for lease for two properties
Consideration passing to the Trust Annual lease rental of RM35,223,300
Mode of satisfaction of the consideration By cash
Relationship with the major unitholder Wholly-owned subsidiary company
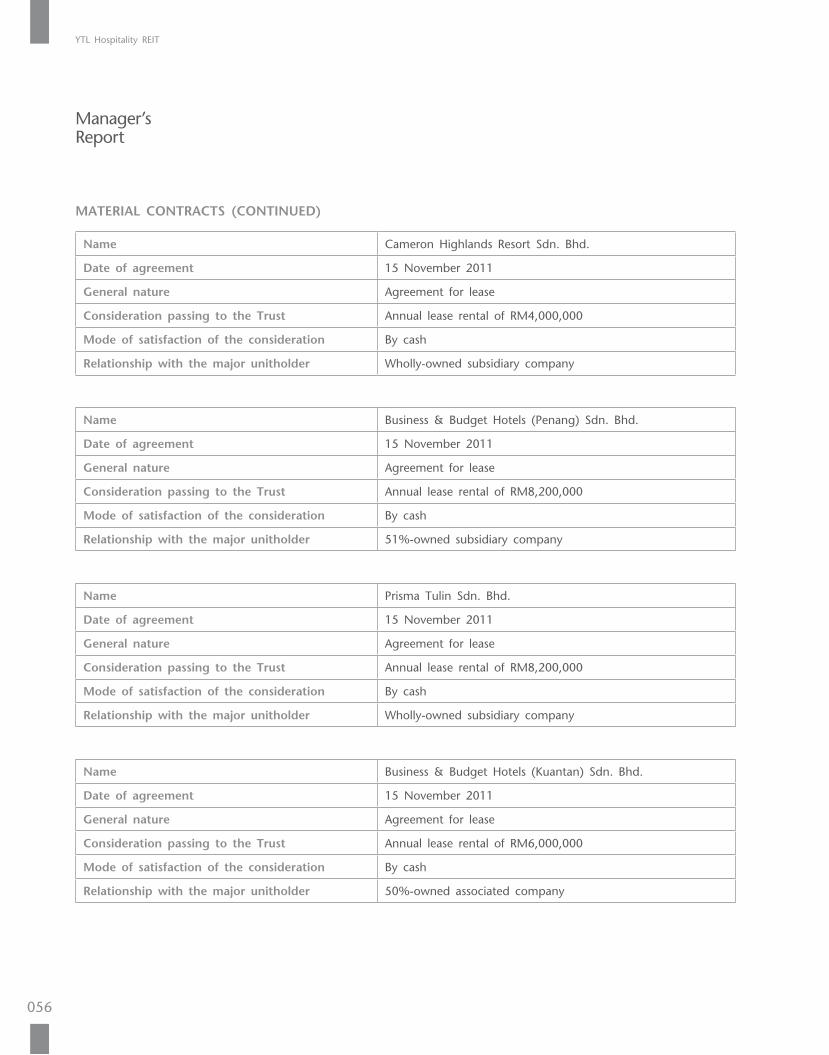
YTL Hospitality REIT
056
MATERIAL CONTRACTS (CONTINUED)
Name Cameron Highlands Resort Sdn. Bhd.
Date of agreement 15 November 2011
General nature Agreement for lease
Consideration passing to the Trust Annual lease rental of RM4,000,000
Mode of satisfaction of the consideration By cash
Relationship with the major unitholder Wholly-owned subsidiary company
Name Business & Budget Hotels (Penang) Sdn. Bhd.
Date of agreement 15 November 2011
General nature Agreement for lease
Consideration passing to the Trust Annual lease rental of RM8,200,000
Mode of satisfaction of the consideration By cash
Relationship with the major unitholder 51%-owned subsidiary company
Name Prisma Tulin Sdn. Bhd.
Date of agreement 15 November 2011
General nature Agreement for lease
Consideration passing to the Trust Annual lease rental of RM8,200,000
Mode of satisfaction of the consideration By cash
Relationship with the major unitholder Wholly-owned subsidiary company
Name Business & Budget Hotels (Kuantan) Sdn. Bhd.
Date of agreement 15 November 2011
General nature Agreement for lease
Consideration passing to the Trust Annual lease rental of RM6,000,000
Mode of satisfaction of the consideration By cash
Relationship with the major unitholder 50%-owned associated company
Manager’s Report
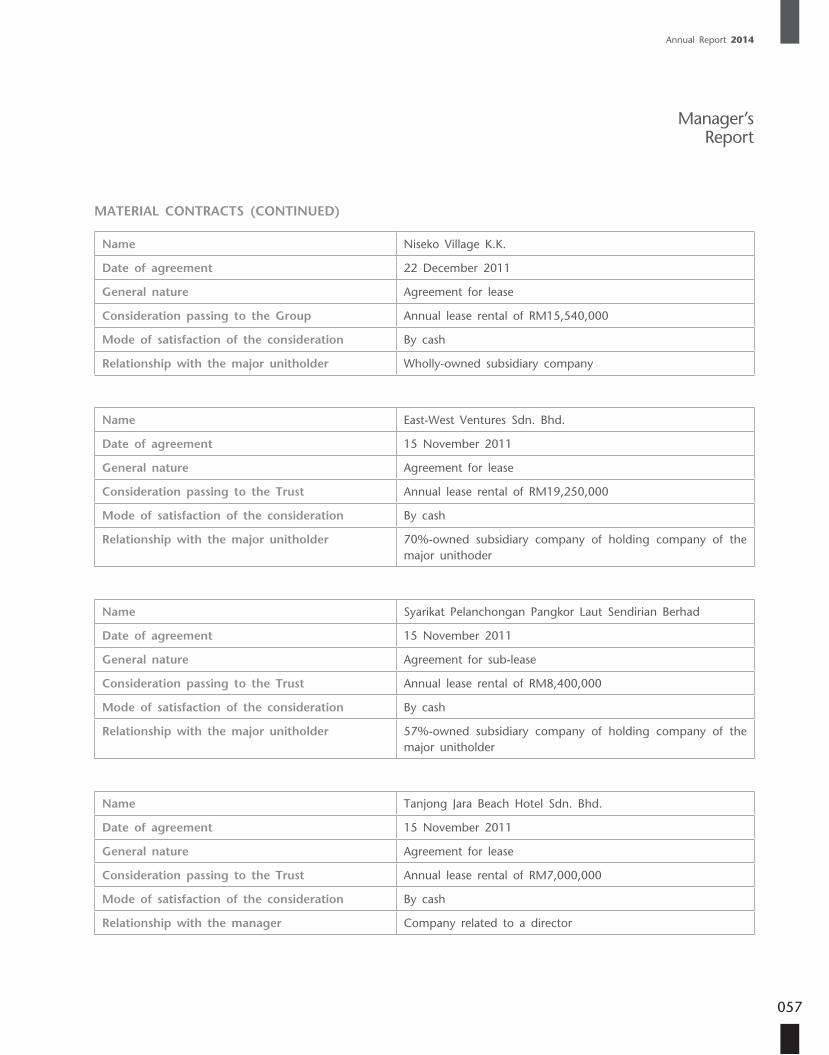
Annual Report 2014
057
MATERIAL CONTRACTS (CONTINUED)
Name Niseko Village K.K.
Date of agreement 22 December 2011
General nature Agreement for lease
Consideration passing to the Group Annual lease rental of RM15,540,000
Mode of satisfaction of the consideration By cash
Relationship with the major unitholder Wholly-owned subsidiary company
Name East-West Ventures Sdn. Bhd.
Date of agreement 15 November 2011
General nature Agreement for lease
Consideration passing to the Trust Annual lease rental of RM19,250,000
Mode of satisfaction of the consideration By cash
Relationship with the major unitholder 70%-owned subsidiary company of holding company of the major unithoder
Name Syarikat Pelanchongan Pangkor Laut Sendirian Berhad
Date of agreement 15 November 2011
General nature Agreement for sub-lease
Consideration passing to the Trust Annual lease rental of RM8,400,000
Mode of satisfaction of the consideration By cash
Relationship with the major unitholder 57%-owned subsidiary company of holding company of the major unitholder
Name Tanjong Jara Beach Hotel Sdn. Bhd.
Date of agreement 15 November 2011
General nature Agreement for lease
Consideration passing to the Trust Annual lease rental of RM7,000,000
Mode of satisfaction of the consideration By cash
Relationship with the manager Company related to a director
Manager’s Report
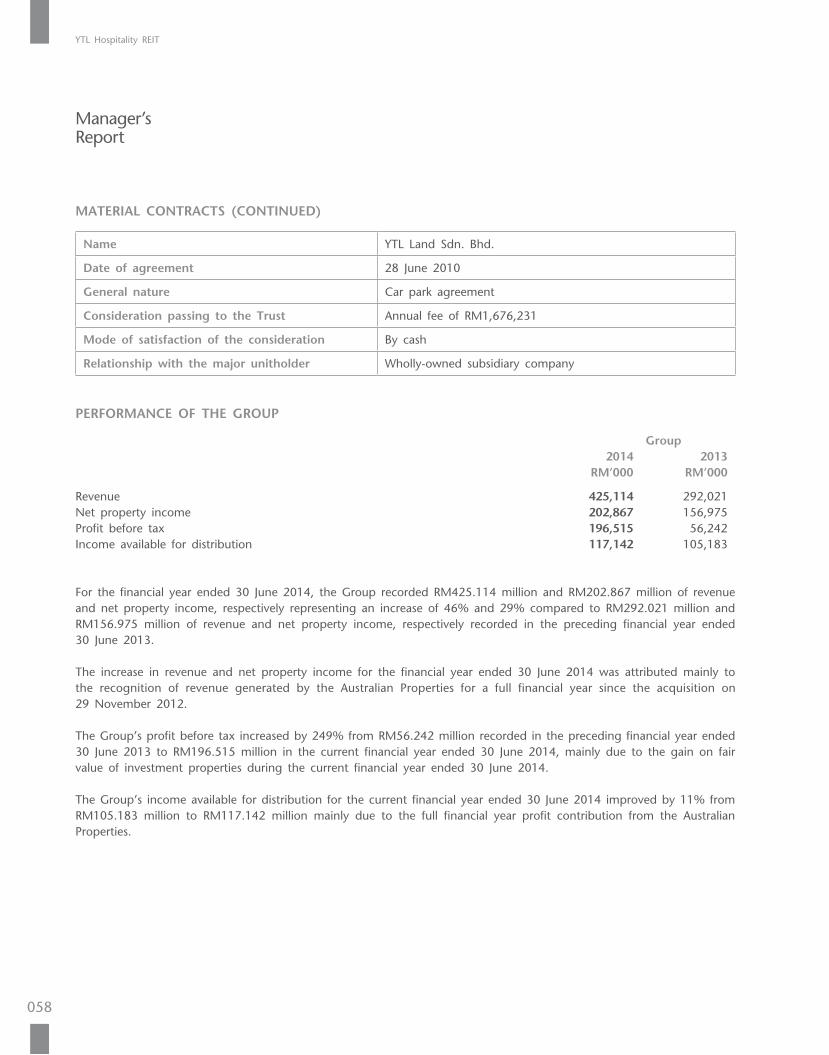
YTL Hospitality REIT
058
MATERIAL CONTRACTS (CONTINUED)
Name YTL Land Sdn. Bhd.
Date of agreement 28 June 2010
General nature Car park agreement
Consideration passing to the Trust Annual fee of RM1,676,231
Mode of satisfaction of the consideration By cash
Relationship with the major unitholder Wholly-owned subsidiary company
PERFORMANCE OF THE GROUP
Group 2014 2013 RM’000 RM’000
Revenue 425,114 292,021Net property income 202,867 156,975Profit before tax 196,515 56,242Income available for distribution 117,142 105,183
For the financial year ended 30 June 2014, the Group recorded RM425.114 million and RM202.867 million of revenue and net property income, respectively representing an increase of 46% and 29% compared to RM292.021 million and RM156.975 million of revenue and net property income, respectively recorded in the preceding financial year ended 30 June 2013.
The increase in revenue and net property income for the financial year ended 30 June 2014 was attributed mainly to the recognition of revenue generated by the Australian Properties for a full financial year since the acquisition on 29 November 2012.
The Group’s profit before tax increased by 249% from RM56.242 million recorded in the preceding financial year ended 30 June 2013 to RM196.515 million in the current financial year ended 30 June 2014, mainly due to the gain on fair value of investment properties during the current financial year ended 30 June 2014.
The Group’s income available for distribution for the current financial year ended 30 June 2014 improved by 11% from RM105.183 million to RM117.142 million mainly due to the full financial year profit contribution from the Australian Properties.
Manager’s Report
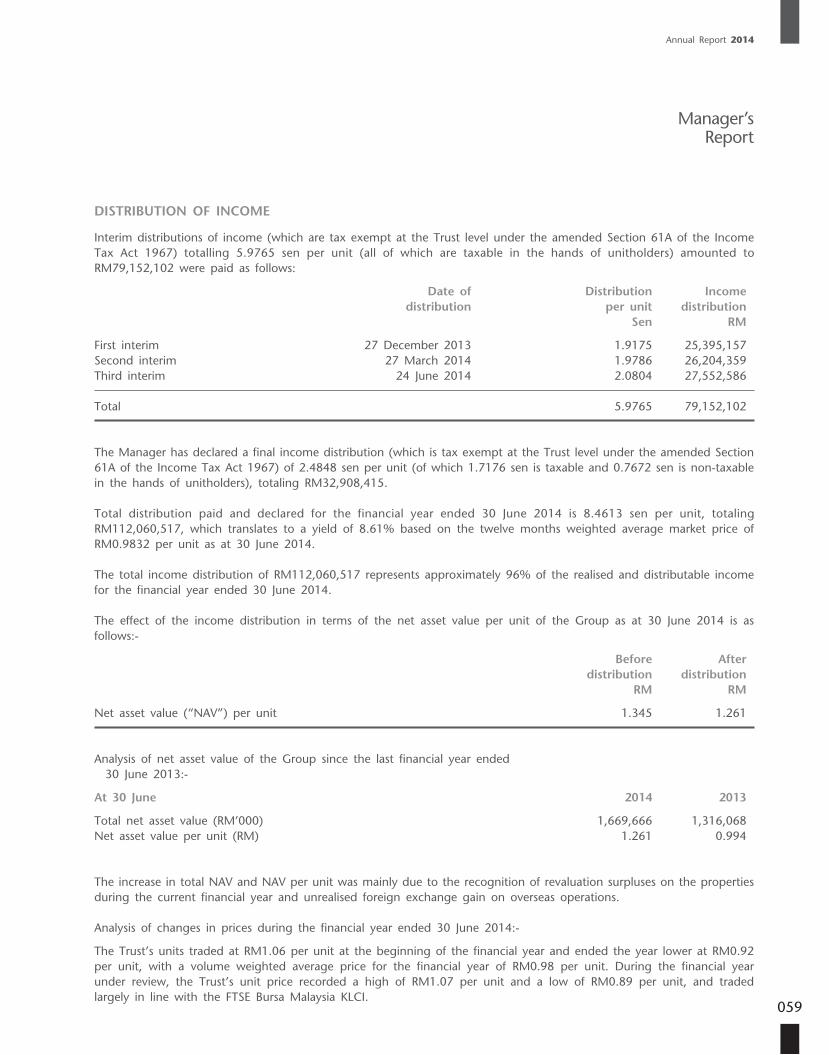
Annual Report 2014
059
DISTRIBUTION OF INCOME
Interim distributions of income (which are tax exempt at the Trust level under the amended Section 61A of the Income Tax Act 1967) totalling 5.9765 sen per unit (all of which are taxable in the hands of unitholders) amounted to RM79,152,102 were paid as follows:
Date of Distribution Income distribution per unit distribution Sen RM
First interim 27 December 2013 1.9175 25,395,157Second interim 27 March 2014 1.9786 26,204,359Third interim 24 June 2014 2.0804 27,552,586
Total 5.9765 79,152,102
The Manager has declared a final income distribution (which is tax exempt at the Trust level under the amended Section 61A of the Income Tax Act 1967) of 2.4848 sen per unit (of which 1.7176 sen is taxable and 0.7672 sen is non-taxable in the hands of unitholders), totaling RM32,908,415.
Total distribution paid and declared for the financial year ended 30 June 2014 is 8.4613 sen per unit, totaling RM112,060,517, which translates to a yield of 8.61% based on the twelve months weighted average market price of RM0.9832 per unit as at 30 June 2014.
The total income distribution of RM112,060,517 represents approximately 96% of the realised and distributable income for the financial year ended 30 June 2014.
The effect of the income distribution in terms of the net asset value per unit of the Group as at 30 June 2014 is as follows:-
Before After distribution distribution RM RM
Net asset value (“NAV”) per unit 1.345 1.261
Analysis of net asset value of the Group since the last financial year ended 30 June 2013:-
At 30 June 2014 2013
Total net asset value (RM’000) 1,669,666 1,316,068Net asset value per unit (RM) 1.261 0.994
The increase in total NAV and NAV per unit was mainly due to the recognition of revaluation surpluses on the properties during the current financial year and unrealised foreign exchange gain on overseas operations.
Analysis of changes in prices during the financial year ended 30 June 2014:-
The Trust’s units traded at RM1.06 per unit at the beginning of the financial year and ended the year lower at RM0.92 per unit, with a volume weighted average price for the financial year of RM0.98 per unit. During the financial year under review, the Trust’s unit price recorded a high of RM1.07 per unit and a low of RM0.89 per unit, and traded largely in line with the FTSE Bursa Malaysia KLCI.
Manager’s Report
YTL Hospitality REIT
060
MANAGER’S INVESTMENT STRATEGIES AND POLICIES
INVESTMENT STRATEGIES
During the financial year, the Manager continued to carry out the following investment strategies in order to achieve YTL Hospitality REIT’s business objectives:-
(i) Operating Strategy The Trust continued to focus on the acquisition of hotel properties located both in Malaysia and internationally,
subject to attractive valuations that will provide yield accretive returns to the unitholders and maintained the quality of the properties under its current portfolio.
The Trust was also able to leverage on focused co-branding and cross marketing strategies to enhance the performance of its hospitality assets that include integrated conference facilities to draw international business interest; and internationally acclaimed food and beverage outlets.
(ii) Acquisition Strategy The Manager seeks to increase cash flow and enhance unit value through selective acquisitions. This acquisition
strategy takes into consideration:-
(a) location;
(b) opportunities; and
(c) yield thresholds.
The Manager also has access to networks and relationships with leading participants in the real estate and hotel industry which may assist YTL Hospitality REIT in identifying (a) acquisition opportunities to achieve favourable returns on invested capital and growth in cash flow; and (b) underperforming assets.
The Manager intends to hold properties on a long-term basis. However, in the future where the Manager considers that any property has reached a stage that offers only limited scope for growth, the Manager may consider selling the property and using the proceeds for alternative investments in properties that meet its investment criteria.
(iii) Capital Management Strategy The Manager optimises YTL Hospitality REIT’s capital structure and cost of capital within the borrowing limits
prescribed by the Guidelines on Real Estate Investment Trusts issued by the Securities Commission Malaysia (“SC”) (“REIT Guidelines”) via a combination of debt and equity funding for future acquisitions and improvement works of its properties. This capital management strategy involves:-
(a) adopting and maintaining an optimal gearing level; and
(b) adopting an active interest rate management strategy to manage risks associated with changes in interest rates while maintaining flexibility in YTL Hospitality REIT’s capital structure to meet future investment and/or capital expenditure requirements.
Manager’s Report
Annual Report 2014
061
INVESTMENT POLICIES
The Manager will continue to comply with the REIT Guidelines and other requirements as imposed by the SC from time to time and the Restated Deed, including (i) to invest in investment permitted by the SC; and (ii) to ensure the investment portfolio requirements and limits imposed by the REIT Guidelines and/or the Restated Deed are adhered to.
The Manager will also ensure that YTL Hospitality REIT will not be involved in (i) extension of loans or any other credit facility; (ii) property development; and (iii) acquisition of a vacant land.
MATERIAL LITIGATION
There was no material litigation as at the date of this Report.
SOFT COMMISSION
During the financial year, the Manager did not receive any soft commission (ie. goods and services) from its broker, by virtue of transactions conducted by the Trust.
DIRECTORS
The Directors who served on the Board of the Manager, Pintar Projek Sdn. Bhd. since the date of last Report of the Trust are:-
Tan Sri Dato’ (Dr) Francis Yeoh Sock Ping, CBE, FICEDato’ Yeoh Seok KianDato’ (Dr) Yahya Bin IsmailDato’ Ahmad Fuaad Bin Mohd DahalanDato’ Mark Yeoh Seok KahDato’ Hj. Mohamed Zainal Abidin Bin Hj. Abdul KadirEu Peng Meng @ Leslie EuYeoh Keong Shyan
DIRECTORS’ BENEFITS
During and at the end of the financial year, no arrangement subsisted to which the Manager is a party, with the object or objects of enabling the Directors of the Manager to acquire benefits by means of the acquisition of units in or debentures of YTL Hospitality REIT or any other body corporate.
For the financial year ended 30 June 2014, no Director has received or become entitled to receive any benefit by reason of a contract made by the Manager for YTL Hospitality REIT or a related corporation with the Director or with a firm of which he is a member, or with a company in which he has a substantial financial interest, except as disclosed in the notes to the financial statements.
Manager’s Report
YTL Hospitality REIT
062
DIRECTORS’ INTERESTS
The following Directors of the Manager who held office at the end of the financial year had, according to the register of unitholdings in YTL Hospitality REIT, interests in the units of YTL Hospitality REIT as follows:-
Balance No. of units No. of units Balance at 1.7.2013 acquired disposed at 30.6.2014
Direct interestTan Sri Dato’ (Dr) Francis Yeoh Sock Ping, CBE, FICE 870,000 – – 870,000Dato’ Mark Yeoh Seok Kah – 2,000,000 – 2,000,000Dato’ Hj. Mohamed Zainal Abidin Bin Hj. Abdul Kadir 70,000 30,000 – 100,000
Indirect InterestDato’ Mark Yeoh Seok Kah – 1,000,000 – 1,000,000 (1)
Dato’ Hj. Mohamed Zainal Abidin Bin Hj. Abdul Kadir 108,500,000 (2) – – 108,500,000 (2)
(1) Deemed interests by virtue of interests held by spouse pursuant to Section 134(12)(c) of the Companies Act 1965.
(2) Deemed interests by virtue of interests held by East-West Ventures Sdn. Bhd., Syarikat Pelanchongan Pangkor Laut Sendirian Berhad and Tanjong Jara Beach Hotel Sdn. Bhd. pursuant to Section 6A of the Companies Act 1965.
Other than as disclosed above, Directors who held office at the end of the financial year did not have interests in the units of YTL Hospitality REIT.
MANAGER’S REMUNERATION
Pursuant to the Restated Deed, the Manager is entitled to receive from the Trust:-
(i) a base fee (exclusive of GST, if any) of up to 1.0% per annum of the gross asset value of the Group;
(ii) a performance fee (exclusive of GST, if any) of up to 5.0% of the Group’s net property income, but before deduction of property management fees payable to any property manager appointed to manage any real estate;
(iii) an acquisition fee of 1.0% of the acquisition price of any real estate or single-purpose company purchased for the Group (pro rated if applicable to the proportion of the interest of the Trust in the asset acquired); and
(iv) a divestment fee of 0.5% of the sale price of any asset being real estate or a single-purpose company sold or diverted by the Group (pro rated if applicable to the proportion of the interest of the Trust in the asset sold).
The remuneration received by the Manager during the financial year is disclosed in Note 7 to the Financial Statements.
Manager’s Report
Annual Report 2014
063
RESERVES AND PROVISIONS
There were no material transfers to and from reserves or provisions during the financial year other than as disclosed in the financial statements.
STATUTORY INFORMATION ON THE FINANCIAL STATEMENTS
Before the financial statements of the Group and of the Trust were made out, the Manager took reasonable steps:-
(a) to ascertain that proper action has been taken in relation to the writing off of bad debts and the making of allowance for doubtful debts and satisfied themselves that all known bad debts have been written off and that adequate allowance has been made for doubtful debts; and
(b) to ensure that any current assets which were unlikely to realise their values as shown in the accounting records of the Group and of the Trust in the ordinary course of business have been written down to an amount which they might be expected so to realise.
At the date of this Report, the Manager is not aware of any circumstances:-
(a) which would render the amount written off for bad debts or the amount of the allowance for doubtful debts in the financial statements of the Group and of the Trust inadequate to any substantial extent; or
(b) which would render the values attributed to current assets in the financial statements of the Group and of the Trust misleading; or
(c) which have arisen which render adherence to the existing method of valuation of assets or liabilities of the Group and of the Trust misleading or inappropriate.
At the date of this Report, there does not exist:-
(a) any charge on the assets of the Group and of the Trust which has arisen since the end of the financial year which secures the liability of any other person; or
(b) any contingent liability of the Group and of the Trust which has arisen since the end of the financial year.
No contingent or other liability has become enforceable or is likely to become enforceable within the period of twelve months after the end of the financial year which, in the opinion of the Directors of the Manager, will or may affect the ability of the Group and of the Trust to meet its obligations as and when they fall due.
Manager’s Report
YTL Hospitality REIT
064
OTHER STATUTORY INFORMATION ON THE FINANCIAL STATEMENTS
The Directors of the Manager state that:-
At the date of this Report, they are not aware of any circumstances not otherwise dealt with in this Report or the financial statements of the Group and of the Trust which would render any amount stated in the financial statements misleading.
In their opinion,
(a) the results of the operations of the Group and of the Trust during the financial year were not substantially affected by any item, transaction or event of a material and unusual nature; and
(b) there has not arisen in the interval between the end of the financial year and the date of this Report any item, transaction or event of a material and unusual nature likely to affect substantially the results of the operations of the Group and of the Trust for the financial year in which this Report is made.
AUDITORS
The auditors, Messrs. HLB Ler Lum, Chartered Accountants, have expressed their willingness to continue in office.
Signed on behalf of the Board of Pintar Projek Sdn. Bhd. in accordance with a resolution of the Directors,
Tan Sri Dato’ (Dr) Francis Yeoh Sock Ping, CBE, FICE
Dato’ Mark Yeoh Seok Kah
Dated: 31 July 2014
Manager’s Report
Annual Report 2014
065
In the opinion of the Directors of PINTAR PROJEK SDN. BHD. (“Manager”), the accompanying financial statements are drawn up in accordance with Malaysian Financial Reporting Standards, International Financial Reporting Standards, the Securities Commission Malaysia’s Guidelines on Real Estate Investment Trusts and the restated deed dated 3 December 2013 so as to give a true and fair view of the state of affairs of YTL HOSPITALITY REIT (the “Trust”) and its subsidiaries (the “Group”) as at 30 June 2014 and of the results of operations and cash flows of the Group and of the Trust for the financial year ended on that date.
In the opinion of the Directors of the Manager, the supplementary information set out on page 130 have been compiled in accordance with the Guidance of Special Matter No.1, Determination of Realised and Unrealised Profits or Losses in the Context of Disclosures Pursuant to Bursa Malaysia Securities Berhad Main Market Listing Requirements, issued by the Malaysian Institute of Accountants and presented based on the format prescribed by Bursa Malaysia Securities Berhad.
Signed on behalf of the Board of Pintar Projek Sdn. Bhd. in accordance with a resolution of the Directors,
Tan Sri Dato’ (Dr) Francis Yeoh Sock Ping, CBE, FICE
Dato’ Mark Yeoh Seok Kah
Dated: 31 July 2014
I, DATO’ MARK YEOH SEOK KAH, being the Director of PINTAR PROJEK SDN. BHD. primarily responsible for the financial management of YTL HOSPITALITY REIT, do solemnly and sincerely declare that to the best of my knowledge and belief the accompanying financial statements are correct and I make this solemn declaration conscientiously believing the same to be true and by virtue of the provisions of the Statutory Declarations Act 1960.
Dato’ Mark Yeoh Seok Kah
Subscribed and solemnly declared by theabovenamed DATO’ MARK YEOH SEOK KAHat Kuala Lumpur on 31 July 2014
Before me :
Commissioner for Oaths
Statement by Manager
Statutory Declaration
YTL Hospitality REIT
066
We have acted as Trustee of YTL HOSPITALITY REIT (the “Trust”) for the financial year ended 30 June 2014. To the best of our knowledge, PINTAR PROJEK SDN. BHD., the Manager of the Trust has managed the Trust in accordance with the roles and responsibilities and limitation imposed on the investment powers of the management company under the Restated Deed, the Securities Commission Malaysia’s Guidelines on Real Estate Investment Trusts, the Capital Markets and Services Act 2007 and other applicable laws during the financial year ended 30 June 2014.
We are of the opinion that:
(i) the valuation/pricing of the Trust’s units are adequate and such valuation/pricing is carried out in accordance with the Restated Deed and other regulatory requirements; and
(ii) the income distributions declared and paid during the financial year ended 30 June 2014 are in line with and are reflective of the objectives of the Trust.
For Maybank Trustees Berhad,
Bernice Lau Kam MunHead, Operations
Dated: 31 July 2014Kuala Lumpur
Trustee’s Reportto the Unitholders of YTL Hospitality REIT
Annual Report 2014
067
REPORT ON THE FINANCIAL STATEMENTS
We have audited the financial statements of YTL HOSPITALITY REIT (“the Trust”) and its subsidiaries (“the Group”), which comprise the Statements of Financial Position as at 30 June 2014 and the Statements of Profit or Loss, Statements of Other Comprehensive Income, Statements of Changes in Net Asset Value and Statements of Cash Flows of the Group and of the Trust for the year then ended, and a summary of significant accounting policies and other explanatory information, as set out on pages 69 to 129.
DIRECTORS OF PINTAR PROJEK SDN. BHD.’S (“THE MANAGER”) RESPONSIBILITY FOR THE FINANCIAL STATEMENTS
The Directors of the Manager of the Trust are responsible for the preparation of financial statements so as to give a true and fair view in accordance with Malaysian Financial Reporting Standards, International Financial Reporting Standards, the Securities Commission Malaysia’s Guidelines on Real Estate Investment Trusts and the Restated Deed dated 3 December 2013. The Directors of the Manager are also responsible for such internal controls as the Directors of the Manager determine are necessary to enable the preparation of financial statements that are free from material misstatement, whether due to fraud or error.
AUDITORS’ RESPONSIBILITY
Our responsibility is to express an opinion on these financial statements based on our audit. We conducted our audit in accordance with approved standards on auditing in Malaysia. Those standards require that we comply with ethical requirements and plan and perform the audit to obtain reasonable assurance whether the financial statements are free from material misstatement.
An audit involves performing procedures to obtain audit evidence about the amounts and disclosures in the financial statements. The procedures selected depend on our judgement, including the assessment of risks of material misstatement of the financial statements, whether due to fraud or error. In making those risk assessments, we consider internal control relevant to the entity’s preparation of financial statements that give a true and fair view in order to design audit procedures that are appropriate in the circumstances, but not for the purpose of expressing an opinion on the effectiveness of the entity’s internal control. An audit also includes evaluating the appropriateness of accounting policies used and the reasonableness of accounting estimates made by the Directors of the Manager, as well as evaluating the overall presentation of the financial statements.
We believe that the audit evidence we have obtained is sufficient and appropriate to provide a basis for our audit opinion.
OPINION
In our opinion, the financial statements give a true and fair view of the financial position of the Group and of the Trust as of 30 June 2014 and of their financial performance and cash flows for the year then ended in accordance with Malaysian Financial Reporting Standards, International Financial Reporting Standards and the Securities Commission Malaysia’s Guidelines on Real Estate Investment Trusts.
Independent Auditors’ Report
to the Unitholders of YTL Hospitality REIT
YTL Hospitality REIT
068
OTHER REPORTING RESPONSIBILITIES
The supplementary information set out on page 130 is disclosed to meet the requirement of Bursa Malaysia Securities Berhad and is not part of the financial statements. The Directors of the Manager are responsible for the preparation of the supplementary information in accordance with Guidance on Special Matter No. 1, Determination of Realised and Unrealised Profits or Losses in the Context of Disclosure Pursuant to Bursa Malaysia Securities Berhad Main Market Listing Requirements, as issued by the Malaysian Institute of Accountants (“MIA Guidance”) and the directive of Bursa Malaysia Securities Berhad. In our opinion, the supplementary information is prepared, in all material respects, in accordance with the MIA Guidance and the directive of Bursa Malaysia Securities Berhad.
OTHER MATTERS
This report is made solely to the unitholders of the Trust and for no other purpose. We do not assume responsibility to any other person for the content of this report.
HLB LER LUMAF 0276Chartered Accountants
LUM TUCK CHEONG1005/3/15 (J/PH)Chartered Accountant
Dated: 31 July 2014Kuala Lumpur
Independent Auditors’ Reportto the Unitholders of YTL Hospitality REIT
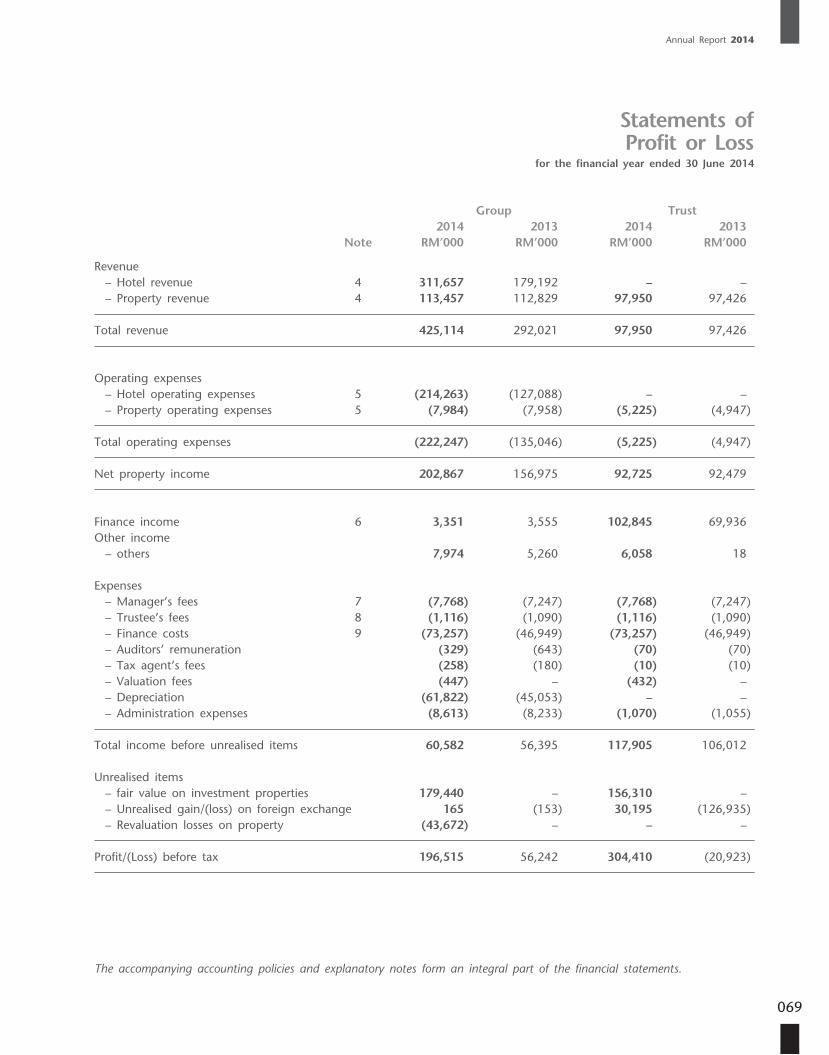
Annual Report 2014
069
Group Trust 2014 2013 2014 2013 Note RM’000 RM’000 RM’000 RM’000
Revenue – Hotel revenue 4 311,657 179,192 – – – Property revenue 4 113,457 112,829 97,950 97,426
Total revenue 425,114 292,021 97,950 97,426
Operating expenses – Hotel operating expenses 5 (214,263) (127,088) – – – Property operating expenses 5 (7,984) (7,958) (5,225) (4,947)
Total operating expenses (222,247) (135,046) (5,225) (4,947)
Net property income 202,867 156,975 92,725 92,479
Finance income 6 3,351 3,555 102,845 69,936Other income – others 7,974 5,260 6,058 18
Expenses – Manager’s fees 7 (7,768) (7,247) (7,768) (7,247) – Trustee’s fees 8 (1,116) (1,090) (1,116) (1,090) – Finance costs 9 (73,257) (46,949) (73,257) (46,949) – Auditors’ remuneration (329) (643) (70) (70) – Tax agent’s fees (258) (180) (10) (10) – Valuation fees (447) – (432) – – Depreciation (61,822) (45,053) – – – Administration expenses (8,613) (8,233) (1,070) (1,055)
Total income before unrealised items 60,582 56,395 117,905 106,012
Unrealised items – fair value on investment properties 179,440 – 156,310 – – Unrealised gain/(loss) on foreign exchange 165 (153) 30,195 (126,935) – Revaluation losses on property (43,672) – – –
Profit/(Loss) before tax 196,515 56,242 304,410 (20,923)
The accompanying accounting policies and explanatory notes form an integral part of the financial statements.
Statements of Profit or Loss
for the financial year ended 30 June 2014
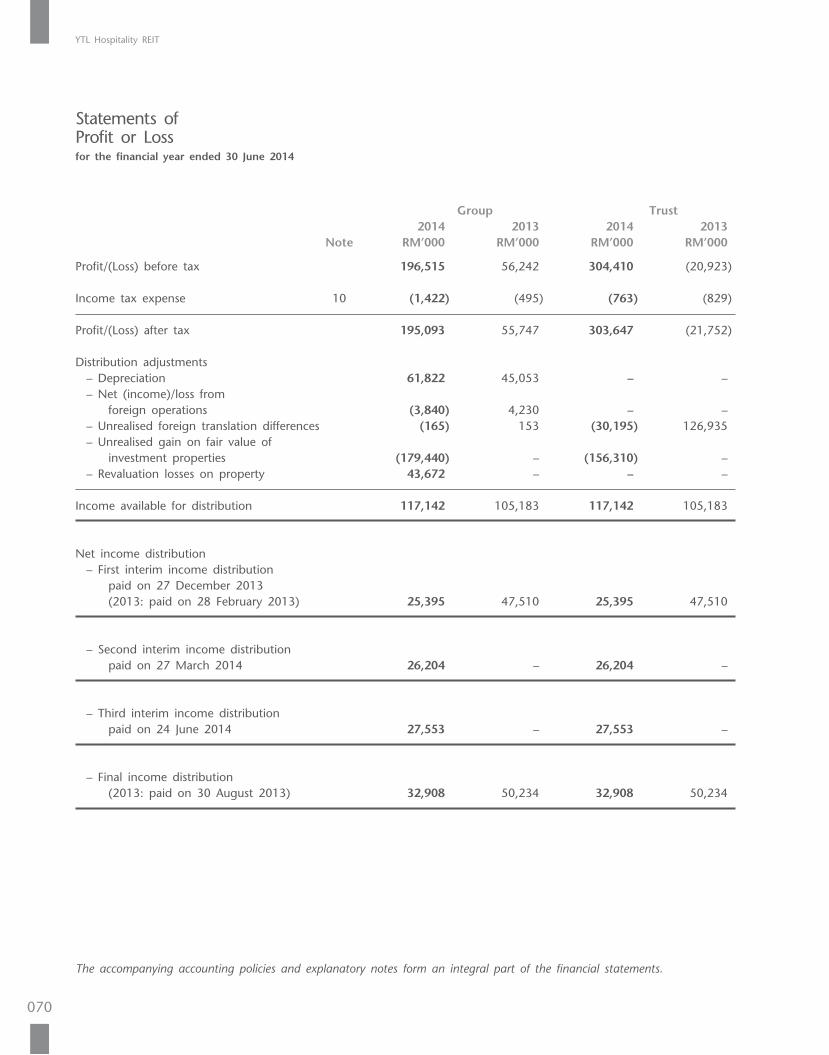
YTL Hospitality REIT
070
Group Trust 2014 2013 2014 2013 Note RM’000 RM’000 RM’000 RM’000
Profit/(Loss) before tax 196,515 56,242 304,410 (20,923)
Income tax expense 10 (1,422) (495) (763) (829)
Profit/(Loss) after tax 195,093 55,747 303,647 (21,752)
Distribution adjustments – Depreciation 61,822 45,053 – – – Net (income)/loss from foreign operations (3,840) 4,230 – – – Unrealised foreign translation differences (165) 153 (30,195) 126,935 – Unrealised gain on fair value of investment properties (179,440) – (156,310) – – Revaluation losses on property 43,672 – – –
Income available for distribution 117,142 105,183 117,142 105,183
Net income distribution – First interim income distribution paid on 27 December 2013 (2013: paid on 28 February 2013) 25,395 47,510 25,395 47,510
– Second interim income distribution paid on 27 March 2014 26,204 – 26,204 –
– Third interim income distribution paid on 24 June 2014 27,553 – 27,553 –
– Final income distribution (2013: paid on 30 August 2013) 32,908 50,234 32,908 50,234
The accompanying accounting policies and explanatory notes form an integral part of the financial statements.
Statements of Profit or Lossfor the financial year ended 30 June 2014
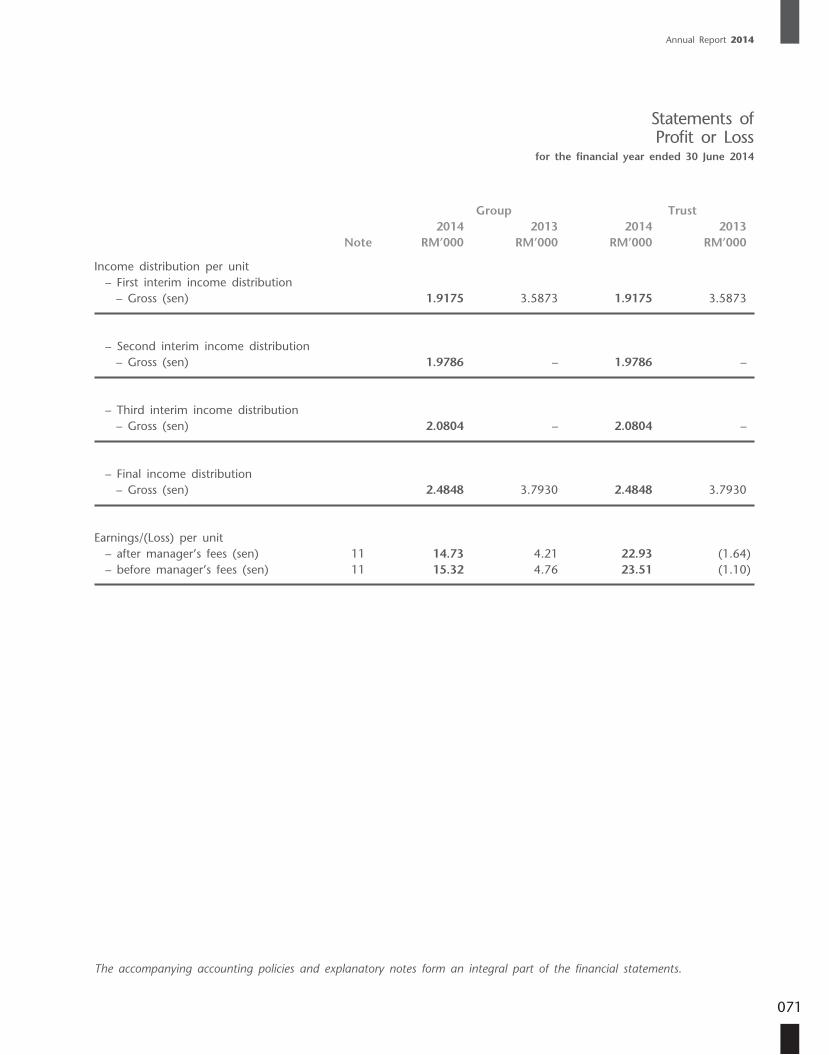
Annual Report 2014
071
Group Trust 2014 2013 2014 2013 Note RM’000 RM’000 RM’000 RM’000
Income distribution per unit – First interim income distribution – Gross (sen) 1.9175 3.5873 1.9175 3.5873
– Second interim income distribution – Gross (sen) 1.9786 – 1.9786 –
– Third interim income distribution – Gross (sen) 2.0804 – 2.0804 –
– Final income distribution – Gross (sen) 2.4848 3.7930 2.4848 3.7930
Earnings/(Loss) per unit – after manager’s fees (sen) 11 14.73 4.21 22.93 (1.64) – before manager’s fees (sen) 11 15.32 4.76 23.51 (1.10)
The accompanying accounting policies and explanatory notes form an integral part of the financial statements.
Statements of Profit or Loss
for the financial year ended 30 June 2014
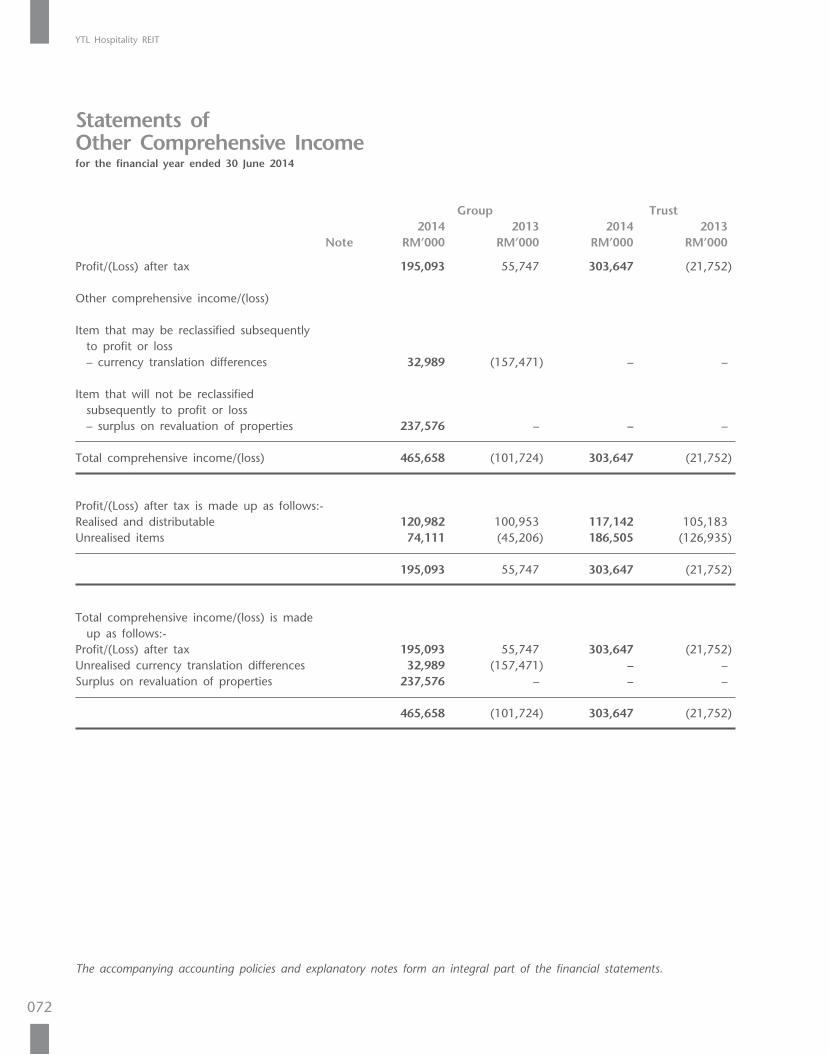
YTL Hospitality REIT
072
Group Trust 2014 2013 2014 2013 Note RM’000 RM’000 RM’000 RM’000
Profit/(Loss) after tax 195,093 55,747 303,647 (21,752)
Other comprehensive income/(loss)
Item that may be reclassified subsequently to profit or loss – currency translation differences 32,989 (157,471) – –
Item that will not be reclassified subsequently to profit or loss – surplus on revaluation of properties 237,576 – – –
Total comprehensive income/(loss) 465,658 (101,724) 303,647 (21,752)
Profit/(Loss) after tax is made up as follows:-Realised and distributable 120,982 100,953 117,142 105,183Unrealised items 74,111 (45,206) 186,505 (126,935)
195,093 55,747 303,647 (21,752)
Total comprehensive income/(loss) is made up as follows:-Profit/(Loss) after tax 195,093 55,747 303,647 (21,752)Unrealised currency translation differences 32,989 (157,471) – –Surplus on revaluation of properties 237,576 – – –
465,658 (101,724) 303,647 (21,752)
The accompanying accounting policies and explanatory notes form an integral part of the financial statements.
Statements of Other Comprehensive Incomefor the financial year ended 30 June 2014
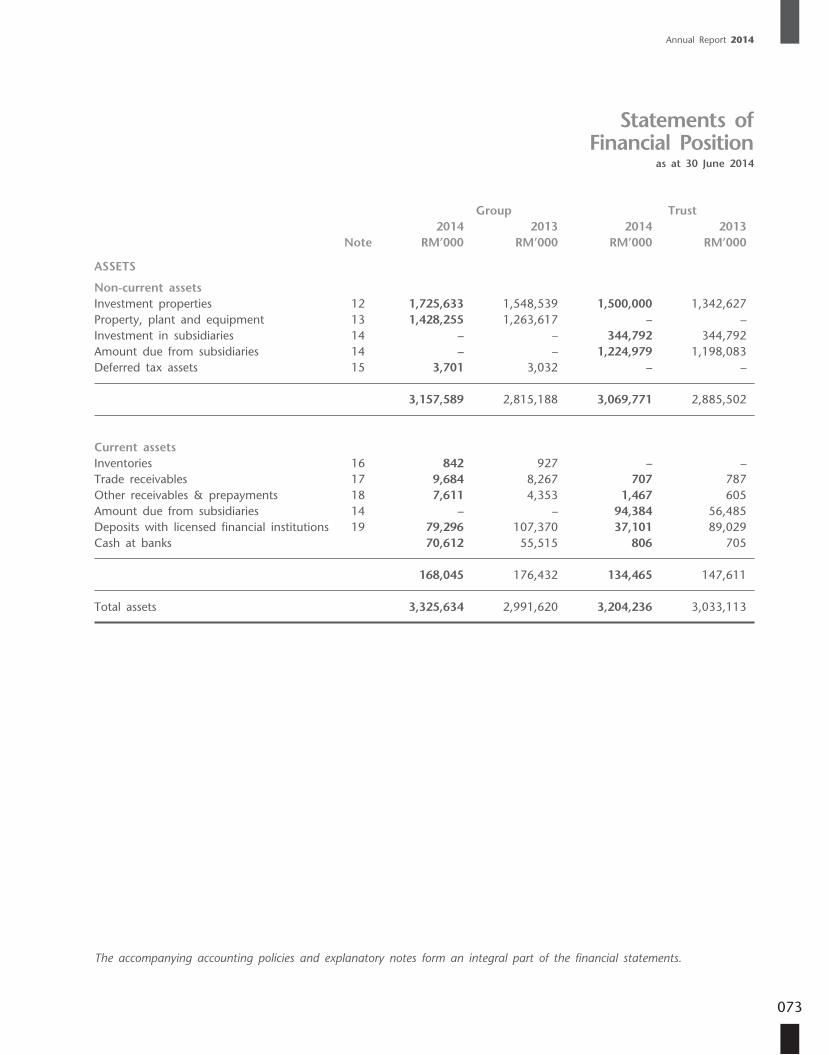
Annual Report 2014
073
Group Trust 2014 2013 2014 2013 Note RM’000 RM’000 RM’000 RM’000
ASSETS
Non-current assetsInvestment properties 12 1,725,633 1,548,539 1,500,000 1,342,627Property, plant and equipment 13 1,428,255 1,263,617 – –Investment in subsidiaries 14 – – 344,792 344,792Amount due from subsidiaries 14 – – 1,224,979 1,198,083Deferred tax assets 15 3,701 3,032 – –
3,157,589 2,815,188 3,069,771 2,885,502
Current assetsInventories 16 842 927 – –Trade receivables 17 9,684 8,267 707 787Other receivables & prepayments 18 7,611 4,353 1,467 605Amount due from subsidiaries 14 – – 94,384 56,485Deposits with licensed financial institutions 19 79,296 107,370 37,101 89,029Cash at banks 70,612 55,515 806 705
168,045 176,432 134,465 147,611
Total assets 3,325,634 2,991,620 3,204,236 3,033,113
The accompanying accounting policies and explanatory notes form an integral part of the financial statements.
Statements of Financial Position
as at 30 June 2014
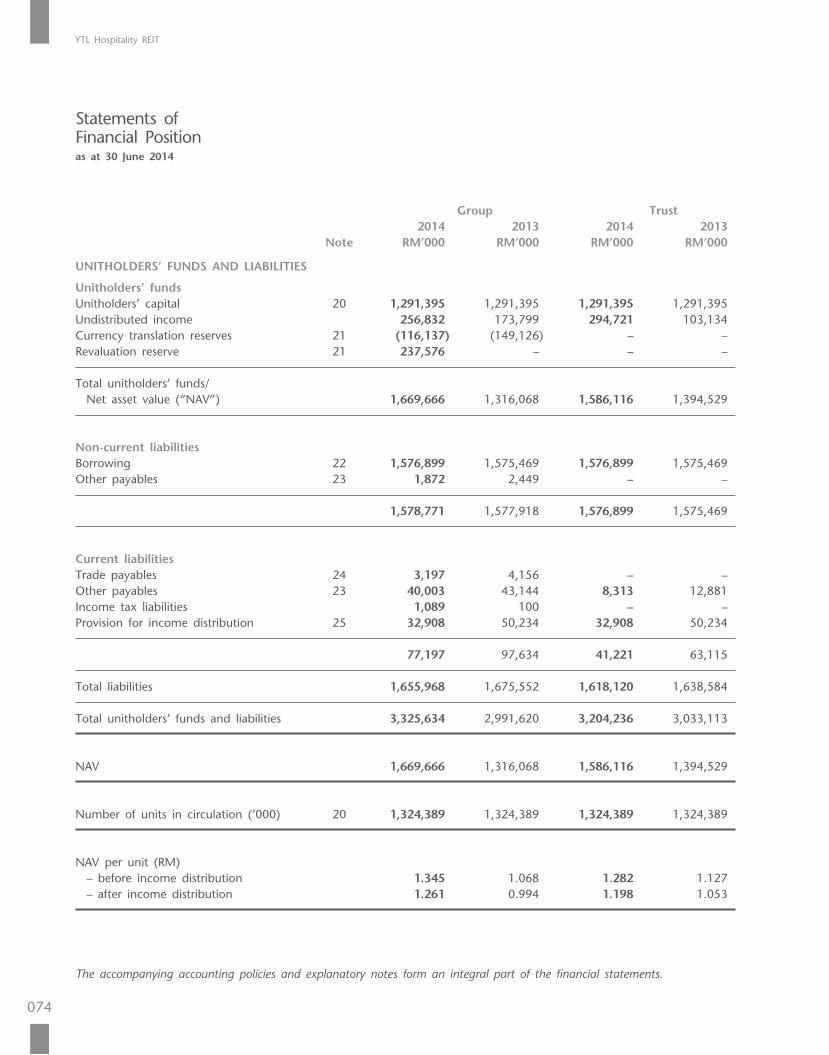
YTL Hospitality REIT
074
Group Trust 2014 2013 2014 2013 Note RM’000 RM’000 RM’000 RM’000
UNITHOLDERS’ FUNDS AND LIABILITIES
Unitholders’ fundsUnitholders’ capital 20 1,291,395 1,291,395 1,291,395 1,291,395Undistributed income 256,832 173,799 294,721 103,134Currency translation reserves 21 (116,137) (149,126) – –Revaluation reserve 21 237,576 – – –
Total unitholders’ funds/ Net asset value (“NAV”) 1,669,666 1,316,068 1,586,116 1,394,529
Non-current liabilitiesBorrowing 22 1,576,899 1,575,469 1,576,899 1,575,469Other payables 23 1,872 2,449 – –
1,578,771 1,577,918 1,576,899 1,575,469
Current liabilitiesTrade payables 24 3,197 4,156 – –Other payables 23 40,003 43,144 8,313 12,881Income tax liabilities 1,089 100 – –Provision for income distribution 25 32,908 50,234 32,908 50,234
77,197 97,634 41,221 63,115
Total liabilities 1,655,968 1,675,552 1,618,120 1,638,584
Total unitholders’ funds and liabilities 3,325,634 2,991,620 3,204,236 3,033,113
NAV 1,669,666 1,316,068 1,586,116 1,394,529
Number of units in circulation (’000) 20 1,324,389 1,324,389 1,324,389 1,324,389
NAV per unit (RM) – before income distribution 1.345 1.068 1.282 1.127 – after income distribution 1.261 0.994 1.198 1.053
The accompanying accounting policies and explanatory notes form an integral part of the financial statements.
Statements of Financial Positionas at 30 June 2014
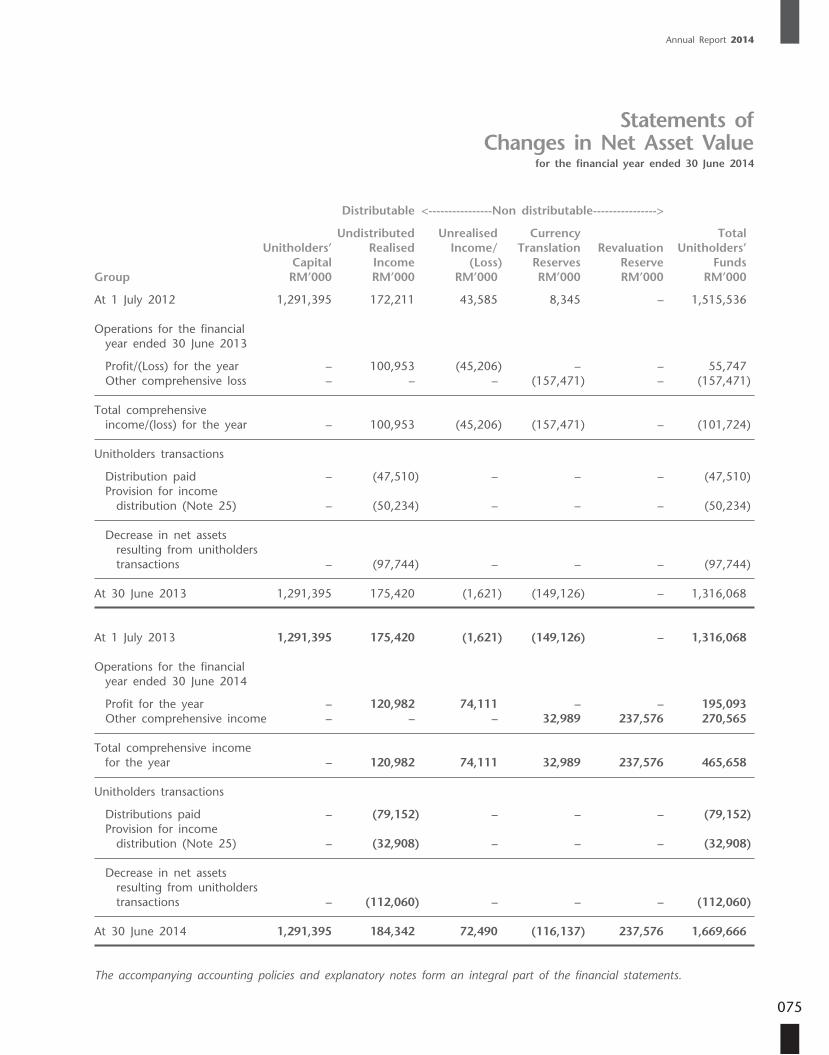
Annual Report 2014
075
Distributable <----------------Non distributable---------------->
Undistributed Unrealised Currency Total Unitholders’ Realised Income/ Translation Revaluation Unitholders’ Capital Income (Loss) Reserves Reserve FundsGroup RM’000 RM’000 RM’000 RM’000 RM’000 RM’000
At 1 July 2012 1,291,395 172,211 43,585 8,345 – 1,515,536
Operations for the financial year ended 30 June 2013
Profit/(Loss) for the year – 100,953 (45,206) – – 55,747 Other comprehensive loss – – – (157,471) – (157,471)
Total comprehensive income/(loss) for the year – 100,953 (45,206) (157,471) – (101,724)
Unitholders transactions
Distribution paid – (47,510) – – – (47,510) Provision for income distribution (Note 25) – (50,234) – – – (50,234)
Decrease in net assets resulting from unitholders transactions – (97,744) – – – (97,744)
At 30 June 2013 1,291,395 175,420 (1,621) (149,126) – 1,316,068
At 1 July 2013 1,291,395 175,420 (1,621) (149,126) – 1,316,068
Operations for the financial year ended 30 June 2014
Profit for the year – 120,982 74,111 – – 195,093 Other comprehensive income – – – 32,989 237,576 270,565
Total comprehensive income for the year – 120,982 74,111 32,989 237,576 465,658
Unitholders transactions
Distributions paid – (79,152) – – – (79,152) Provision for income distribution (Note 25) – (32,908) – – – (32,908)
Decrease in net assets resulting from unitholders transactions – (112,060) – – – (112,060)
At 30 June 2014 1,291,395 184,342 72,490 (116,137) 237,576 1,669,666
The accompanying accounting policies and explanatory notes form an integral part of the financial statements.
Statements of Changes in Net Asset Value
for the financial year ended 30 June 2014
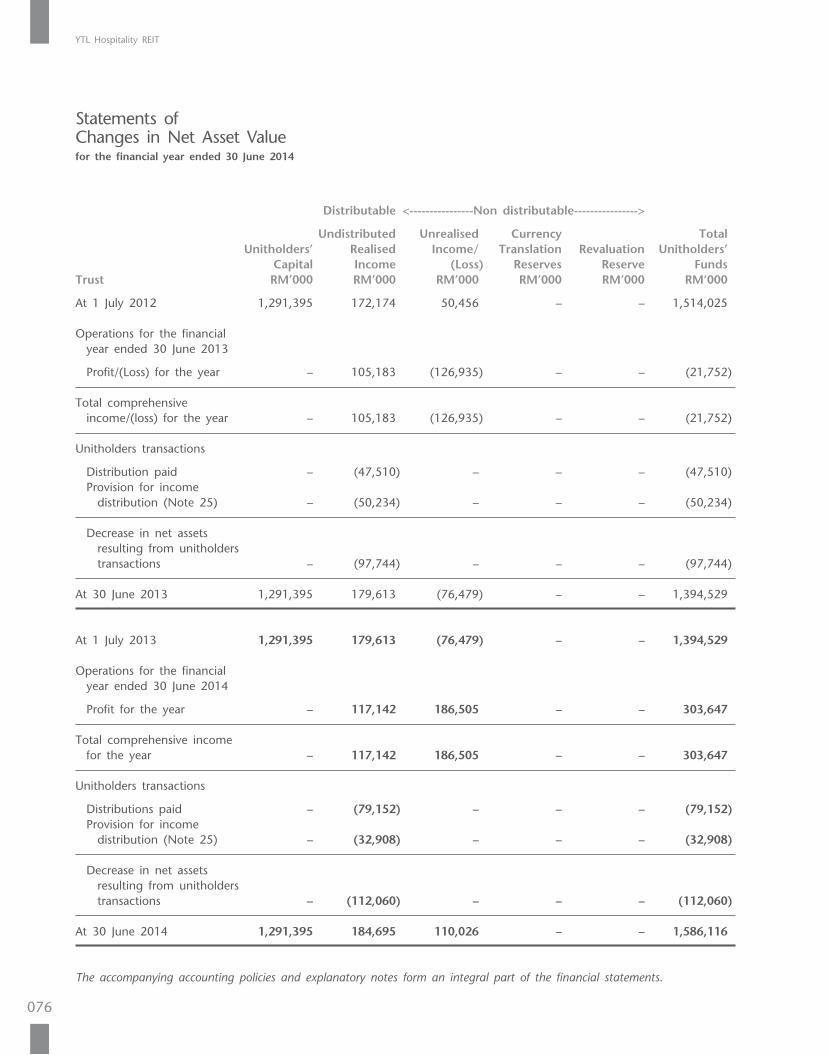
YTL Hospitality REIT
076
Distributable <----------------Non distributable---------------->
Undistributed Unrealised Currency Total Unitholders’ Realised Income/ Translation Revaluation Unitholders’ Capital Income (Loss) Reserves Reserve FundsTrust RM’000 RM’000 RM’000 RM’000 RM’000 RM’000
At 1 July 2012 1,291,395 172,174 50,456 – – 1,514,025
Operations for the financial year ended 30 June 2013
Profit/(Loss) for the year – 105,183 (126,935) – – (21,752)
Total comprehensive income/(loss) for the year – 105,183 (126,935) – – (21,752)
Unitholders transactions
Distribution paid – (47,510) – – – (47,510) Provision for income distribution (Note 25) – (50,234) – – – (50,234)
Decrease in net assets resulting from unitholders transactions – (97,744) – – – (97,744)
At 30 June 2013 1,291,395 179,613 (76,479) – – 1,394,529
At 1 July 2013 1,291,395 179,613 (76,479) – – 1,394,529
Operations for the financial year ended 30 June 2014
Profit for the year – 117,142 186,505 – – 303,647
Total comprehensive income for the year – 117,142 186,505 – – 303,647
Unitholders transactions
Distributions paid – (79,152) – – – (79,152) Provision for income distribution (Note 25) – (32,908) – – – (32,908)
Decrease in net assets resulting from unitholders transactions – (112,060) – – – (112,060)
At 30 June 2014 1,291,395 184,695 110,026 – – 1,586,116
The accompanying accounting policies and explanatory notes form an integral part of the financial statements.
Statements of Changes in Net Asset Valuefor the financial year ended 30 June 2014
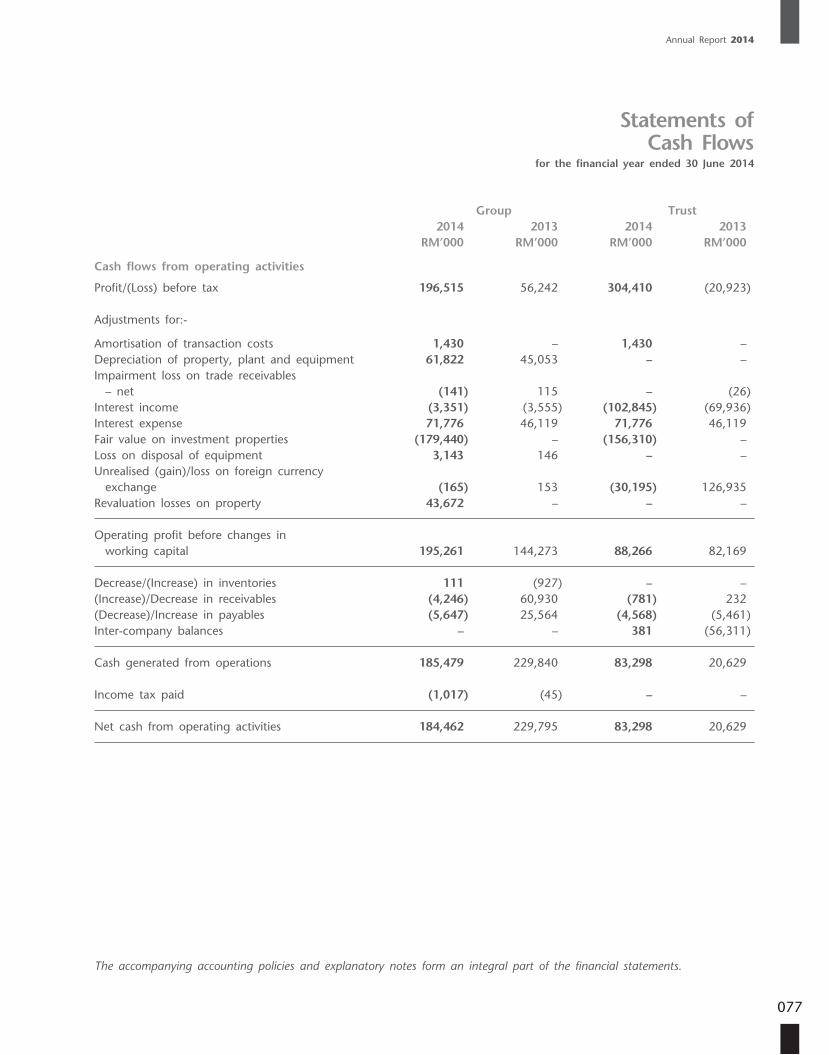
Annual Report 2014
077
Group Trust 2014 2013 2014 2013 RM’000 RM’000 RM’000 RM’000
Cash flows from operating activities
Profit/(Loss) before tax 196,515 56,242 304,410 (20,923)
Adjustments for:-
Amortisation of transaction costs 1,430 – 1,430 –Depreciation of property, plant and equipment 61,822 45,053 – –Impairment loss on trade receivables – net (141) 115 – (26)Interest income (3,351) (3,555) (102,845) (69,936)Interest expense 71,776 46,119 71,776 46,119Fair value on investment properties (179,440) – (156,310) –Loss on disposal of equipment 3,143 146 – –Unrealised (gain)/loss on foreign currency exchange (165) 153 (30,195) 126,935Revaluation losses on property 43,672 – – –
Operating profit before changes in working capital 195,261 144,273 88,266 82,169
Decrease/(Increase) in inventories 111 (927) – –(Increase)/Decrease in receivables (4,246) 60,930 (781) 232(Decrease)/Increase in payables (5,647) 25,564 (4,568) (5,461)Inter-company balances – – 381 (56,311)
Cash generated from operations 185,479 229,840 83,298 20,629
Income tax paid (1,017) (45) – –
Net cash from operating activities 184,462 229,795 83,298 20,629
The accompanying accounting policies and explanatory notes form an integral part of the financial statements.
Statements of Cash Flows
for the financial year ended 30 June 2014
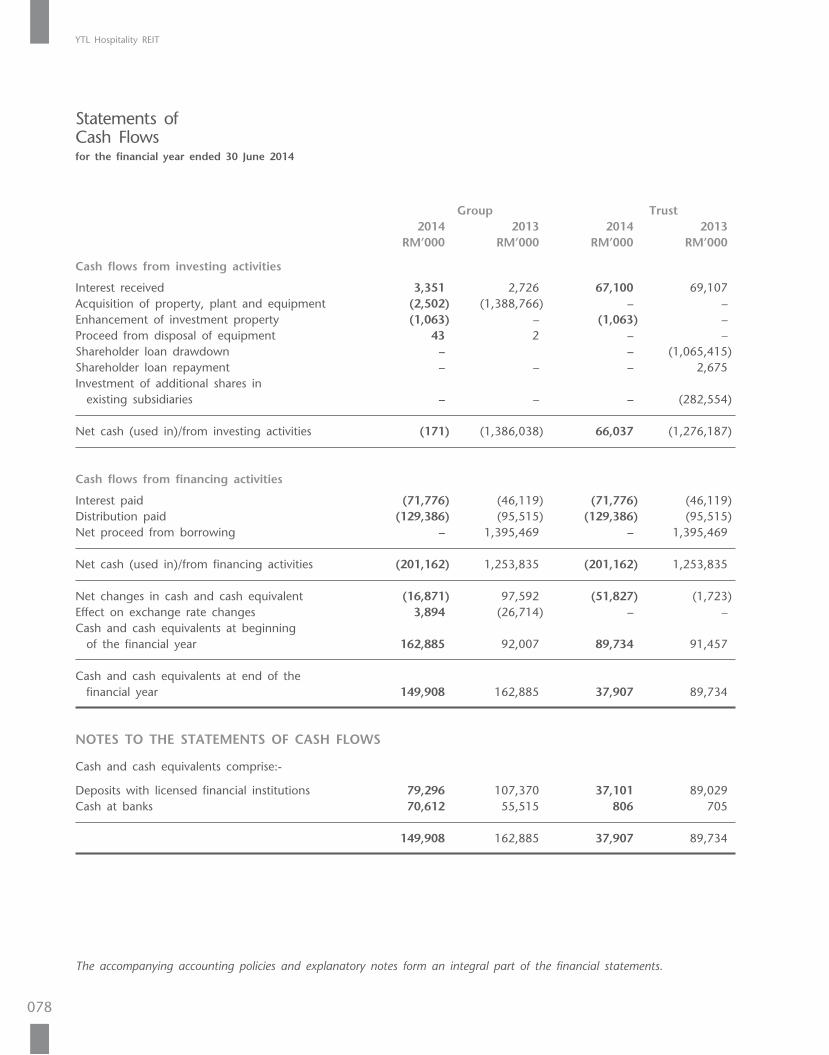
YTL Hospitality REIT
078
Group Trust 2014 2013 2014 2013 RM’000 RM’000 RM’000 RM’000
Cash flows from investing activities
Interest received 3,351 2,726 67,100 69,107Acquisition of property, plant and equipment (2,502) (1,388,766) – –Enhancement of investment property (1,063) – (1,063) –Proceed from disposal of equipment 43 2 – –Shareholder loan drawdown – – (1,065,415)Shareholder loan repayment – – – 2,675Investment of additional shares in existing subsidiaries – – – (282,554)
Net cash (used in)/from investing activities (171) (1,386,038) 66,037 (1,276,187)
Cash flows from financing activities
Interest paid (71,776) (46,119) (71,776) (46,119)Distribution paid (129,386) (95,515) (129,386) (95,515)Net proceed from borrowing – 1,395,469 – 1,395,469
Net cash (used in)/from financing activities (201,162) 1,253,835 (201,162) 1,253,835
Net changes in cash and cash equivalent (16,871) 97,592 (51,827) (1,723)Effect on exchange rate changes 3,894 (26,714) – –Cash and cash equivalents at beginning of the financial year 162,885 92,007 89,734 91,457
Cash and cash equivalents at end of the financial year 149,908 162,885 37,907 89,734
NOTES TO THE STATEMENTS OF CASH FLOWS
Cash and cash equivalents comprise:-
Deposits with licensed financial institutions 79,296 107,370 37,101 89,029Cash at banks 70,612 55,515 806 705
149,908 162,885 37,907 89,734
The accompanying accounting policies and explanatory notes form an integral part of the financial statements.
Statements of Cash Flowsfor the financial year ended 30 June 2014
Annual Report 2014
079
1. GENERAL INFORMATION
The principal activity of Pintar Projek Sdn. Bhd., the Manager of YTL Hospitality REIT (the “Trust”), is the management of real estate investment trusts.
YTL Hospitality REIT was established on 18 November 2005 pursuant to a trust deed dated 18 November 2005 (“Deed”) between the Manager and Maybank Trustees Berhad (“Trustee”) and is categorised as a real property fund. During the financial year, the Deed was replaced by a restated deed dated 3 December 2013 (“Restated Deed”) entered into between the Manager and the Trustee.
YTL Hospitality REIT was listed on the Main Market of Bursa Malaysia Securities Berhad (“Bursa Securities”) on 16 December 2005 and is an income and growth type fund. The investment objective of YTL Hospitality REIT is to own and invest in real estate and real estate-related assets, whether directly or indirectly through the ownership of single-purpose companies whose principal assets comprise real estate.
The consolidated financial statements reported for the financial year ended 30 June 2014 relates to the Trust and its subsidiaries (the “Group”).
The address of the registered office and principal place of business of the Manager is as follows:-
11th Floor, Yeoh Tiong Lay Plaza 55 Jalan Bukit Bintang 55100 Kuala Lumpur
The address of the principal place of business of the Trust is as follows:-
11th Floor, Yeoh Tiong Lay Plaza 55 Jalan Bukit Bintang 55100 Kuala Lumpur
2. BASIS OF PREPARATION
(a) Statement of Compliance
The financial statements of the Group and the Trust have been prepared in accordance with Malaysian Financial Reporting Standards (“MFRSs”), International Financial Reporting Standards, accounting principles generally acceptable in Malaysia, the Securities Commission Malaysia (“SC”)’s Guidelines on Real Estate Investment Trusts (“REIT Guidelines”) and the Restated Deed.
(b) These financial statements have been prepared on the historical cost convention (unless stated otherwise in the significant accounting policies).
(c) Functional and presentation currency
The individual financial statements of each entity in the Group are measured using the currency of the primary economic environment in which the entity operates (“the functional currency”). The consolidated financial statements are presented in Ringgit Malaysia (“RM”), which is also the Trust’s functional currency. All financial information is presented in RM and has been rounded to the nearest thousand (RM’000), unless otherwise stated.
Notes to the Financial Statements
YTL Hospitality REIT
080
2. BASIS OF PREPARATION (CONTINUED)
(d) Changes in accounting policies
The Group and the Trust adopted the following standards of the MFRS Framework that were issued by the Malaysian Accounting Standards Board (“MASB”) for annual financial year beginning on or after 1 July 2013.
MFRSs and IC Interpretations (Including The Consequential Amendments) MFRS 10, Consolidated Financial Statements MFRS 11, Joint Arrangements MFRS 12, Disclosure of Interests in Other Entities MFRS 13, Fair Value Measurement MFRS 119, Employee Benefits (2011) MFRS 127, Separate Financial Statements MFRS 128, Investments in Associates and Joint Ventures Amendments to MFRS 1, Government Loans Amendments to MFRS 7, Disclosures – Offsetting Financial Assets and Financial Liabilities Amendments to MFRS 10, MFRS 12 and MFRS 127, Transition Guidance IC Interpretation 20, Stripping Costs in the Production Phase of a Surface Mine Amendments to MFRSs Annual Improvements 2009 – 2011 Cycle
The adoption of the above accounting standards, amendments and interpretation did not have any significant financial impact to the Group and the Trust other than additional disclosures, as discussed below:-
MFRS 10, Consolidated Financial Statements
MFRS 10 replaces all the guidance on control and consolidation in FRS 127, ‘Consolidated and separate financial statements’ and IC Int 112 Consolidation – Special Purpose Entities. Under MFRS 10, subsidiaries are all entities (including structured entities) over which the Group has control. The Group controls an entity when the Group has power over an entity, is exposed to, or has rights to, variable returns from its involvement with the entity and has the ability to affect these returns through its power over the entity. Subsidiaries are fully consolidated from the date on which control is transferred to the Group. They are deconsolidated from the date that control ceases.
The Group has applied MFRS 10 retrospectively in accordance with the transitional provisions of MFRS 10. The adoption of MFRS 10 did not result in substantial changes to the Group’s financial statements.
MFRS 13, Fair Value Measurement
MFRS 13 aims to improve consistency and reduce complexity by providing a precise definition of fair value and a single source of fair value measurement and disclosure requirements for use across MFRSs. The requirements do not extend the use of fair value accounting but provide guidance on how it should be applied where its use is already required or permitted by other standards within MFRSs.
The adoption of MFRS 13 does not have any material impact on the accounting policies of the Group. The Group has incorporated the additional disclosures required by MFRS 13 into the financial statements.
Notes to the Financial Statements
Annual Report 2014
081
2. BASIS OF PREPARATION (CONTINUED)
(e) The new or revised financial reporting standard not yet effective
The following are accounting standards, amendments and interpretation of the MFRS Framework that have been issued by the MASB but have not been adopted by the Group and the Trust.
MFRSs and IC Interpretations (Including The Consequential Amendments) Effective Date
Amendments to MFRS 10, Consolidated Financial Statements: Investment Entities 1 January 2014
Amendments to MFRS 12, Disclosure of Interests in Other Entities: Investment Entities 1 January 2014
Amendments to MFRS 127, Separate Financial Statements (2011): Investment Entities 1 January 2014
Amendments to MFRS 132, Financial Instruments: Presentation – Offsetting Financial Assets and Financial Liabilities
1 January 2014
Amendments to MFRS 136, Impairment of Assets – Recoverable Amount Disclosures for Non-Financial Assets
1 January 2014
Amendments to MFRS 139, Financial Instruments: Recognition and Measurement – Novation of Derivatives and Continuation of Hedge Accounting
1 January 2014
IC Interpretation 21, Levies 1 January 2014
Amendments to MFRS 1, First-time Adoption of Malaysian Financial Reporting Standards (Annual Improvements 2011-2013 Cycle)
1 July 2014
Amendments to MFRS 2, Share-based Payment (Annual Improvements 2010-2012 Cycle)
1 July 2014
Amendments to MFRS 3, Business Combinations (Annual Improvements 2010-2012 Cycle and 2011-2013 Cycle)
1 July 2014
Amendments to MFRS 8, Operating Segments (Annual Improvements 2010-2012 Cycle) 1 July 2014
Amendments to MFRS 13, Fair Value Measurement (Annual Improvements 2010-2012 Cycle and 2011-2013 Cycle)
1 July 2014
Amendments to MFRS 116, Property, Plant and Equipment (Annual Improvements 2010-2012 Cycle)
1 July 2014
Amendments to MFRS 119, Employee Benefits – Defined Benefit Plans: Employee Contributions
1 July 2014
Amendments to MFRS 124, Related Party Disclosures (Annual Improvements 2010-2012 Cycle)
1 July 2014
Amendments to MFRS 138, Intangible Assets (Annual Improvements 2010-2012 Cycle) 1 July 2014
Amendments to MFRS 140, Investment Property (Annual Improvements 2011-2013 Cycle) 1 July 2014
MFRS 9, Financial Instruments (2009) To be announced by the MASB Board
MFRS 9, Financial Instruments (2010) To be announced by the MASB Board
MFRS 9, Financial Instruments – Hedge Accounting and Amendments to MFRS 9, MFRS 7 and MFRS 139
To be announced by the MASB Board
Amendments to MFRS 7, Financial Instruments: Disclosures – Mandatory Effective Date of MFRS 9 and Transition Disclosures
Effective upon application of MFRS 9
The Group and the Trust are in the process of assessing the impact of implementing these standards since the effects would only be observable in the future financial years.
Notes to the Financial Statements
YTL Hospitality REIT
082
2. BASIS OF PREPARATION (CONTINUED)
(f) Use of estimates and judgements
The preparation of the financial statements in conformity with MFRSs requires the Directors of the Manager to make judgements, estimates and assumptions that affect the application of accounting policies and the reported amounts of assets, liabilities, income and expenses. Actual results may differ from these estimates.
Estimates and underlying assumptions are reviewed on an ongoing basis. Revisions to accounting estimates are recognised in the period in which the estimates are revised and in any future periods affected.
There are no significant areas of estimation uncertainty and critical judgements in applying accounting policies that have significant effect on the amounts recognised in the financial statements other than those disclosed below:-
(i) Provisions The Trust recognises provisions when it has a present legal or constructive obligation arising as a result
of a past event, and it is probable that an outflow of economic benefits will be required to settle the obligation and a reliable estimate can be made. The recording of provisions requires the application of judgements about the ultimate resolution of these obligations. As a result, provisions are reviewed at each reporting date and adjusted to reflect the Trust’s current best estimate.
(ii) Impairment loss on trade receivables The Group and the Trust assess at each reporting date whether there is objective evidence that trade
receivables have been impaired. Impairment loss is calculated based on a review of the current status of existing receivables and historical collections experience. Such provisions are adjusted periodically to reflect the actual and anticipated impairment.
(iii) Depreciation of property, plant and equipment The estimates for the residual values, useful lives and related depreciation charges for the property, plant
and equipment are based on commercial and production factors which could change significantly as a result of technical innovations and competitors’ actions in response to the market conditions. The Group anticipates that the residual values of its property, plant and equipment will be insignificant. As a result, residual values are not being taken into consideration for the computation of the depreciable amount.
Changes in the expected level of usage and technological development could impact the economic useful lives and the residual values of these assets, therefore future depreciation charges could be revised.
(iv) Fair value estimates for investment properties The Group and the Trust carry investment properties at fair value, which requires extensive use of
accounting estimates and judgements. While significant components of fair value measurement were determined using verifiable objective evidence, the amount of changes in fair value would differ if the Group and the Trust use different valuation methodologies. Any changes in fair value of these investment properties would affect profit or loss.
Notes to the Financial Statements
Annual Report 2014
083
2. BASIS OF PREPARATION (CONTINUED)
(f) Use of estimates and judgements (continued)
(v) Revaluation of properties The Group’s properties which are reported at valuation are based on valuation performed by independent
professional valuers. The independent professional valuers have exercised judgement in determined discount rates, estimates of future cash flows, capitalisation rate, terminal year value, market rental and other factors used in the valuation process. Also, judgement has been applied in estimating prices for less readily observable external parameters. Other factors such as model assumptions, market dislocations and unexpected correlations can also materially affect these estimates and the resulting valuation estimates.
(g) Basis of consolidation
The consolidated financial statements comprise the financial statements of the Trust and its subsidiaries as at the reporting date. The financial statements of the subsidiaries used in the preparation of the consolidated financial statements are prepared for the same reporting date as the Trust.
Subsidiaries are all entities (including structured entities) over which the Group has control. The Group controls an entity when the Group is exposed to, or has rights to, variable returns from its involvement with the entity and has the ability to affect those returns through its power over the entity. Subsidiaries are fully consolidated from the date on which control is transferred to the Group. They are deconsolidated from the date that control ceases.
Inter-company transactions, balances and unrealised gains on transactions between Group companies are eliminated. Unrealised losses are also eliminated. Accounting policies of subsidiaries have been changed where necessary to ensure consistency with the policies adopted by the Group.
Non-controlling interests are that part of the net results of operations and of net assets of a subsidiary attributable to the interests which are not owned directly or indirectly by the equity holders of the Company. They are shown separately in the consolidated statement of comprehensive income, statement of changes in net asset value and statement of financial position. Total comprehensive income is attributed to the non-controlling interests based on their respective interests in a subsidiary, even if this results in the non-controlling interests having a deficit balance.
(i) Acquisitions The acquisition method of accounting is used to account for business combinations by the Group.
The consideration transferred for the acquisition of a subsidiary or business comprises the fair value of the assets transferred, the liabilities incurred and the equity interests issued by the Group. The consideration transferred also includes the fair value of any contingent consideration arrangement.
If the business combination is achieved in stages, the acquisition date carrying value of the acquirer’s previously held equity interest in the acquiree is remeasured to fair value at the acquisition date; any gains or losses arising from such re-measurement are recognised in profit or loss.
Acquisition-related costs are expensed as incurred.
Notes to the Financial Statements
YTL Hospitality REIT
084
2. BASIS OF PREPARATION (CONTINUED)
(g) Basis of consolidation (continued)
(i) Acquisitions (continued) Identifiable assets acquired and liabilities and contingent liabilities assumed in a business combination are,
with limited exceptions, measured initially at their fair values at the acquisition date.
On an acquisition-by-acquisition basis, the Group recognises any non-controlling interest in the acquiree at the date of acquisition either at fair value or at the non-controlling interest’s proportionate share of the acquiree’s identifiable net assets.
The excess of (a) the consideration transferred, the amount of any non-controlling interest in the acquiree and the acquisition-date fair value of any previously-held equity interest in the acquiree over the (b) fair values of the identifiable assets acquired net of the fair values of the liabilities and any contingent liabilities assumed, is recorded as goodwill.
(ii) Disposals When a change in the Group’s ownership interest in a subsidiary results in a loss of control over the
subsidiary, the assets and liabilities of the subsidiary including any goodwill are derecognised. Amounts previously recognised in other comprehensive income in respect of that entity are also reclassified to profit or loss or transferred directly to undistributed income if required by a specific Standard.
Any retained equity interest in the entity is remeasured at fair value. The difference between the carrying amount of the retained interest at the date when control is lost and its fair value is recognised in profit or loss.
The accounting policy on investment in subsidiaries are disclosed in Note 3(f) to the Financial Statements.
3. SIGNIFICANT ACCOUNTING POLICIES
(a) Investment properties
(i) Investment properties carried at fair value Investment properties consist of freehold and leasehold land & buildings which are held for long term
rental yield or for capital appreciation or both.
Investment properties are measured initially at cost and subsequently at fair value with any change therein recognised in profit or loss for the period in which they arise.
An investment property is derecognised on its disposal, or when it is permanently withdrawn from use and no future economic benefits are expected from its disposal. The difference between the net disposal proceeds and the carrying amount is recognised in profit or loss in the period in which the item is derecognised.
A property interest held under operating lease is classified and accounted for as investment property as the Group holds it to earn rental income or for capital appreciation or both.
Notes to the Financial Statements
Annual Report 2014
085
3. SIGNIFICANT ACCOUNTING POLICIES (CONTINUED)
(a) Investment properties (continued)
(ii) Determination of fair value An external, independent valuation firm, having appropriate recognised professional qualifications and
recent experience in the location and category of property being valued, values the Group’s investment property portfolio at least once in every 3 years from the last valuation, in compliance with the SC’s REIT Guidelines. Effective current financial year, the frequency of revaluation of the Group’s real estate assets has changed to at least once during each financial year.
The fair values are based on market values, being the estimated amount for which a property could be exchanged on the date of the valuation between a willing buyer and a willing seller in an arm’s length transaction after proper marketing wherein the parties had each acted knowledgeably, prudently and without compulsion.
In the absence of current prices in an active market, the valuations are prepared by considering the aggregate of the estimated cash flows expected to be received from renting out the property. A yield that reflects the specific risks inherent in the net cash flows is then applied to the net annual cash flows to arrive at the property valuation.
Valuations reflect, where appropriate:-
• the type of tenants actually in occupation or responsible for meeting lease commitments or likely to be in occupation after letting vacant accommodation, and the market’s general perception of their creditworthiness;
• the allocation of property taxes, maintenance and insurance responsibilities between the Group and the lessee; and
• the remaining economic life of the property.
When lease renewals are pending with anticipated reversionary increases, it is assumed that all notices and where appropriate counter-notices have been served validly and within the appropriate time.
An investment property is derecognised on its disposal, or when it is permanently withdrawn from use and no future economic benefits are expected from its disposal. The difference between the net disposal proceeds and the carrying amount is recognised in profit or loss in the period in which the item is derecognised.
Any increase or decrease arising from changes in the fair value is credited or charged directly to profit or loss as a net appreciation or depreciation in the value of the investment properties.
Notes to the Financial Statements
YTL Hospitality REIT
086
3. SIGNIFICANT ACCOUNTING POLICIES (CONTINUED)
(b) Leases
(i) Operating leases – as lessee Leases of assets where substantially all risks and rewards incidental to ownership are retained by the lessors
are classified as operating leases. Payments made under operating leases (net of any incentives received from the lessors) are recognised in the profit or loss on a straight-line basis over the period of the lease.
(ii) Operating leases – as lessor Leases of properties where the Group and the Trust retain substantially all risks and rewards incidental to
ownership are classified as operating leases. Rental income from operating leases (net of any incentives given to the lessees) is recognised in the profit or loss on a straight-line basis over the lease term.
(c) Property, plant & equipment and depreciation
Property, plant & equipment are stated at cost less accumulated depreciation and accumulated impairment losses. Cost includes expenditure that is directly attributable to the acquisition of the items.
Freehold land and buildings are initially recognised at cost. Freehold land is subsequently carried at the revalued amount less accumulated impairment losses. Buildings are subsequently carried at the revalued amounts less accumulated depreciation and accumulated impairment losses while equipment and other assets are carried at cost less accumulated depreciation and any accumulated impairment losses. Valuations are performed with sufficient frequency to ensure that the fair value of a revalued asset does not differ materially from its carrying amount.
Subsequent costs are included in the asset’s carrying amount or recognised as a separate asset, as appropriate, only when it is probable that future economic benefits associated with the item will flow to the Group and the cost of the item can be measured reliably. The carrying amount of the replaced part is derecognised. All other repairs and maintenance are charged to the profit or loss during the financial year in which they are incurred.
Depreciation on property, plant & equipment is calculated on the straight line basis at rates required to write off the cost of the property, plant & equipment over their estimated useful lives.
The principal annual rates of depreciation used are as follows:-
Buildings 4% Equipment 4% – 25% Other assets 19%
Residual values, useful life and depreciation method of assets are reviewed at each financial year end to ensure that the amount, method and period of depreciation are consistent with previous estimates and the expected pattern of consumption of the future economic benefits embodied in the items of property, plant & equipment.
Gains and losses on disposals are determined by comparing net disposal proceeds with net carrying amount and are recognised in the profit or loss.
Notes to the Financial Statements
Annual Report 2014
087
3. SIGNIFICANT ACCOUNTING POLICIES (CONTINUED)
(c) Property, plant & equipment and depreciation (continued)
A revaluation surplus is recorded in other comprehensive income and credited to the revaluation reserve. However, to the extent that it reverses a revaluation deficit of the same asset previously recognised in profit or loss, the increase is recognised in profit and loss. A revaluation deficit is recognised in the profit or loss, except to the extent that it offsets an existing surplus on the same asset recognised in the revaluation reserve.
Accumulated depreciation as at the revaluation date is eliminated against the gross carrying amount of the asset and the net amount is restated to the revalued amount of the asset. Upon disposal, any revaluation reserve relating to the particular asset being sold is transferred to undistributed income.
(d) Impairment of non-financial assets
The carrying amounts of assets, other than inventories, are reviewed at each reporting date to determine whether there is any indication of impairment. If any such indication exists, the asset’s recoverable amount is estimated to determine the amount of impairment loss.
An impairment loss is recognised for the amount by which the carrying amount of the asset exceeds its recoverable amount. The recoverable amount is the higher of an asset’s fair value less cost to sell and value in use. For the purposes of assessing impairment, assets are grouped at the lowest levels for which there is separately identifiable cash flows (cash-generating units). Non-financial assets that suffered impairment are reviewed for possible reversal of the impairment at each reporting date.
An impairment loss is charged to the profit or loss immediately, unless the asset is carried at revalued amount. Any impairment loss of a revalued asset is treated as a revaluation decrease to the extent of previously recognised revaluation surplus for the same asset.
Any subsequent increase in the recoverable amount of an asset is treated as reversal of the previous impairment loss and is recognised to the extent of the carrying amount of the asset that would have been determined (net of amortisation and depreciation) had no impairment loss been recognised. The reversal is recognised in the profit or loss immediately, unless the asset is carried at revalued amount. A reversal of an impairment loss on a revalued asset is credited directly to revaluation surplus. However, to the extent that an impairment loss on the same revalued asset was previously recognised as an expense in the profit or loss, a reversal of that impairment loss is recognised as income in the profit or loss.
(e) Inventories
Inventories are measured at the lower of cost and net realisable value.
The cost of inventories is based on the first-in-first-out principle, and includes expenditure incurred in acquiring the inventories, production or conversion costs, and other costs incurred in bringing them to their existing location and condition.
Net realisable value is the estimated selling price in the ordinary course of business, less the estimated costs necessary to make the sale.
Notes to the Financial Statements
YTL Hospitality REIT
088
3. SIGNIFICANT ACCOUNTING POLICIES (CONTINUED)
(f) Investment in subsidiaries
In the Trust’s separate financial statements, investments in subsidiaries are accounted for at cost less accumulated impairment losses. On disposal of investments in subsidiaries, the difference between disposal proceeds and the carrying amounts of the investments are recognised in profit and loss.
(g) Financial assets
Financial assets are recognised in the Statements of Financial Position when, and only when, the Group and the Trust become a party to the contractual provisions of the financial instrument.
When financial assets are recognised initially, they are measured at fair value, plus, in the case of a financial assets not at fair value through profit or loss, directly attributable transaction costs.
The Group and the Trust determine the classification of their financial assets at initial recognition, and the categories include loans and receivables.
Loans and receivables
Financial assets with fixed or determinable payments that are not quoted in an active market are classified as loans and receivables. Subsequent to initial recognition, loans and receivables are measured at amortised cost using the effective interest method. Gains and losses are recognised in profit or loss when the loans and receivables are derecognised or impaired, and through the amortisation process.
A financial asset is derecognised when the contractual right to receive cash flows from the asset has expired. On derecognition of a financial asset in its entirety, the difference between the carrying amount and the sum of the consideration received and any cumulative gain or loss that had been recognised in other comprehensive income is recognised in profit or loss.
(h) Impairment of financial assets
The Group and the Trust assess at each reporting date whether there is any objective evidence that a financial asset is impaired.
Loans and receivables
The amount of the loss is measured as the difference between the asset’s carrying amount and the present value of estimated future cash flows (excluding future credit losses that have not been incurred) discounted at the financial asset’s original effective interest rate. The carrying amount of the asset is reduced and the amount of the loss is recognised in profit or loss.
If, in a subsequent period, the fair value of a debt instrument increases and the increase can be objectively related to an event occurring after the impairment loss was recognised in profit or loss, the impairment loss is reversed, to the extent that the asset’s carrying amount does not exceed what the carrying amount would have been had the impairment not been recognised at the date the impairment is reversed. The amount of the reversal is recognised in profit or loss.
Notes to the Financial Statements
Annual Report 2014
089
3. SIGNIFICANT ACCOUNTING POLICIES (CONTINUED)
(i) Cash and cash equivalents
Cash and cash equivalents consist of cash at banks and deposits with licensed financial institutions.
Cash and cash equivalents are categorised and measured as loans and receivables in accordance with policy in Note 3(g).
(j) Interest-bearing borrowings
Borrowing costs that are not directly attributable to the acquisition, construction or production of a qualifying asset are recognised in profit or loss using the effective interest method.
Borrowing costs directly attributable to the acquisition, construction or production of qualifying assets, which are assets that necessarily take a substantial period of time to get ready for their intended use or sale, are capitalised as part of the cost of those assets.
The capitalisation of borrowing costs as part of the cost of a qualifying asset commences when expenditure for the asset is being incurred, borrowing costs are being incurred and activities that are necessary to prepare the asset for its intended use or sale are in progress. Capitalisation of borrowing costs is suspended or ceases when substantially all the activities necessary to prepare the qualifying asset for its intended use or sale are interrupted or completed.
Investment income earned on the temporary investment of specific borrowings pending their expenditure on qualifying assets is deducted from the borrowing costs eligible for capitalisation.
(k) Financial liabilities
Financial liabilities are classified according to the substance of the contractual arrangements entered into and the definitions of a financial liability.
Financial liabilities are recognised in the Statements of Financial Position when, and only when, the Group and the Trust become a party to the contractual provisions of the financial instrument. Financial liabilities are classified as other financial liabilities.
Other financial liabilities
The Group’s and the Trust’s other financial liabilities include trade and other payables and borrowings.
Trade and other payables are recognised initially at fair value plus directly attributable transaction costs and subsequently measured at amortised cost using the effective interest method.
Borrowings are recognised initially at fair value, net of transaction costs incurred, and subsequently measured at amortised cost using the effective interest method.
For other financial liabilities, gains and losses are recognised in profit or loss when the liabilities are derecognised, and through amortisation process.
A financial liability is derecognised when the obligation under the liability is extinguished.
Notes to the Financial Statements
YTL Hospitality REIT
090
3. SIGNIFICANT ACCOUNTING POLICIES (CONTINUED)
(l) Provisions
A provision is recognised when it is probable that an outflow of resources embodying economic benefits will be required to settle a present obligation (legal or constructive) as a result of a past event and a reliable estimate can be made of the amount. Provisions are determined by discounting the expected future cash flows at a pre-tax rate that reflects current market assessments of the time value of money and the risks specific to the liability. The unwinding of the discount is recognised as finance cost.
Provision for income distribution
Provision for income distribution is recognised when any distribution is declared, determined or publicly recommended by the Directors of the Manager but not distributed at the reporting date.
(m) Income tax and deferred tax
Income tax on the profit or loss for the financial year comprises current and deferred tax.
Current tax is the expected amount of income taxes payable in respect of the taxable profit for the financial year and is measured using the tax rates that have been enacted or substantively enacted at the reporting date.
Deferred tax is recognised in full, using the liability method, on temporary differences arising between the amounts attributable to assets and liabilities for tax purposes and their carrying amounts in the financial statements. However, deferred tax is not accounted for if it arises from initial recognition of an asset or liability in a transaction that at the time of the transaction affects neither accounting nor taxable profit or loss.
Deferred tax assets are recognised only to the extent that it is probable that taxable profit will be available against which the deductible temporary differences or unabsorbed tax losses can be utilised.
Deferred tax is determined using tax rates (and tax laws) that have been enacted or substantively enacted by the reporting date and are expected to apply when the related deferred tax asset is realised or the deferred tax liability is settled.
Notes to the Financial Statements
Annual Report 2014
091
3. SIGNIFICANT ACCOUNTING POLICIES (CONTINUED)
(n) Revenue recognition
Revenue is recognised when it is probable that the future economic benefits will flow to the Group and the benefits can be reliably measured.
(i) Rental of room Revenue from room rental is recognised on the accrual basis.
(ii) Rental income and other related charges Rental income is recognised in profit or loss on a straight-line basis over the term of the lease.
(iii) Car park income Car park income is recognised in the profit or loss on accrual basis.
(iv) Interest income Interest income is recognised as it accrues using the effective interest method in profit or loss.
(v) Sales of goods Revenue is recognised when the significant risks and rewards of ownership of the goods have passed to
the buyers.
(vi) Rendering of services Revenue is recognised when the services are rendered.
(o) Employee benefits
(i) Short term employee benefits Wages, salaries, social security contributions, paid annual leave, paid sick leave, bonuses and non-monetary
benefits are recognised as an expense in the financial year when employees have rendered their services to the Group.
Short term accumulating compensated absences such as paid annual leave are recognised as expenses when employees render services that increase their entitlement to future compensated absences. Short term non-accumulating compensated absences such as sick leave are recognised when the absences occur.
Bonuses are recognised as an expense when there is a present, legal or constructive obligation to make such payments, as a result of past events and when a reliable estimate can be made of the amount of the obligation.
Notes to the Financial Statements
YTL Hospitality REIT
092
3. SIGNIFICANT ACCOUNTING POLICIES (CONTINUED)
(o) Employee benefits (continued)
(ii) Post-employment benefits The Group has various post-employment benefit schemes in accordance with local conditions and
practices in the industries in which it operates. These benefit plans are either defined contribution or defined benefit plans.
A defined contribution plan is a pension plan under which the Group pays fixed contributions into a separate entity (a fund) and will have no legal or constructive obligations to pay further contributions if the fund does not hold sufficient assets to pay all employees benefits relating to employee service in the current and prior periods. A defined benefit plan is a pension plan that defines an amount of pension benefit to be provided, usually as a function of one or more factors such as age, years of service or compensation.
Defined contribution plan
The Group’s contributions to a defined contribution plan are charged to the profit or loss in the period to which they relate. Once the contributions have been paid, the Group has no further payment obligations.
(p) Foreign currency
(i) Foreign currency transactions Transactions in foreign currencies are translated to the respective functional currency using exchange rates
at the dates of the transactions.
Monetary assets and liabilities denominated in foreign currencies at the reporting period are retranslated to the functional currency at the exchange rate at that date.
Non-monetary assets and liabilities denominated in foreign currencies are not retranslated at the end of the reporting date except for those that are measured at fair value are retranslated to the functional currency at the exchange rate at the date that the fair value was determined.
Foreign currency differences arising on retranslation are recognised in profit or loss.
(ii) Foreign operations The assets and liabilities of foreign operations are translated into RM at the rate of exchange ruling at
the reporting date and income and expenses are translated at exchange rates at the dates of the transactions. The exchange differences arising on the translation are taken directly to other comprehensive income. On disposal of a foreign operation, the cumulative amount recognised in other comprehensive income and foreign currency translation reserve relating to that particular foreign operation is recognised in profit or loss.
Notes to the Financial Statements
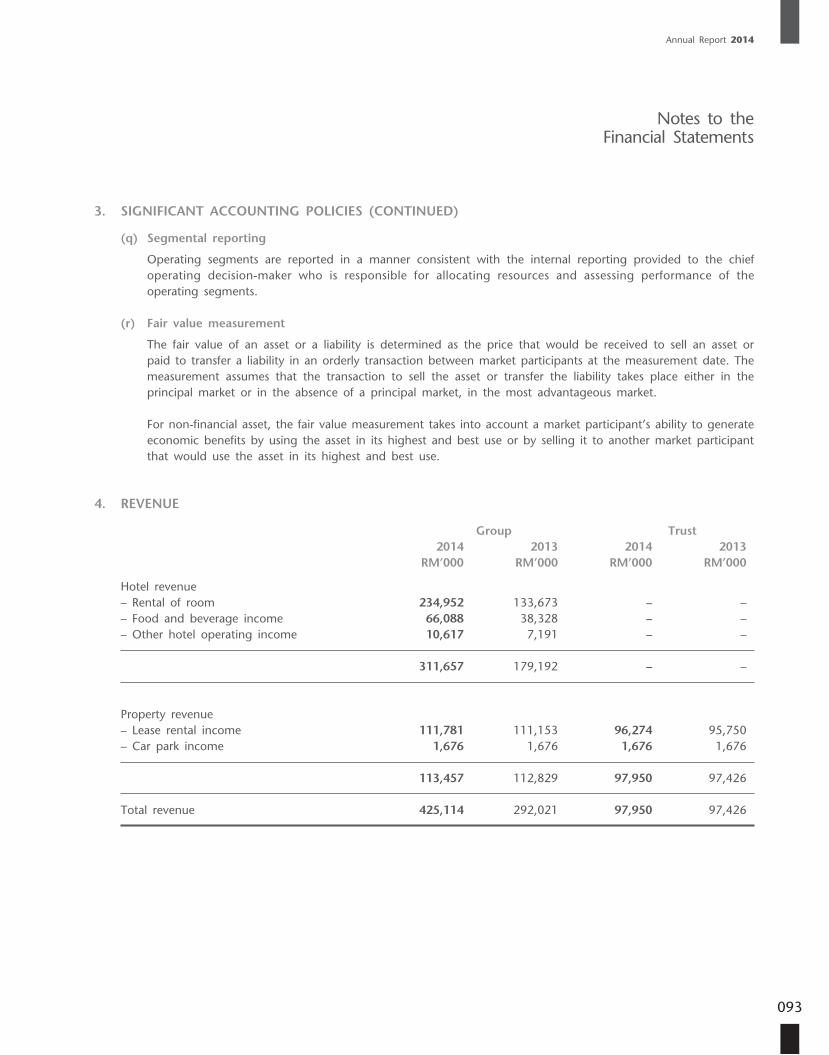
Annual Report 2014
093
3. SIGNIFICANT ACCOUNTING POLICIES (CONTINUED)
(q) Segmental reporting
Operating segments are reported in a manner consistent with the internal reporting provided to the chief operating decision-maker who is responsible for allocating resources and assessing performance of the operating segments.
(r) Fair value measurement
The fair value of an asset or a liability is determined as the price that would be received to sell an asset or paid to transfer a liability in an orderly transaction between market participants at the measurement date. The measurement assumes that the transaction to sell the asset or transfer the liability takes place either in the principal market or in the absence of a principal market, in the most advantageous market.
For non-financial asset, the fair value measurement takes into account a market participant’s ability to generate economic benefits by using the asset in its highest and best use or by selling it to another market participant that would use the asset in its highest and best use.
4. REVENUE
Group Trust 2014 2013 2014 2013 RM’000 RM’000 RM’000 RM’000
Hotel revenue – Rental of room 234,952 133,673 – – – Food and beverage income 66,088 38,328 – – – Other hotel operating income 10,617 7,191 – –
311,657 179,192 – –
Property revenue – Lease rental income 111,781 111,153 96,274 95,750 – Car park income 1,676 1,676 1,676 1,676
113,457 112,829 97,950 97,426
Total revenue 425,114 292,021 97,950 97,426
Notes to the Financial Statements
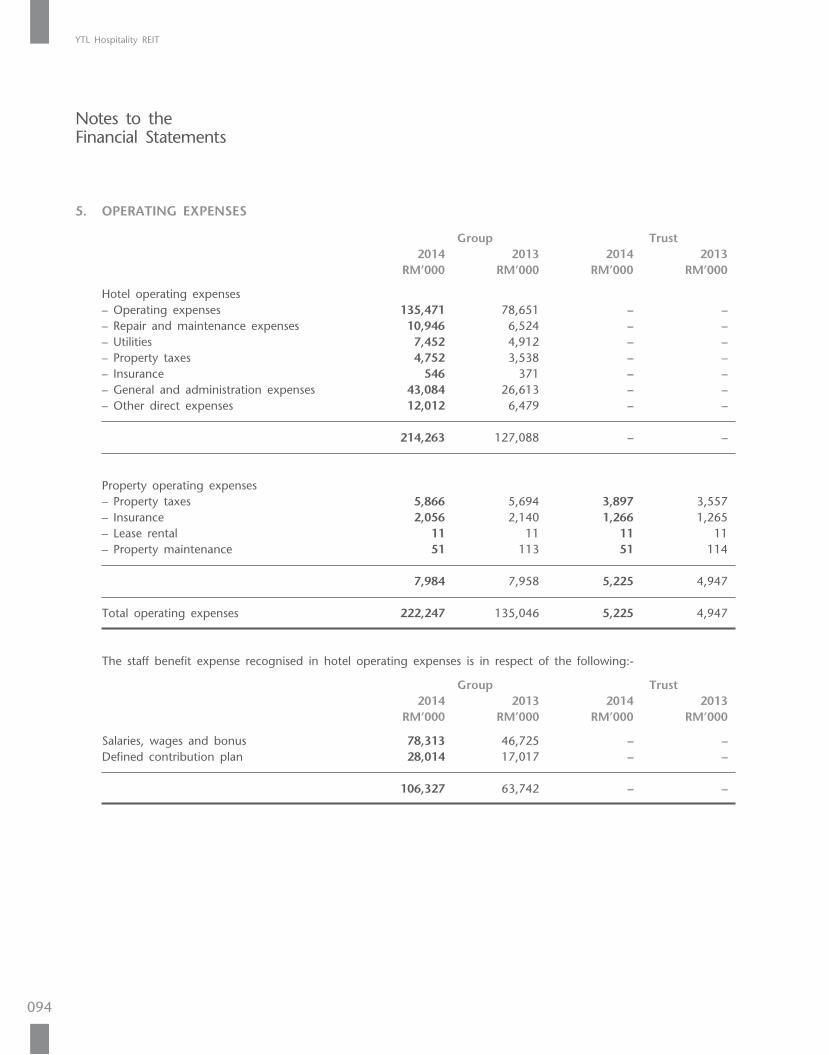
YTL Hospitality REIT
094
5. OPERATING EXPENSES
Group Trust 2014 2013 2014 2013 RM’000 RM’000 RM’000 RM’000
Hotel operating expenses – Operating expenses 135,471 78,651 – – – Repair and maintenance expenses 10,946 6,524 – – – Utilities 7,452 4,912 – – – Property taxes 4,752 3,538 – – – Insurance 546 371 – – – General and administration expenses 43,084 26,613 – – – Other direct expenses 12,012 6,479 – –
214,263 127,088 – –
Property operating expenses – Property taxes 5,866 5,694 3,897 3,557 – Insurance 2,056 2,140 1,266 1,265 – Lease rental 11 11 11 11 – Property maintenance 51 113 51 114
7,984 7,958 5,225 4,947
Total operating expenses 222,247 135,046 5,225 4,947
The staff benefit expense recognised in hotel operating expenses is in respect of the following:-
Group Trust 2014 2013 2014 2013 RM’000 RM’000 RM’000 RM’000
Salaries, wages and bonus 78,313 46,725 – – Defined contribution plan 28,014 17,017 – –
106,327 63,742 – –
Notes to the Financial Statements
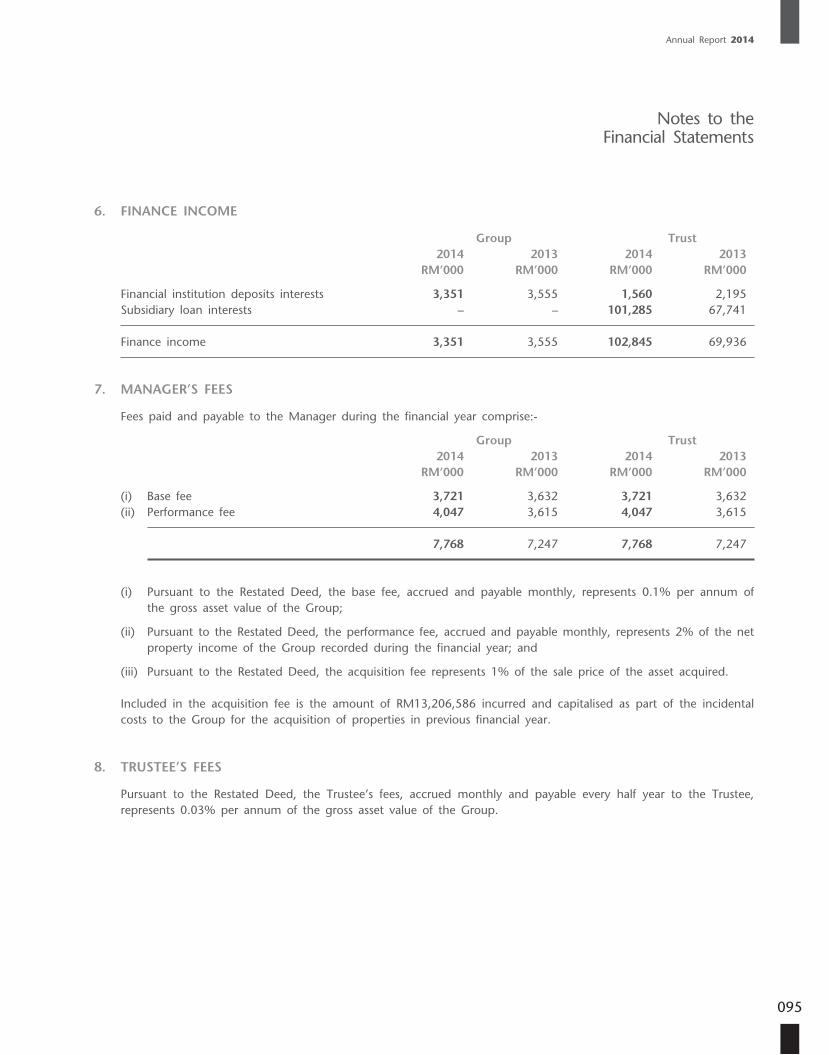
Annual Report 2014
095
6. FINANCE INCOME
Group Trust 2014 2013 2014 2013 RM’000 RM’000 RM’000 RM’000
Financial institution deposits interests 3,351 3,555 1,560 2,195 Subsidiary loan interests – – 101,285 67,741
Finance income 3,351 3,555 102,845 69,936
7. MANAGER’S FEES
Fees paid and payable to the Manager during the financial year comprise:-
Group Trust 2014 2013 2014 2013 RM’000 RM’000 RM’000 RM’000
(i) Base fee 3,721 3,632 3,721 3,632(ii) Performance fee 4,047 3,615 4,047 3,615
7,768 7,247 7,768 7,247
(i) Pursuant to the Restated Deed, the base fee, accrued and payable monthly, represents 0.1% per annum of the gross asset value of the Group;
(ii) Pursuant to the Restated Deed, the performance fee, accrued and payable monthly, represents 2% of the net property income of the Group recorded during the financial year; and
(iii) Pursuant to the Restated Deed, the acquisition fee represents 1% of the sale price of the asset acquired.
Included in the acquisition fee is the amount of RM13,206,586 incurred and capitalised as part of the incidental costs to the Group for the acquisition of properties in previous financial year.
8. TRUSTEE’S FEES
Pursuant to the Restated Deed, the Trustee’s fees, accrued monthly and payable every half year to the Trustee, represents 0.03% per annum of the gross asset value of the Group.
Notes to the Financial Statements
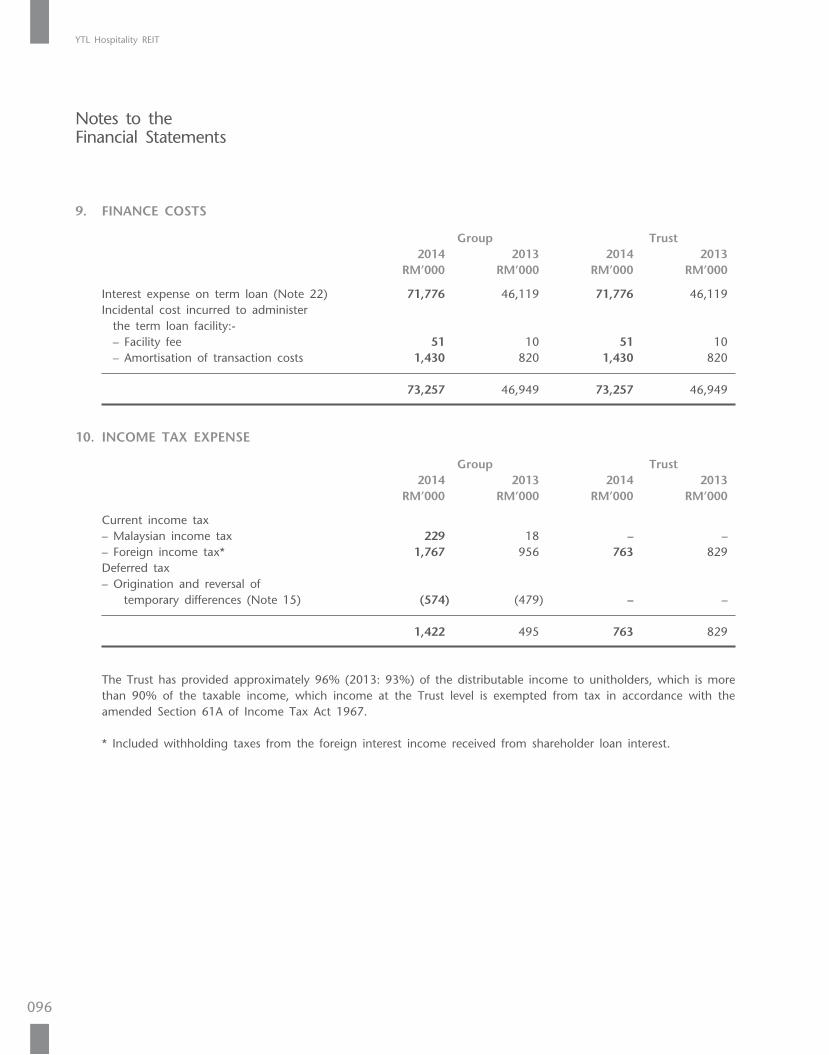
YTL Hospitality REIT
096
9. FINANCE COSTS
Group Trust 2014 2013 2014 2013 RM’000 RM’000 RM’000 RM’000
Interest expense on term loan (Note 22) 71,776 46,119 71,776 46,119 Incidental cost incurred to administer the term loan facility:- – Facility fee 51 10 51 10 – Amortisation of transaction costs 1,430 820 1,430 820
73,257 46,949 73,257 46,949
10. INCOME TAX EXPENSE
Group Trust 2014 2013 2014 2013 RM’000 RM’000 RM’000 RM’000
Current income tax – Malaysian income tax 229 18 – – – Foreign income tax* 1,767 956 763 829 Deferred tax – Origination and reversal of temporary differences (Note 15) (574) (479) – –
1,422 495 763 829
The Trust has provided approximately 96% (2013: 93%) of the distributable income to unitholders, which is more than 90% of the taxable income, which income at the Trust level is exempted from tax in accordance with the amended Section 61A of Income Tax Act 1967.
* Included withholding taxes from the foreign interest income received from shareholder loan interest.
Notes to the Financial Statements
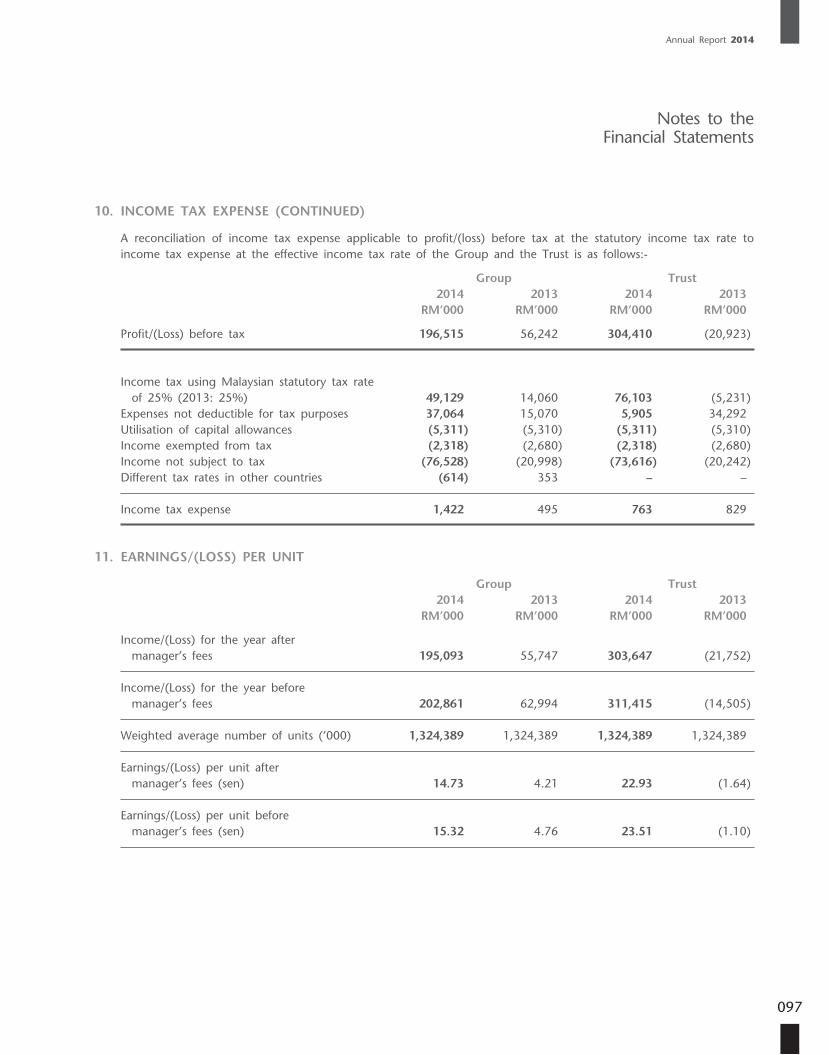
Annual Report 2014
097
10. INCOME TAX EXPENSE (CONTINUED)
A reconciliation of income tax expense applicable to profit/(loss) before tax at the statutory income tax rate to income tax expense at the effective income tax rate of the Group and the Trust is as follows:-
Group Trust 2014 2013 2014 2013 RM’000 RM’000 RM’000 RM’000
Profit/(Loss) before tax 196,515 56,242 304,410 (20,923)
Income tax using Malaysian statutory tax rate of 25% (2013: 25%) 49,129 14,060 76,103 (5,231) Expenses not deductible for tax purposes 37,064 15,070 5,905 34,292 Utilisation of capital allowances (5,311) (5,310) (5,311) (5,310) Income exempted from tax (2,318) (2,680) (2,318) (2,680) Income not subject to tax (76,528) (20,998) (73,616) (20,242) Different tax rates in other countries (614) 353 – –
Income tax expense 1,422 495 763 829
11. EARNINGS/(LOSS) PER UNIT
Group Trust 2014 2013 2014 2013 RM’000 RM’000 RM’000 RM’000
Income/(Loss) for the year after manager’s fees 195,093 55,747 303,647 (21,752)
Income/(Loss) for the year before manager’s fees 202,861 62,994 311,415 (14,505)
Weighted average number of units (’000) 1,324,389 1,324,389 1,324,389 1,324,389
Earnings/(Loss) per unit after manager’s fees (sen) 14.73 4.21 22.93 (1.64)
Earnings/(Loss) per unit before manager’s fees (sen) 15.32 4.76 23.51 (1.10)
Notes to the Financial Statements
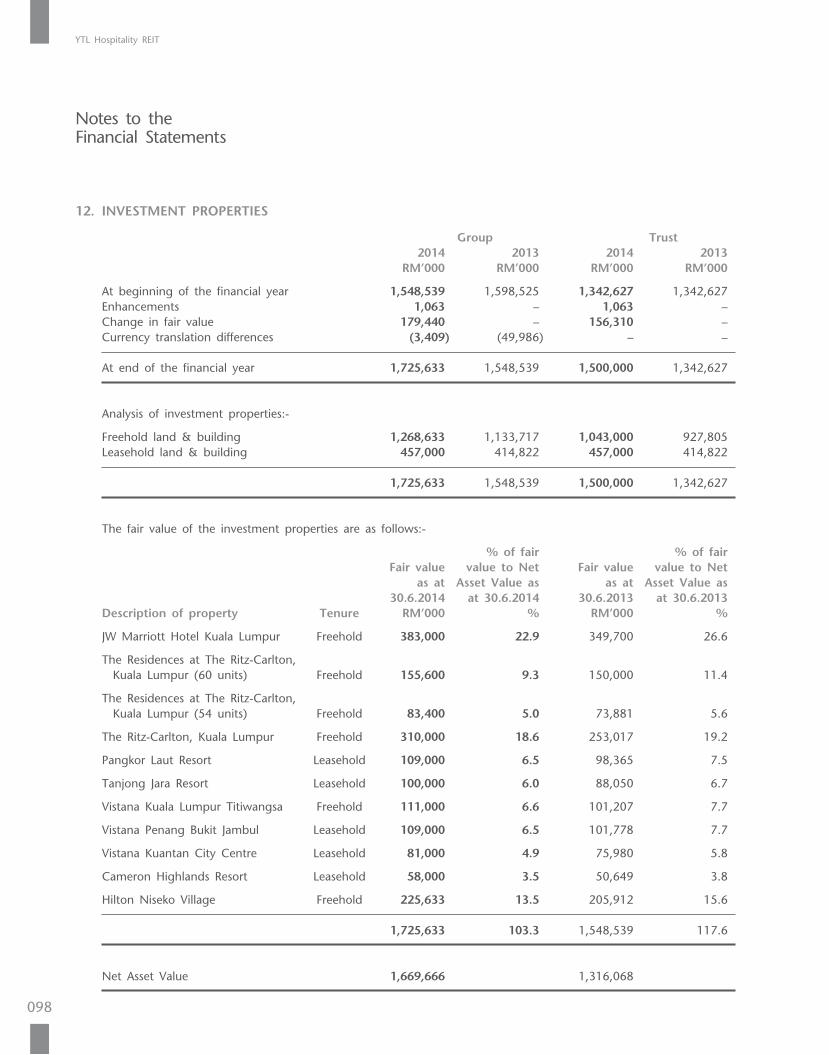
YTL Hospitality REIT
098
12. INVESTMENT PROPERTIES
Group Trust 2014 2013 2014 2013 RM’000 RM’000 RM’000 RM’000
At beginning of the financial year 1,548,539 1,598,525 1,342,627 1,342,627 Enhancements 1,063 – 1,063 – Change in fair value 179,440 – 156,310 – Currency translation differences (3,409) (49,986) – –
At end of the financial year 1,725,633 1,548,539 1,500,000 1,342,627
Analysis of investment properties:-
Freehold land & building 1,268,633 1,133,717 1,043,000 927,805 Leasehold land & building 457,000 414,822 457,000 414,822
1,725,633 1,548,539 1,500,000 1,342,627
The fair value of the investment properties are as follows:-
% of fair % of fair Fair value value to Net Fair value value to Net as at Asset Value as as at Asset Value as 30.6.2014 at 30.6.2014 30.6.2013 at 30.6.2013 Description of property Tenure RM’000 % RM’000 %
JW Marriott Hotel Kuala Lumpur Freehold 383,000 22.9 349,700 26.6
The Residences at The Ritz-Carlton, Kuala Lumpur (60 units) Freehold 155,600 9.3 150,000 11.4
The Residences at The Ritz-Carlton, Kuala Lumpur (54 units) Freehold 83,400 5.0 73,881 5.6
The Ritz-Carlton, Kuala Lumpur Freehold 310,000 18.6 253,017 19.2
Pangkor Laut Resort Leasehold 109,000 6.5 98,365 7.5
Tanjong Jara Resort Leasehold 100,000 6.0 88,050 6.7
Vistana Kuala Lumpur Titiwangsa Freehold 111,000 6.6 101,207 7.7
Vistana Penang Bukit Jambul Leasehold 109,000 6.5 101,778 7.7
Vistana Kuantan City Centre Leasehold 81,000 4.9 75,980 5.8
Cameron Highlands Resort Leasehold 58,000 3.5 50,649 3.8
Hilton Niseko Village Freehold 225,633 13.5 205,912 15.6
1,725,633 103.3 1,548,539 117.6
Net Asset Value 1,669,666 1,316,068
Notes to the Financial Statements
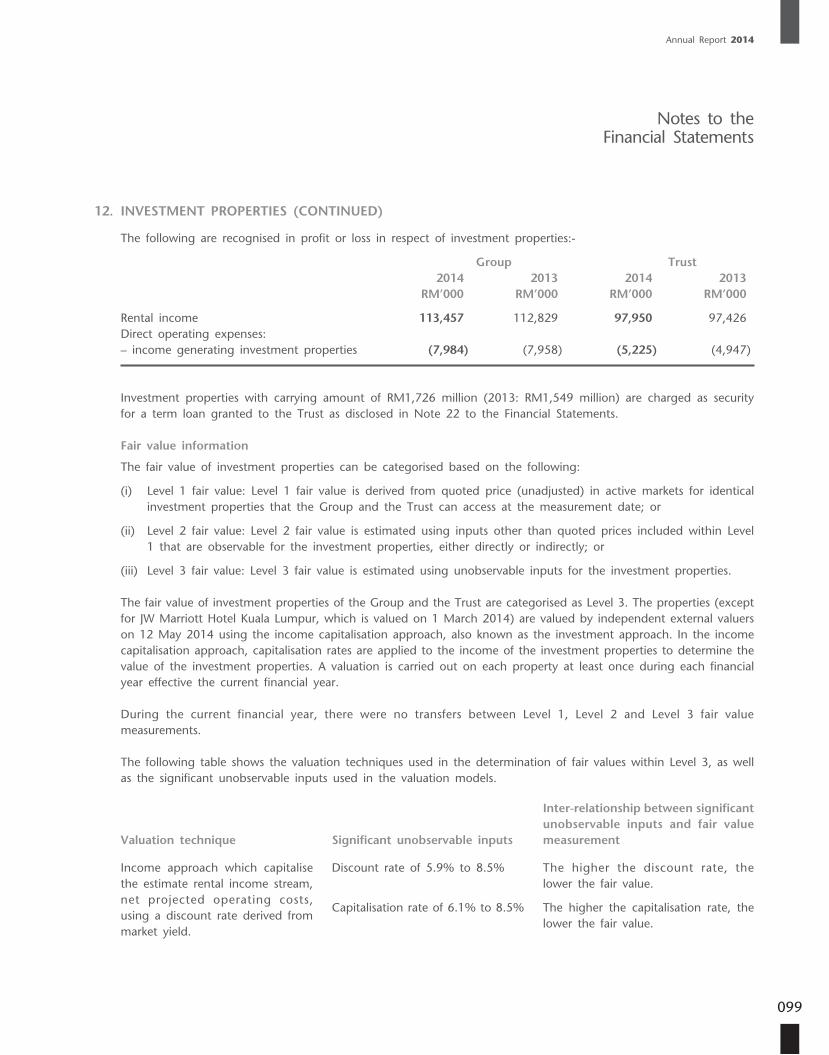
Annual Report 2014
099
12. INVESTMENT PROPERTIES (CONTINUED)
The following are recognised in profit or loss in respect of investment properties:-
Group Trust 2014 2013 2014 2013 RM’000 RM’000 RM’000 RM’000
Rental income 113,457 112,829 97,950 97,426 Direct operating expenses: – income generating investment properties (7,984) (7,958) (5,225) (4,947)
Investment properties with carrying amount of RM1,726 million (2013: RM1,549 million) are charged as security for a term loan granted to the Trust as disclosed in Note 22 to the Financial Statements.
Fair value information
The fair value of investment properties can be categorised based on the following:
(i) Level 1 fair value: Level 1 fair value is derived from quoted price (unadjusted) in active markets for identical investment properties that the Group and the Trust can access at the measurement date; or
(ii) Level 2 fair value: Level 2 fair value is estimated using inputs other than quoted prices included within Level 1 that are observable for the investment properties, either directly or indirectly; or
(iii) Level 3 fair value: Level 3 fair value is estimated using unobservable inputs for the investment properties.
The fair value of investment properties of the Group and the Trust are categorised as Level 3. The properties (except for JW Marriott Hotel Kuala Lumpur, which is valued on 1 March 2014) are valued by independent external valuers on 12 May 2014 using the income capitalisation approach, also known as the investment approach. In the income capitalisation approach, capitalisation rates are applied to the income of the investment properties to determine the value of the investment properties. A valuation is carried out on each property at least once during each financial year effective the current financial year.
During the current financial year, there were no transfers between Level 1, Level 2 and Level 3 fair value measurements.
The following table shows the valuation techniques used in the determination of fair values within Level 3, as well as the significant unobservable inputs used in the valuation models.
Valuation technique Significant unobservable inputs
Inter-relationship between significant unobservable inputs and fair value measurement
Income approach which capitalise the estimate rental income stream, net projected operating costs, using a discount rate derived from market yield.
Discount rate of 5.9% to 8.5% The higher the discount rate, the lower the fair value.
Capitalisation rate of 6.1% to 8.5% The higher the capitalisation rate, the lower the fair value.
Notes to the Financial Statements
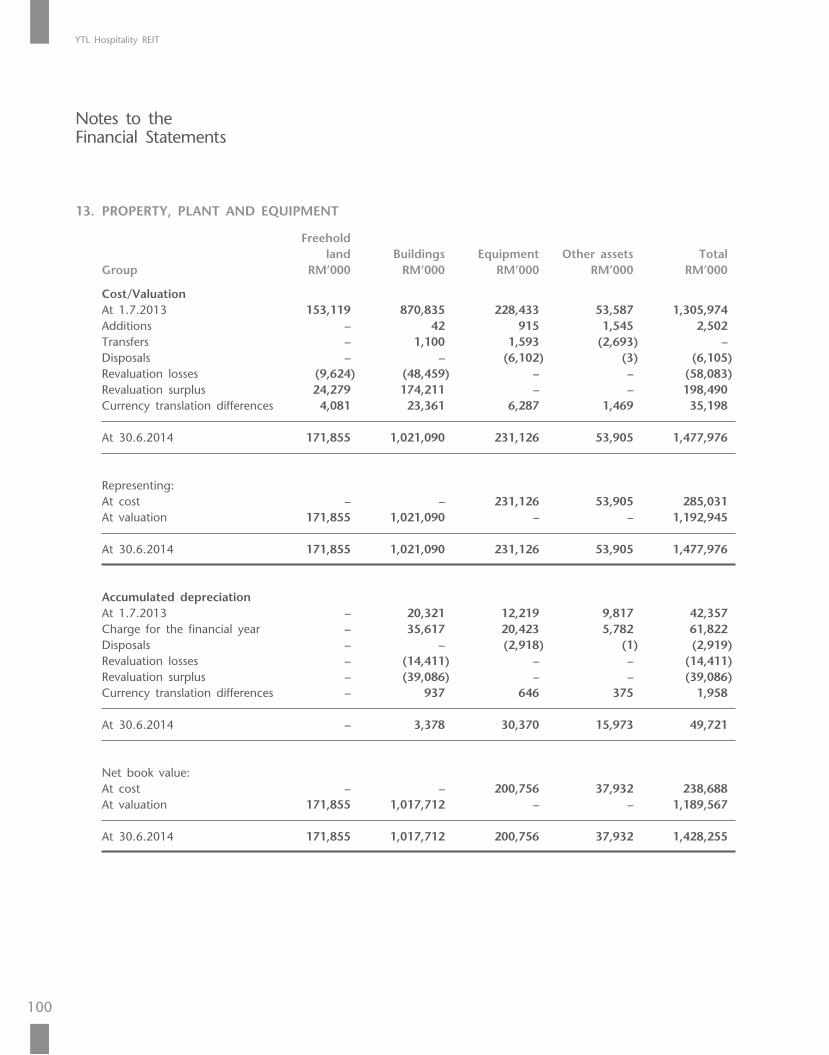
YTL Hospitality REIT
100
13. PROPERTY, PLANT AND EQUIPMENT
Freehold land Buildings Equipment Other assets Total Group RM’000 RM’000 RM’000 RM’000 RM’000
Cost/Valuation At 1.7.2013 153,119 870,835 228,433 53,587 1,305,974 Additions – 42 915 1,545 2,502 Transfers – 1,100 1,593 (2,693) – Disposals – – (6,102) (3) (6,105) Revaluation losses (9,624) (48,459) – – (58,083) Revaluation surplus 24,279 174,211 – – 198,490 Currency translation differences 4,081 23,361 6,287 1,469 35,198
At 30.6.2014 171,855 1,021,090 231,126 53,905 1,477,976
Representing: At cost – – 231,126 53,905 285,031 At valuation 171,855 1,021,090 – – 1,192,945
At 30.6.2014 171,855 1,021,090 231,126 53,905 1,477,976
Accumulated depreciation At 1.7.2013 – 20,321 12,219 9,817 42,357 Charge for the financial year – 35,617 20,423 5,782 61,822 Disposals – – (2,918) (1) (2,919) Revaluation losses – (14,411) – – (14,411) Revaluation surplus – (39,086) – – (39,086) Currency translation differences – 937 646 375 1,958
At 30.6.2014 – 3,378 30,370 15,973 49,721
Net book value: At cost – – 200,756 37,932 238,688 At valuation 171,855 1,017,712 – – 1,189,567
At 30.6.2014 171,855 1,017,712 200,756 37,932 1,428,255
Notes to the Financial Statements
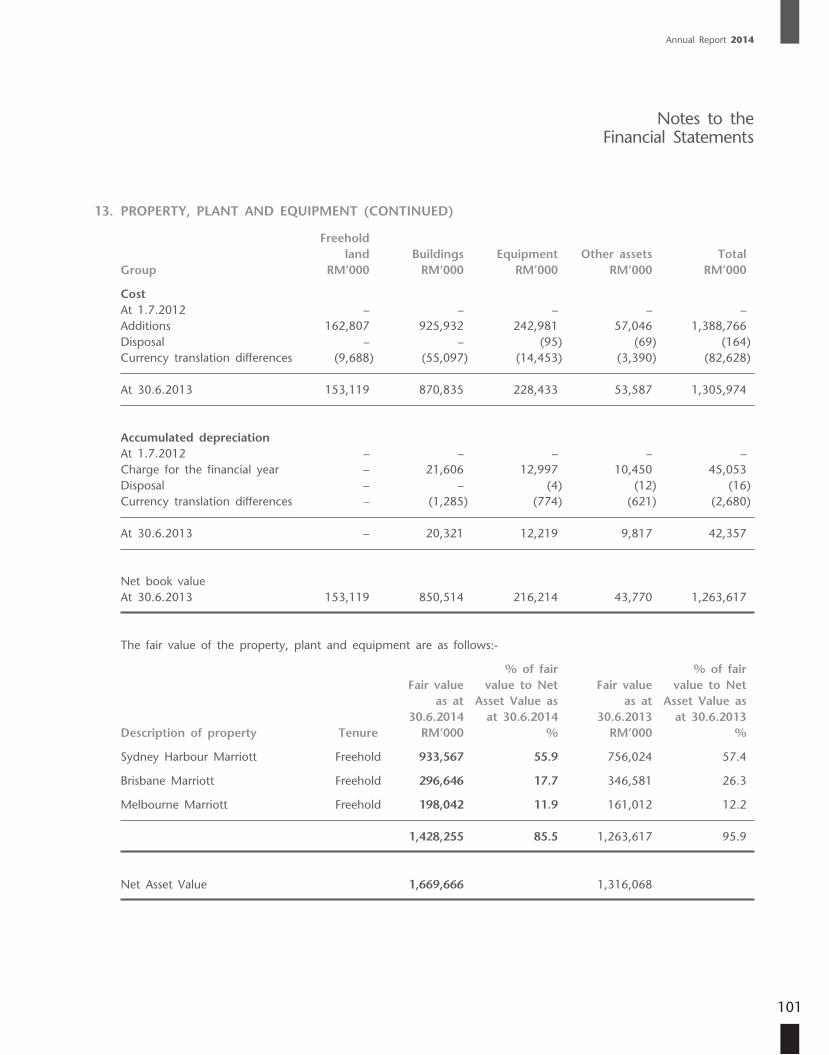
Annual Report 2014
101
13. PROPERTY, PLANT AND EQUIPMENT (CONTINUED)
Freehold land Buildings Equipment Other assets Total Group RM’000 RM’000 RM’000 RM’000 RM’000
Cost At 1.7.2012 – – – – – Additions 162,807 925,932 242,981 57,046 1,388,766 Disposal – – (95) (69) (164) Currency translation differences (9,688) (55,097) (14,453) (3,390) (82,628)
At 30.6.2013 153,119 870,835 228,433 53,587 1,305,974
Accumulated depreciation At 1.7.2012 – – – – – Charge for the financial year – 21,606 12,997 10,450 45,053 Disposal – – (4) (12) (16) Currency translation differences – (1,285) (774) (621) (2,680)
At 30.6.2013 – 20,321 12,219 9,817 42,357
Net book value At 30.6.2013 153,119 850,514 216,214 43,770 1,263,617
The fair value of the property, plant and equipment are as follows:-
% of fair % of fair Fair value value to Net Fair value value to Net as at Asset Value as as at Asset Value as 30.6.2014 at 30.6.2014 30.6.2013 at 30.6.2013 Description of property Tenure RM’000 % RM’000 %
Sydney Harbour Marriott Freehold 933,567 55.9 756,024 57.4
Brisbane Marriott Freehold 296,646 17.7 346,581 26.3
Melbourne Marriott Freehold 198,042 11.9 161,012 12.2
1,428,255 85.5 1,263,617 95.9
Net Asset Value 1,669,666 1,316,068
Notes to the Financial Statements
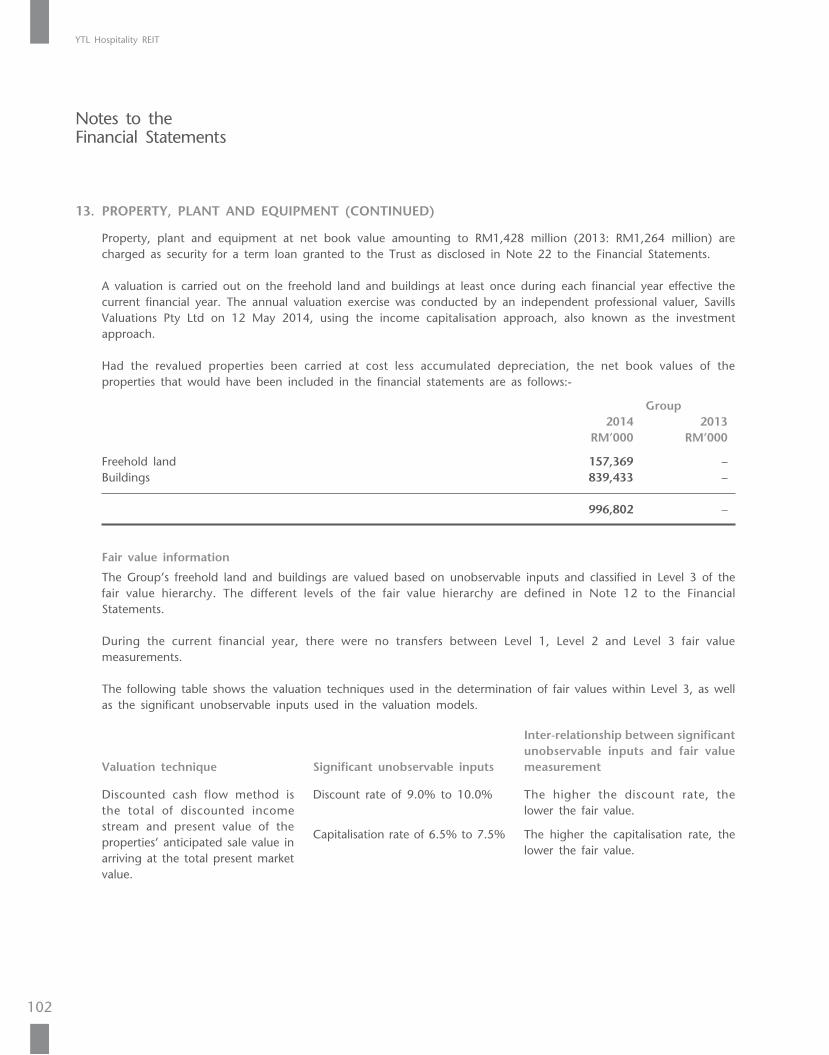
YTL Hospitality REIT
102
13. PROPERTY, PLANT AND EQUIPMENT (CONTINUED)
Property, plant and equipment at net book value amounting to RM1,428 million (2013: RM1,264 million) are charged as security for a term loan granted to the Trust as disclosed in Note 22 to the Financial Statements.
A valuation is carried out on the freehold land and buildings at least once during each financial year effective the current financial year. The annual valuation exercise was conducted by an independent professional valuer, Savills Valuations Pty Ltd on 12 May 2014, using the income capitalisation approach, also known as the investment approach.
Had the revalued properties been carried at cost less accumulated depreciation, the net book values of the properties that would have been included in the financial statements are as follows:-
Group 2014 2013 RM’000 RM’000
Freehold land 157,369 – Buildings 839,433 –
996,802 –
Fair value information
The Group’s freehold land and buildings are valued based on unobservable inputs and classified in Level 3 of the fair value hierarchy. The different levels of the fair value hierarchy are defined in Note 12 to the Financial Statements.
During the current financial year, there were no transfers between Level 1, Level 2 and Level 3 fair value measurements.
The following table shows the valuation techniques used in the determination of fair values within Level 3, as well as the significant unobservable inputs used in the valuation models.
Valuation technique Significant unobservable inputs
Inter-relationship between significant unobservable inputs and fair value measurement
Discounted cash flow method is the total of discounted income stream and present value of the properties’ anticipated sale value in arriving at the total present market value.
Discount rate of 9.0% to 10.0% The higher the discount rate, the lower the fair value.
Capitalisation rate of 6.5% to 7.5% The higher the capitalisation rate, the lower the fair value.
Notes to the Financial Statements
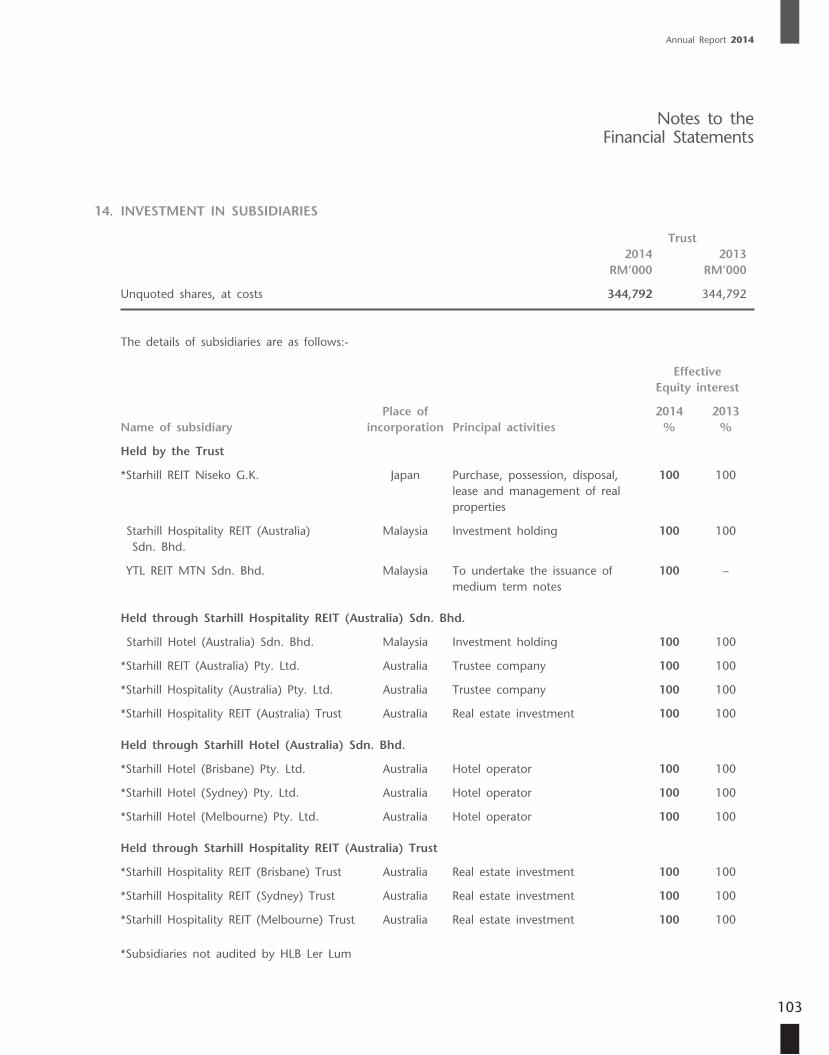
Annual Report 2014
103
14. INVESTMENT IN SUBSIDIARIES
Trust 2014 2013 RM’000 RM’000
Unquoted shares, at costs 344,792 344,792
The details of subsidiaries are as follows:-
EffectiveEquity interest
Name of subsidiaryPlace of
incorporation Principal activities2014
%2013
%
Held by the Trust
*Starhill REIT Niseko G.K. Japan Purchase, possession, disposal, lease and management of real properties
100 100
Starhill Hospitality REIT (Australia) Sdn. Bhd.
Malaysia Investment holding 100 100
YTL REIT MTN Sdn. Bhd. Malaysia To undertake the issuance of medium term notes
100 –
Held through Starhill Hospitality REIT (Australia) Sdn. Bhd.
Starhill Hotel (Australia) Sdn. Bhd. Malaysia Investment holding 100 100
*Starhill REIT (Australia) Pty. Ltd. Australia Trustee company 100 100
*Starhill Hospitality (Australia) Pty. Ltd. Australia Trustee company 100 100
*Starhill Hospitality REIT (Australia) Trust Australia Real estate investment 100 100
Held through Starhill Hotel (Australia) Sdn. Bhd.
*Starhill Hotel (Brisbane) Pty. Ltd. Australia Hotel operator 100 100
*Starhill Hotel (Sydney) Pty. Ltd. Australia Hotel operator 100 100
*Starhill Hotel (Melbourne) Pty. Ltd. Australia Hotel operator 100 100
Held through Starhill Hospitality REIT (Australia) Trust
*Starhill Hospitality REIT (Brisbane) Trust Australia Real estate investment 100 100
*Starhill Hospitality REIT (Sydney) Trust Australia Real estate investment 100 100
*Starhill Hospitality REIT (Melbourne) Trust Australia Real estate investment 100 100
*Subsidiaries not audited by HLB Ler Lum
Notes to the Financial Statements
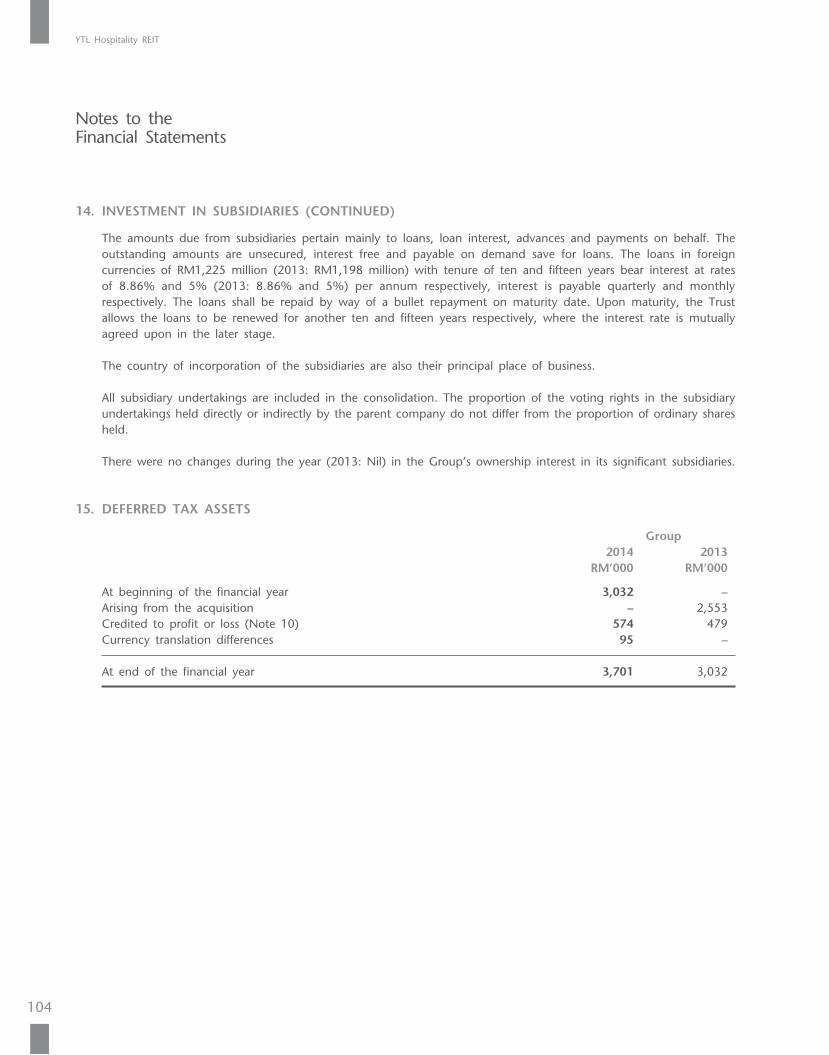
YTL Hospitality REIT
104
14. INVESTMENT IN SUBSIDIARIES (CONTINUED)
The amounts due from subsidiaries pertain mainly to loans, loan interest, advances and payments on behalf. The outstanding amounts are unsecured, interest free and payable on demand save for loans. The loans in foreign currencies of RM1,225 million (2013: RM1,198 million) with tenure of ten and fifteen years bear interest at rates of 8.86% and 5% (2013: 8.86% and 5%) per annum respectively, interest is payable quarterly and monthly respectively. The loans shall be repaid by way of a bullet repayment on maturity date. Upon maturity, the Trust allows the loans to be renewed for another ten and fifteen years respectively, where the interest rate is mutually agreed upon in the later stage.
The country of incorporation of the subsidiaries are also their principal place of business.
All subsidiary undertakings are included in the consolidation. The proportion of the voting rights in the subsidiary undertakings held directly or indirectly by the parent company do not differ from the proportion of ordinary shares held.
There were no changes during the year (2013: Nil) in the Group’s ownership interest in its significant subsidiaries.
15. DEFERRED TAX ASSETS
Group 2014 2013 RM’000 RM’000
At beginning of the financial year 3,032 – Arising from the acquisition – 2,553 Credited to profit or loss (Note 10) 574 479 Currency translation differences 95 –
At end of the financial year 3,701 3,032
Notes to the Financial Statements
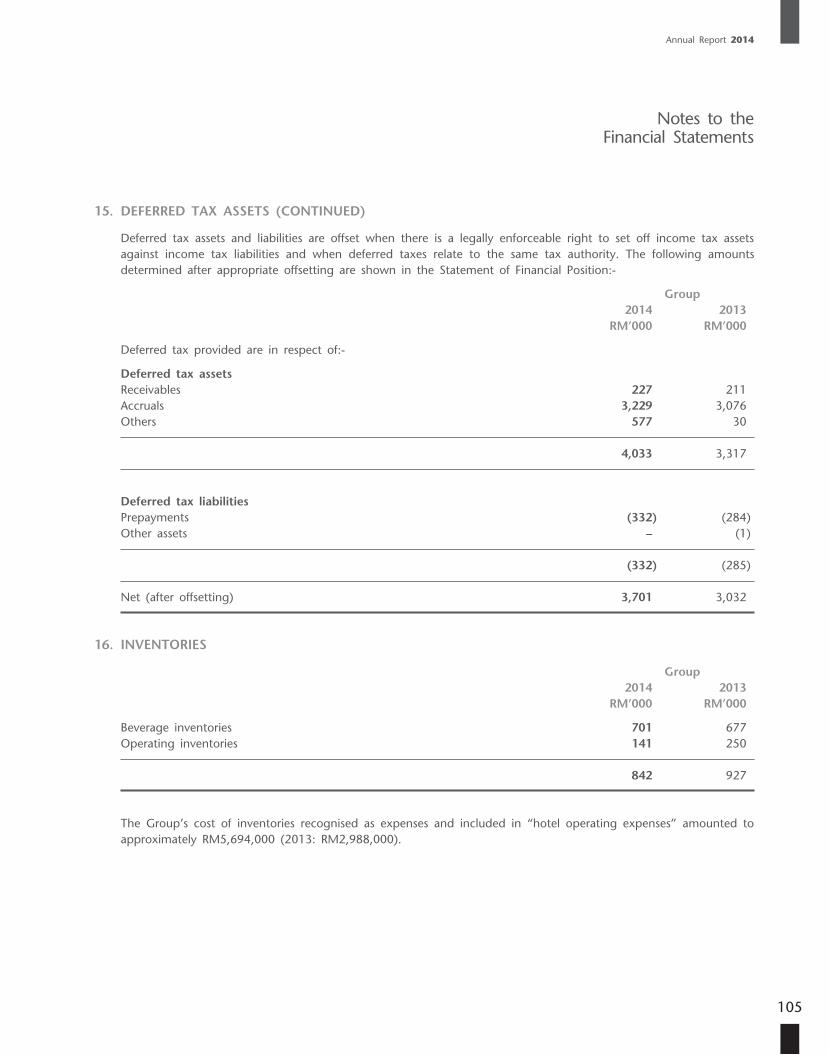
Annual Report 2014
105
15. DEFERRED TAX ASSETS (CONTINUED)
Deferred tax assets and liabilities are offset when there is a legally enforceable right to set off income tax assets against income tax liabilities and when deferred taxes relate to the same tax authority. The following amounts determined after appropriate offsetting are shown in the Statement of Financial Position:-
Group 2014 2013 RM’000 RM’000
Deferred tax provided are in respect of:-
Deferred tax assets Receivables 227 211 Accruals 3,229 3,076 Others 577 30
4,033 3,317
Deferred tax liabilities Prepayments (332) (284) Other assets – (1)
(332) (285)
Net (after offsetting) 3,701 3,032
16. INVENTORIES
Group 2014 2013 RM’000 RM’000
Beverage inventories 701 677 Operating inventories 141 250
842 927
The Group’s cost of inventories recognised as expenses and included in “hotel operating expenses” amounted to approximately RM5,694,000 (2013: RM2,988,000).
Notes to the Financial Statements
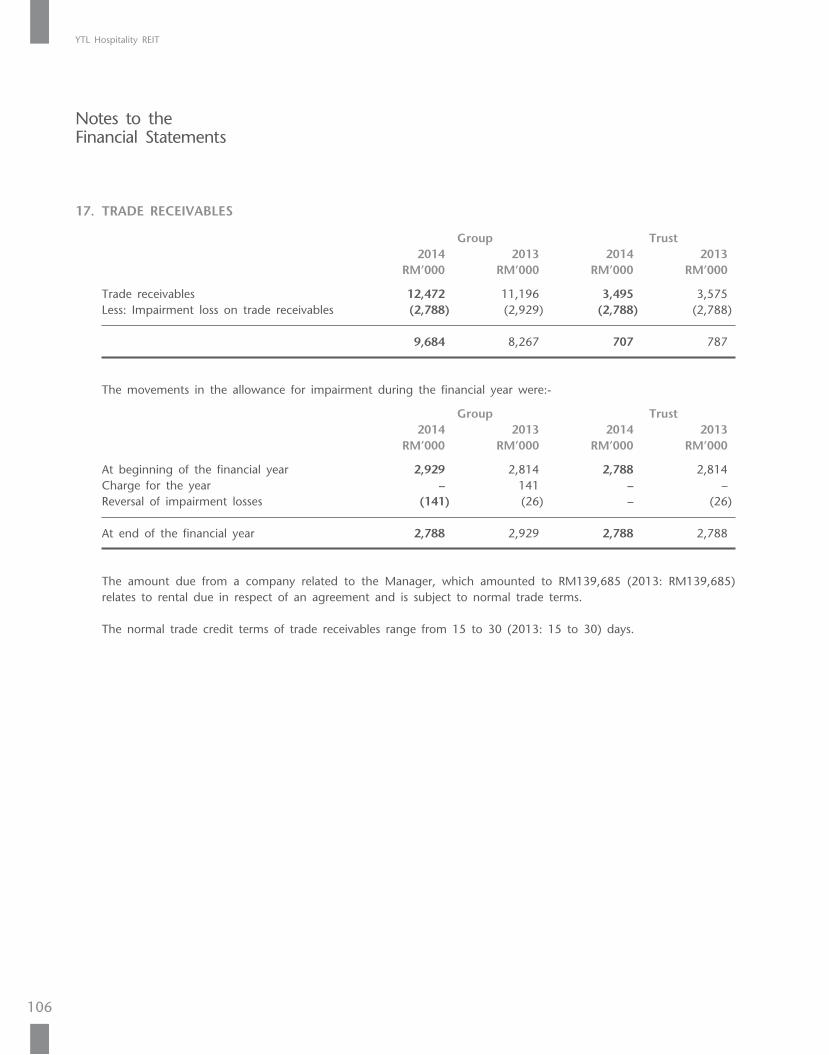
YTL Hospitality REIT
106
17. TRADE RECEIVABLES
Group Trust 2014 2013 2014 2013 RM’000 RM’000 RM’000 RM’000
Trade receivables 12,472 11,196 3,495 3,575 Less: Impairment loss on trade receivables (2,788) (2,929) (2,788) (2,788)
9,684 8,267 707 787
The movements in the allowance for impairment during the financial year were:-
Group Trust 2014 2013 2014 2013 RM’000 RM’000 RM’000 RM’000
At beginning of the financial year 2,929 2,814 2,788 2,814 Charge for the year – 141 – – Reversal of impairment losses (141) (26) – (26)
At end of the financial year 2,788 2,929 2,788 2,788
The amount due from a company related to the Manager, which amounted to RM139,685 (2013: RM139,685) relates to rental due in respect of an agreement and is subject to normal trade terms.
The normal trade credit terms of trade receivables range from 15 to 30 (2013: 15 to 30) days.
Notes to the Financial Statements
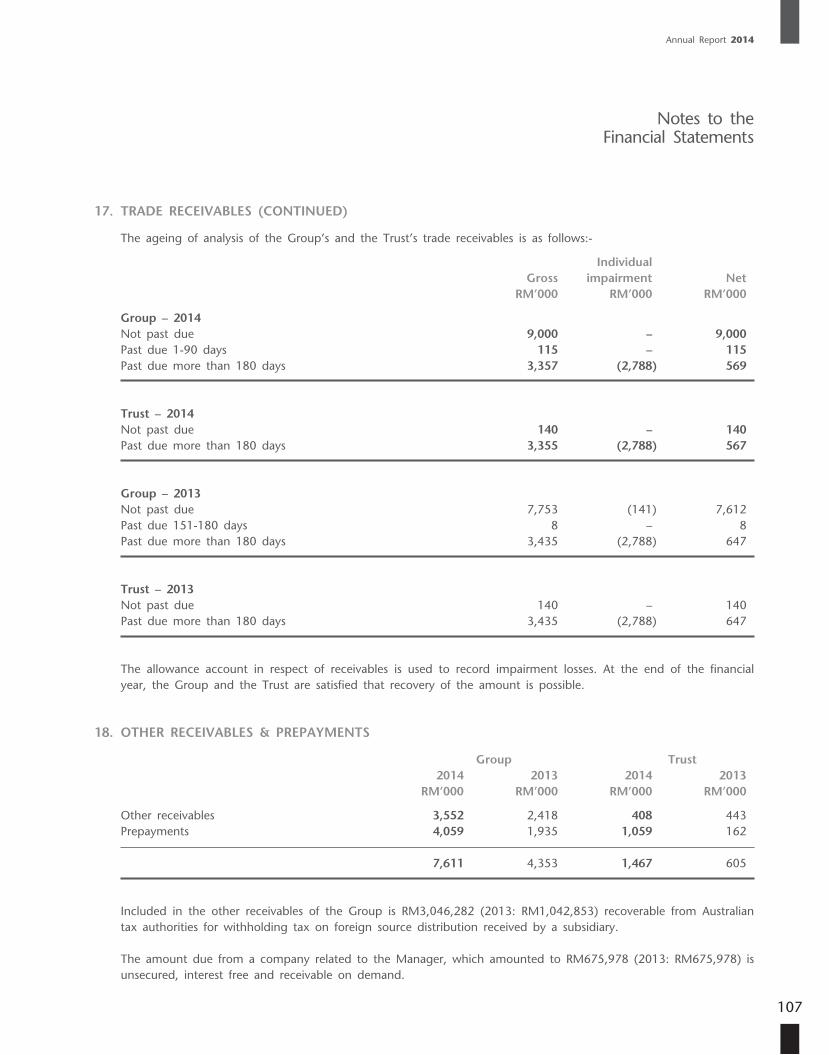
Annual Report 2014
107
17. TRADE RECEIVABLES (CONTINUED)
The ageing of analysis of the Group’s and the Trust’s trade receivables is as follows:-
Individual Gross impairment Net RM’000 RM’000 RM’000
Group – 2014 Not past due 9,000 – 9,000 Past due 1-90 days 115 – 115 Past due more than 180 days 3,357 (2,788) 569
Trust – 2014 Not past due 140 – 140 Past due more than 180 days 3,355 (2,788) 567
Group – 2013 Not past due 7,753 (141) 7,612 Past due 151-180 days 8 – 8 Past due more than 180 days 3,435 (2,788) 647
Trust – 2013 Not past due 140 – 140 Past due more than 180 days 3,435 (2,788) 647
The allowance account in respect of receivables is used to record impairment losses. At the end of the financial year, the Group and the Trust are satisfied that recovery of the amount is possible.
18. OTHER RECEIVABLES & PREPAYMENTS
Group Trust 2014 2013 2014 2013 RM’000 RM’000 RM’000 RM’000
Other receivables 3,552 2,418 408 443 Prepayments 4,059 1,935 1,059 162
7,611 4,353 1,467 605
Included in the other receivables of the Group is RM3,046,282 (2013: RM1,042,853) recoverable from Australian tax authorities for withholding tax on foreign source distribution received by a subsidiary.
The amount due from a company related to the Manager, which amounted to RM675,978 (2013: RM675,978) is unsecured, interest free and receivable on demand.
Notes to the Financial Statements
YTL Hospitality REIT
108
19. DEPOSITS WITH LICENSED FINANCIAL INSTITUTIONS
The effective interest rate of deposits placed with licensed banks of the Group and of the Trust were 2.9% and 3.1% (2013: 3.0% and 3.1%) per annum, respectively.
The average maturities of deposits of the Group and of the Trust ranged from 1 day to 31 days (2013: 1 day to 32 days).
Included in deposits with licensed financial institutions is RM13,999,775 (2013: RM13,574,329) pledged for a bank facility granted to the Trust as stated in Note 22 to the Financial Statements.
20. UNITHOLDERS’ CAPITAL
2014 2013 No. of units No. of units ’000 ’000
Authorised:- At beginning/end of the financial year 1,324,389 1,324,389
Issued and fully paid:- At beginning/end of the financial year 1,324,389 1,324,389
2014 2013 RM’000 RM’000
Issued and fully paid:- At beginning/end of the financial year 1,291,395 1,291,395
21. RESERVES
(i) Currency translation reserves
The currency translation reserve comprises (i) the foreign exchange differences arising from the translation of the financial statements of foreign operations whose functional currencies are different from the functional currency of the Trust; and (ii) the foreign differences on monetary items which form part of the Group’s net investment in foreign operations.
(ii) Revaluation reserve
The revaluation reserve represents increases in the fair value of freehold land and leasehold buildings, net of tax.
Notes to the Financial Statements
Annual Report 2014
109
22. BORROWING – SECURED
Group Trust 2014 2013 2014 2013 RM’000 RM’000 RM’000 RM’000
Non-current – Term loan 1,581,800 1,581,800 1,581,800 1,581,800 – Capitalised transaction costs (4,901) (6,331) (4,901) (6,331)
1,576,899 1,575,469 1,576,899 1,575,469
The facility bears a weighted average interest rate of 4.54% (2013: 4.52%) per annum and is secured by:
(a) a first legal charge over properties as disclosed in Notes 12 and 13 to the Financial Statements;
(b) an assignment of fire insurance policies in relation to the secured properties; and
(c) a Memorandum of Deposit over the fixed deposit of the Trust as disclosed in Note 19 to the Financial Statements.
The borrowing shall be repaid by bullet payment in full on 23 November 2017.
23. OTHER PAYABLES
Group Trust 2014 2013 2014 2013 RM’000 RM’000 RM’000 RM’000
Non-current Other payables 1,872 2,449 – –
Included in the other payables is the long service leave of approximately RM1,872,000 (2013: RM2,328,000).
Notes to the Financial Statements
YTL Hospitality REIT
110
23. OTHER PAYABLES (CONTINUED)
Group Trust 2014 2013 2014 2013 RM’000 RM’000 RM’000 RM’000
Current Other payables 10,627 6,048 251 244 Accruals 24,786 31,830 8,062 12,637 Advance deposits 4,590 5,266 – –
40,003 43,144 8,313 12,881
The amounts due by the Group and the Trust to the Manager and the companies related to the Manager, which amounted to RM1,769,100 and RM1,769,100 (2013: RM8,027,337 and RM8,022,395), respectively are unsecured, interest free and payable on demand.
24. TRADE PAYABLES
The credit terms of trade payables granted to the Group vary from 15 to 30 (2013: 15 to 30) days.
25. PROVISION FOR INCOME DISTRIBUTION
Group Trust 2014 2013 2014 2013 RM’000 RM’000 RM’000 RM’000
At beginning of the financial year 50,234 48,005 50,234 48,005 Provision made during the financial year 112,060 97,744 112,060 97,744 Distribution paid during the financial year (129,386) (95,515) (129,386) (95,515)
At end of the financial year 32,908 50,234 32,908 50,234
Pursuant to the Restated Deed, it is the policy of the Manager to distribute at least 90% of the distributable income for each financial year.
Notes to the Financial Statements
Annual Report 2014
111
25. PROVISION FOR INCOME DISTRIBUTION (CONTINUED)
For the financial year ended 30 June 2014, the Manager has declared a final income distribution of 2.4848 sen per unit (2013: 3.7930 sen per unit), totaling RM32,908,415 (2013: RM50,234,070) which will be paid on 29 August 2014. Total distribution paid and declared for the financial year ended 30 June 2014 is 8.4613 sen per unit, totaling RM112,060,517, representing approximately 96% of the total distributable income for the financial year ended 30 June 2014 (2013: 7.3803 sen per unit, totaling RM97,743,873).
During the current financial year, the frequency of distribution had changed from half yearly to quarterly basis.
Distribution to unitholders is from the following sources:-
Group 2014 2013 RM’000 RM’000
Net property income 202,867 156,975 Finance income 3,351 3,555 Other income 187,579 5,260
393,797 165,790 Less: Expenses (197,282) (109,548) Less: Income tax expense (1,422) (495)
195,093 55,747 Add/(Less):- Unrealised gain on fair value of investment properties (179,440) – Unrealised (gain)/loss on foreign translation differences (165) 153 Revaluation losses on property 43,672 – Dividend not received from overseas operations (3,840) 4,230 Depreciation 61,822 45,053
Income available for distribution/Total distributable income 117,142 105,183 Less: Income distribution (112,060) (97,744)
Undistributed distributable income 5,082 7,439
Distributable income per unit (sen) 8.8450 7.9420
Gross distribution per unit (sen) 8.4613 7.3803
Net distribution per unit (sen) 8.4613 7.3803
Notes to the Financial Statements
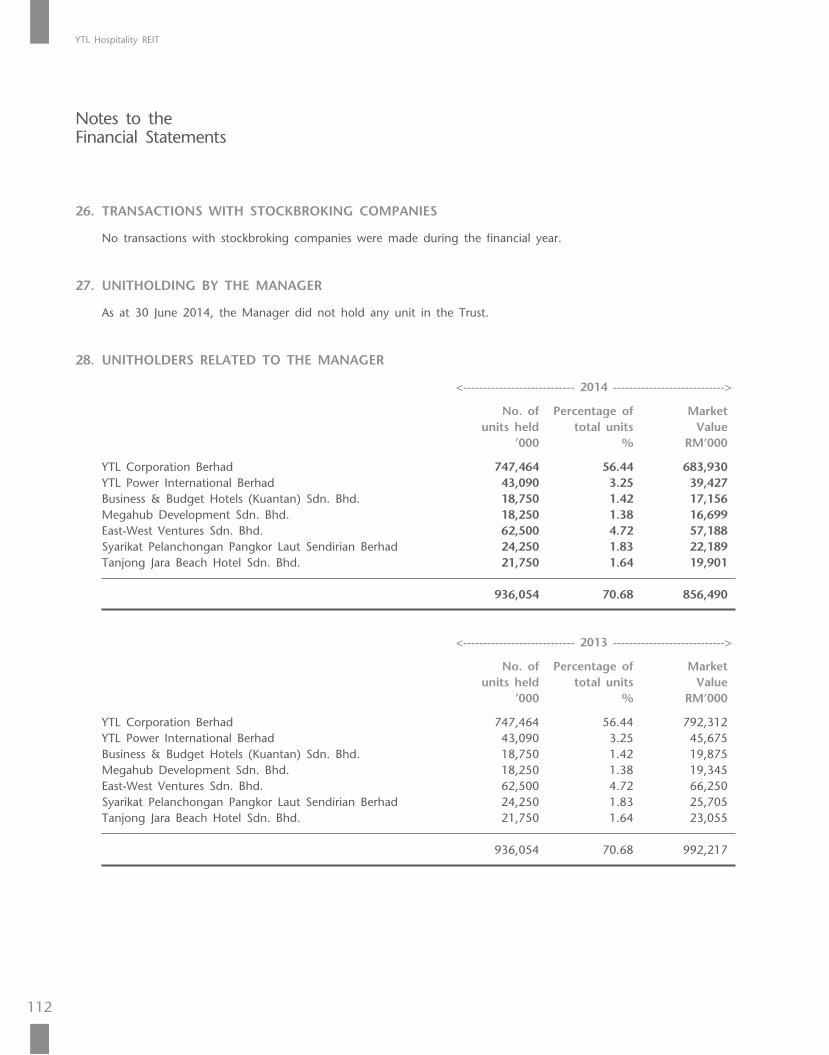
YTL Hospitality REIT
112
26. TRANSACTIONS WITH STOCKBROKING COMPANIES
No transactions with stockbroking companies were made during the financial year.
27. UNITHOLDING BY THE MANAGER
As at 30 June 2014, the Manager did not hold any unit in the Trust.
28. UNITHOLDERS RELATED TO THE MANAGER
<---------------------------- 2014 ---------------------------->
No. of Percentage of Market units held total units Value ’000 % RM’000
YTL Corporation Berhad 747,464 56.44 683,930 YTL Power International Berhad 43,090 3.25 39,427 Business & Budget Hotels (Kuantan) Sdn. Bhd. 18,750 1.42 17,156 Megahub Development Sdn. Bhd. 18,250 1.38 16,699 East-West Ventures Sdn. Bhd. 62,500 4.72 57,188 Syarikat Pelanchongan Pangkor Laut Sendirian Berhad 24,250 1.83 22,189 Tanjong Jara Beach Hotel Sdn. Bhd. 21,750 1.64 19,901
936,054 70.68 856,490
<---------------------------- 2013 ---------------------------->
No. of Percentage of Market units held total units Value ’000 % RM’000
YTL Corporation Berhad 747,464 56.44 792,312 YTL Power International Berhad 43,090 3.25 45,675 Business & Budget Hotels (Kuantan) Sdn. Bhd. 18,750 1.42 19,875 Megahub Development Sdn. Bhd. 18,250 1.38 19,345 East-West Ventures Sdn. Bhd. 62,500 4.72 66,250 Syarikat Pelanchongan Pangkor Laut Sendirian Berhad 24,250 1.83 25,705 Tanjong Jara Beach Hotel Sdn. Bhd. 21,750 1.64 23,055
936,054 70.68 992,217
Notes to the Financial Statements
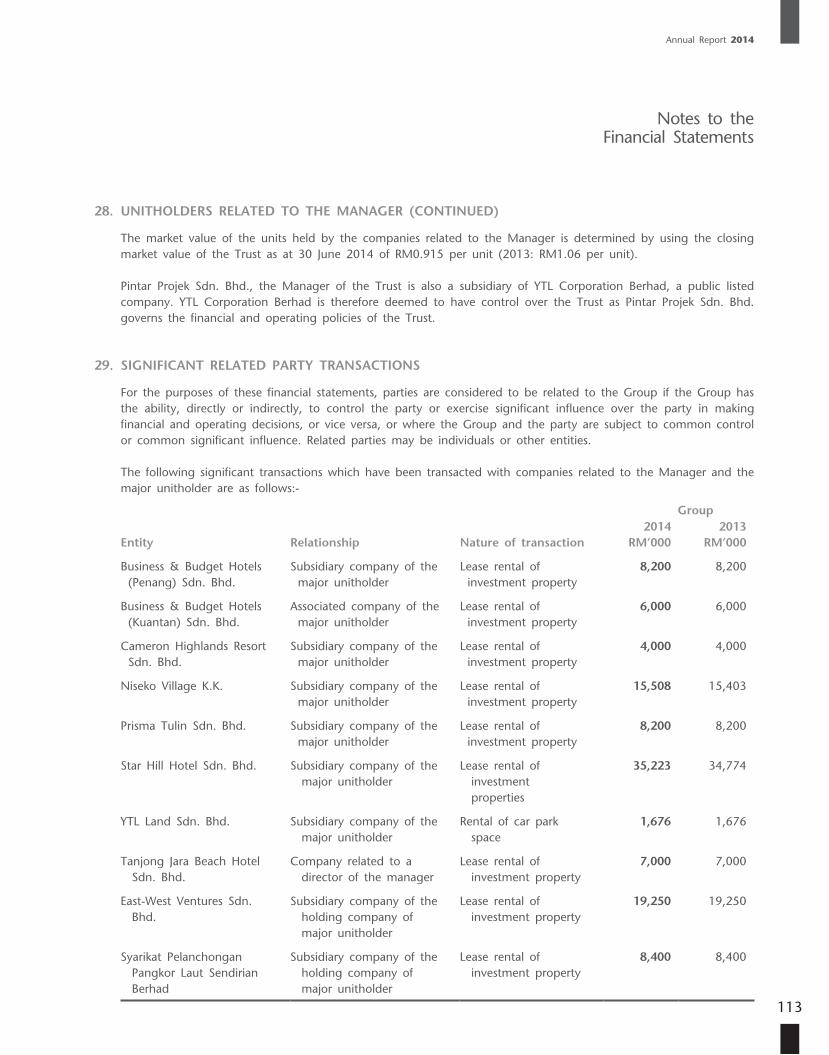
Annual Report 2014
113
28. UNITHOLDERS RELATED TO THE MANAGER (CONTINUED)
The market value of the units held by the companies related to the Manager is determined by using the closing market value of the Trust as at 30 June 2014 of RM0.915 per unit (2013: RM1.06 per unit).
Pintar Projek Sdn. Bhd., the Manager of the Trust is also a subsidiary of YTL Corporation Berhad, a public listed company. YTL Corporation Berhad is therefore deemed to have control over the Trust as Pintar Projek Sdn. Bhd. governs the financial and operating policies of the Trust.
29. SIGNIFICANT RELATED PARTY TRANSACTIONS
For the purposes of these financial statements, parties are considered to be related to the Group if the Group has the ability, directly or indirectly, to control the party or exercise significant influence over the party in making financial and operating decisions, or vice versa, or where the Group and the party are subject to common control or common significant influence. Related parties may be individuals or other entities.
The following significant transactions which have been transacted with companies related to the Manager and the major unitholder are as follows:-
Group
Entity Relationship Nature of transaction2014
RM’0002013
RM’000
Business & Budget Hotels (Penang) Sdn. Bhd.
Subsidiary company of the major unitholder
Lease rental of investment property
8,200 8,200
Business & Budget Hotels (Kuantan) Sdn. Bhd.
Associated company of the major unitholder
Lease rental of investment property
6,000 6,000
Cameron Highlands Resort Sdn. Bhd.
Subsidiary company of the major unitholder
Lease rental of investment property
4,000 4,000
Niseko Village K.K. Subsidiary company of the major unitholder
Lease rental of investment property
15,508 15,403
Prisma Tulin Sdn. Bhd. Subsidiary company of the major unitholder
Lease rental of investment property
8,200 8,200
Star Hill Hotel Sdn. Bhd. Subsidiary company of the major unitholder
Lease rental of investment properties
35,223 34,774
YTL Land Sdn. Bhd. Subsidiary company of the major unitholder
Rental of car park space
1,676 1,676
Tanjong Jara Beach Hotel Sdn. Bhd.
Company related to a director of the manager
Lease rental of investment property
7,000 7,000
East-West Ventures Sdn. Bhd.
Subsidiary company of the holding company of major unitholder
Lease rental of investment property
19,250 19,250
Syarikat Pelanchongan Pangkor Laut Sendirian Berhad
Subsidiary company of the holding company of major unitholder
Lease rental of investment property
8,400 8,400
Notes to the Financial Statements
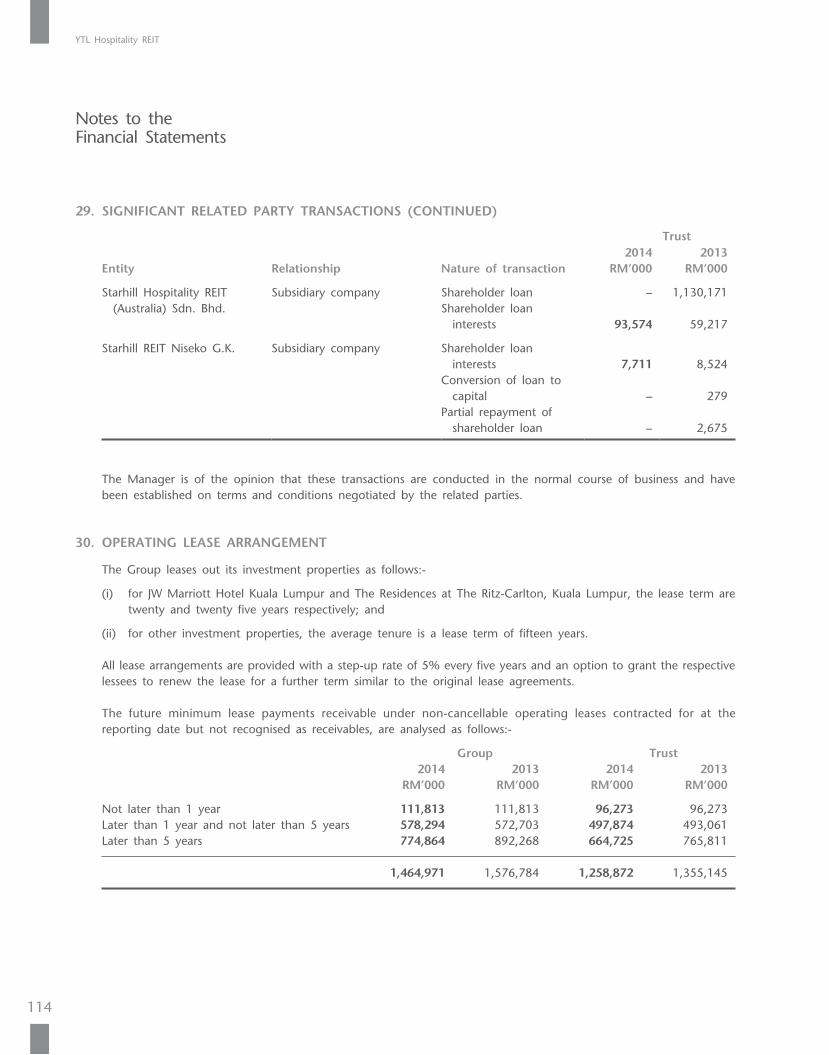
YTL Hospitality REIT
114
29. SIGNIFICANT RELATED PARTY TRANSACTIONS (CONTINUED)
Trust
Entity Relationship Nature of transaction2014
RM’0002013
RM’000
Starhill Hospitality REIT (Australia) Sdn. Bhd.
Subsidiary company Shareholder loanShareholder loan
interests
–
93,574
1,130,171
59,217
Starhill REIT Niseko G.K. Subsidiary company Shareholder loan interests
Conversion of loan to capital
Partial repayment of shareholder loan
7,711
–
–
8,524
279
2,675
The Manager is of the opinion that these transactions are conducted in the normal course of business and have been established on terms and conditions negotiated by the related parties.
30. OPERATING LEASE ARRANGEMENT
The Group leases out its investment properties as follows:-
(i) for JW Marriott Hotel Kuala Lumpur and The Residences at The Ritz-Carlton, Kuala Lumpur, the lease term are twenty and twenty five years respectively; and
(ii) for other investment properties, the average tenure is a lease term of fifteen years.
All lease arrangements are provided with a step-up rate of 5% every five years and an option to grant the respective lessees to renew the lease for a further term similar to the original lease agreements.
The future minimum lease payments receivable under non-cancellable operating leases contracted for at the reporting date but not recognised as receivables, are analysed as follows:-
Group Trust 2014 2013 2014 2013 RM’000 RM’000 RM’000 RM’000
Not later than 1 year 111,813 111,813 96,273 96,273 Later than 1 year and not later than 5 years 578,294 572,703 497,874 493,061 Later than 5 years 774,864 892,268 664,725 765,811
1,464,971 1,576,784 1,258,872 1,355,145
Notes to the Financial Statements
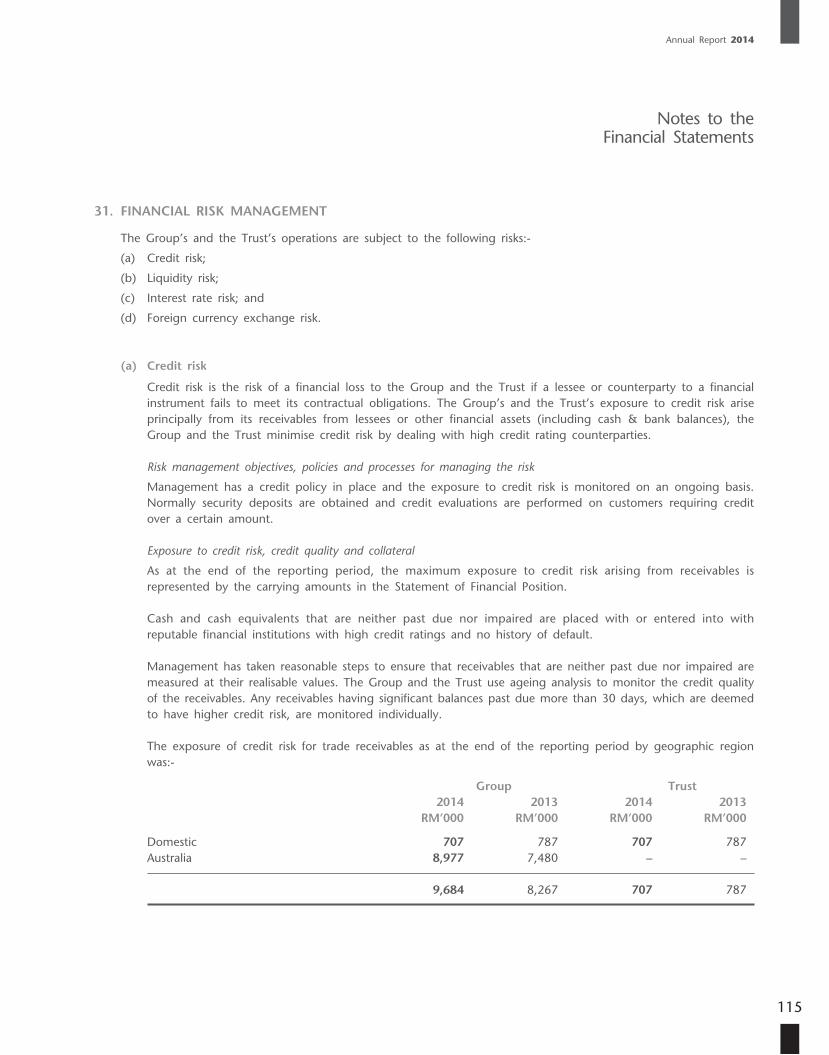
Annual Report 2014
115
31. FINANCIAL RISK MANAGEMENT
The Group’s and the Trust’s operations are subject to the following risks:-
(a) Credit risk;
(b) Liquidity risk;
(c) Interest rate risk; and
(d) Foreign currency exchange risk.
(a) Credit risk
Credit risk is the risk of a financial loss to the Group and the Trust if a lessee or counterparty to a financial instrument fails to meet its contractual obligations. The Group’s and the Trust’s exposure to credit risk arise principally from its receivables from lessees or other financial assets (including cash & bank balances), the Group and the Trust minimise credit risk by dealing with high credit rating counterparties.
Risk management objectives, policies and processes for managing the risk
Management has a credit policy in place and the exposure to credit risk is monitored on an ongoing basis. Normally security deposits are obtained and credit evaluations are performed on customers requiring credit over a certain amount.
Exposure to credit risk, credit quality and collateral
As at the end of the reporting period, the maximum exposure to credit risk arising from receivables is represented by the carrying amounts in the Statement of Financial Position.
Cash and cash equivalents that are neither past due nor impaired are placed with or entered into with reputable financial institutions with high credit ratings and no history of default.
Management has taken reasonable steps to ensure that receivables that are neither past due nor impaired are measured at their realisable values. The Group and the Trust use ageing analysis to monitor the credit quality of the receivables. Any receivables having significant balances past due more than 30 days, which are deemed to have higher credit risk, are monitored individually.
The exposure of credit risk for trade receivables as at the end of the reporting period by geographic region was:-
Group Trust 2014 2013 2014 2013 RM’000 RM’000 RM’000 RM’000
Domestic 707 787 707 787 Australia 8,977 7,480 – –
9,684 8,267 707 787
Notes to the Financial Statements
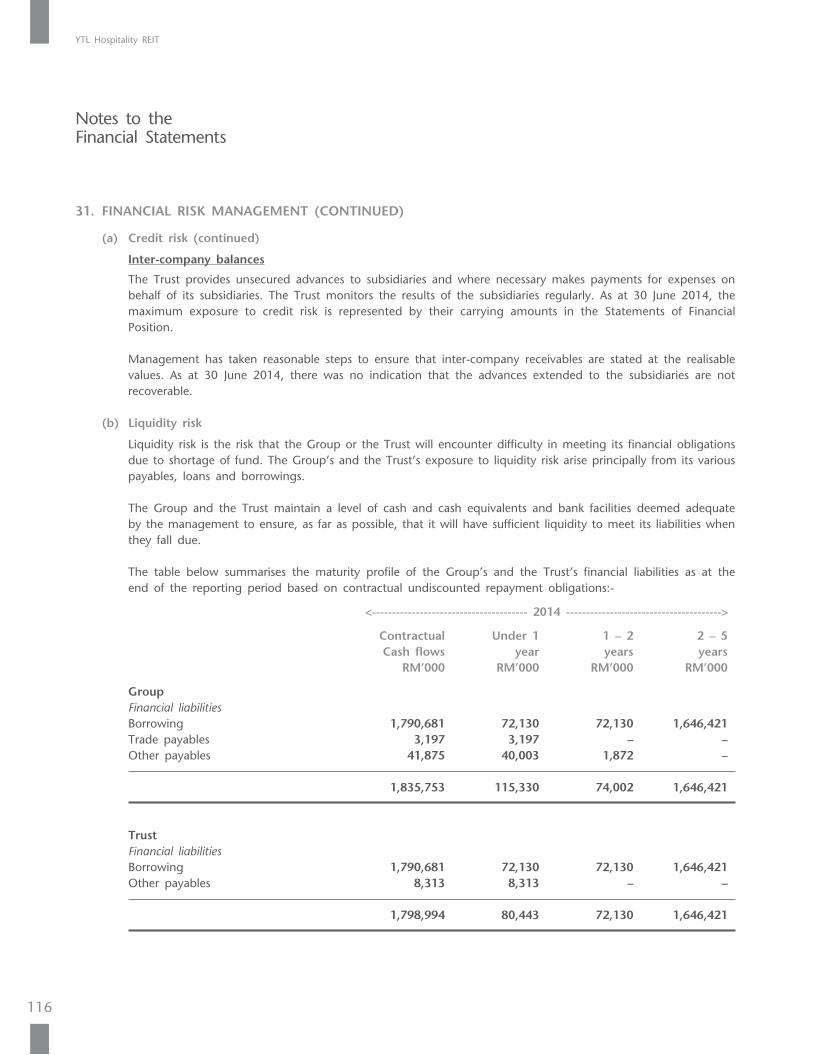
YTL Hospitality REIT
116
31. FINANCIAL RISK MANAGEMENT (CONTINUED)
(a) Credit risk (continued)
Inter-company balances
The Trust provides unsecured advances to subsidiaries and where necessary makes payments for expenses on behalf of its subsidiaries. The Trust monitors the results of the subsidiaries regularly. As at 30 June 2014, the maximum exposure to credit risk is represented by their carrying amounts in the Statements of Financial Position.
Management has taken reasonable steps to ensure that inter-company receivables are stated at the realisable values. As at 30 June 2014, there was no indication that the advances extended to the subsidiaries are not recoverable.
(b) Liquidity risk
Liquidity risk is the risk that the Group or the Trust will encounter difficulty in meeting its financial obligations due to shortage of fund. The Group’s and the Trust’s exposure to liquidity risk arise principally from its various payables, loans and borrowings.
The Group and the Trust maintain a level of cash and cash equivalents and bank facilities deemed adequate by the management to ensure, as far as possible, that it will have sufficient liquidity to meet its liabilities when they fall due.
The table below summarises the maturity profile of the Group’s and the Trust’s financial liabilities as at the end of the reporting period based on contractual undiscounted repayment obligations:-
<--------------------------------------- 2014 --------------------------------------->
Contractual Under 1 1 – 2 2 – 5 Cash flows year years years RM’000 RM’000 RM’000 RM’000
Group Financial liabilities Borrowing 1,790,681 72,130 72,130 1,646,421 Trade payables 3,197 3,197 – – Other payables 41,875 40,003 1,872 –
1,835,753 115,330 74,002 1,646,421
Trust Financial liabilities Borrowing 1,790,681 72,130 72,130 1,646,421 Other payables 8,313 8,313 – –
1,798,994 80,443 72,130 1,646,421
Notes to the Financial Statements
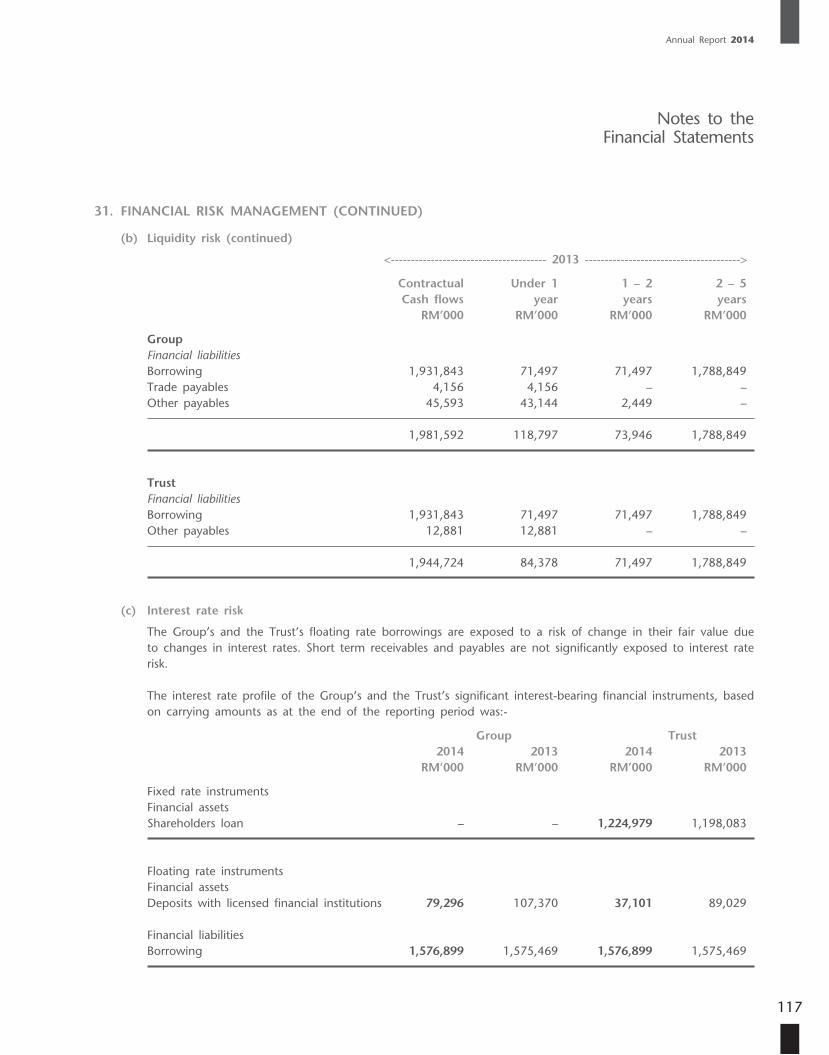
Annual Report 2014
117
31. FINANCIAL RISK MANAGEMENT (CONTINUED)
(b) Liquidity risk (continued)
<--------------------------------------- 2013 --------------------------------------->
Contractual Under 1 1 – 2 2 – 5 Cash flows year years years RM’000 RM’000 RM’000 RM’000
Group Financial liabilities Borrowing 1,931,843 71,497 71,497 1,788,849 Trade payables 4,156 4,156 – – Other payables 45,593 43,144 2,449 –
1,981,592 118,797 73,946 1,788,849
Trust Financial liabilities Borrowing 1,931,843 71,497 71,497 1,788,849 Other payables 12,881 12,881 – –
1,944,724 84,378 71,497 1,788,849
(c) Interest rate risk
The Group’s and the Trust’s floating rate borrowings are exposed to a risk of change in their fair value due to changes in interest rates. Short term receivables and payables are not significantly exposed to interest rate risk.
The interest rate profile of the Group’s and the Trust’s significant interest-bearing financial instruments, based on carrying amounts as at the end of the reporting period was:-
Group Trust 2014 2013 2014 2013 RM’000 RM’000 RM’000 RM’000
Fixed rate instruments Financial assets Shareholders loan – – 1,224,979 1,198,083
Floating rate instruments Financial assets Deposits with licensed financial institutions 79,296 107,370 37,101 89,029
Financial liabilities Borrowing 1,576,899 1,575,469 1,576,899 1,575,469
Notes to the Financial Statements

YTL Hospitality REIT
118
31. FINANCIAL RISK MANAGEMENT (CONTINUED)
(c) Interest rate risk (continued)
The Group and the Trust does not account for any fixed rate financial assets and liabilities at fair value through profit or loss. Therefore, a change in interest rates at the end of the reporting period would not affect profit or loss.
At the reporting date, if the interest rates had been 50 basis points lower/higher, with all other variables held constant, the Group’s and the Trust’s profit after tax would be higher/lower by approximately RM7.9 million (2013: RM7.9 million) as a result of lower/higher interest expense on borrowing.
The excess funds of the Group and of the Trust are invested in bank deposits and other short term instruments. The Group and the Trust manage their liquidity risks by placing such excess funds on short term maturities to match its cash flow needs. If interest deposit rates increased/decreased by 50 basis points, interest income of the Group and of the Trust for the financial year would increase/decrease by RM0.4 million (2013: RM0.5 million) and RM0.2 million (2013: RM0.5 million), respectively.
(d) Foreign currency exchange risk
The Group is exposed to foreign currency risk arising from Japanese Yen (“JPY”) and Australian Dollar (“AUD”). The Group has investment in foreign operations whose net assets are exposed to foreign currency translation risk.
The table illustrates the impact on the other comprehensive income and profit after tax resulting from currency sensitivities (on the basis all other variables remain constant).
Group Trust
Increase/ Increase/ Increase/ Increase/ (Decrease) (Decrease) (Decrease) (Decrease) in other in profit in other in profit comprehensive after comprehensive after income tax income tax RM’000 RM’000 RM’000 RM’000
2014 5% changes on JPY exchange rate (1,584) – – 7,582
5% changes on AUD exchange rate 53,510 – – 53,667
2013 5% changes on JPY exchange rate (684) – – 7,694
5% changes on AUD exchange rate 44,385 – – 52,210
Notes to the Financial Statements
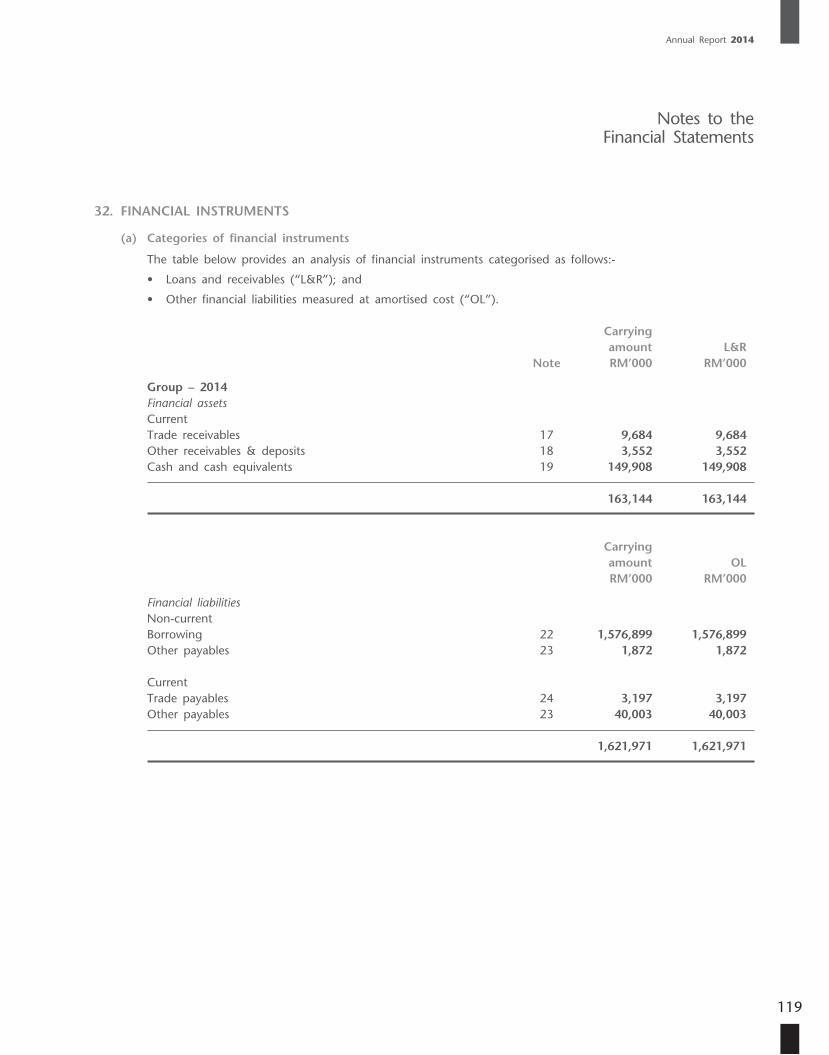
Annual Report 2014
119
32. FINANCIAL INSTRUMENTS
(a) Categories of financial instruments
The table below provides an analysis of financial instruments categorised as follows:-
• Loans and receivables (“L&R”); and
• Other financial liabilities measured at amortised cost (“OL”).
Carrying amount L&R Note RM’000 RM’000
Group – 2014 Financial assets Current Trade receivables 17 9,684 9,684 Other receivables & deposits 18 3,552 3,552 Cash and cash equivalents 19 149,908 149,908
163,144 163,144
Carrying amount OL RM’000 RM’000
Financial liabilities Non-current Borrowing 22 1,576,899 1,576,899 Other payables 23 1,872 1,872
Current Trade payables 24 3,197 3,197 Other payables 23 40,003 40,003
1,621,971 1,621,971
Notes to the Financial Statements
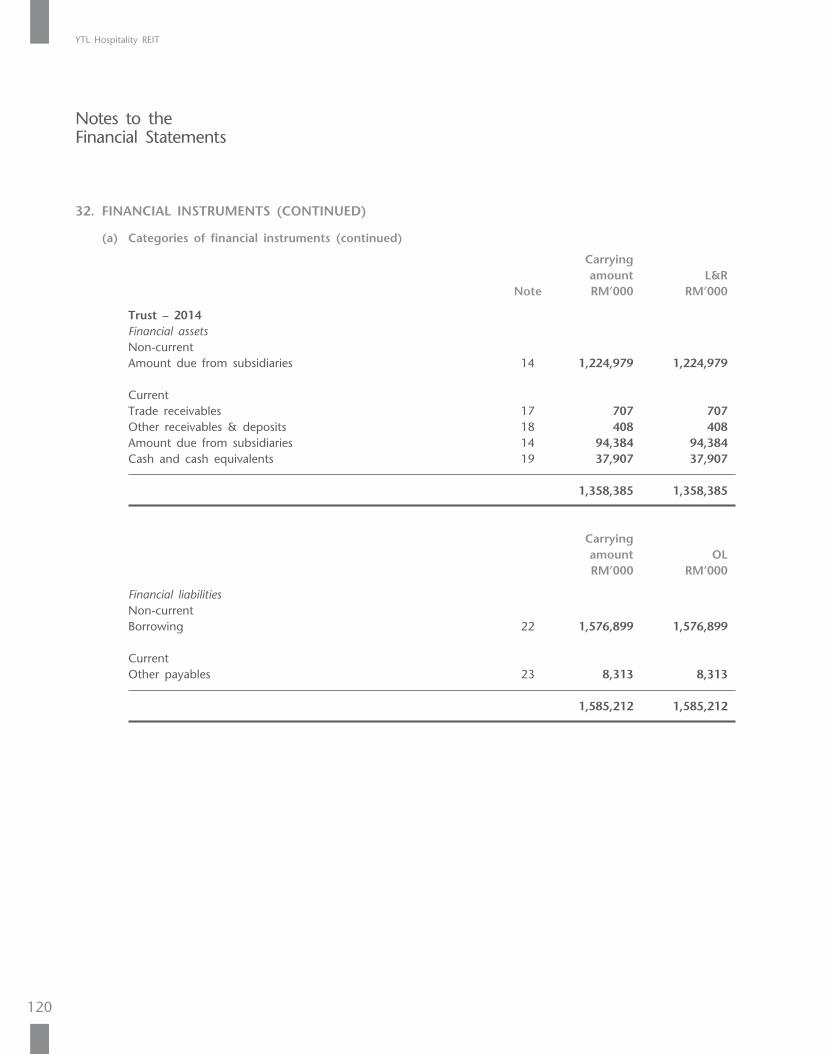
YTL Hospitality REIT
120
32. FINANCIAL INSTRUMENTS (CONTINUED)
(a) Categories of financial instruments (continued)
Carrying amount L&R Note RM’000 RM’000
Trust – 2014 Financial assets Non-current Amount due from subsidiaries 14 1,224,979 1,224,979
Current Trade receivables 17 707 707 Other receivables & deposits 18 408 408 Amount due from subsidiaries 14 94,384 94,384 Cash and cash equivalents 19 37,907 37,907
1,358,385 1,358,385
Carrying amount OL RM’000 RM’000
Financial liabilities Non-current Borrowing 22 1,576,899 1,576,899
Current Other payables 23 8,313 8,313
1,585,212 1,585,212
Notes to the Financial Statements
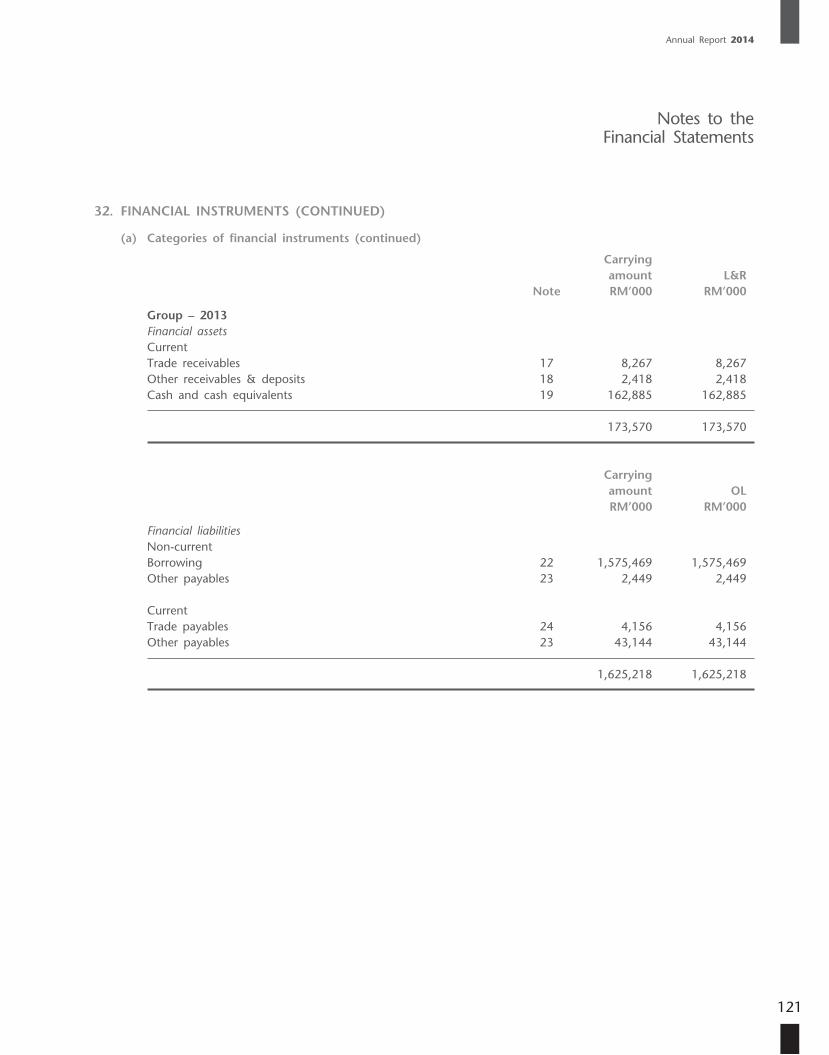
Annual Report 2014
121
32. FINANCIAL INSTRUMENTS (CONTINUED)
(a) Categories of financial instruments (continued)
Carrying amount L&R Note RM’000 RM’000
Group – 2013 Financial assets Current Trade receivables 17 8,267 8,267 Other receivables & deposits 18 2,418 2,418 Cash and cash equivalents 19 162,885 162,885
173,570 173,570
Carrying amount OL RM’000 RM’000
Financial liabilities Non-current Borrowing 22 1,575,469 1,575,469 Other payables 23 2,449 2,449
Current Trade payables 24 4,156 4,156 Other payables 23 43,144 43,144
1,625,218 1,625,218
Notes to the Financial Statements
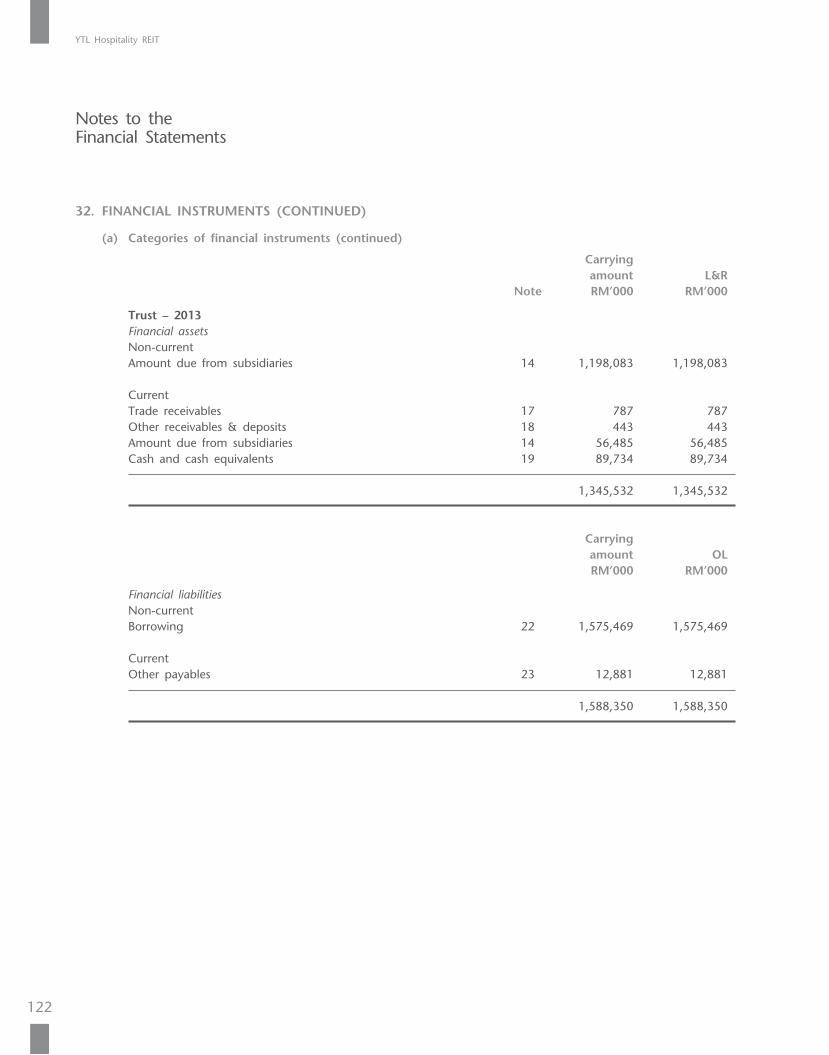
YTL Hospitality REIT
122
32. FINANCIAL INSTRUMENTS (CONTINUED)
(a) Categories of financial instruments (continued)
Carrying amount L&R Note RM’000 RM’000
Trust – 2013 Financial assets Non-current Amount due from subsidiaries 14 1,198,083 1,198,083
Current Trade receivables 17 787 787 Other receivables & deposits 18 443 443 Amount due from subsidiaries 14 56,485 56,485 Cash and cash equivalents 19 89,734 89,734
1,345,532 1,345,532
Carrying amount OL RM’000 RM’000
Financial liabilities Non-current Borrowing 22 1,575,469 1,575,469
Current Other payables 23 12,881 12,881
1,588,350 1,588,350
Notes to the Financial Statements
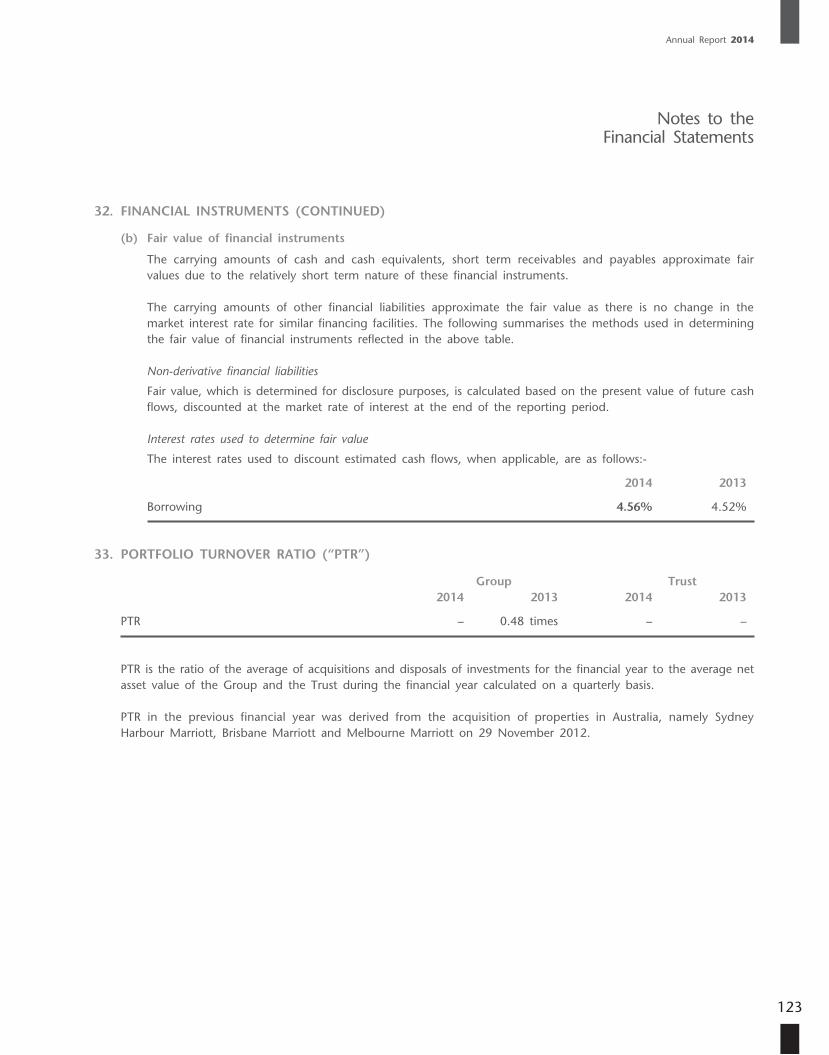
Annual Report 2014
123
32. FINANCIAL INSTRUMENTS (CONTINUED)
(b) Fair value of financial instruments
The carrying amounts of cash and cash equivalents, short term receivables and payables approximate fair values due to the relatively short term nature of these financial instruments.
The carrying amounts of other financial liabilities approximate the fair value as there is no change in the market interest rate for similar financing facilities. The following summarises the methods used in determining the fair value of financial instruments reflected in the above table.
Non-derivative financial liabilities
Fair value, which is determined for disclosure purposes, is calculated based on the present value of future cash flows, discounted at the market rate of interest at the end of the reporting period.
Interest rates used to determine fair value
The interest rates used to discount estimated cash flows, when applicable, are as follows:-
2014 2013
Borrowing 4.56% 4.52%
33. PORTFOLIO TURNOVER RATIO (“PTR”)
Group Trust 2014 2013 2014 2013
PTR – 0.48 times – –
PTR is the ratio of the average of acquisitions and disposals of investments for the financial year to the average net asset value of the Group and the Trust during the financial year calculated on a quarterly basis.
PTR in the previous financial year was derived from the acquisition of properties in Australia, namely Sydney Harbour Marriott, Brisbane Marriott and Melbourne Marriott on 29 November 2012.
Notes to the Financial Statements
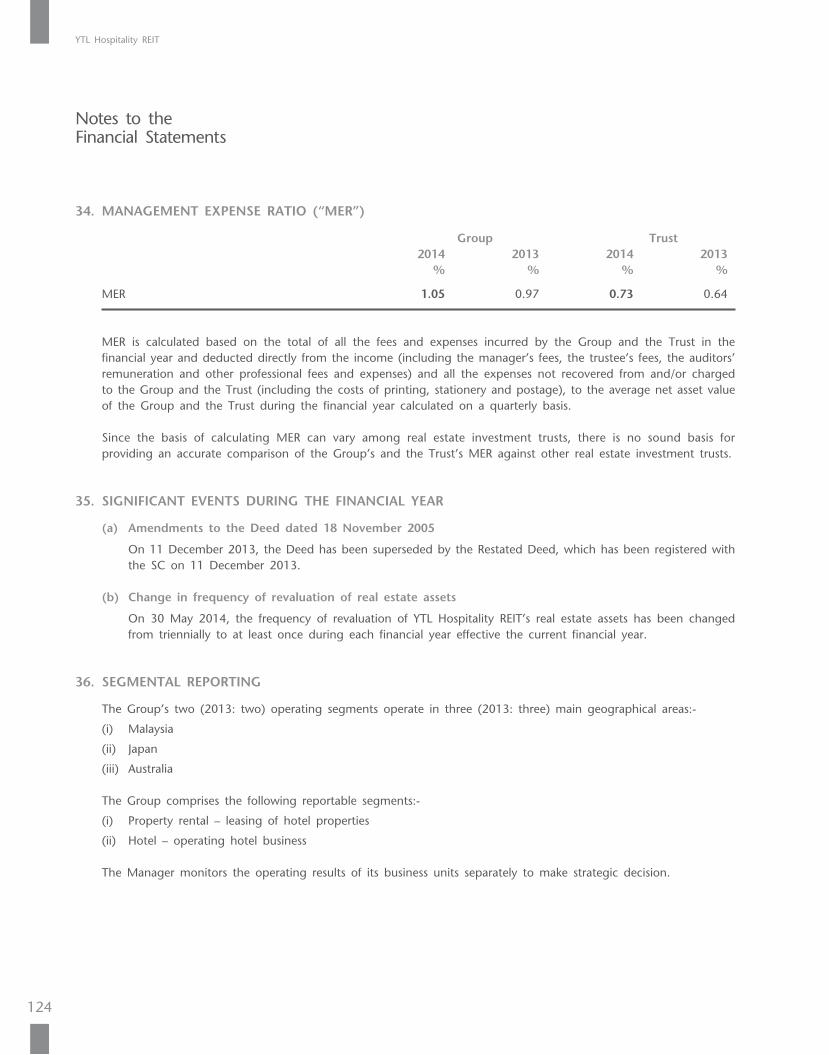
YTL Hospitality REIT
124
34. MANAGEMENT EXPENSE RATIO (“MER”)
Group Trust 2014 2013 2014 2013 % % % %
MER 1.05 0.97 0.73 0.64
MER is calculated based on the total of all the fees and expenses incurred by the Group and the Trust in the financial year and deducted directly from the income (including the manager’s fees, the trustee’s fees, the auditors’ remuneration and other professional fees and expenses) and all the expenses not recovered from and/or charged to the Group and the Trust (including the costs of printing, stationery and postage), to the average net asset value of the Group and the Trust during the financial year calculated on a quarterly basis.
Since the basis of calculating MER can vary among real estate investment trusts, there is no sound basis for providing an accurate comparison of the Group’s and the Trust’s MER against other real estate investment trusts.
35. SIGNIFICANT EVENTS DURING THE FINANCIAL YEAR
(a) Amendments to the Deed dated 18 November 2005
On 11 December 2013, the Deed has been superseded by the Restated Deed, which has been registered with the SC on 11 December 2013.
(b) Change in frequency of revaluation of real estate assets
On 30 May 2014, the frequency of revaluation of YTL Hospitality REIT’s real estate assets has been changed from triennially to at least once during each financial year effective the current financial year.
36. SEGMENTAL REPORTING
The Group’s two (2013: two) operating segments operate in three (2013: three) main geographical areas:-
(i) Malaysia
(ii) Japan
(iii) Australia
The Group comprises the following reportable segments:-
(i) Property rental – leasing of hotel properties
(ii) Hotel – operating hotel business
The Manager monitors the operating results of its business units separately to make strategic decision.
Notes to the Financial Statements
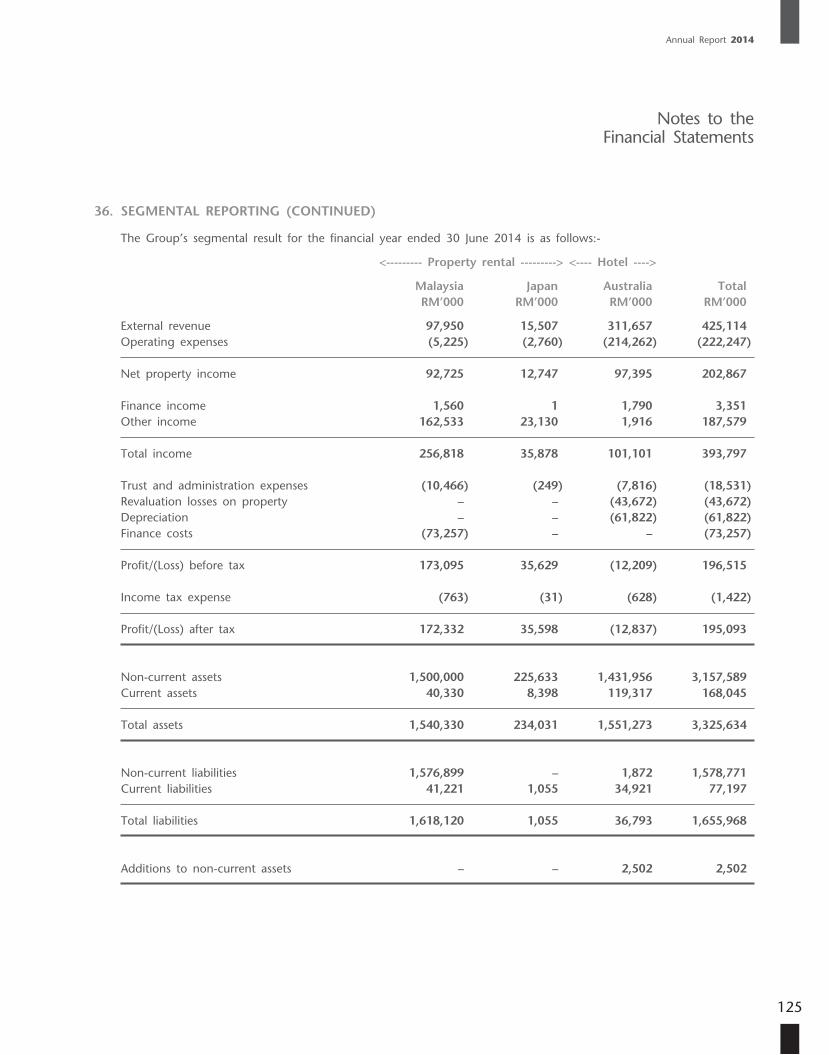
Annual Report 2014
125
36. SEGMENTAL REPORTING (CONTINUED)
The Group’s segmental result for the financial year ended 30 June 2014 is as follows:-
<--------- Property rental ---------> <---- Hotel ---->
Malaysia Japan Australia Total RM’000 RM’000 RM’000 RM’000
External revenue 97,950 15,507 311,657 425,114 Operating expenses (5,225) (2,760) (214,262) (222,247)
Net property income 92,725 12,747 97,395 202,867
Finance income 1,560 1 1,790 3,351 Other income 162,533 23,130 1,916 187,579
Total income 256,818 35,878 101,101 393,797
Trust and administration expenses (10,466) (249) (7,816) (18,531) Revaluation losses on property – – (43,672) (43,672) Depreciation – – (61,822) (61,822) Finance costs (73,257) – – (73,257)
Profit/(Loss) before tax 173,095 35,629 (12,209) 196,515
Income tax expense (763) (31) (628) (1,422)
Profit/(Loss) after tax 172,332 35,598 (12,837) 195,093
Non-current assets 1,500,000 225,633 1,431,956 3,157,589 Current assets 40,330 8,398 119,317 168,045
Total assets 1,540,330 234,031 1,551,273 3,325,634
Non-current liabilities 1,576,899 – 1,872 1,578,771 Current liabilities 41,221 1,055 34,921 77,197
Total liabilities 1,618,120 1,055 36,793 1,655,968
Additions to non-current assets – – 2,502 2,502
Notes to the Financial Statements
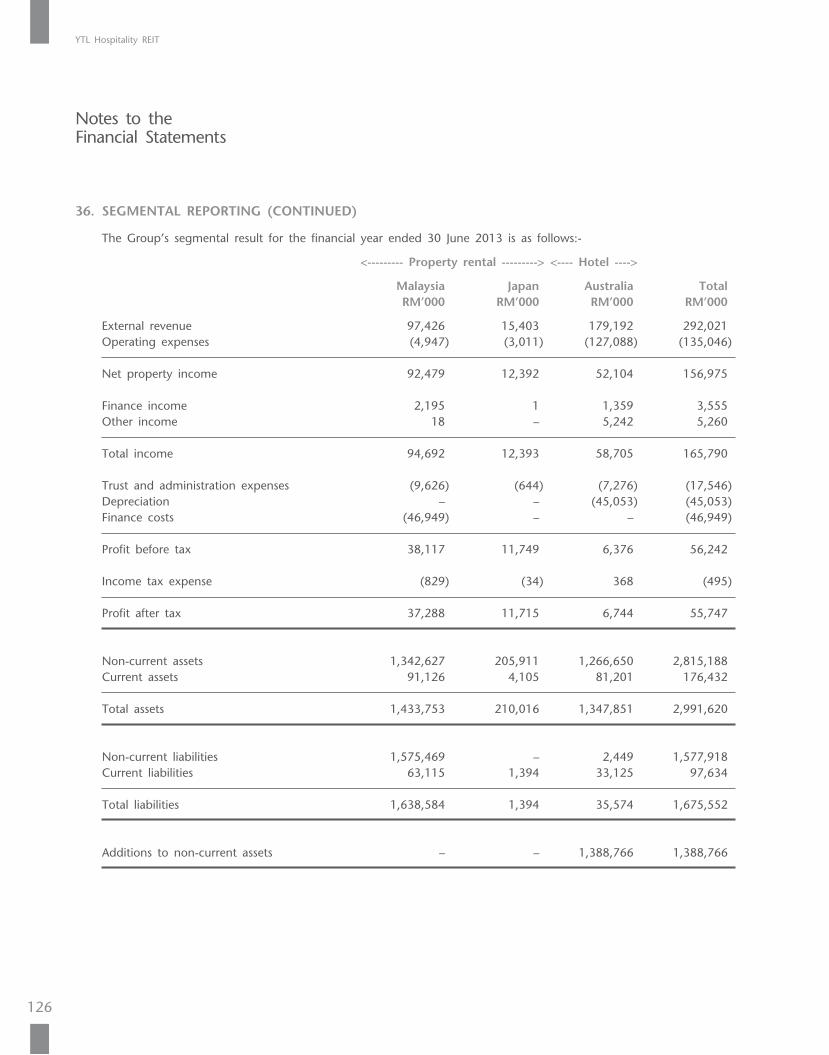
YTL Hospitality REIT
126
36. SEGMENTAL REPORTING (CONTINUED)
The Group’s segmental result for the financial year ended 30 June 2013 is as follows:-
<--------- Property rental ---------> <---- Hotel ---->
Malaysia Japan Australia Total RM’000 RM’000 RM’000 RM’000
External revenue 97,426 15,403 179,192 292,021 Operating expenses (4,947) (3,011) (127,088) (135,046)
Net property income 92,479 12,392 52,104 156,975
Finance income 2,195 1 1,359 3,555 Other income 18 – 5,242 5,260
Total income 94,692 12,393 58,705 165,790
Trust and administration expenses (9,626) (644) (7,276) (17,546) Depreciation – – (45,053) (45,053) Finance costs (46,949) – – (46,949)
Profit before tax 38,117 11,749 6,376 56,242
Income tax expense (829) (34) 368 (495)
Profit after tax 37,288 11,715 6,744 55,747
Non-current assets 1,342,627 205,911 1,266,650 2,815,188 Current assets 91,126 4,105 81,201 176,432
Total assets 1,433,753 210,016 1,347,851 2,991,620
Non-current liabilities 1,575,469 – 2,449 1,577,918 Current liabilities 63,115 1,394 33,125 97,634
Total liabilities 1,638,584 1,394 35,574 1,675,552
Additions to non-current assets – – 1,388,766 1,388,766
Notes to the Financial Statements
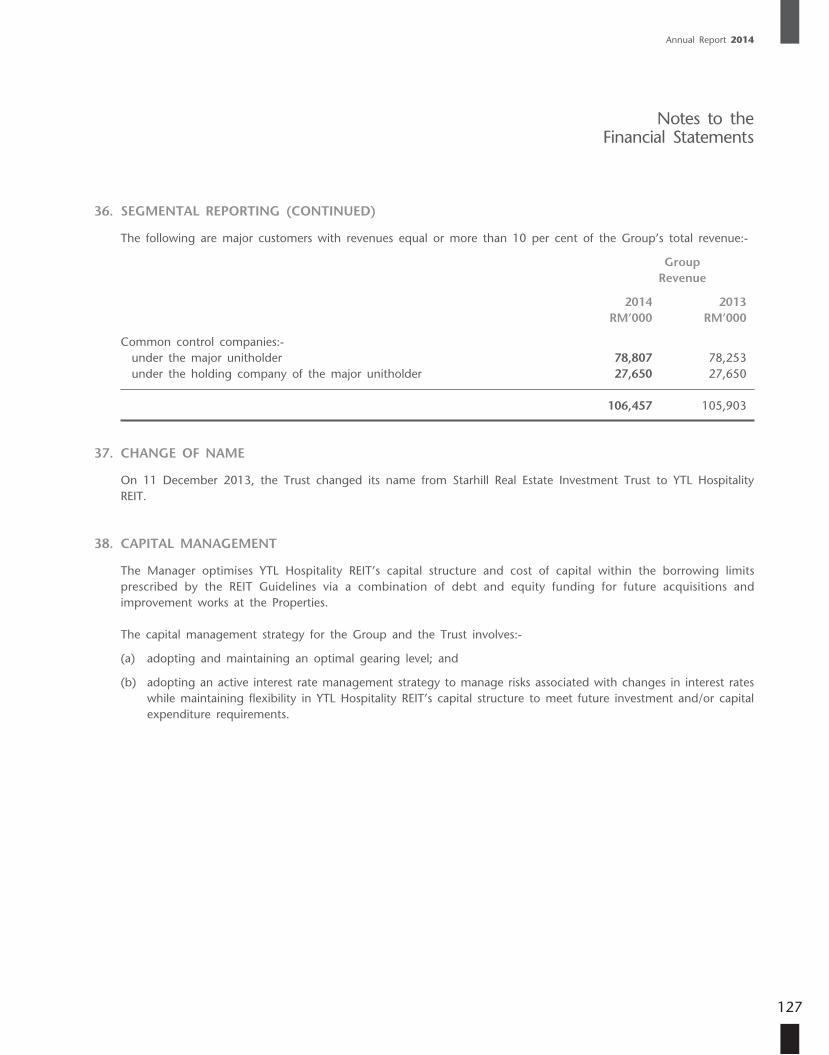
Annual Report 2014
127
36. SEGMENTAL REPORTING (CONTINUED)
The following are major customers with revenues equal or more than 10 per cent of the Group’s total revenue:-
Group Revenue
2014 2013 RM’000 RM’000
Common control companies:- under the major unitholder 78,807 78,253 under the holding company of the major unitholder 27,650 27,650
106,457 105,903
37. CHANGE OF NAME
On 11 December 2013, the Trust changed its name from Starhill Real Estate Investment Trust to YTL Hospitality REIT.
38. CAPITAL MANAGEMENT
The Manager optimises YTL Hospitality REIT’s capital structure and cost of capital within the borrowing limits prescribed by the REIT Guidelines via a combination of debt and equity funding for future acquisitions and improvement works at the Properties.
The capital management strategy for the Group and the Trust involves:-
(a) adopting and maintaining an optimal gearing level; and
(b) adopting an active interest rate management strategy to manage risks associated with changes in interest rates while maintaining flexibility in YTL Hospitality REIT’s capital structure to meet future investment and/or capital expenditure requirements.
Notes to the Financial Statements
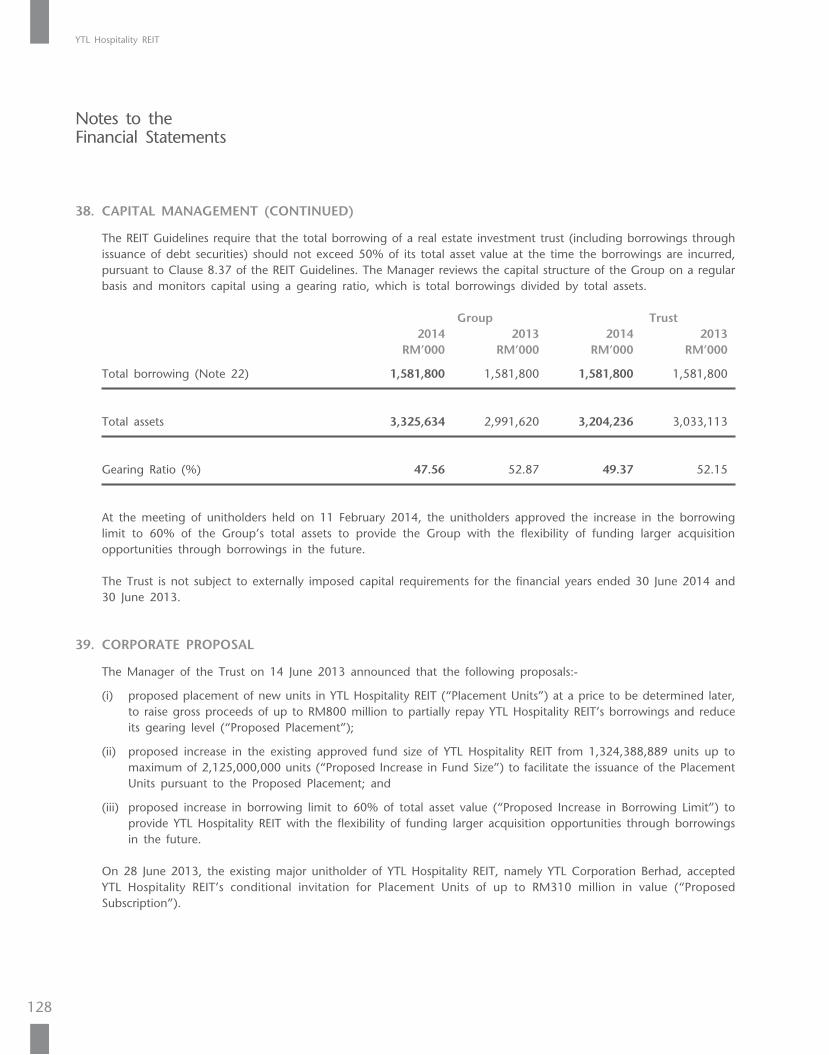
YTL Hospitality REIT
128
38. CAPITAL MANAGEMENT (CONTINUED)
The REIT Guidelines require that the total borrowing of a real estate investment trust (including borrowings through issuance of debt securities) should not exceed 50% of its total asset value at the time the borrowings are incurred, pursuant to Clause 8.37 of the REIT Guidelines. The Manager reviews the capital structure of the Group on a regular basis and monitors capital using a gearing ratio, which is total borrowings divided by total assets.
Group Trust 2014 2013 2014 2013 RM’000 RM’000 RM’000 RM’000
Total borrowing (Note 22) 1,581,800 1,581,800 1,581,800 1,581,800
Total assets 3,325,634 2,991,620 3,204,236 3,033,113
Gearing Ratio (%) 47.56 52.87 49.37 52.15
At the meeting of unitholders held on 11 February 2014, the unitholders approved the increase in the borrowing limit to 60% of the Group’s total assets to provide the Group with the flexibility of funding larger acquisition opportunities through borrowings in the future.
The Trust is not subject to externally imposed capital requirements for the financial years ended 30 June 2014 and 30 June 2013.
39. CORPORATE PROPOSAL
The Manager of the Trust on 14 June 2013 announced that the following proposals:-
(i) proposed placement of new units in YTL Hospitality REIT (“Placement Units”) at a price to be determined later, to raise gross proceeds of up to RM800 million to partially repay YTL Hospitality REIT’s borrowings and reduce its gearing level (“Proposed Placement”);
(ii) proposed increase in the existing approved fund size of YTL Hospitality REIT from 1,324,388,889 units up to maximum of 2,125,000,000 units (“Proposed Increase in Fund Size”) to facilitate the issuance of the Placement Units pursuant to the Proposed Placement; and
(iii) proposed increase in borrowing limit to 60% of total asset value (“Proposed Increase in Borrowing Limit”) to provide YTL Hospitality REIT with the flexibility of funding larger acquisition opportunities through borrowings in the future.
On 28 June 2013, the existing major unitholder of YTL Hospitality REIT, namely YTL Corporation Berhad, accepted YTL Hospitality REIT’s conditional invitation for Placement Units of up to RM310 million in value (“Proposed Subscription”).
Notes to the Financial Statements
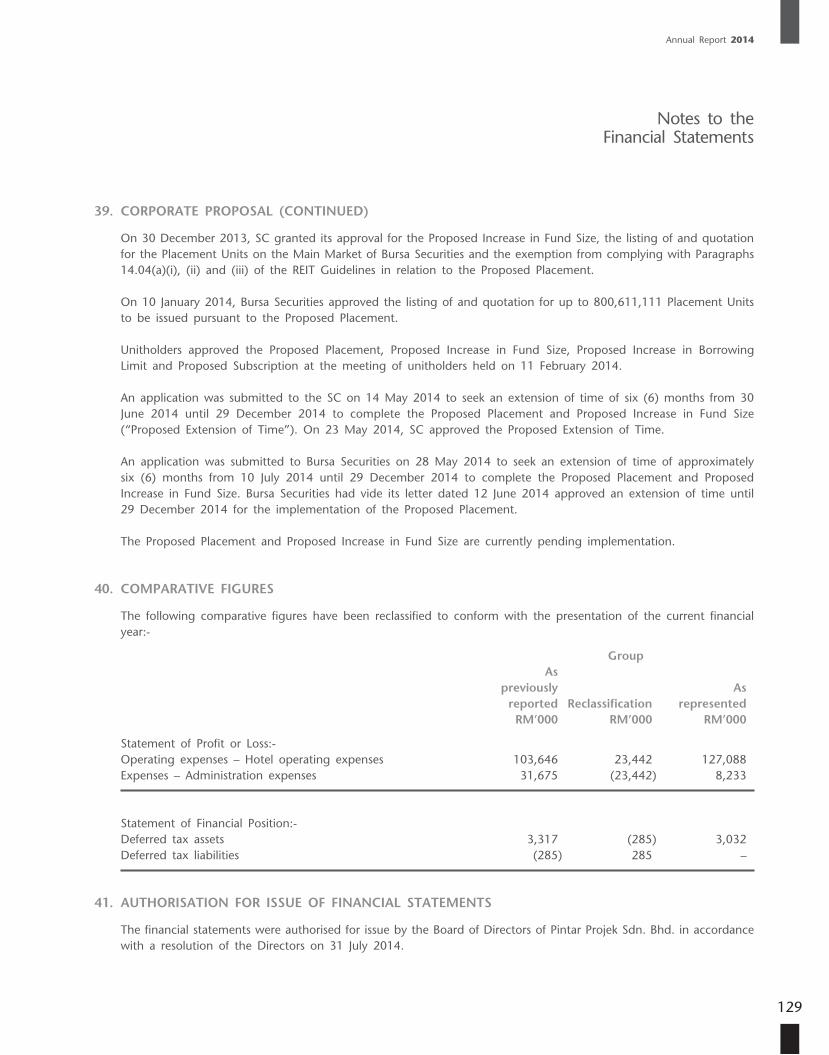
Annual Report 2014
129
39. CORPORATE PROPOSAL (CONTINUED)
On 30 December 2013, SC granted its approval for the Proposed Increase in Fund Size, the listing of and quotation for the Placement Units on the Main Market of Bursa Securities and the exemption from complying with Paragraphs 14.04(a)(i), (ii) and (iii) of the REIT Guidelines in relation to the Proposed Placement.
On 10 January 2014, Bursa Securities approved the listing of and quotation for up to 800,611,111 Placement Units to be issued pursuant to the Proposed Placement.
Unitholders approved the Proposed Placement, Proposed Increase in Fund Size, Proposed Increase in Borrowing Limit and Proposed Subscription at the meeting of unitholders held on 11 February 2014.
An application was submitted to the SC on 14 May 2014 to seek an extension of time of six (6) months from 30 June 2014 until 29 December 2014 to complete the Proposed Placement and Proposed Increase in Fund Size (“Proposed Extension of Time”). On 23 May 2014, SC approved the Proposed Extension of Time.
An application was submitted to Bursa Securities on 28 May 2014 to seek an extension of time of approximately six (6) months from 10 July 2014 until 29 December 2014 to complete the Proposed Placement and Proposed Increase in Fund Size. Bursa Securities had vide its letter dated 12 June 2014 approved an extension of time until 29 December 2014 for the implementation of the Proposed Placement.
The Proposed Placement and Proposed Increase in Fund Size are currently pending implementation.
40. COMPARATIVE FIGURES
The following comparative figures have been reclassified to conform with the presentation of the current financial year:-
Group As previously As reported Reclassification represented RM’000 RM’000 RM’000
Statement of Profit or Loss:- Operating expenses – Hotel operating expenses 103,646 23,442 127,088 Expenses – Administration expenses 31,675 (23,442) 8,233
Statement of Financial Position:- Deferred tax assets 3,317 (285) 3,032 Deferred tax liabilities (285) 285 –
41. AUTHORISATION FOR ISSUE OF FINANCIAL STATEMENTS
The financial statements were authorised for issue by the Board of Directors of Pintar Projek Sdn. Bhd. in accordance with a resolution of the Directors on 31 July 2014.
Notes to the Financial Statements
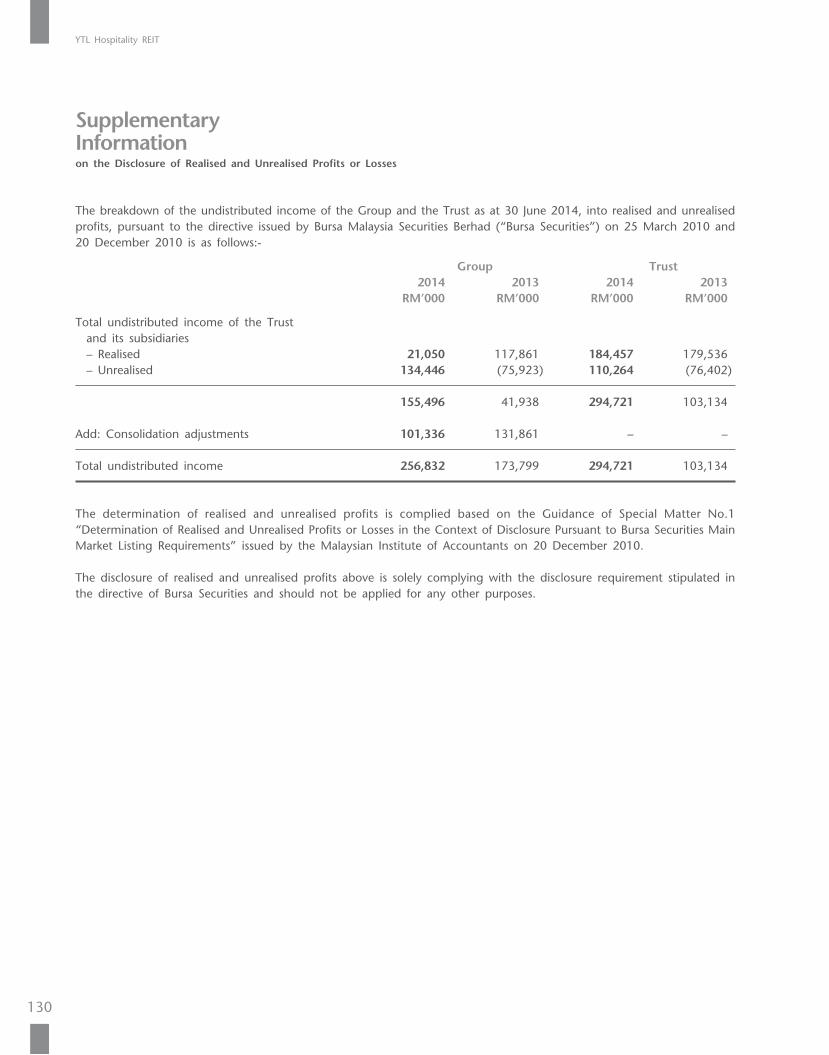
YTL Hospitality REIT
130
The breakdown of the undistributed income of the Group and the Trust as at 30 June 2014, into realised and unrealised profits, pursuant to the directive issued by Bursa Malaysia Securities Berhad (“Bursa Securities”) on 25 March 2010 and 20 December 2010 is as follows:-
Group Trust 2014 2013 2014 2013 RM’000 RM’000 RM’000 RM’000
Total undistributed income of the Trust and its subsidiaries – Realised 21,050 117,861 184,457 179,536 – Unrealised 134,446 (75,923) 110,264 (76,402)
155,496 41,938 294,721 103,134
Add: Consolidation adjustments 101,336 131,861 – –
Total undistributed income 256,832 173,799 294,721 103,134
The determination of realised and unrealised profits is complied based on the Guidance of Special Matter No.1 “Determination of Realised and Unrealised Profits or Losses in the Context of Disclosure Pursuant to Bursa Securities Main Market Listing Requirements” issued by the Malaysian Institute of Accountants on 20 December 2010.
The disclosure of realised and unrealised profits above is solely complying with the disclosure requirement stipulated in the directive of Bursa Securities and should not be applied for any other purposes.
Supplementary Informationon the Disclosure of Realised and Unrealised Profits or Losses
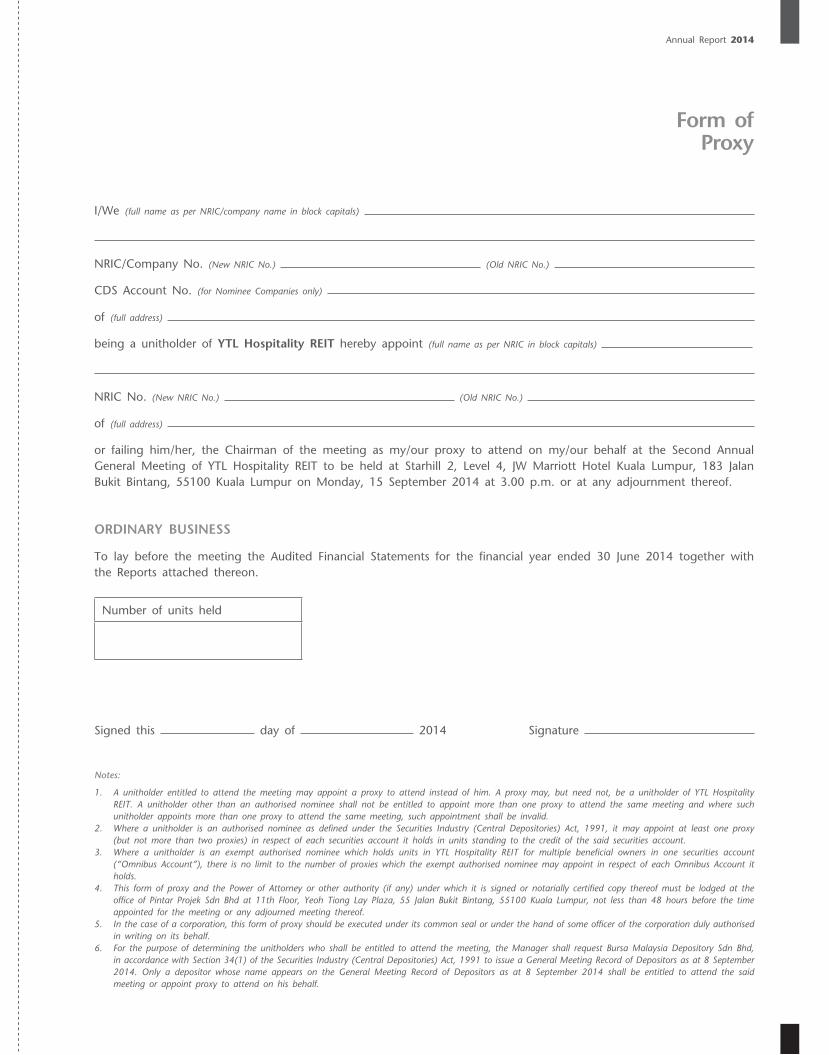
Annual Report 2014
Form of Proxy
I/We (full name as per NRIC/company name in block capitals)
NRIC/Company No. (New NRIC No.) (Old NRIC No.)
CDS Account No. (for Nominee Companies only)
of (full address)
being a unitholder of YTL Hospitality REIT hereby appoint (full name as per NRIC in block capitals)
NRIC No. (New NRIC No.) (Old NRIC No.)
of (full address)
or failing him/her, the Chairman of the meeting as my/our proxy to attend on my/our behalf at the Second Annual General Meeting of YTL Hospitality REIT to be held at Starhill 2, Level 4, JW Marriott Hotel Kuala Lumpur, 183 Jalan Bukit Bintang, 55100 Kuala Lumpur on Monday, 15 September 2014 at 3.00 p.m. or at any adjournment thereof.
ORDINARY BUSINESS
To lay before the meeting the Audited Financial Statements for the financial year ended 30 June 2014 together with the Reports attached thereon.
Number of units held
Signed this day of 2014 Signature
Notes:
1. A unitholder entitled to attend the meeting may appoint a proxy to attend instead of him. A proxy may, but need not, be a unitholder of YTL Hospitality REIT. A unitholder other than an authorised nominee shall not be entitled to appoint more than one proxy to attend the same meeting and where such unitholder appoints more than one proxy to attend the same meeting, such appointment shall be invalid.
2. Where a unitholder is an authorised nominee as defined under the Securities Industry (Central Depositories) Act, 1991, it may appoint at least one proxy (but not more than two proxies) in respect of each securities account it holds in units standing to the credit of the said securities account.
3. Where a unitholder is an exempt authorised nominee which holds units in YTL Hospitality REIT for multiple beneficial owners in one securities account (“Omnibus Account”), there is no limit to the number of proxies which the exempt authorised nominee may appoint in respect of each Omnibus Account it holds.
4. This form of proxy and the Power of Attorney or other authority (if any) under which it is signed or notarially certified copy thereof must be lodged at the office of Pintar Projek Sdn Bhd at 11th Floor, Yeoh Tiong Lay Plaza, 55 Jalan Bukit Bintang, 55100 Kuala Lumpur, not less than 48 hours before the time appointed for the meeting or any adjourned meeting thereof.
5. In the case of a corporation, this form of proxy should be executed under its common seal or under the hand of some officer of the corporation duly authorised in writing on its behalf.
6. For the purpose of determining the unitholders who shall be entitled to attend the meeting, the Manager shall request Bursa Malaysia Depository Sdn Bhd, in accordance with Section 34(1) of the Securities Industry (Central Depositories) Act, 1991 to issue a General Meeting Record of Depositors as at 8 September 2014. Only a depositor whose name appears on the General Meeting Record of Depositors as at 8 September 2014 shall be entitled to attend the said meeting or appoint proxy to attend on his behalf.
Fold this flap for sealing
Then fold here
First fold here
THE MANAGERPINTAR PROJEK SDN BHD11th Floor, Yeoh Tiong Lay Plaza55 Jalan Bukit Bintang55100 Kuala Lumpur
AFFIXSTAMP

YT
L HO
SPITA
LITY
REIT
ann
ual repo
rt 20
14
managed byPINTAR PROJEK SDN BHD 314009-W
11th FloorYeoh Tiong Lay Plaza55 Jalan Bukit Bintang55100 Kuala LumpurMalaysia
Tel • 603 2117 0088 603 2142 6633Fax • 603 2141 2703
www.ytlhospitalityreit.com
annual report 2014
the journey continues...