universiti putra malaysia shading responses of …psasir.upm.edu.my/5144/1/fs_2008_31.pdf ·...
TRANSCRIPT
UNIVERSITI PUTRA MALAYSIA
SHADING RESPONSES OF THE SEAGRASS HALOPHILA OVALIS (R. BR.) HOOK. F. FROM
TELUK KEMANG, NEGRI SEMBILAN, MALAYSIA
MOHAMMAD ROZAIMI B JAMALUDIN
FS 2008 31
SHADING RESPONSES OF THE SEAGRASS HALOPHILA OVALIS (R. BR.) HOOK. F. FROM
TELUK KEMANG, NEGRI SEMBILAN, MALAYSIA
MOHAMMAD ROZAIMI B JAMALUDIN
MASTER OF SCIENCE
UNIVERSITI PUTRA MALAYSIA
2008
ii
SHADING RESPONSES OF THE SEAGRASS HALOPHILA OVALIS (R. BR.) HOOK. F. FROM
TELUK KEMANG, NEGRI SEMBILAN, MALAYSIA
By
MOHAMMAD ROZAIMI B JAMALUDIN
Thesis Submitted to the School of Graduate Studies, Universiti Putra Malaysia, in Fulfilment of the Requirements for the Degree of Masters of
Science
June 2008
iii
Abstract of thesis presented to the Senate of Universiti Putra Malaysia in fulfilment of the requirements for the degree of Master of Science
SHADING RESPONSES OF THE SEAGRASS HALOPHILA OVALIS (R. BR.) HOOK. F. FROM
TELUK KEMANG, NEGRI SEMBILAN, MALAYSIA
By
MOHAMMAD ROZAIMI B JAMALUDIN
June 2008 Chairman: Japar Sidik Bujang, PhD Faculty: Science The seagrass Halophila ovalis from Teluk Kemang coast (2 ° 30'N, 101 °
45'E) in Port Dickson, Negeri Sembilan was studied to elucidate its
responses towards artificial shading. Responses were firstly based on
autotrophic productivity of H. ovalis through photosynthesis experiments to
determine the effects of prior acclimation to the condition of either in the field
(naturally growing) or in cultures (light reduced to 85-90% of ambient
conditions). Results showed that the light compensation values in field and
cultured leaves (8-13 µmol m-2 s-1) were similar while saturation point was in
the range of 268-275 µmol m-2 s-1 for field leaves and increased to 290-293
µmol m-2 s-1 for cultured leaves. A one-month long artificially imposed
shading was then performed to plants in the field (50%, 65%, 80% and 95%
shading relative to field light intensity) and in cultures (92% shading – Tank 1,
and 96% shading – Tank 2, relative to field light intensity) and compared to
unshaded plants as a control showed the following responses.
Photosynthetic rates of field H. ovalis at two tide levels as determined using
iv
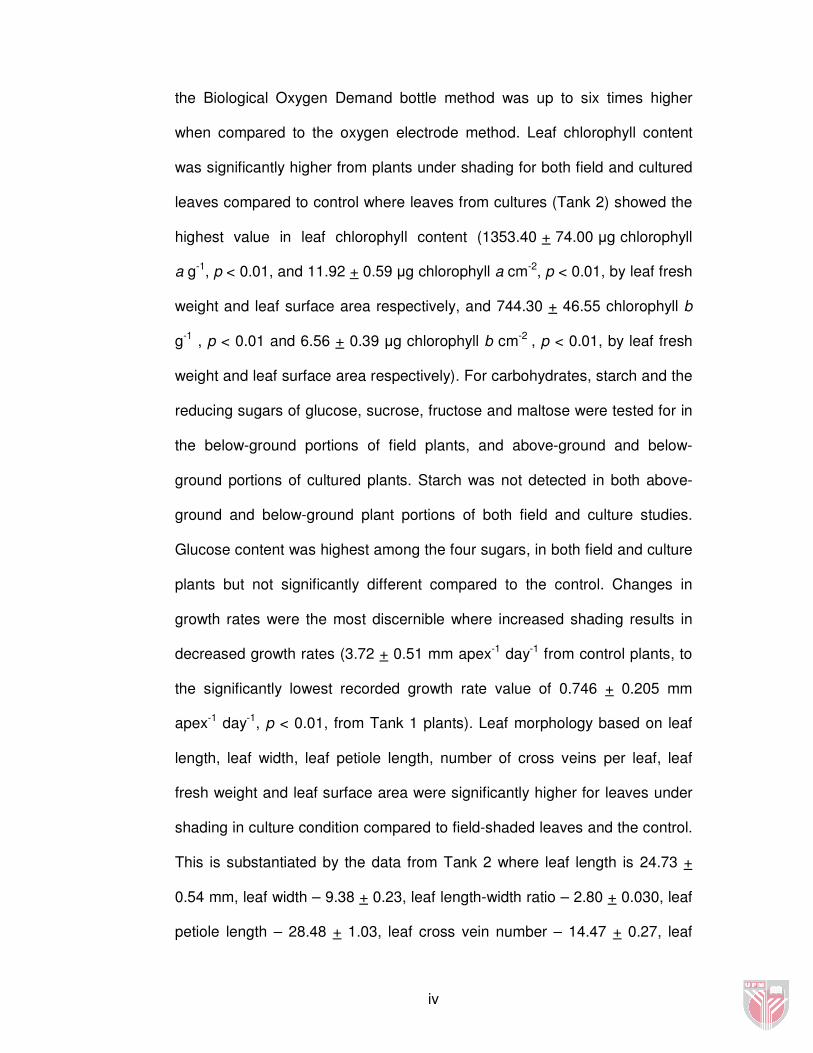
the Biological Oxygen Demand bottle method was up to six times higher
when compared to the oxygen electrode method. Leaf chlorophyll content
was significantly higher from plants under shading for both field and cultured
leaves compared to control where leaves from cultures (Tank 2) showed the
highest value in leaf chlorophyll content (1353.40 + 74.00 µg chlorophyll
a g-1, p < 0.01, and 11.92 + 0.59 µg chlorophyll a cm-2, p < 0.01, by leaf fresh
weight and leaf surface area respectively, and 744.30 + 46.55 chlorophyll b
g-1 , p < 0.01 and 6.56 + 0.39 µg chlorophyll b cm-2 , p < 0.01, by leaf fresh
weight and leaf surface area respectively). For carbohydrates, starch and the
reducing sugars of glucose, sucrose, fructose and maltose were tested for in
the below-ground portions of field plants, and above-ground and below-
ground portions of cultured plants. Starch was not detected in both above-
ground and below-ground plant portions of both field and culture studies.
Glucose content was highest among the four sugars, in both field and culture
plants but not significantly different compared to the control. Changes in
growth rates were the most discernible where increased shading results in
decreased growth rates (3.72 + 0.51 mm apex-1 day-1 from control plants, to
the significantly lowest recorded growth rate value of 0.746 + 0.205 mm
apex-1 day-1, p < 0.01, from Tank 1 plants). Leaf morphology based on leaf
length, leaf width, leaf petiole length, number of cross veins per leaf, leaf
fresh weight and leaf surface area were significantly higher for leaves under
shading in culture condition compared to field-shaded leaves and the control.
This is substantiated by the data from Tank 2 where leaf length is 24.73 +
0.54 mm, leaf width – 9.38 + 0.23, leaf length-width ratio – 2.80 + 0.030, leaf
petiole length – 28.48 + 1.03, leaf cross vein number – 14.47 + 0.27, leaf
v
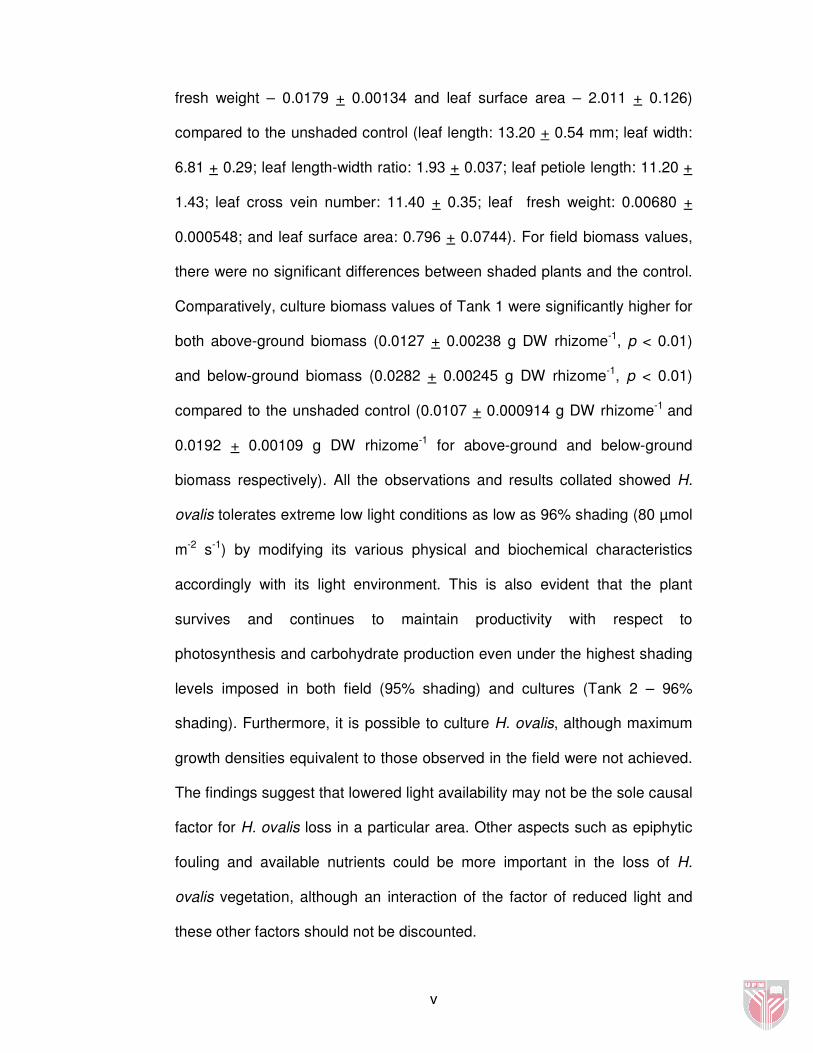
fresh weight – 0.0179 + 0.00134 and leaf surface area – 2.011 + 0.126)
compared to the unshaded control (leaf length: 13.20 + 0.54 mm; leaf width:
6.81 + 0.29; leaf length-width ratio: 1.93 + 0.037; leaf petiole length: 11.20 +
1.43; leaf cross vein number: 11.40 + 0.35; leaf fresh weight: 0.00680 +
0.000548; and leaf surface area: 0.796 + 0.0744). For field biomass values,
there were no significant differences between shaded plants and the control.
Comparatively, culture biomass values of Tank 1 were significantly higher for
both above-ground biomass (0.0127 + 0.00238 g DW rhizome-1, p < 0.01)
and below-ground biomass (0.0282 + 0.00245 g DW rhizome-1, p < 0.01)
compared to the unshaded control (0.0107 + 0.000914 g DW rhizome-1 and
0.0192 + 0.00109 g DW rhizome-1 for above-ground and below-ground
biomass respectively). All the observations and results collated showed H.
ovalis tolerates extreme low light conditions as low as 96% shading (80 µmol
m-2 s-1) by modifying its various physical and biochemical characteristics
accordingly with its light environment. This is also evident that the plant
survives and continues to maintain productivity with respect to
photosynthesis and carbohydrate production even under the highest shading
levels imposed in both field (95% shading) and cultures (Tank 2 – 96%
shading). Furthermore, it is possible to culture H. ovalis, although maximum
growth densities equivalent to those observed in the field were not achieved.
The findings suggest that lowered light availability may not be the sole causal
factor for H. ovalis loss in a particular area. Other aspects such as epiphytic
fouling and available nutrients could be more important in the loss of H.
ovalis vegetation, although an interaction of the factor of reduced light and
these other factors should not be discounted.
vi
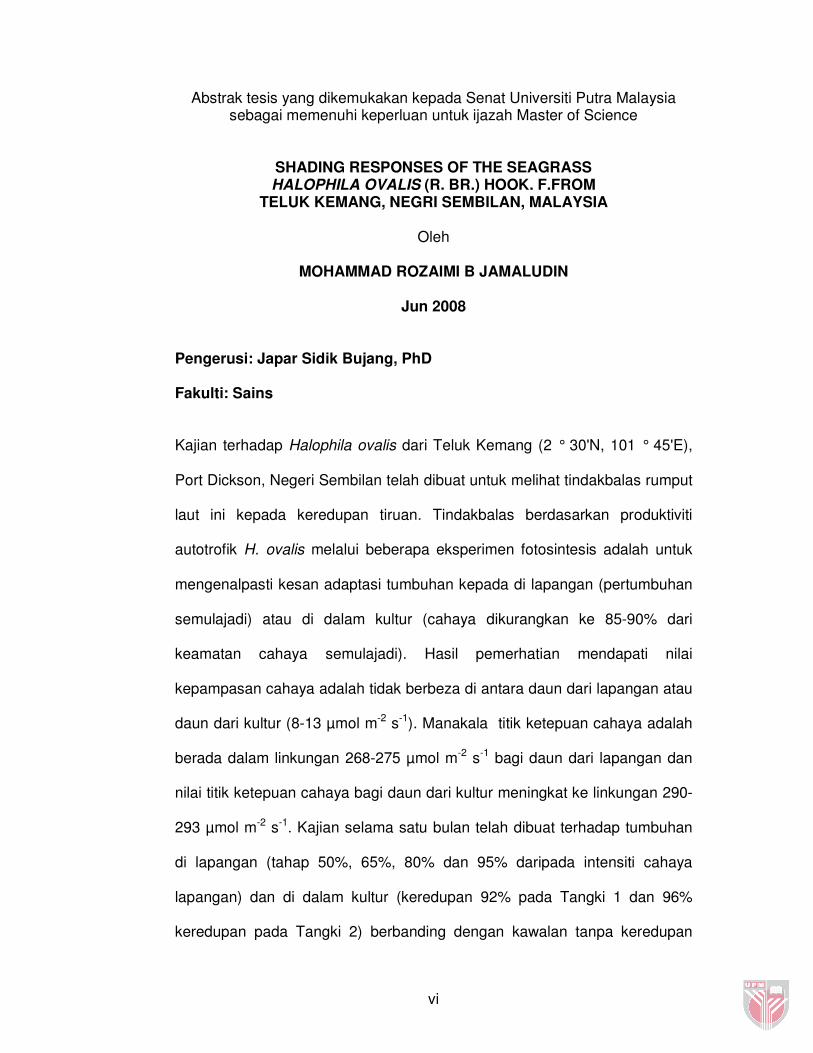
Abstrak tesis yang dikemukakan kepada Senat Universiti Putra Malaysia sebagai memenuhi keperluan untuk ijazah Master of Science
SHADING RESPONSES OF THE SEAGRASS HALOPHILA OVALIS (R. BR.) HOOK. F.FROM
TELUK KEMANG, NEGRI SEMBILAN, MALAYSIA
Oleh
MOHAMMAD ROZAIMI B JAMALUDIN
Jun 2008
Pengerusi: Japar Sidik Bujang, PhD Fakulti: Sains Kajian terhadap Halophila ovalis dari Teluk Kemang (2 ° 30'N, 101 ° 45'E),
Port Dickson, Negeri Sembilan telah dibuat untuk melihat tindakbalas rumput
laut ini kepada keredupan tiruan. Tindakbalas berdasarkan produktiviti
autotrofik H. ovalis melalui beberapa eksperimen fotosintesis adalah untuk
mengenalpasti kesan adaptasi tumbuhan kepada di lapangan (pertumbuhan
semulajadi) atau di dalam kultur (cahaya dikurangkan ke 85-90% dari
keamatan cahaya semulajadi). Hasil pemerhatian mendapati nilai
kepampasan cahaya adalah tidak berbeza di antara daun dari lapangan atau
daun dari kultur (8-13 µmol m-2 s-1). Manakala titik ketepuan cahaya adalah
berada dalam linkungan 268-275 µmol m-2 s-1 bagi daun dari lapangan dan
nilai titik ketepuan cahaya bagi daun dari kultur meningkat ke linkungan 290-
293 µmol m-2 s-1. Kajian selama satu bulan telah dibuat terhadap tumbuhan
di lapangan (tahap 50%, 65%, 80% dan 95% daripada intensiti cahaya
lapangan) dan di dalam kultur (keredupan 92% pada Tangki 1 dan 96%
keredupan pada Tangki 2) berbanding dengan kawalan tanpa keredupan
vii
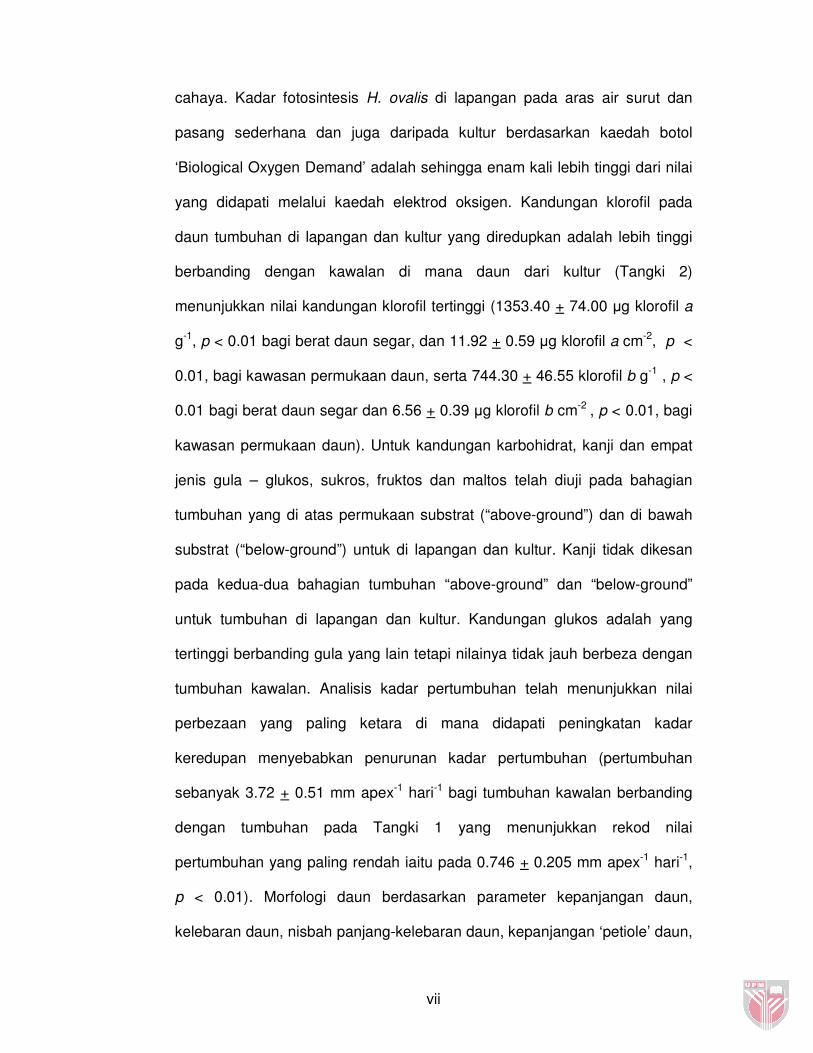
cahaya. Kadar fotosintesis H. ovalis di lapangan pada aras air surut dan
pasang sederhana dan juga daripada kultur berdasarkan kaedah botol
‘Biological Oxygen Demand’ adalah sehingga enam kali lebih tinggi dari nilai
yang didapati melalui kaedah elektrod oksigen. Kandungan klorofil pada
daun tumbuhan di lapangan dan kultur yang diredupkan adalah lebih tinggi
berbanding dengan kawalan di mana daun dari kultur (Tangki 2)
menunjukkan nilai kandungan klorofil tertinggi (1353.40 + 74.00 µg klorofil a
g-1, p < 0.01 bagi berat daun segar, dan 11.92 + 0.59 µg klorofil a cm-2, p <
0.01, bagi kawasan permukaan daun, serta 744.30 + 46.55 klorofil b g-1 , p <
0.01 bagi berat daun segar dan 6.56 + 0.39 µg klorofil b cm-2 , p < 0.01, bagi
kawasan permukaan daun). Untuk kandungan karbohidrat, kanji dan empat
jenis gula – glukos, sukros, fruktos dan maltos telah diuji pada bahagian
tumbuhan yang di atas permukaan substrat (“above-ground”) dan di bawah
substrat (“below-ground”) untuk di lapangan dan kultur. Kanji tidak dikesan
pada kedua-dua bahagian tumbuhan “above-ground” dan “below-ground”
untuk tumbuhan di lapangan dan kultur. Kandungan glukos adalah yang
tertinggi berbanding gula yang lain tetapi nilainya tidak jauh berbeza dengan
tumbuhan kawalan. Analisis kadar pertumbuhan telah menunjukkan nilai
perbezaan yang paling ketara di mana didapati peningkatan kadar
keredupan menyebabkan penurunan kadar pertumbuhan (pertumbuhan
sebanyak 3.72 + 0.51 mm apex-1 hari-1 bagi tumbuhan kawalan berbanding
dengan tumbuhan pada Tangki 1 yang menunjukkan rekod nilai
pertumbuhan yang paling rendah iaitu pada 0.746 + 0.205 mm apex-1 hari-1,
p < 0.01). Morfologi daun berdasarkan parameter kepanjangan daun,
kelebaran daun, nisbah panjang-kelebaran daun, kepanjangan ‘petiole’ daun,
viii
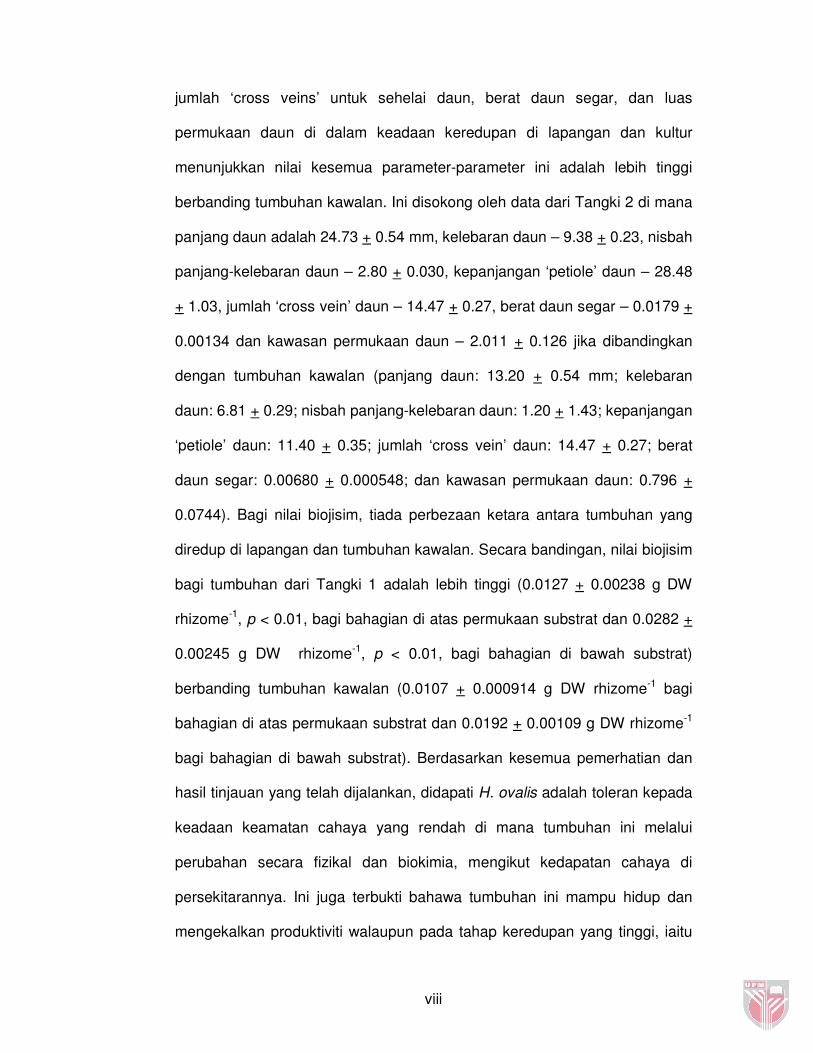
jumlah ‘cross veins’ untuk sehelai daun, berat daun segar, dan luas
permukaan daun di dalam keadaan keredupan di lapangan dan kultur
menunjukkan nilai kesemua parameter-parameter ini adalah lebih tinggi
berbanding tumbuhan kawalan. Ini disokong oleh data dari Tangki 2 di mana
panjang daun adalah 24.73 + 0.54 mm, kelebaran daun – 9.38 + 0.23, nisbah
panjang-kelebaran daun – 2.80 + 0.030, kepanjangan ‘petiole’ daun – 28.48
+ 1.03, jumlah ‘cross vein’ daun – 14.47 + 0.27, berat daun segar – 0.0179 +
0.00134 dan kawasan permukaan daun – 2.011 + 0.126 jika dibandingkan
dengan tumbuhan kawalan (panjang daun: 13.20 + 0.54 mm; kelebaran
daun: 6.81 + 0.29; nisbah panjang-kelebaran daun: 1.20 + 1.43; kepanjangan
‘petiole’ daun: 11.40 + 0.35; jumlah ‘cross vein’ daun: 14.47 + 0.27; berat
daun segar: 0.00680 + 0.000548; dan kawasan permukaan daun: 0.796 +
0.0744). Bagi nilai biojisim, tiada perbezaan ketara antara tumbuhan yang
diredup di lapangan dan tumbuhan kawalan. Secara bandingan, nilai biojisim
bagi tumbuhan dari Tangki 1 adalah lebih tinggi (0.0127 + 0.00238 g DW
rhizome-1, p < 0.01, bagi bahagian di atas permukaan substrat dan 0.0282 +
0.00245 g DW rhizome-1, p < 0.01, bagi bahagian di bawah substrat)
berbanding tumbuhan kawalan (0.0107 + 0.000914 g DW rhizome-1 bagi
bahagian di atas permukaan substrat dan 0.0192 + 0.00109 g DW rhizome-1
bagi bahagian di bawah substrat). Berdasarkan kesemua pemerhatian dan
hasil tinjauan yang telah dijalankan, didapati H. ovalis adalah toleran kepada
keadaan keamatan cahaya yang rendah di mana tumbuhan ini melalui
perubahan secara fizikal dan biokimia, mengikut kedapatan cahaya di
persekitarannya. Ini juga terbukti bahawa tumbuhan ini mampu hidup dan
mengekalkan produktiviti walaupun pada tahap keredupan yang tinggi, iaitu
ix
sebanyak 95% keredupan di lapangan dan sebanyak 96% keredupan di
dalam kultur (Tangki 2). Adalah tidak mustahil untuk mengkulturkan H. ovalis,
walaupun kadar maksimum bagi kepadatan pertumbuhan seperti tumbuhan
di lapangan tidak tercapai. Hasil kajian ini memperlihatkan bahawa
kerendahan terdapatan cahawa bukan hanya faktor yang menyebabkan
kehilangan H. ovalis di sesuatu kawasan. Aspek-aspek lain seperti “epiphytic
fouling” dan kedapatan nutrien berinteraksi dengan faktor kurangnya
terdapatan cahaya perlu diambil kira juga.
x
ACKNOWLEDGEMENTS It is with the utmost and foremost humility that I owe my thanks to the One Great God, Allah Almighty, for the success of this thesis and study. I am in gratitude to my mentor and teacher, Dr Japar Sidik Bujang for accepting me as his student, for guiding me throughout my tenure as a post-graduate candidate, and for being patient with me in my haste to graduate. My gratitude goes towards my co-supervisors, Dr Misri Kusnan and Dr Hishammudin Omar as well, for their guidance in my study. I would also like to thank my parents, Jamaludin and Jumiah, my wife, Raja Yana, my brothers, Mohammad Roslan and Mohammad Rozmand, for their continued inspiration, support and belief in me to succeed in this endeavour. Also not forgetting are friends like Mahathir and Efrizal who ever so often had been there for me in so many ways in this journey. Many thanks are also due to lab-mates and the staff of Universiti Putra Malaysia Research Station for helping me in the whole study. Lastly, I would also like to thank anyone else not mentioned here who have helped complete this study in one way or another. This research is made possible through the grant funded by the Ministry of Science, Technology and Environment Malaysia, under the ‘Intensification of Research in Priority Areas’ programme entitled “Seagrass taxonomy, biology and habitat characteristics: EA-001-09-02-04-0679”. Some financial and travel supports from Japan Society for the Promotion of Science (JSPS) are also acknowledged.
xi
I certify than an Examination committee has met on the 12th of June, 2008 to conduct the final examination of Mohammad Rozaimi b Jamaludin on his Master of Science thesis entitled “Shading responses of the seagrass Halophila ovalis (R. Br.) Hook. f. from Port Dickson, Negri Sembilan, Malaysia" in accordance with Universiti Pertanian Malaysia (Higher Degree) Act 1980 and the Universiti Pertanian Malaysia (Higher Degree) Regulations1981. The Committee recommends that the student be awarded the Master of Science. Members of the Examination Committee were as follows: Aziz Arshad, PhD Associate Professor Faculty of Agriculture Universiti Putra Malaysia (Chairman) Umi Kalsom Yusuf, PhD Professor Faculty of Science Universiti Putra Malaysia (Internal Examiner) Abdul Rahim Ismail, PhD Faculty of Science Universiti Putra Malaysia (Internal Examiner) Phang Siew Moi, PhD Professor Faculty of Science University of Malaya Malaysia (External Examiner)
____________________________ HASANAH MOHD. GHAZALI, PhD Pofessor and Deputy Dean School of Graduate Studies Universiti Putra Malaysia
Date:
xii
This thesis was submitted to the Senate of Universiti Putra Malaysia and has been accepted as fulfilment of the requirement for the degree of Master of Science. The members of the Supervisory committee were as follows: Japar Sidik Bujang, PhD Associate Professor Faculty of Science Universiti Putra Malaysia (Chairman) Misri Kusnan, PhD Faculty of Science Universiti Putra Malaysia (Member) Hishamuddin Omar, PhD Faculty of Science Universiti Putra Malaysia (Chairman)
____________________________ AINI IDERIS, PhD Pofessor and Dean School of Graduate Studies Universiti Putra Malaysia
Date: 14 August 2008
xiii
DECLARATION I declare that the thesis is my original work except for quotations and citations which have been duly acknowledged. I also declare that it has not been previously, and is not concurrently, submitted for any other degree at Universiti Putra Malaysia or at any other institution.
_______________________________
MOHAMMAD ROZAIMI B JAMALUDIN
Date: 8th July 2008
xiv
TABLE OF CONTENTS ABSTRACT ABSTRAK ACKNOWLEDGEMENTS APPROVAL DECLARATION LIST OF TABLES LIST OF FIGURES LIST OF ABBREVIATIONS CHAPTER
1 GENERAL INTRODUCTION
2 LITERATURE REVIEW Seagrasses and their distributions
Seagrasses from Malaysia Importance of seagrasses and the threats to its
existence Light attenuation in the sea and its effects on
seagrasses Physiological responses to light reduction by
shading Halophila ovalis
3 PHOTOSYNTHETIC LIGHT RESPONSES OF
NATURALLY GROWING AND CULTURED HALOPHILA OVALIS
Abstract Introduction
Materials and methods Plant material
Experimental mechanism Leaf parameters
Graphical analyses Statistical analyses Results Discussions
4 IN SITU RESPONSES OF HALOPHILA OVALIS
TOWARDS SHADING Abstract Introduction Materials and Methods
Study site Shading apparatus
Analyses of plant material Photosynthetic rates Chlorophyll content Carbohydrate content
Plant growth rates
Page iii vi x xi xiii xvii xx xxiv 1 5 5 7 10 19 28 33 38 38 39 42 42 43 44 45 46 46 50 57 57 59 63 63 65 67 68 69 69 70
xv
Leaf morphological measurements
Plant biomass Statistical analyses
Results Photosynthetic rates
Mean photosynthetic rates based on leaf fresh weight Mean photosynthetic rates based on leaf surface area Mean photosynthetic rates based on leaf chlorophyll content
Chlorophyll content Mean chlorophyll a content
Mean chlorophyll b content Mean ratio of chlorophyll a to
chlorophyll b Carbohydrate content Mean glucose content Mean sucrose content Mean fructose content Mean maltose content Plant growth rates Leaf morphological measurements Mean leaf length Mean leaf width Mean leaf length to width ratio
Mean leaf petiole length Mean number of leaf cross-veins Mean leaf fresh weight
Mean leaf surface area Plant biomass Above-ground biomass Below-ground biomass
Above-ground to below-ground biomass ratio
Discussions
5 RESPONSES OF HALOPHILA OVALIS TOWARDS SHADING IN CULTURES Abstract
Introduction Materials and Methods
Plant source Plant material and shading setup
Analyses of plant material Leaf chlorophyll content and leaf morphology Above-ground versus below ground biomass and ratios Carbohydrate content
Statistical analyses
70 71 71 72 72 73 76 77 79 81 82 84 84 87 87 88 88 89 89 91 91 93 93 95 95 97 97 99 99 101 101 120 120 122 126 136 127 132 132 133 133 135
xvi
Results Photosynthesis rates Mean photosynthetic rates based
on leaf fresh weight Mean photosynthetic rates based
on leaf surface area Mean photosynthetic rates based
on leaf chlorophyll content Chlorophyll content Mean chlorophyll a content Mean chlorophyll b content
Mean ratio of chlorophyll a to chlorophyll b
Carbohydrate content Mean glucose content Mean sucrose content Mean fructose content Mean maltose content Plant growth rates Leaf morphological measurements Mean leaf length Mean leaf width Mean leaf length to width ratio
Mean leaf petiole length Mean number of leaf cross-veins Mean leaf fresh weight
Mean leaf surface area Above-ground and below ground plant biomass
Mean above-ground and below-ground biomass
Mean ratio of above-ground to below-ground biomass
Discussions
6 GENERAL DISCUSSIONS Basics of seagrass shading Study descriptions Various responses of H. ovalis to shading
7 CONCLUSION
REFERENCES APPENDIX 1 – EXPERIMENTAL METHODS APPENDIX 2 – DATA VALUES APPENDIX 3 – REGRESSION ANALYSIS OF FIELD EXPERIMENT EXPERIMENTS BIODATA OF THE AUTHOR LIST OF PUBLICATIONS PRODUCED
135 136 136 138 138 140 140 144 146 148 150 150 151 152 152 153 153 155 157 157 159 160 162 163 163 165 167 180 180 181 194 216 218 237 244 272 282 283
xvii
LIST OF TABLES No.
Table Page
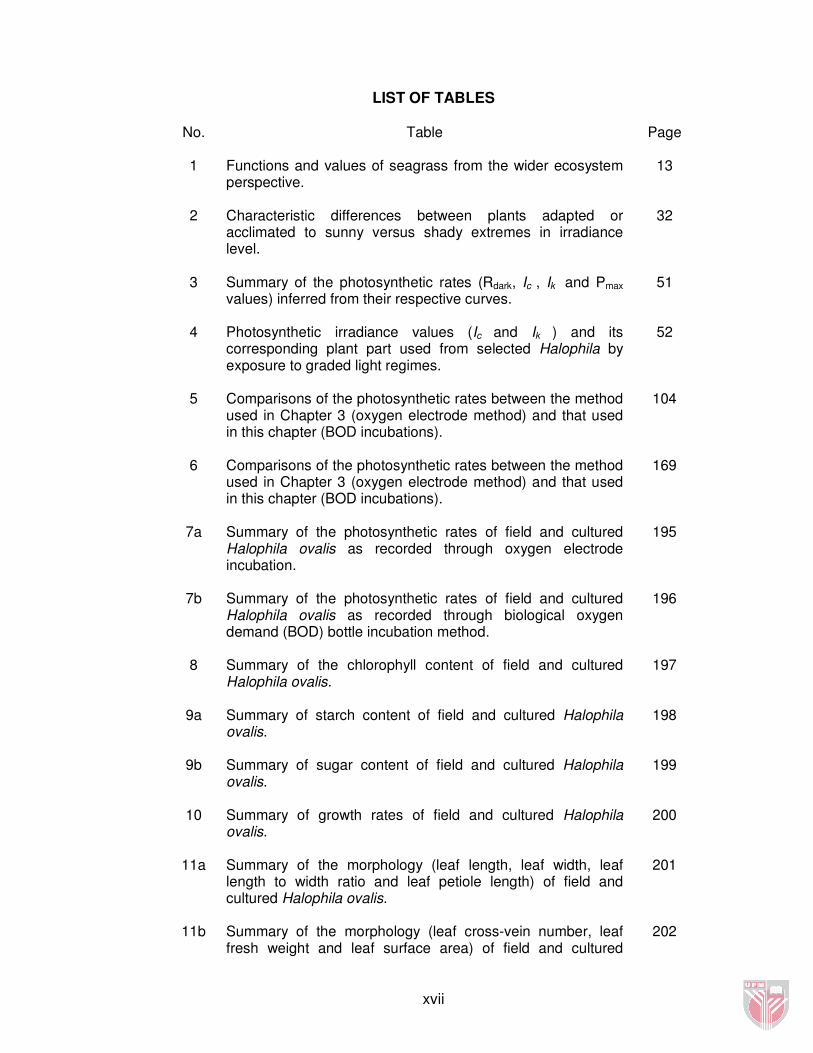
1 Functions and values of seagrass from the wider ecosystem perspective.
13
2 Characteristic differences between plants adapted or acclimated to sunny versus shady extremes in irradiance level.
32
3 Summary of the photosynthetic rates (Rdark, Ic , Ik and Pmax values) inferred from their respective curves.
51
4 Photosynthetic irradiance values (Ic and Ik ) and its corresponding plant part used from selected Halophila by exposure to graded light regimes.
52
5 Comparisons of the photosynthetic rates between the method used in Chapter 3 (oxygen electrode method) and that used in this chapter (BOD incubations).
104
6 Comparisons of the photosynthetic rates between the method used in Chapter 3 (oxygen electrode method) and that used in this chapter (BOD incubations).
169
7a Summary of the photosynthetic rates of field and cultured Halophila ovalis as recorded through oxygen electrode incubation.
195
7b Summary of the photosynthetic rates of field and cultured Halophila ovalis as recorded through biological oxygen demand (BOD) bottle incubation method.
196
8 Summary of the chlorophyll content of field and cultured Halophila ovalis.
197
9a Summary of starch content of field and cultured Halophila ovalis.
198
9b Summary of sugar content of field and cultured Halophila ovalis.
199
10 Summary of growth rates of field and cultured Halophila ovalis.
200
11a Summary of the morphology (leaf length, leaf width, leaf length to width ratio and leaf petiole length) of field and cultured Halophila ovalis.
11b Summary of the morphology (leaf cross-vein number, leaf fresh weight and leaf surface area) of field and cultured
201
202
xviii
Halophila ovalis.
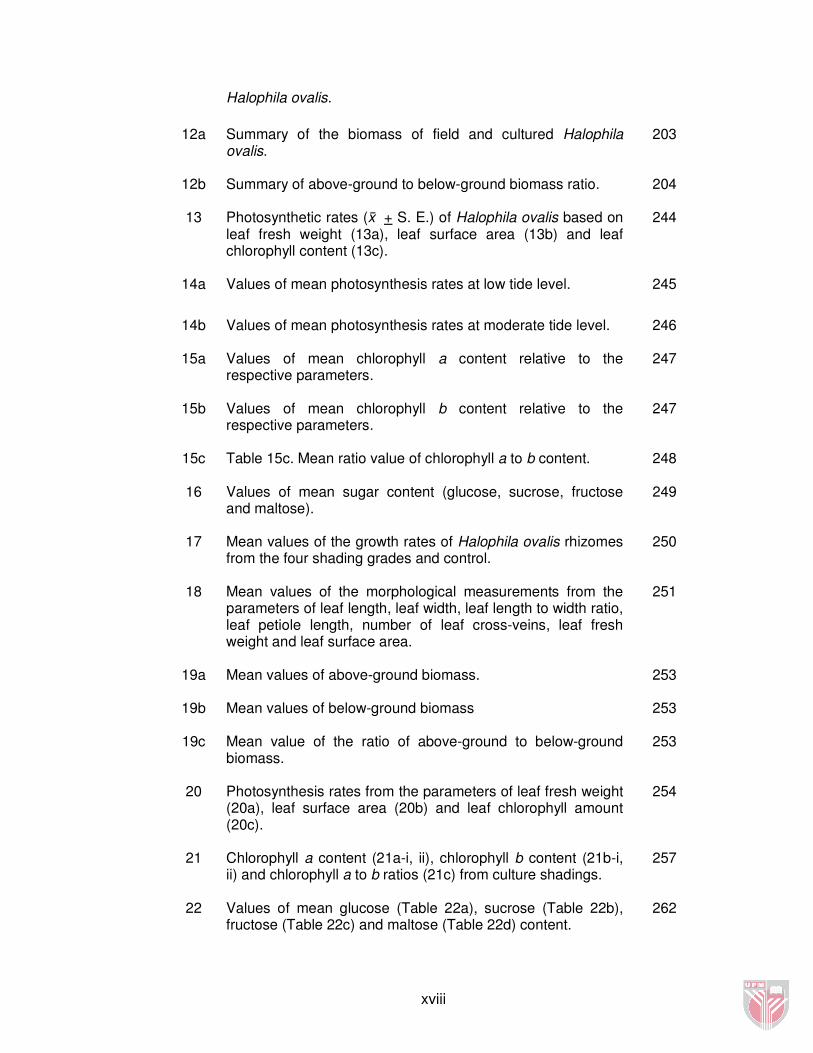
12a Summary of the biomass of field and cultured Halophila ovalis.
203
12b Summary of above-ground to below-ground biomass ratio.
204
13 Photosynthetic rates (x + S. E.) of Halophila ovalis based on leaf fresh weight (13a), leaf surface area (13b) and leaf chlorophyll content (13c).
244
14a Values of mean photosynthesis rates at low tide level.
245
14b Values of mean photosynthesis rates at moderate tide level.
246
15a Values of mean chlorophyll a content relative to the respective parameters.
247
15b Values of mean chlorophyll b content relative to the respective parameters.
247
15c Table 15c. Mean ratio value of chlorophyll a to b content.
248
16 Values of mean sugar content (glucose, sucrose, fructose and maltose).
249
17 Mean values of the growth rates of Halophila ovalis rhizomes from the four shading grades and control.
250
18 Mean values of the morphological measurements from the parameters of leaf length, leaf width, leaf length to width ratio, leaf petiole length, number of leaf cross-veins, leaf fresh weight and leaf surface area.
251
19a Mean values of above-ground biomass.
253
19b Mean values of below-ground biomass
253
19c Mean value of the ratio of above-ground to below-ground biomass.
253
20 Photosynthesis rates from the parameters of leaf fresh weight (20a), leaf surface area (20b) and leaf chlorophyll amount (20c).
254
21 Chlorophyll a content (21a-i, ii), chlorophyll b content (21b-i, ii) and chlorophyll a to b ratios (21c) from culture shadings.
257
22 Values of mean glucose (Table 22a), sucrose (Table 22b), fructose (Table 22c) and maltose (Table 22d) content.
262
xix
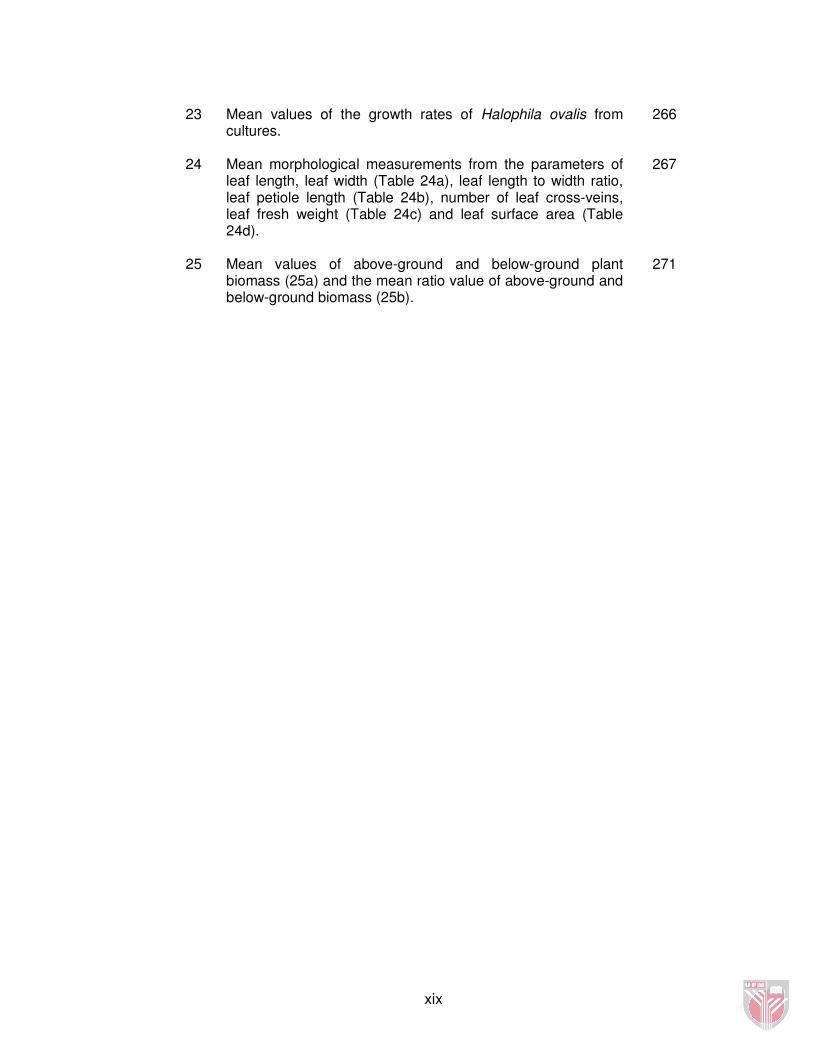
23
Mean values of the growth rates of Halophila ovalis from cultures.
266
24 Mean morphological measurements from the parameters of leaf length, leaf width (Table 24a), leaf length to width ratio, leaf petiole length (Table 24b), number of leaf cross-veins, leaf fresh weight (Table 24c) and leaf surface area (Table 24d).
267
25 Mean values of above-ground and below-ground plant biomass (25a) and the mean ratio value of above-ground and below-ground biomass (25b).
271
xx
LIST OF FIGURES
No.
Figure Page
1 The major and important seagrass areas, associated habitats, utilization by coastal communities and other users in Peninsular Malaysia (A) and East Malaysia – Sabah (A) and Sarawak (C).
11
2 Depth limits compiled for 31 marine angiosperm species.
22
3 Halophila ovalis population in Teluk Kemang.
23
4 Ulva sp. canopy upon Halophila ovalis at Tanjung Chek Jawa, Singapore.
25
5 Halophila ovalis from Teluk Kemang covered with epiphytes.
25
6 Theoretical progression of a photosynthesis-irradiance (P-I) curve.
29
7 Comparisons of photosynthetic parameters of some studied seagrasses.
31
8 Botanical classification of Halophila ovalis.
35
9 Key to the species from section Halophila.
35
10 World geographical distribution of Halophila ovalis.
36
11a Photosynthetic rates (x + S. E.) based on leaf fresh weight by the oxygen electrode method.
47
11b Photosynthetic rates (x + S. E.) based on leaf surface area by the oxygen electrode method.
47
11c Photosynthetic rates (x + S. E.) based on leaf chlorophyll content by the oxygen electrode method
48
12 Location of the study site at Teluk Kemang (2 ° 30 ' N, 101 ° 45 ' E).
64
13 Shading frames staked upon the seabed in Teluk Kemang.
66
14 Some of the shading frames used for the field shading experiments at Teluk Kemang.
66
15a Photosynthetic rate (x + S. E.) of leaves from field by leaf fresh weight (FW).
75
15b Photosynthetic rate (x + S. E.) of leaves from field by leaf surface area (Area).
78
xxi
15c Photosynthetic rate (x + S. E.) of leaves from field by leaf chlorophyll content (Chl).
80
16a Mean of chlorophylls a and b (x + S. E.) of leaves from field samples by leaf fresh weight (FW).
83
16b Mean of chlorophylls a and b (x + S. E.) of leaves from field samples by leaf surface area (Area).
83
16c Mean of ratio (x + S. E.) of chlorophyll a to b of leaves from field samples.
85
17 Mean content of reducing sugars (x + S. E.) in below-ground plant portions per gram of dried field samples.
86
18 Mean values of the growth rate (x + S. E.) of Halophila ovalis rhizomes from the four shading grades and control.
90
19a Mean length of leaves (x + S. E.) from field samples.
91
19b Mean width of leaves (x + S. E.) from field samples.
91
19c Mean ratio (x + S. E.) of leaf length to width of field samples.
94
19d Mean petiole length of leaves (x + S. E.) from field samples.
94
19e Mean number of cross-veins (x + S. E.) of leaves from field samples.
96
19f Mean fresh weight of leaves (x + S. E.) from field samples.
96
19g Mean surface area of leaves (x + S. E.) from field samples.
98
20a Above-ground and below ground biomass (x + S. E.) of field samples
100
20b Mean of ratio (x + S. E.) of above-ground biomass to below ground biomass of field samples
100
21a Theoretical diagram on the energy level flow during photosynthesis.
108
21b Components of the antenna proteins involved in photosynthesis.
108
22a Evidence of grazing on H. ovalis leaves by Clithon sp. (arrow).
129
22b Clithon sp. that grazes on H. ovalis leaves.
129
23a Sprorbid polychaete fouling on H. ovalis leaves.
130
xxii
23b The spirorbid polychaetes attached to H. ovalis leaf as observed under a light microscope.
130
24 Tank placements layout of the culture shading study.
131
25 Node positions of the leaves taken for analysis.
134
26a Photosynthetic rate (x + S. E.) of field leaves by leaf fresh weight.
137
26b Photosynthetic rate (x + S. E.) of field leaves by leaf surface area.
139
26c Photosynthetic rate (x + S. E.) of field leaves by leaf chlorophyll content.
141
27a Mean content of chlorophylls a and b (x + S. E.) from culture samples by leaf fresh weight.
143
27b Mean content of chlorophylls a and b (x + S. E.) from culture samples by leaf surface area.
143
27c Mean of ratio of chlorophyll a to b (x + S. E.) of leaves from culture.
147
28 Mean content of reducing sugars (x + S. E.) in above and below-ground plant portions per gram of dried leaf cultures.
149
29 Mean growth rate (x + S. E.) of Halophila ovalis from cultures
154
30a Mean length of leaves (x + S. E.) from cultures.
156
30b Mean width of leaves (x + S. E.) from cultures. 156
30c Mean ratio of leaf length to width (x + S. E.) from cultures. 158
30d Mean petiole length of leaves (x + S. E.) from cultures. 158
30e Mean number of cross-veins of leaves (x + S. E.) from cultures.
161
30f Mean fresh weight of leaves (x + S. E.) from cultures.
161
30g Mean surface area of leaves (x + S. E.) from cultures.
164
31a Mean values of above-ground and below-ground plant biomass (x + S. E.) from cultures.
166
31b Mean ratio (x + S. E.) of above-ground and below-ground plant biomass from cultures.
166
xxiii
32 Basic hypothetical relationships of the parameters under investigations done in Chapters 4 and 5.
184
33 Sucrose and starch biosynthesis and catabolism in plant cells.
189
34 Illustration of the experimental setup used for the photosynthesis analysis by the oxygen electrode method.
238
35 An example of a single sprig of Halophila ovalis used for analyses.
242
36 Curve-fit regression analysis of values obtained in Chapter 4 from field experiments of photosynthesis by leaf fresh weight at low water level (Figure 36a); photosynthesis by leaf surface area at low water level (Figure 36b); and photosynthesis by leaf chlorophyll content at low water level (Figure 36c).
272
37 Curve-fit regression analysis of values obtained in Chapter 4 from field experiments of photosynthesis by leaf fresh weight at moderate water level (Figure 37a); photosynthesis by leaf surface area at moderate water level (Figure 36b); and photosynthesis by leaf chlorophyll content at moderate water level (Figure 37c).
273
38 Curve-fit regression analysis of values obtained in Chapter 4 from field experiments of chlorophyll a content by leaf fresh weight (Figure 38a-i); field experiments of chlorophyll b content by leaf fresh weight (Figure 38a-ii); chlorophyll a content by leaf surface area (Figure 38b-i); field experiments of chlorophyll b content by leaf surface area (Figure 38b-ii); and chlorophyll a to b ratio (Figure 38c).
274
39 Curve-fit regression analysis of values obtained in Chapter 4 from field experiments of glucose content (Figure 39a); sucrose content (Figure 39b); fructose content (Figure 39c) and maltose content (Figure 39d).
276
40 Curve-fit regression analysis of values obtained in Chapter 4 from field experiments of leaf length (Figure 40a); leaf width (Figure 40b); leaf length to width ratio (Figure 40c); leaf petiole length (Figure 40d); leaf cross-vein number (Figure 40e); leaf fresh weight (Figure 40f) and leaf surface area (Figure 40g).
278
41 Curve-fit regression analysis of values obtained in Chapter 4 from field experiments of above-ground biomass (Figure 41a); below-ground biomass (Figure 41b) and above-ground to below ground biomass ratio (Figure 41c).
281
xxiv
LIST OF ABBREVIATIONS α Photosynthetic efficiency AG Above-ground Area Leaf Surface Area BG Below-ground BOD Biological Oxygen Demand Chl Chlorophyll DW Leaf Dry Weight FW Leaf Fresh Weight HPLC High Performance Liquid Chromatography Ic Light compensation point Ik Light saturation point IUCN The World Conservation Union KEGG Kyoto Encyclopedia of Genes and Genomes LHC Light-Harvesting Complex LHC II Light Harvesting Complex II NCSS Number Cruncher Statistical System PAR Photosynthetically Active Radiation P-I Photosynthesis-Irradiance Pmax Maximal photosynthetic capacity PS I Photosystem complex I PS II Photosystem complex II Rdark Dark respiration