the day of week effect on financial companies … day of week effect on financial companies...
TRANSCRIPT
THE DAY OF WEEK EFFECT ON FINANCIAL COMPANIES AMONG FINANCIAL SECTOR IN KUALA LUMPUR
COMPOSITE INDEX (KLCI)
Chin Pea Lee
Bachelor of Finance (Honours) 2012
Pusat Khidmat Maklumat Akademik UNlVERSm MALAYSIA SARAWAK
P.KHIDMAT MAKL.UMAT AKADEMIK
111111111 IIi'ITI 11I111111 1000245038
THE DAY OF WEEK EFFECT ON FINANCIAL COMPANIES AMONG FINANCIAL SECTOR IN KUALA LUMPUR COMPOSITE INDEX (KLCI)
CHIN PEA LEE
This project is submitted in partial fulfillment of the requirements for the degree of Bachelor of Finance with Honours
tI Faculty of Economics and Business UNIVERSITI MALAYSIA SARAWAK
2012
I
I
DECLARATION
This work described in this Final Year Project, entitled
"The Day of Week Effects on Financial Companies among Financial Sector in Kuala
Lumpur Composite Index (KLCI) "
is to the best of the author's knowledge that of the author expect
where due reference is made.
Date Submitted (CHIN PEA LEE)
23304
ABSTRACT
The Day of Week Effects on Financial Companies among Financial Sector in Kuala
Lumpur Composite Index (KLCI)
By
Chin Pea Lee
The global financial crisis currently is a latest crisis in the field of financial market.
The preliminary evidence indicates that Efficient Market Hypothesis (EMH) might have been
misplaced due to various anomalies. In Malaysian stock market, the existence of DOW effect
is relatively less consistent and relatively little research conducted on market anomalies
especially those concerning the DOW effect. The day-of-the-week (DOW) effects in the eight
financial companies of Kuala Lumpur Composite Index CKLCI) using stock return data of
individual financial companies conducted in the study. The study covering period from 2004
to 2011 and discovers the financial companies are highly efficient according the DOW effect.
The study discovers the lowest mean returns of overall during entire period of global
financial crisis oQ. Monday for five fmancial companies out of eight financial companies.
There is impact of global financial crisis on the studied sample.
ABSTRAK
Kesan Hari dalam Minggu pada Syarikat Kewangan di kalangan Sektor Kewangan dalam
Indeks Komposit Kuala Lumpur (KLCI)
Oleh
Chin Pea Lee
Krisis kewangan global pada masa ini adalah krisis terkini dalam bidang pasaran
kewangan. Bukti awal menunjukkan bahawa Hipotesis Pasaran Cekap (HPC) mungkin telah
kena pad a tempatnya kerana anomali pelbagai. Dalam pasaran saham Malaysia, kewujudan
kesan Kesan hari dalam minggu (DOW) penyelidikan agak kurang konsisten dan agak sedikit
yang dijalankan ke atas anomali pasaran terutama yang berkaitan dengan kesan DOW. Kesan
DOW dalam tempoh lapan syarikat kewangan Indeks Komposit Kuala Lumpur (KLCI)
menggunakan data pulangan saham syarikat-syarikat kewangan individu. Kajian yang
meliputi tempoh dari 2004 hingga 2011 dan mencari syarikat-syarikat kewangan sangat
berkesan mengikut kesan DOW. Kajian mendapati pulangan terendah min keseluruhan tI
semasa tempoh seluruh krisis kewangan global 'pada hari Isnin selama lima syarikat
kewangan daripada lapan syarikat kewangan. Terdapat kesan krisis kewangan global ke atas
sampel yang dikaji.

ACKNOWLEDGEMENT
First of all, I am grateful thanksgiving to Lord that guiding me to blessing me and guiding me
to complete this research successfully. Indeed, without His help and will, the research is not
accomplished.
Furthermore, I am sincere gratitude to my supervisor, Dr. Puah Chin Hong. This research is
the result of his guidance, advice, wise and knowledge insight as well as his endless line of
support throughout the period of this study. His willingness to supervise apart from his busy
schedule is appreciated very much.
Moreover, I would like to thank my family for their everlasting love, encouragement and
endless supports. I am appreciate the su~port from my friends who were shared their life
experienc.e and scarification of their time to support me in completing this research paper.
Lastly, I would like to grab this chance to extend my gratitude to all my lectures and staff in
Universiti Malaysia Sarawak, who have supported and shared their ideas during my study in
this university. Without their encouragements, I would not be able to complete.
"
Pusat Khidmat Maklumat Akademik UNlVERSm MALAYSIA SARAWAK
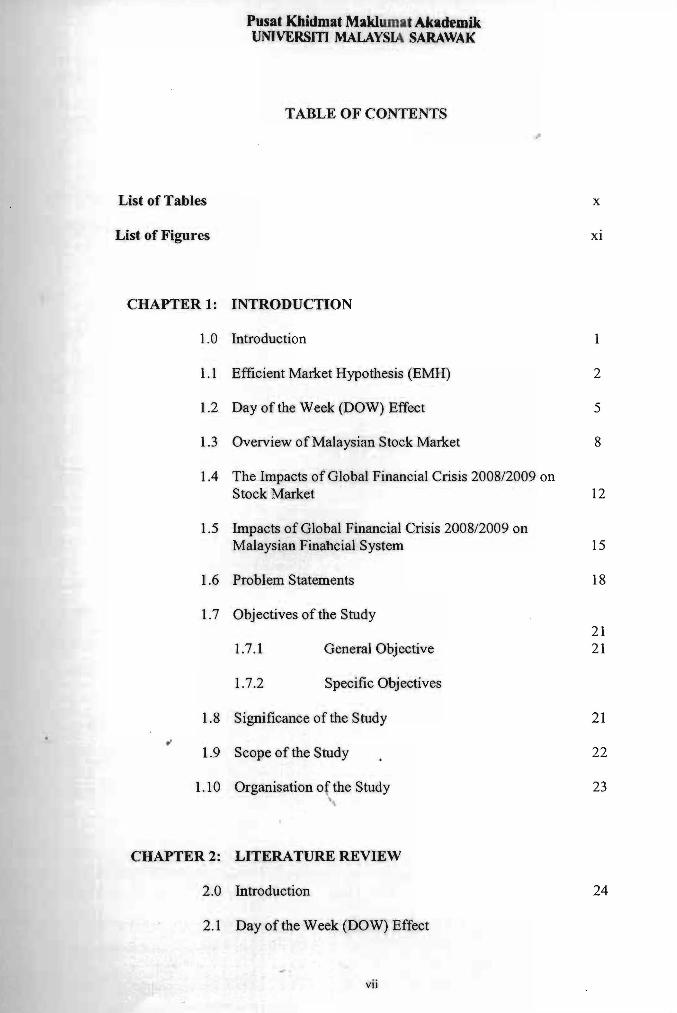
TABLE OF CONTENTS
List of Tables x
List of Figures xi
CHAPTER 1: INTRODUCTION
1.0 Introduction
1.1 Efficient Market Hypothesis (EMH) 2
1.2 Day of the Week (DOW) Effect 5
1.3 Overview of Malaysian Stock Market 8
1.4 The Impacts of Global Financial Crisis 2008/2009 on Stock Market 12
1.5 Impacts of Global Financial Crisis 2008/2009 on Malaysian Finahcial System 15
1.6 Problem Statements 18
1.7 Objectives of the Study 21
1.7.1 General Objective 21
1.7.2 Specific Objectives
1.8 Significance of the Study 21
1.9 Scope of the Study 22
1.10 Organisation of the Study 23
CHAPTER 2: LITERATURE REVIEW
2.0 Introduction 24
2.1 Day of the Week (DOW) Effect
vii
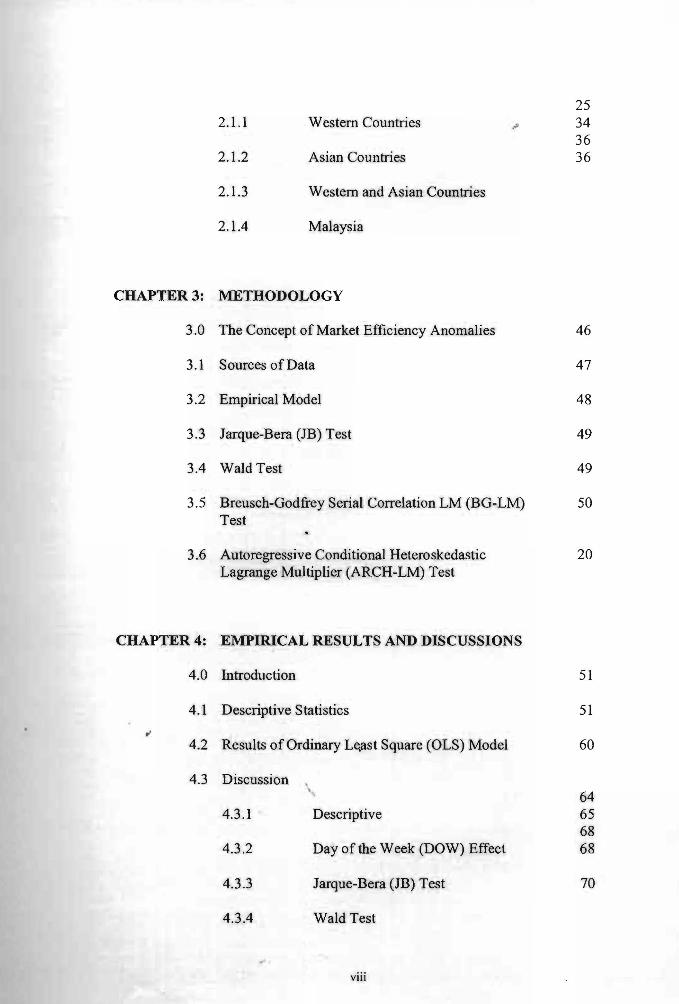
25 2.l.1 Western Countries ,;. 34
36 2.l.2 Asian Countries 36
2.1.3 Western and Asian Countries
2.1.4 Malaysia
CHAPTER 3: METHODOLOGY
3.0 The Concept of Market Efficiency Anomalies 46
3.1 Sources of Data 47
3.2 Empirical Model 48
3.3 Jarque-Bera (JB) Test 49
3.4 Wald Test 49
3.5 Breusch-Godfrey Serial Correlation LM (BG-LM) 50 Test
3.6 Autoregressive Conditional Heteroskedastic 20 Lagrange Multiplier (ARCH-LM) Test
CHAPTER 4: EMPIRICAL RESULTS AND DISCUSSIONS
4.0 Introduction 51
4.1 Descriptive Statistics 51 ",
4.2 Results of Ordinary L~ast Square (OLS) Model 60
4.3 Discussion 64
4.3 .1 Descriptive 65 68
4.3.2 Day of the Week (DOW) Effect 68
4.3.3 Jarque-Bera (JB) Test 70
4.3.4 Wald Test
VllI
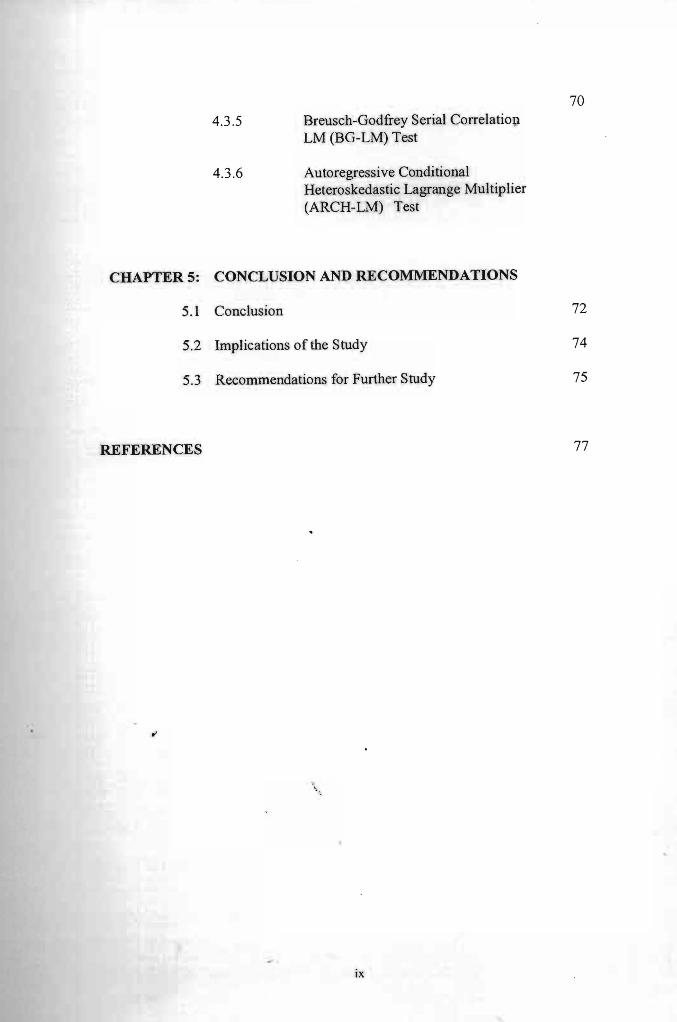
4.3.5 Breusch-Godfrey Serial Correlatiou LM (BG-LM) Test
70
4.3.6 Autoregressive Conditional Heteroskedastic Lagrange Multiplier (ARCH-LM) Test
CHAPTER 5: CONCLUSION AND RECOMMENDATIONS
5.1 Conclusion 72
5.2
5.3
Implications of the Study
Recommendations for Further Study
74
75
REFERENCES 77
r'
,' .
IX
LIST OF TABLES
'"
Table Title Page
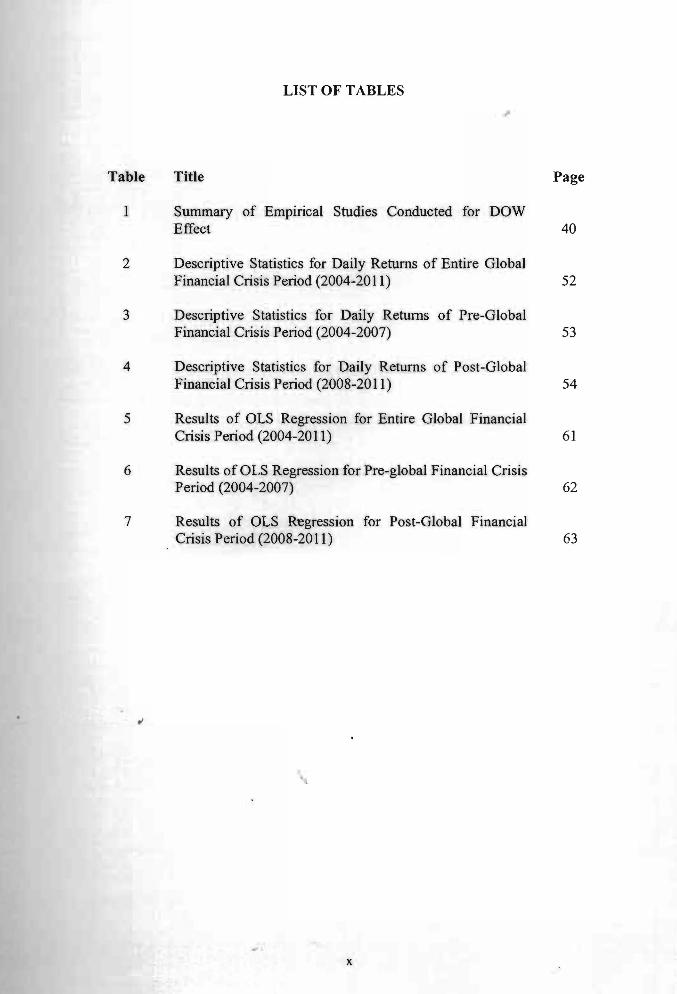
1 Summary of Empirical Studies Conducted for DOW Effect 40
2 Descriptive Statistics for Daily Returns of Entire Global Financial Crisis Period (2004-2011) 52
3 Descriptive Statistics for Daily Returns of Pre-Global Financial Crisis Period (2004-2007) 53
4 Descriptive Statistics for Daily Returns of Post-Global Financial Crisis Period (2008-2011) 54
5 Results of OLS Regression for Entire Global Financial Crisis Period (2004~2011) 61
6 Results of OLS Regression for Pre-global Financial Crisis Period (2004-2007) 62
7 Results of OLS R-egression for Post-Global Financial Crisis Period (2008-20 II) 63
"
x
I
LIST OF FIGURES
Table Title Page
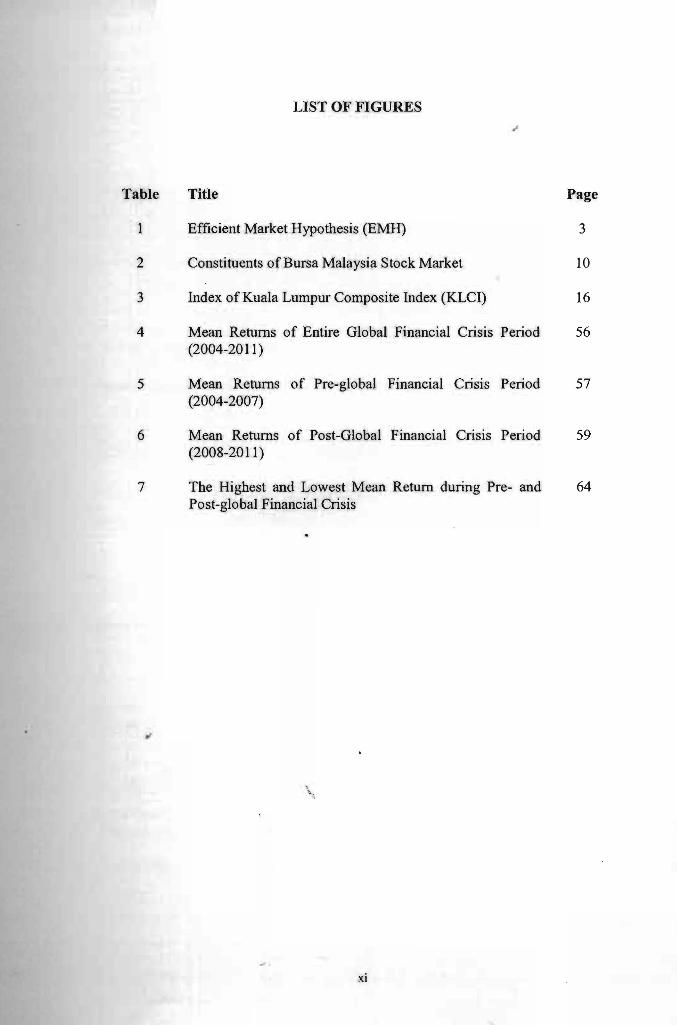
Efficient Market Hypothesis (EMH) 3
2 Constituents of Bursa Malaysia Stock Market 10
3 Index of Kuala Lumpur Composite Index (KLCI) 16
4 Mean Returns of Entire Global Financial Crisis Period 56 (2004-2011)
5 Mean Returns of Pre-global Financial Crisis Period 57 (2004-2007)
6 Mean Returns of Post-Global Financial Crisis Period 59 (2008-20 II)
7 The Highest and Lowest Mean Return during Pre- and 64 Post-global Financial Crisis
\
XI
CHAPTER 1
INTRODUCTION
1.0 Introduction
Over the years, there have been many economists, statisticians and financiers'
research in financial economics (Fama, 1965; Hamid, Suleman & Aksah, 20 I 0).
Kendall (1953) proposed Random Walk Theory (RWT) during the 1950s and 1960s
to show the manner in which future stock prices move in a random motion that floats
around the intrinsic value of the stock. Later in 1969, Random Walk Hypothesis
(RWH) was expanded to Efficient Markets Hypothesis (EMIl) (Fama, 1965). EMH
as fonnulated by Fama (1965) shows how the proposition of current stock prices
fully reflects the available infonnation. Essentially, Random Walk Model (RWM) is
the model that assumes the changes in future prices are unable to be predicted
through historical price data (Hamid et aI., 2010). Raja, Clement Sudhahar and
Selvam (2009) pointed out that RWM is commonly used to explain the stock prices
in the weak fonn ofEMH.
There are profit opportunities III the market that are represented by ...
'undervalued' and 'overvalued' of stocks. Investors are motivated to trade and make
the stock market efficient in reflecting the movement of stock prices toward the
present value of future cash flows. In other words, the trade leads to the stock prices
which reflect intrinsic values in the efficient market. As a result, investors cannot
earn abnonnal profits because the prices reflect intrinsic value (Tamara, 2010). As
further stated by Tamara (2010), the new infonnation is randomly affecting the
~
movement of stock price in an efficient. RWT expresses a stock market which is
analysed as random walk to be an efficient market that reacts rapidly to the new
infonnation. When the stock prices reflect latest available infonnation, the investors
may be unable to predict the future stock prices in order to make profits. Most Qfthe
research (see for examples, Fama, 1965; Khan & Sana Ikram, 2010; Raja et a1. 2009)
believed that stock prices are incapable to be used as a prediction measure due to
their random movement.
1.1 Efficient Market Hypothesis (EMH)
EMH theory describes the difficulty to make profit from predicting the stock
prices' movements because the current stock prices are reflecting all available
infonnation (Brown & Reilly, 2009; Hamid et aI., 2010; Raja et aI., 2009; Tamara,
2010). Indeed, the stock prices might have been adjusted before the investors have
traded and gained profit from new infonnation. EMH stated clearly that any new
infonnation that affects the stock prices may cause the stock prices to be unknown
and appear randomly in future (Hamid et aI., 2010). There are three degrees of
market ~fficiency which are weak fonn, semi-strong fonn and strong fonn according ...
to different levels of measurement of influence provided by the available infonnation
toward the stock prices as depicted in Figure 1.
2
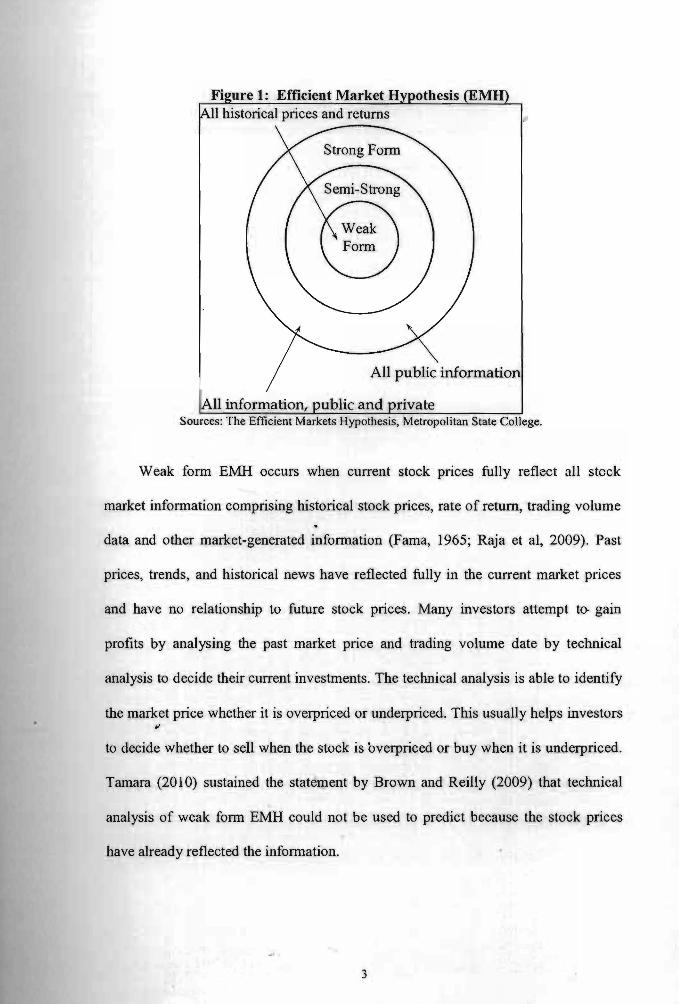
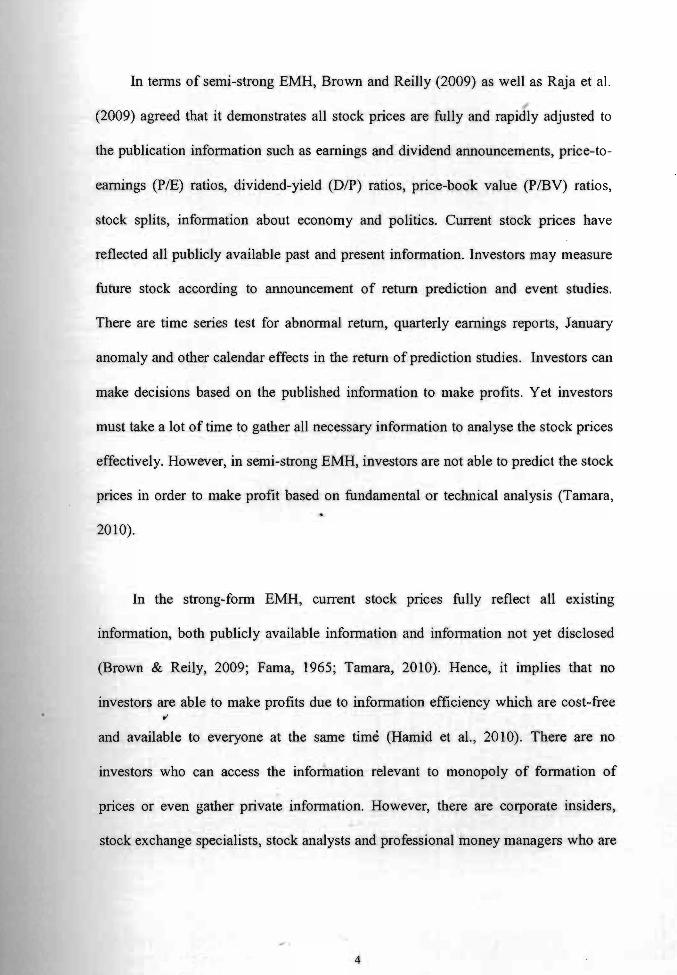
Fi ure 1: Efficient Market H
All public information
II infor1llation, Sources: The Efficient Markets Hypothesis, Metropolitan State College.
Weak form EMH occurs when current stock prices fully reflect all steck
market information comprising historical stock prices, rate of return, trading volume
data and other market-generated information (Fama, 1965; Raja et aI, 2009). Past
prices, trends, and historical news have reflected fully in the current market prices
and have no relationship to future stock prices. Many investors attempt to- gain
profits by analysing the past market price and trading volume date by technical
analysis to decide their current investments. The technical analysis is able to identify
the market price whether it is overpriced or underpriced. This usually helps investors .l
to decide whether to sell when the stock is overpriced or buy when it is underpriced.
Tamara (2010) sustained the statement by Brown and Reilly (2009) that technical
analysis of weak form EMH could not be used to predict because the stock prices
have already reflected the information.
3
In terms of semi-strong EMH, Brown and Reilly (2009) as well as Raja et aI.
(2009) agreed that it demonstrates all stock prices are fully and rapidly adjusted to
the publication information such as earnings and dividend announcements, price ~ to-
earnings (PIE) ratios, dividend-yield (DIP) ratios, price-book value (PIBV) ratios,
stock splits, information about economy and politics. Current stock prices have
reflected all publicly available past and present information. Investors may measure
future stock according to announcement of return prediction and event studies.
There are time series test for abnormal return, quarterly earnings reports, January
anomaly and other calendar effects in the return of prediction studies. Investors can
make decisions based on the published information to make profits. Yet investors
must take a lot of time to gather all necessary information to analyse the stock prices
effectively. However, in semi-strong EMH, investors are not able to predict the stock
prices in order to make profit based on fundamental or technical analysis (Tamara,
2010).
In the strong-form EMH, current stock pnces fully reflect all existing
information, both publicly available information and information not yet disclosed
(Brown & Reily, 2009; Fama, 1965; Tamara, 2010). Hence, it implies that no
investors are able to make profits due to information efficiency which are cost-free ,,'
and available to everyone at the same time (Hamid et aI., 2010). There are no
investors who can access the information relevant to monopoly of formation of
prices or even gather private information. However, there are corporate insiders,
stock exchange specialists, stock analysts and professional money managers who are
4
Pusat Khidmat Maklumat Akademik UNlVERSm MALAYSIA SAKAWA){
able to analyse and predict the stock prices from their professional's abilities and
insiders' infonnation (Brown & Reilly, 2009).
1.2 Day of the Week (DOW) Effect
According to Aydogan and Booth (1999) and Kenourgios and Samitas (2008),
calendar anomalies are very common in financial markets. Anomaly is a deviation
from the nonna}, which does not exist in the efficient market (Agathee, 2008; Fama,
1991). Anwar and Mulyadi (2009) noted that the deviations from the nonnal are
called anomalies because they cannot be explained by traditional asset pricing
models including EMH. This finding is similar to the study by Fama (1991), Malkeil
(2003) and Schwert (2003). The calendar effect is a theory that claims certain time in
which stock prices are likely to rise or fall than other time (Zainal Abidin & Wan
Mahmood, 2007). The occurrences of the anomalies enable investors to predict stock
prices based on developed trading strategies with the returns of the noted time (Fama,
1991). Prokop (2010) and Tachiwou (2010) fully supported the existence of
anomalies and proved market inefficiency that investors could earn abnonnal profits
by taking advantage of their buying and selling strategies with proper timing as also
shown in the studies by Boudreaux (1995), Nath and Dalvi (2004) as well as ,,'
Sakaraukas and Kriksciuniene (2007).
Most studies reported there are many kinds of calendar anomalies such as day
of the week (DOW) effect also known as weekday effect, weekend effect, or
Monday effect, January effect (tum of the year effect), tum of the month effect and
5
the holiday effect (see for examples, Nayan & Fatta Bahadur, 2005; Silva, 2010).
The January effect indicates the stock which obtains abnormally higher returns
during January and the turn of the month effect defines the patterns on the last days
and the first days of the months. The holiday effect is the abnormal stock returns
before or after the holidays (Silva, 2010).
Dima and Milos (2009) as well as Silva (20 10) discovered the most famous
calendar anomalies is the DOW effect. The DOW effect is a theory when the stock
average return is significantly negative or lower on Mondays than other weekdays
(Zainal Abidin & Wan Mahmood, 2007). The highest returns are usually on Fridays
as compared to the other weekdays, even though the expectations of the stock price
returns are higher with longer period and greater assumed risks (Lakonishok &
Maberly, 1990). The DOW effect is a form of anomaly which contradicts the EMH
as mentioned in the studies by Patev, Lyroudi and Kanaryan (2002) followed by
Angelidis and Lyroudi (2004).
Moreover, Angelidis and Lyroudi (2004), Nayan and Fatta Bahadur (2005)
demonstrated two hypotheses that describe the DOW effect, calendar time
hypothesis and trading time hypothesis. The calendar time hypothesis refers to the .,.
continuously process in generating stock return. This shows Monday's average
return which is estimated from the closing price on Friday and the closing price on
Monday as a result of the difference with other weekdays' average returns. French
(1980) and Nayan and Fatta Bahadur (2005) discovered that Monday's average
return were three times higher than the average returns of the other weekdays. As for
6
the trading time hypothesis, it describes a transaction that generates returns of stocks
,I
in which the average stock return will be the same for all the weekdays (Angelidis &
Lyroudi, 2004; Nayan & Fatta Bahadur, 2005).
In the study by Tripatby (2010), the DOW effect is on different day of the
week and brings out different stock returns. The DOW effect appears when there is a
difference in returns between a particular trading day and a couple of trading days as
compared to the rest of the trading weekdays. Monday effect shows that the negative
Monday's average return is significantly lower than the other weekdays' average
returns as explored by several studies (see for examples, Apolinario et aI., 2006;
Charles et aI., 2002; Dic1e & Hassan, 2007). Similar findings are noted in the studies
by Anwar and Mulydai (2009), Maheran and Naziman (2010) and Prokop (2010) as
well as the study by Heinien and Puttonen (2011) and Yat et al. (2011). Fridays
normally present the highest return as compared to other weekdays (Balaban, 1994;
Berument & Kiymaz, 200'1; Kein & Stambugh, 1984).
Patev et a1. (2002) revealed the stock prices fall on Monday and rise again on
Friday because of investors' psychological influences that cause anomaly. This is
because most investors treat Monday as the worst weekday because it is the first p '
working day while Friday as the best' because it is the last working day.
Consequently, investors feel less desirable on Monday and feel desirable on Friday
that affects sales and purchases respectively. Increasing of sales causes the prices fall
and increasing of purchase causes the prices raise.
7
Tripathy (2010) indicated the DOW effect is negatively influenced by
~
unfavorable infonnation arriving after the Friday's closing of stock market. Investors
will sell securities on Monday that affect the securities prices to drop on Monday.
This causes the trend of stock market to start downwards on Monday and end
upwards on Friday in most of the capital markets. Moreover, Tuesday effect is
negative as well because the unfavourable news arrives in the weekend, which can
be affected by one day lag as discovered by Tripathy (2010). However, as claimed
by Patev et al. (2002), there is no explanation for Tuesday's negative return while
investors can understand anomaly to make decision to increase their return.
1.3 Overview of Malaysian Stock Market
According to Bursa Malaysia (2011), Malaysian stock market is one of the
biggest stock markets in Southeast Asia with a history over 50 years. Bursa Malaysia
was first established in 1990 as a first fonnal organization when 15 stockbrokers
fonned Singapore Stockbrokers' Association. -It offers equity-related risk
management tools and connects to portfolio management strategies. There was no
public trading of stock at the time until 1960, when the Malayan Stock Exchange
was fonned. oi
In 1961, the Board system was introduced in Singapore and Kuala Lumpur
trading rooms. They were linked by direct telephone lines through the market with
the same stocks and shares listed at a series of specific prices on both boards. In
1964, the Malayan Stock Exchange was renamed to Stock Exchange of Malaysia.
8
Stock Exchange of Malaysia and Singapore were established when the secession of
Singapore from Malaysia in 1965 due to currency interchangeability between
Malaysia and Singapore and they diverged separately into Kuala Lumpur Stock
Exchange Berhad (KLSEB) and the Stock Exchange of Singapore (SES).
Subsequently, Kuala Lumpur Stock Exchange (KLSE) took over the operations of
the Kuala Lumpur Stock Exchange Berhad in 1994 (Bursa Malaysia, 2011).
In 2004, KLSE was renamed to Bursa Malaysia Berhad that converted from a
not-for-profit organization limited by the guarantee of its membership to an entity
limited by its shares. Securities Commission supervises the operations of Bursa
Malaysia that falls under the authority of the Ministry of Finance Malaysia. This
offers investors stock trading on a reguiated exchange with similar rules and
regulations like other stock exchanges. Bursa Malaysia, as a central market place to
manage risk exposure, offers a competitive fund raising and investment with various
types for stocks transactions between investors (Bursa Malaysia, 2011).
According to Financial Times Stock Exchange (FTSE) and Bursa (20 l 1), the
FTSE Bursa Malaysia Index Series represents the performance of companies,
preparing investors with a set of indices differentiates by eligibility requirements, ."
which measure the performance of the major capital and industry segments of the
Malaysian and regional market. The' e are two stock markets in Malaysia, which are
Main market and Access Certainty Efficiency (ACE) market. The indices of the
Main Market are FTSE Bursa Malaysia Kuala Lumpur Composite Index (KLCI),
FTSE Bursa Malaysia Mid 70 Index, FTSE Bursa Malaysia Top 100 Index, FTSE
9
Bursa Malaysia Small Cap Index, FTSE Bursa Malaysia EMAS Index, FTSE Bursa
Malaysia EMAS Industry Indices, FTSE Bursa Malaysia EMAS Shariah Index,
FTSE Bursa Malaysia Hijrah Shariah Index, FTSE Bursa Malaysia Fledgling Index
and FTSE Bursa Malaysia Palm Oil Plantation Index (FTSE & Bursa, 2011).
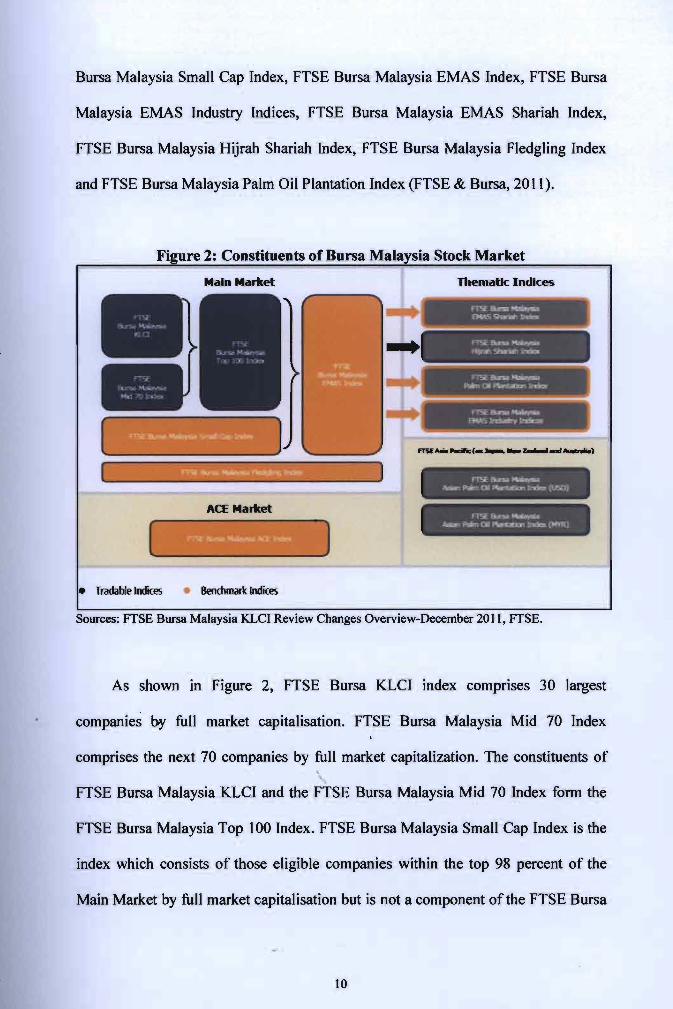
Fi ure 2: Constituents of Bursa Malaysia Stock Market
Main Market nlematic Indices
------------------f,,,ce...nu ........ ~~L~ ~-rlr"s
rT'iffUw_ '-r p.-- (l.l ~ID"I l-d'a :'-'__ H
ACE Market n~EUv""'"
...... ~.~ 1'\drCLJ[r. :~ ,~:
• Tradable Indices Bend1mark Indices
Sources: FTSE Bursa Malaysia KLCI Review Changes Overview-December 2011, FTSE.
As shown in Figure 2, FTSE Bursa KLCI index comprises 30 largest
companies by full market capitalisation. FTSE Bursa Malaysia Mid 70 Index
comprises the next 70 companies by full market capitalization. The constituents of
FTSE Bursa Malaysia KLCI and the FTSE Bursa Malaysia Mid 70 Index fonn the
FTSE Bursa Malaysia Top 100 Index. FTSE Bursa Malaysia Small Cap Index is the
index which consists of those eligible companies within the top 98 percent of the
Main Market by full market capitalisation but is not a component of the FTSE Bursa
10
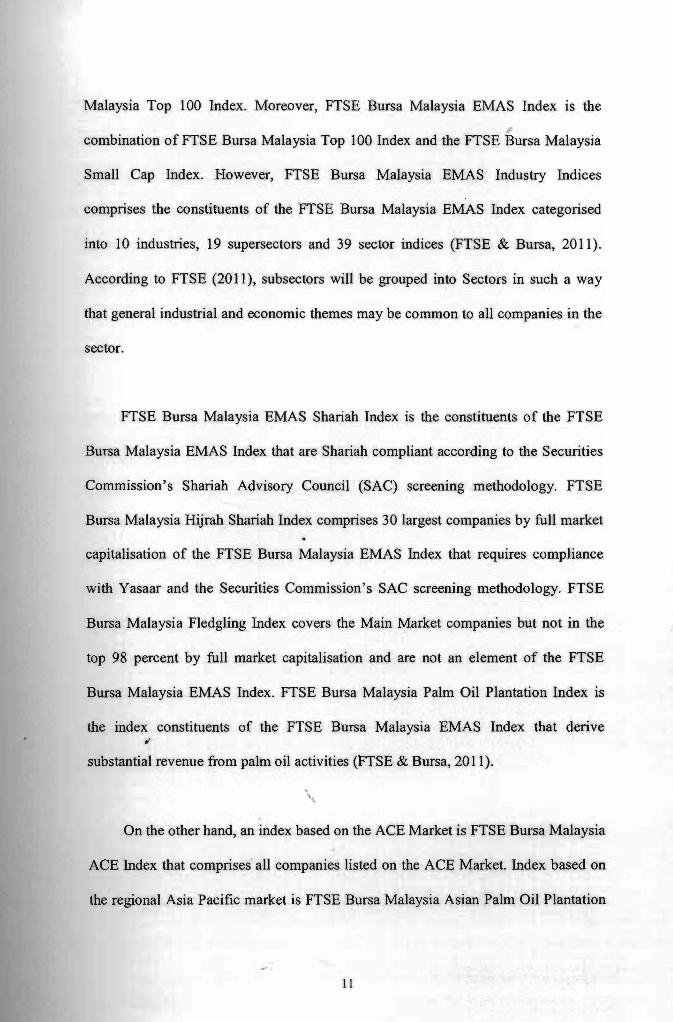
Malaysia Top 100 Index. Moreover, FTSE Bursa Malaysia EMAS Index is the
combination of FTSE Bursa Malaysia Top 100 Index and the FTSE Bursa Malaysia
Small Cap Index. However, FTSE Bursa Malaysia EMAS Industry Indices
comprises the constituents of the FTSE Bursa Malaysia EMAS Index categorised
into 10 industries, 19 supersectors and 39 sector indices (FTSE & Bursa, 2011).
According to FTSE (2011), subsectors wiIJ be grouped into Sectors in such a way
that general industrial and economic themes may be common to all companies in the
sector.
FTSE Bursa Malaysia EMAS Shariah Index is the constituents of the FTSE
Bursa Malaysia EMAS Index that are Shariah compliant according to the Securities
Commission's Shariah Advisory Council (SAC) screening methodology. FTSE
Bursa Malaysia Hijrah Shariah Index comprises 30 largest companies by full market
capitalisation of the FTSE Bursa Malaysia EMAS Index that requires compliance
with Yasaar and the Securities Commission's SAC screening methodology. FTSE
Bursa Malaysia Fledgling Index covers the Main Market companies but not in the
top 98 percent by full market capitalisation and are not an element of the FTSE
Bursa Malaysia EMAS Index. FTSE Bursa Malaysia Palm Oil Plantation Index is
the index constituents of the FTSE Bursa Malaysia EMAS Index that derive r '
substantial revenue from palm oil activities (FTSE & Bursa, 2011).
On the other hand, an index based on the ACE Market is FTSE Bursa Malaysia
ACE Index that comprises all companies listed on the ACE Market. Index based on
the regional Asia Pacific market is FTSE Bursa Malaysia Asian Palm Oil Plantation
11
Index that includes companies from the universes of developed, advanced emerging
and secondary emerging countries as categorized by FTSE in the Asia Pacific region
excluding Japan, Australia and New Zealand that derive substantial revenue from
palm oil activities (FTSE & Bursa, 2011).
1.4 The Impacts of Global Financial Crisis 2008/2009 on Stock Market
Malik et a1. (2009) and Olowe (2010) documented the housing bubble in the
United States (US) which caused the global financial crisis in 2006 and has become a
global phenomenon. It has resulted tragic impacts on the world economies and
financial markets. Naude (2009), Singh (2009) and Olowe (2010) pointed out that
consumer confidence indexes were faliing all over the world, as were housing prices.
The crisis happened at the end of 2007 and caused huge impacts on all fmanciai
markets around the world in the early of 2008. The crisis have caused by the
subprime mortgage crisis in the United States. It happened due to the failure or
merger of several large United States-based fmancial finns that were exposed to
packaged sub prime loans and credit default swaps. On September 7, 2008, Fannie
Mae (Federal National Mortgage Association) and Freddie Mac (Federal Home Loan
Mortgage Corporation) were taken over and run by the United States Federal
Housing Finance Agency that owned and guaranteed about half of the $12 trillion of
U.S. mortgage market. This caused panic to every home mortgage lender and Wall
Street bank as pointed out in the studies by Malik et a1. (2009), Naude (2009) and
Singh (2009).
12
The crisis rapidly developed into a global credit crisis after Lehman Brothers
and several other financial " ainstitutions failed in the United States. It resulted
number of bank failures in Europe and caused reductions in the value of equities
especially in stocks and commodities worldwide. In the United States, 15 banks have
failed, while several others have survived through government intervention. It has
caused central banks around the world to reduce interest rates and implement various
economic stimulus packages to boost up economic growth and sustain investor
confidence in the fmancial markets (Olowe, 2010).
Cali, Massa and Te Velde (2008) discovered that stock exchanges of Asia and
Europe have crashed, resulted collective losses of the London, Paris and Frankfurt
markets more than $350 billion, which is similar with the findings by Malik et al.
(2009). The current financial crisis financially affects developing countries and
spillovers to overall of the stock markets. In the study by Abu Hatab (2009), the
Egyptian Stock Exchange declined long before the crisis because of a number of
factors that worsen the performance. By late 2007, foreigners sold their assets in
order to end their enterprises in their home countries due to the mortgage crisis. This
caused the second chock defined as May economic decrees to happen and led to
inflation which negatively affected expectation of investors about the perfonnance of .. the stock exchange and Egyptian economy. The index feU 20 percent at the
beginning of August 2008. The crisis worsened the Egyptian Stock Exchange, which
continued to drop 43 percent up to the end of 2008. Egyptian Stock Exchange was
one of the worst hit with total decline estimated at 56 percent in one year (United
Nations, 2009).
13