simulation of pemfc stack for portable power generator ... · umumnya, dalam aplikasi penjana sel...
TRANSCRIPT
Jurnal Kejuruteraan SI 1(1) 2018: 1-10 http://dx.doi.org/10.17576/jkukm-2018-si1(1)-01
Simulation of PEMFC Stack for Portable Power Generator Application
(Simulasi Tindanan PEMFC bagi Aplikasi Penjana Kuasa Mudah Alih)
Siti Najibah Abd Rahmana, Mohd Shahbudin Masdar a,b,*, Masli Irwan Roslia,b, Edy Herianto Majlana, aFuel Cell Institute
bResearch Center for Sustainable Process Technology (CESPRO), Faculty of Engineering & Built Environment Universiti Kebangsaan Malaysia, MalaysiaSyahril Anuar Md Rejabc. Chew Chien Lyec
cSime Darby Research Sdn. Bhd, Pulau Carey, Selangor, Malaysia
ABSTRACT
Generally, it is possible to reduce the size, cost, and parasitic loss of polymer electrolyte membrane fuel cell (PEMFC) system with an air-cooled system, open cathode and self-humidifying stack for portable fuel cell application. In order to ensure the that PEMFC stack applicable for portable fuel cell application, a mathematical model is useful tool for saving design cost, giving a better system design and operation. Therefore, this study is focused on developing a simplified zero-dimensional mathematical model for self-humidifying and open cathode 200W PEMFC stack for portable fuel cell generator application. The mathematical equations are modelled by using Matlab-Simulink tools in order to simulate the operation of the developed mode. This simulation is then compared to a commercially 200W Horizon PEMFC stack (H-200) for data validation purposes. The air inlet flow rate is chosen to test the sensitivity of the fuel cell stack model. The air inlet stoichiometry of 2, 5, 20, and 50 was varied to generate a different air inlet flow rate. Based on the simulation, air inlet stoichiometry above 15 is sufficient to produce a high output stack voltage. However, in a real operation of the H-200 fuel cell stack system needs air inlet stoichiometry at about 20 because a fan is used to supply air and also the cooling system. High anode and cathode relative humidity result in a high output stack voltage. However, it is better to increase the anode relative humidity than cathode relative humidity to get high output stack voltage.
Keywords: Polymer Electrolyte Membrane Fuel Cell; Simulink; Stoichiometry; Relative Humidity
ABSTRAK
Umumnya, dalam aplikasi penjana sel fuel mudah alih, ia adalah berkemungkinan untuk mengurangkan saiz, kos, dan kehilangan parasit sel fuel polimer membran elektrolit (PEMFC) dengan menggunakan sistem penyejuk udara, jenis katod terbuka dan pelembapan-kendiri. Bagi memastikan tindanan PEMFC sesuai bagi aplikasi penjana sel fuel mudah alih, model matematik merupakan pendekatan yang sesuai bagi menjimatkan kos reka bentuk serta menghasilkan reka bentuk dan operasi sistem yang lebih baik. Oleh itu, kajian ini tertumpu kepada pembangunan model matematik sifar dimensi bagi pelembapan-kendiri dan katod terbuka tindanan PEMFC 200W bagi aplikasi penjana kuasa sel fuel mudah alih. Persamaan matematik dimodelkan dengan menggunakan Matlab-Simulink bagi mensimulasikan model matematik yang dibangunkan. Hasil simulasi ini dibandingkan dengan hasil uji kaji tindanan 200W Horizon PEMFC (H-200) komersil bagi tujuan pengesahan model matematik. Kadar alir masuk udara dipilih untuk menguji sensitiviti model tindanan sel fuel. Oleh itu, stoikiometri inlet udara dari 2, 5, 20, dan 50 disimulasi untuk menghasilkan kadar alir masuk udara yang berbeza. Berdasarkan hasil simulasi, stoikiometri inlet udara di atas 15 adalah mencukupi untuk menghasilkan voltan tindanan sel fuel yang tinggi. Walau bagaimanapun, dalam pengoperasian sebenar, sistem tindanan sel fuel H-200 memerlukan stoikiometri inlet udara sekitar 20 kerana kipas digunakan untuk membekalkan udara dan juga sistem penyejukan. Kelembapan relatif anod dan katod yang tinggi menghasilkan voltan tindanan sel fuel yang tinggi. Namun demikian, peningkatkan kelembapan relatif anod adalah lebih baik berbanding kelembapan relatif katod bagi mendapatkan voltan tindanan sel fuel yang tinggi.
Kata kunci: Sel Fuel Polimer Membran Elektrolit; Simulink; Stoikiometri; Kelembapan Relatif
INTRODUCTION
A fuel cell is an electrochemical device that generates electricity and heat by converting fuel, such as hydrogen and oxidant, into energy. This device is a relevant and renewable power source for the future. In addition, the fuel cell will become more renewable power source by using biohydrogen
instead hydrogen produce by fossil fuels which generates greenhouse gases and requires high energy (Rahman et al. 2016). Fuel cells are environmentally friendly because their sole by-product is water, and they do not emit harmful and greenhouse gases. Given that fuel cells have no moving parts, hence result in silent devices.
2
PEMFC and direct methanol fuel cell (DMFC) have been appointed for portable fuel cell power generator application (Rahman et al. 2010; Kamarudin et al. 2009). These membrane fuel cells have only clear different which is fuel that they use either hydrogen or methanol fuel for PEMFC and DMFC respectively. For high power electronic applications such as 50-70W, the high power density fuel cell is required, so PEMFC is more suitable to develop as portable fuel cell power generator for those electronic applications (Heinzel et al. 2002). While, portable DMFC fuel cell power generator is sufficient to power the mobile phones as it need few Watts, 1-3 W (low power density) and able to give long duration of power supply (high energy density) (Heinzel et al. 2002). In order to achieve the criteria of a compact and lightweight mobile power generator system, the PEMFC has been selected which exploits the simplicity of the fuel cell as it utilizes solid polymer as an electrolyte, has a fast start-up and operates at low temperature (35–100ºC) (Larminie et al. 2003; Zhang et al. 2010).
An open-cathode, self-humidifying PEMFC stack, in particular, is gaining increased popularity in low to medium power applications (i.e. portable power generator) due to its simple structure and low parasitic losses. At room temperature, the low-power portable PEM fuel cell stack was designed as an open cathode for cooling and self-humidifying membrane, which showed a simple and compact design as a portable application. By contrast, portable PEM fuel cell requires additional heating during cold-start up in different environment (Rahman et al. 2016).
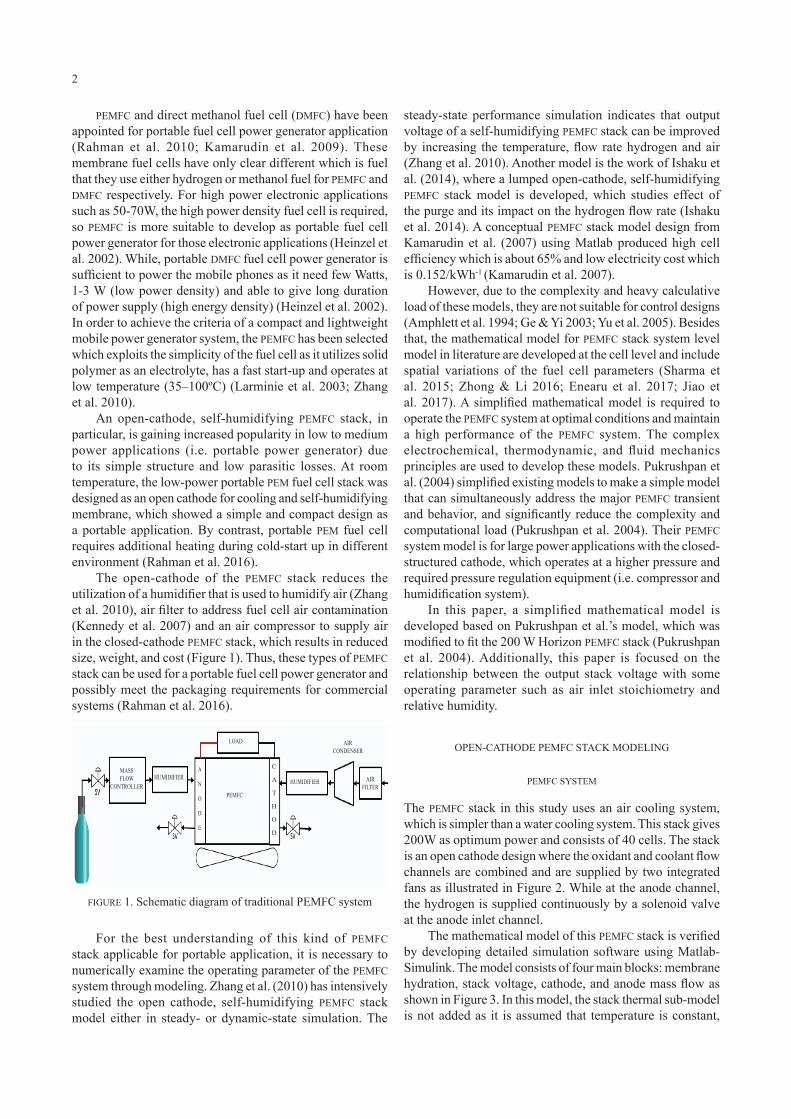
The open-cathode of the PEMFC stack reduces the utilization of a humidifier that is used to humidify air (Zhang et al. 2010), air filter to address fuel cell air contamination (Kennedy et al. 2007) and an air compressor to supply air in the closed-cathode PEMFC stack, which results in reduced size, weight, and cost (Figure 1). Thus, these types of PEMFC stack can be used for a portable fuel cell power generator and possibly meet the packaging requirements for commercial systems (Rahman et al. 2016).
FIGURE 1. Schematic diagram of traditional PEMFC system
steady-state performance simulation indicates that output voltage of a self-humidifying PEMFC stack can be improved by increasing the temperature, flow rate hydrogen and air (Zhang et al. 2010). Another model is the work of Ishaku et al. (2014), where a lumped open-cathode, self-humidifying PEMFC stack model is developed, which studies effect of the purge and its impact on the hydrogen flow rate (Ishaku et al. 2014). A conceptual PEMFC stack model design from Kamarudin et al. (2007) using Matlab produced high cell efficiency which is about 65% and low electricity cost which is 0.152/kWh-1 (Kamarudin et al. 2007).
However, due to the complexity and heavy calculative load of these models, they are not suitable for control designs (Amphlett et al. 1994; Ge & Yi 2003; Yu et al. 2005). Besides that, the mathematical model for PEMFC stack system level model in literature are developed at the cell level and include spatial variations of the fuel cell parameters (Sharma et al. 2015; Zhong & Li 2016; Enearu et al. 2017; Jiao et al. 2017). A simplified mathematical model is required to operate the PEMFC system at optimal conditions and maintain a high performance of the PEMFC system. The complex electrochemical, thermodynamic, and fluid mechanics principles are used to develop these models. Pukrushpan et al. (2004) simplified existing models to make a simple model that can simultaneously address the major PEMFC transient and behavior, and significantly reduce the complexity and computational load (Pukrushpan et al. 2004). Their PEMFC system model is for large power applications with the closed-structured cathode, which operates at a higher pressure and required pressure regulation equipment (i.e. compressor and humidification system).
In this paper, a simplified mathematical model is developed based on Pukrushpan et al.’s model, which was modified to fit the 200 W Horizon PEMFC stack (Pukrushpan et al. 2004). Additionally, this paper is focused on the relationship between the output stack voltage with some operating parameter such as air inlet stoichiometry and relative humidity.
OPEN-CATHODE PEMFC STACK MODELING
PEMFC SYSTEM
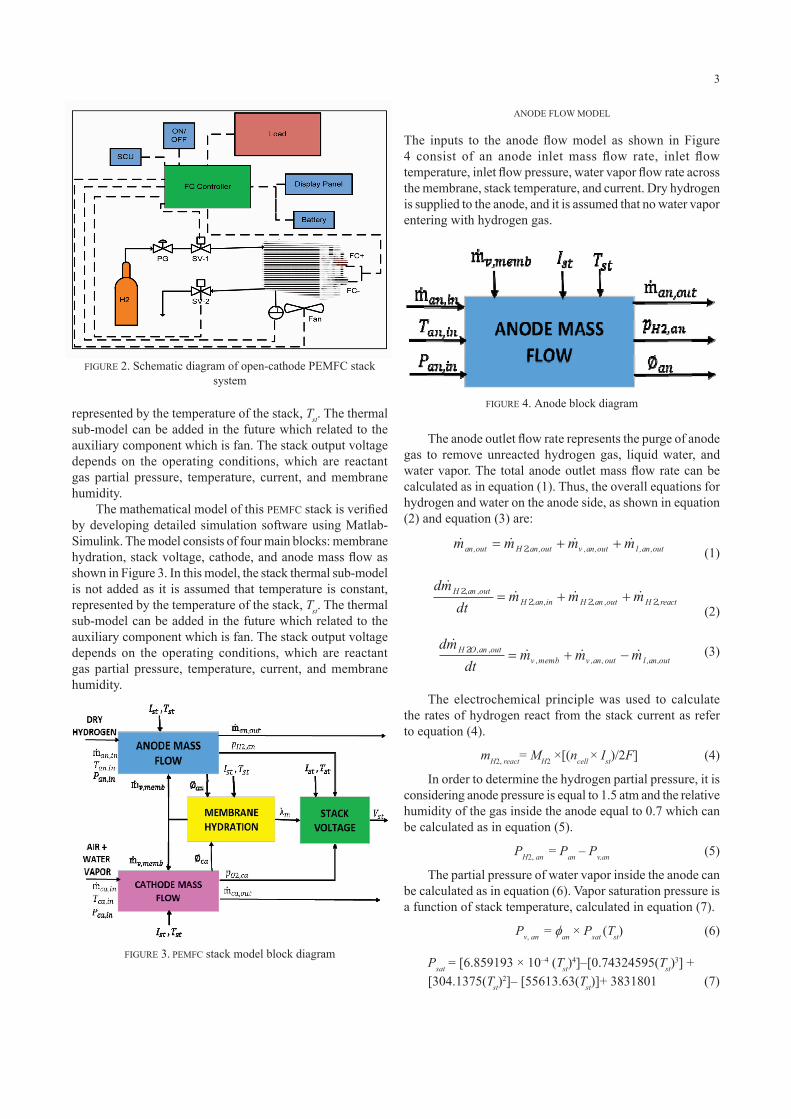
The PEMFC stack in this study uses an air cooling system, which is simpler than a water cooling system. This stack gives 200W as optimum power and consists of 40 cells. The stack is an open cathode design where the oxidant and coolant flow channels are combined and are supplied by two integrated fans as illustrated in Figure 2. While at the anode channel, the hydrogen is supplied continuously by a solenoid valve at the anode inlet channel.
The mathematical model of this PEMFC stack is verified by developing detailed simulation software using Matlab-Simulink. The model consists of four main blocks: membrane hydration, stack voltage, cathode, and anode mass flow as shown in Figure 3. In this model, the stack thermal sub-model is not added as it is assumed that temperature is constant,
MASS FLOW
CONTROLLERHUMIDIFIER
LOAD
PEMFC
HUMIDIFIER AIRFILTER
A
N
O
D
E
AIR CONDENSER
C
A
T
H
O
D
For the best understanding of this kind of PEMFC stack applicable for portable application, it is necessary to numerically examine the operating parameter of the PEMFC system through modeling. Zhang et al. (2010) has intensively studied the open cathode, self-humidifying PEMFC stack model either in steady- or dynamic-state simulation. The
3
represented by the temperature of the stack, Tst. The thermal sub-model can be added in the future which related to the auxiliary component which is fan. The stack output voltage depends on the operating conditions, which are reactant gas partial pressure, temperature, current, and membrane humidity.
The mathematical model of this PEMFC stack is verified by developing detailed simulation software using Matlab-Simulink. The model consists of four main blocks: membrane hydration, stack voltage, cathode, and anode mass flow as shown in Figure 3. In this model, the stack thermal sub-model is not added as it is assumed that temperature is constant, represented by the temperature of the stack, Tst. The thermal sub-model can be added in the future which related to the auxiliary component which is fan. The stack output voltage depends on the operating conditions, which are reactant gas partial pressure, temperature, current, and membrane humidity.
ANODE FLOW MODEL
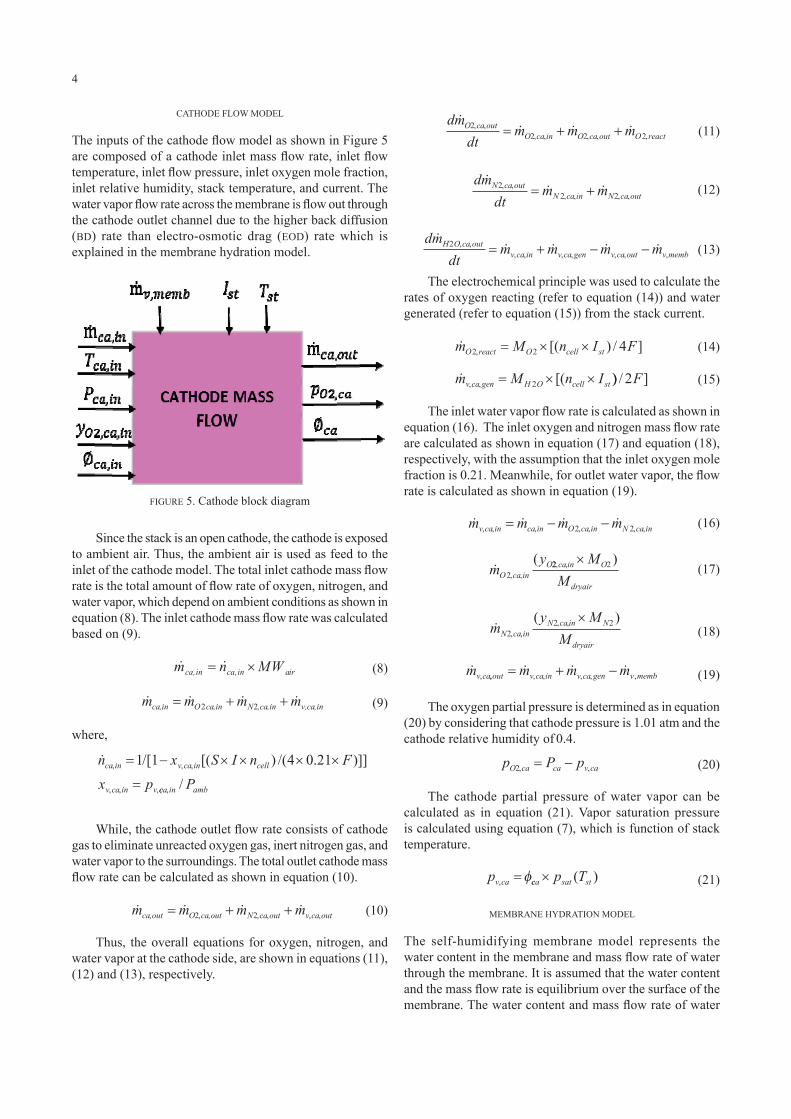
The inputs to the anode flow model as shown in Figure 4 consist of an anode inlet mass flow rate, inlet flow temperature, inlet flow pressure, water vapor flow rate across the membrane, stack temperature, and current. Dry hydrogen is supplied to the anode, and it is assumed that no water vapor entering with hydrogen gas.
FIGURE 2. Schematic diagram of open-cathode PEMFC stack system
FIGURE 3. PEMFC stack model block diagram
FIGURE 4. Anode block diagram
The anode outlet flow rate represents the purge of anode gas to remove unreacted hydrogen gas, liquid water, and water vapor. The total anode outlet mass flow rate can be calculated as in equation (1). Thus, the overall equations for hydrogen and water on the anode side, as shown in equation (2) and equation (3) are:
man,out = + +m m mH an out v an out l an out2, , , , , , (1)
dm
dtm m mH an out
H an in H an out H react
2
2 2 2, ,
, , , , ,= + + (2)
dm
dtm m mH O an out
v memb v an out l an out
2 , ,
, , , , ,= + − (3)
The electrochemical principle was used to calculate the rates of hydrogen react from the stack current as refer to equation (4).
mH2, react= MH2 ×[(ncell × Ist)/2F] (4)
In order to determine the hydrogen partial pressure, it is considering anode pressure is equal to 1.5 atm and the relative humidity of the gas inside the anode equal to 0.7 which can be calculated as in equation (5).
PH2, an = Pan – Pv,an (5)
The partial pressure of water vapor inside the anode can be calculated as in equation (6). Vapor saturation pressure is a function of stack temperature, calculated in equation (7).
Pv, an = φan × Psat (Tst) (6)
Psat = [6.859193 × 10⁻⁴ (Tst)4]–[0.74324595(Tst)
3] +[304.1375(Tst)
2]– [55613.63(Tst)]+ 3831801 (7)
4
CATHODE FLOW MODEL
The inputs of the cathode flow model as shown in Figure 5 are composed of a cathode inlet mass flow rate, inlet flow temperature, inlet flow pressure, inlet oxygen mole fraction, inlet relative humidity, stack temperature, and current. The water vapor flow rate across the membrane is flow out through the cathode outlet channel due to the higher back diffusion (BD) rate than electro-osmotic drag (EOD) rate which is explained in the membrane hydration model.
dm
dtm m mO ca out
O ca in O ca out O react
2
2 2 2, ,
, , , , ,= + + (11)
dm
dtm mN ca out
N ca in N ca out
2
2 2, ,
, , , ,= + (12)
dm
dtm m m mH O ca out
v ca in v ca gen v ca out v memb
2 , ,
, , , , , , ,= + − − (13)
The electrochemical principle was used to calculate the rates of oxygen reacting (refer to equation (14)) and water generated (refer to equation (15)) from the stack current.
m M n I F
m M n I
O react O cell st
v ca gen H O cell st
2 2
2
4,
, ,
[( ) / ]
[(
= × ×
= × × )) / ]
(
, , , , , , ,
, ,
2
2 2
2
F
m m m m
my
v ca in ca in O ca in N ca in
O ca inO
= − −
22 2
22 2
, ,
, ,, ,
,
)
( )
ca in O
dryair
N ca inN ca in N
dryair
v ca
M
M
my M
M
m
×
×
,, , , , , ,
, ,
,
out v ca in v ca gen v memb
O ca ca v ca
v ca
m m m
p P p
p
= + −
= −
=
2
φcca sat stp T× ( )
(14)
m M n I F
m M n I
O react O cell st
v ca gen H O cell st
2 2
2
4,
, ,
[( ) / ]
[(
= × ×
= × × )) / ]
(
, , , , , , ,
, ,
2
2 2
2
F
m m m m
my
v ca in ca in O ca in N ca in
O ca inO
= − −
22 2
22 2
, ,
, ,, ,
,
)
( )
ca in O
dryair
N ca inN ca in N
dryair
v ca
M
M
my M
M
m
×
×
,, , , , , ,
, ,
,
out v ca in v ca gen v memb
O ca ca v ca
v ca
m m m
p P p
p
= + −
= −
=
2
φcca sat stp T× ( )
(15)
The inlet water vapor flow rate is calculated as shown in equation (16). The inlet oxygen and nitrogen mass flow rate are calculated as shown in equation (17) and equation (18), respectively, with the assumption that the inlet oxygen mole fraction is 0.21. Meanwhile, for outlet water vapor, the flow rate is calculated as shown in equation (19).
m M n I F
m M n I
O react O cell st
v ca gen H O cell st
2 2
2
4,
, ,
[( ) / ]
[(
= × ×
= × × )) / ]
(
, , , , , , ,
, ,
2
2 2
2
F
m m m m
my
v ca in ca in O ca in N ca in
O ca inO
= − −
22 2
22 2
, ,
, ,, ,
,
)
( )
ca in O
dryair
N ca inN ca in N
dryair
v ca
M
M
my M
M
m
×
×
,, , , , , ,
, ,
,
out v ca in v ca gen v memb
O ca ca v ca
v ca
m m m
p P p
p
= + −
= −
=
2
φcca sat stp T× ( )
(16)
m M n I F
m M n I
O react O cell st
v ca gen H O cell st
2 2
2
4,
, ,
[( ) / ]
[(
= × ×
= × × )) / ]
(
, , , , , , ,
, ,
2
2 2
2
F
m m m m
my
v ca in ca in O ca in N ca in
O ca inO
= − −
22 2
22 2
, ,
, ,, ,
,
)
( )
ca in O
dryair
N ca inN ca in N
dryair
v ca
M
M
my M
M
m
×
×
,, , , , , ,
, ,
,
out v ca in v ca gen v memb
O ca ca v ca
v ca
m m m
p P p
p
= + −
= −
=
2
φcca sat stp T× ( )
(17)
m M n I F
m M n I
O react O cell st
v ca gen H O cell st
2 2
2
4,
, ,
[( ) / ]
[(
= × ×
= × × )) / ]
(
, , , , , , ,
, ,
2
2 2
2
F
m m m m
my
v ca in ca in O ca in N ca in
O ca inO
= − −
22 2
22 2
, ,
, ,, ,
,
)
( )
ca in O
dryair
N ca inN ca in N
dryair
v ca
M
M
my M
M
m
×
×
,, , , , , ,
, ,
,
out v ca in v ca gen v memb
O ca ca v ca
v ca
m m m
p P p
p
= + −
= −
=
2
φcca sat stp T× ( )
(18)
m M n I F
m M n I
O react O cell st
v ca gen H O cell st
2 2
2
4,
, ,
[( ) / ]
[(
= × ×
= × × )) / ]
(
, , , , , , ,
, ,
2
2 2
2
F
m m m m
my
v ca in ca in O ca in N ca in
O ca inO
= − −
22 2
22 2
, ,
, ,, ,
,
)
( )
ca in O
dryair
N ca inN ca in N
dryair
v ca
M
M
my M
M
m
×
×
,, , , , , ,
, ,
,
out v ca in v ca gen v memb
O ca ca v ca
v ca
m m m
p P p
p
= + −
= −
=
2
φcca sat stp T× ( )
(19)
The oxygen partial pressure is determined as in equation (20) by considering that cathode pressure is 1.01 atm and the cathode relative humidity of 0.4.
m M n I F
m M n I
O react O cell st
v ca gen H O cell st
2 2
2
4,
, ,
[( ) / ]
[(
= × ×
= × × )) / ]
(
, , , , , , ,
, ,
2
2 2
2
F
m m m m
my
v ca in ca in O ca in N ca in
O ca inO
= − −
22 2
22 2
, ,
, ,, ,
,
)
( )
ca in O
dryair
N ca inN ca in N
dryair
v ca
M
M
my M
M
m
×
×
,, , , , , ,
, ,
,
out v ca in v ca gen v memb
O ca ca v ca
v ca
m m m
p P p
p
= + −
= −
=
2
φcca sat stp T× ( )
(20)
The cathode partial pressure of water vapor can be calculated as in equation (21). Vapor saturation pressure is calculated using equation (7), which is function of stack temperature.
m M n I F
m M n I
O react O cell st
v ca gen H O cell st
2 2
2
4,
, ,
[( ) / ]
[(
= × ×
= × × )) / ]
(
, , , , , , ,
, ,
2
2 2
2
F
m m m m
my
v ca in ca in O ca in N ca in
O ca inO
= − −
22 2
22 2
, ,
, ,, ,
,
)
( )
ca in O
dryair
N ca inN ca in N
dryair
v ca
M
M
my M
M
m
×
×
,, , , , , ,
, ,
,
out v ca in v ca gen v memb
O ca ca v ca
v ca
m m m
p P p
p
= + −
= −
=
2
φcca sat stp T× ( ) (21)
MEMBRANE HYDRATION MODEL
The self-humidifying membrane model represents the water content in the membrane and mass flow rate of water through the membrane. It is assumed that the water content and the mass flow rate is equilibrium over the surface of the membrane. The water content and mass flow rate of water
FIGURE 5. Cathode block diagram
Since the stack is an open cathode, the cathode is exposed to ambient air. Thus, the ambient air is used as feed to the inlet of the cathode model. The total inlet cathode mass flow rate is the total amount of flow rate of oxygen, nitrogen, and water vapor, which depend on ambient conditions as shown in equation (8). The inlet cathode mass flow rate was calculated based on (9).
m n MWca in ca in air, ,= × (8)
m m m mca in O ca in N ca in v ca in, , , , , ,= + +2 2 (9)
where, n x S I n F
x p
ca in v ca in cell
v ca in v
, , ,
, , ,
[( ) /( . )]]= − × × × ×
=
1 4 0 21/[1
cca in ambP, /
While, the cathode outlet flow rate consists of cathode gas to eliminate unreacted oxygen gas, inert nitrogen gas, and water vapor to the surroundings. The total outlet cathode mass flow rate can be calculated as shown in equation (10).
m m m mca out O ca out N ca out v ca out, , , , , , ,= + +2 2 (10)
Thus, the overall equations for oxygen, nitrogen, and water vapor at the cathode side, are shown in equations (11), (12) and (13), respectively.
5
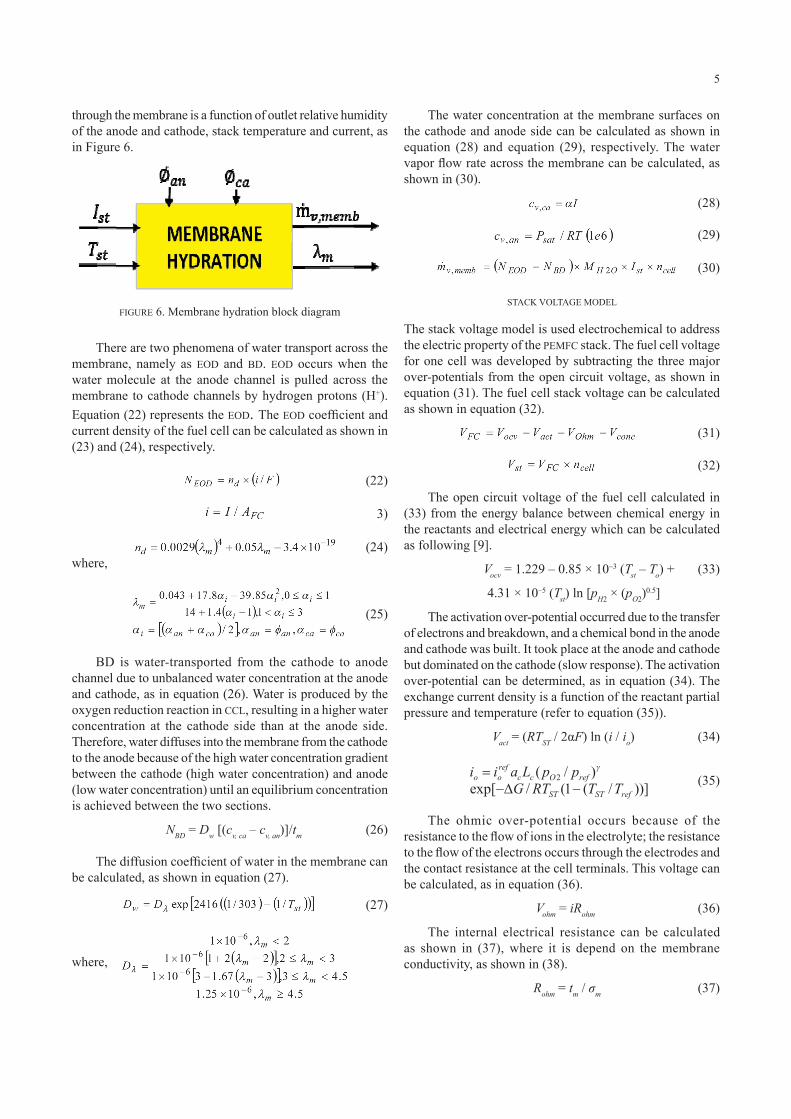
through the membrane is a function of outlet relative humidity of the anode and cathode, stack temperature and current, as in Figure 6.
The water concentration at the membrane surfaces on the cathode and anode side can be calculated as shown in equation (28) and equation (29), respectively. The water vapor flow rate across the membrane can be calculated, as shown in (30).
(28)
(29)
(30)
STACK VOLTAGE MODEL
The stack voltage model is used electrochemical to address the electric property of the PEMFC stack. The fuel cell voltage for one cell was developed by subtracting the three major over-potentials from the open circuit voltage, as shown in equation (31). The fuel cell stack voltage can be calculated as shown in equation (32).
(31)
(32)
The open circuit voltage of the fuel cell calculated in (33) from the energy balance between chemical energy in the reactants and electrical energy which can be calculated as following [9].
Vocv = 1.229 – 0.85 × 10⁻³ (Tst – To) + (33)
4.31 × 10⁻⁵ (Tst) ln [pH2 × (pO2)0.5]
The activation over-potential occurred due to the transfer of electrons and breakdown, and a chemical bond in the anode and cathode was built. It took place at the anode and cathode but dominated on the cathode (slow response). The activation over-potential can be determined, as in equation (34). The exchange current density is a function of the reactant partial pressure and temperature (refer to equation (35)).
Vact = (RTST / 2αF) ln (i / io) (34)
i i a L p pG RT T T
o oref
c c O ref
ST ST ref
=−∆ −
( / )exp[ / ( ( / ))]
2
1
γ
(35)
The ohmic over-potential occurs because of the resistance to the flow of ions in the electrolyte; the resistance to the flow of the electrons occurs through the electrodes and the contact resistance at the cell terminals. This voltage can be calculated, as in equation (36).
Vohm = iRohm (36)
The internal electrical resistance can be calculated as shown in (37), where it is depend on the membrane conductivity, as shown in (38).
Rohm = tm / σm (37)
FIGURE 6. Membrane hydration block diagram
There are two phenomena of water transport across the membrane, namely as EOD and BD. EOD occurs when the water molecule at the anode channel is pulled across the membrane to cathode channels by hydrogen protons (H+). Equation (22) represents the EOD. The EOD coefficient and current density of the fuel cell can be calculated as shown in (23) and (24), respectively.
(22)
3)
(24)where,
(25)
BD is water-transported from the cathode to anode channel due to unbalanced water concentration at the anode and cathode, as in equation (26). Water is produced by the oxygen reduction reaction in CCL, resulting in a higher water concentration at the cathode side than at the anode side. Therefore, water diffuses into the membrane from the cathode to the anode because of the high water concentration gradient between the cathode (high water concentration) and anode (low water concentration) until an equilibrium concentration is achieved between the two sections.
NBD = Dw [(cv, ca – cv, an)]/tm (26)
The diffusion coefficient of water in the membrane can be calculated, as shown in equation (27).
(27)
where,
6
σm = (0.005139 λm – 0.003260)exp [2416(1 / 303) – (1 / Tst))]
(38)
Membrane conductivity can be calculated using the membrane water content, as shown in equation (25), and the temperature of the stack. The concentration over-potential occurs due to a decrease in the concentration of the reactants at the electrode-electrolyte interface. A steady supply of the reactants is required at the electrode-electrolyte interface to maintain the flow of electric current.
Due to the diffusion or convection issues in the electrolyte, the concentration of the reactants is no maintained at the initial level. This concentration over-potential can be determined as shown in equation (39).
Vconc = (RTST / 2 F) ln [il / (il – i)] (39)
The derived and developed equations above are implemented via using Matlab-Simulink tools in order to determine the pressures of hydrogen and oxygen in the anode and cathode respectively, to determine the output voltage of PEMFC stack.
SIMULATION RESULT AND DISUSSION
INITIAL VALIDATION PEMFC STACK MODEL
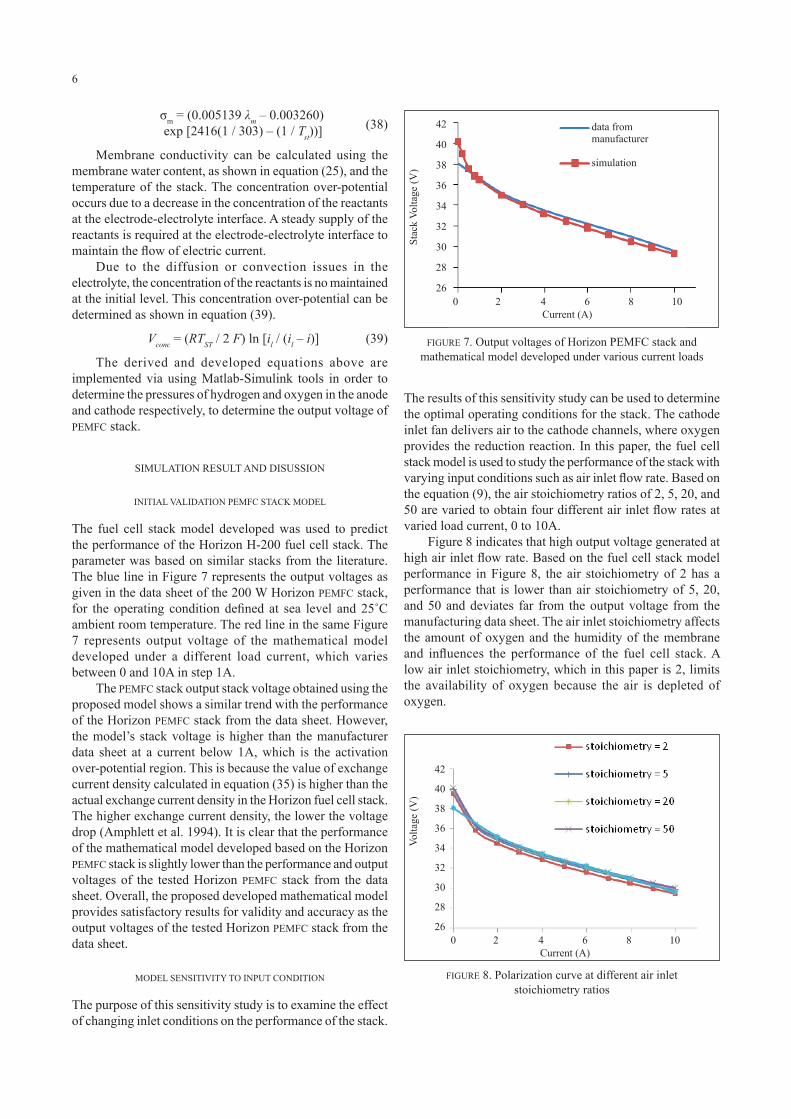
The fuel cell stack model developed was used to predict the performance of the Horizon H-200 fuel cell stack. The parameter was based on similar stacks from the literature. The blue line in Figure 7 represents the output voltages as given in the data sheet of the 200 W Horizon PEMFC stack, for the operating condition defined at sea level and 25˚C ambient room temperature. The red line in the same Figure 7 represents output voltage of the mathematical model developed under a different load current, which varies between 0 and 10A in step 1A.
The PEMFC stack output stack voltage obtained using the proposed model shows a similar trend with the performance of the Horizon PEMFC stack from the data sheet. However, the model’s stack voltage is higher than the manufacturer data sheet at a current below 1A, which is the activation over-potential region. This is because the value of exchange current density calculated in equation (35) is higher than the actual exchange current density in the Horizon fuel cell stack. The higher exchange current density, the lower the voltage drop (Amphlett et al. 1994). It is clear that the performance of the mathematical model developed based on the Horizon PEMFC stack is slightly lower than the performance and output voltages of the tested Horizon PEMFC stack from the data sheet. Overall, the proposed developed mathematical model provides satisfactory results for validity and accuracy as the output voltages of the tested Horizon PEMFC stack from the data sheet.
MODEL SENSITIVITY TO INPUT CONDITION
The purpose of this sensitivity study is to examine the effect of changing inlet conditions on the performance of the stack.
The results of this sensitivity study can be used to determine the optimal operating conditions for the stack. The cathode inlet fan delivers air to the cathode channels, where oxygen provides the reduction reaction. In this paper, the fuel cell stack model is used to study the performance of the stack with varying input conditions such as air inlet flow rate. Based on the equation (9), the air stoichiometry ratios of 2, 5, 20, and 50 are varied to obtain four different air inlet flow rates at varied load current, 0 to 10A.
Figure 8 indicates that high output voltage generated at high air inlet flow rate. Based on the fuel cell stack model performance in Figure 8, the air stoichiometry of 2 has a performance that is lower than air stoichiometry of 5, 20, and 50 and deviates far from the output voltage from the manufacturing data sheet. The air inlet stoichiometry affects the amount of oxygen and the humidity of the membrane and influences the performance of the fuel cell stack. A low air inlet stoichiometry, which in this paper is 2, limits the availability of oxygen because the air is depleted of oxygen.
FIGURE 7. Output voltages of Horizon PEMFC stack and mathematical model developed under various current loads
0 2 4 6 8 10Current (A)
42
40
38
36
34
32
30
28
26
Stac
k Vo
ltage
(V)
data frommanufacturer
simulation
0 2 4 6 8 10Current (A)
42
40
38
36
34
32
30
28
26
Volta
ge (V
)
FIGURE 8. Polarization curve at different air inlet stoichiometry ratios
7
Table 1 indicates the mean absolute percentage error (MAPE) to measure the size of the percentage error of voltage from the simulation with the voltage in the manufacturing data sheet. Lowest MAPE value illustrate that the generated output voltage from the simulation is closer to the output voltage from manufacturing data sheet. Thus, air inlet stoichiometry of 20 gives the lowest MAPE with 1.29%, and is the optimum air inlet stoichiometry for this fuel cell stack model.
TABLE 1. Mean absolute percentage error of voltage from simulation with manufacturing data sheet
Air stoichiometry Mean absolute percentage error (%)
2 1.995 1.4220 1.2950 1.30
In addition, the sufficient air stoichiometry for the H-200 PEMFC stack is above 20, as stated in a study from Strahl et al. (2014). However, Figure 8 shows that the air inlet stoichiometry that is greater than 5 is enough to get high output voltage. However, as stated earlier, it needs above 20 air inlet stoichiometry to get the high fuel cell stack performance. This is due to the dual function of the fan, which supplies oxygen for the reaction and cooling system, which is not studied in this paper.
EFFECT OF RELATIVE HUMIDITY ON PERFORMANCE ON PEMFC STACK MODEL
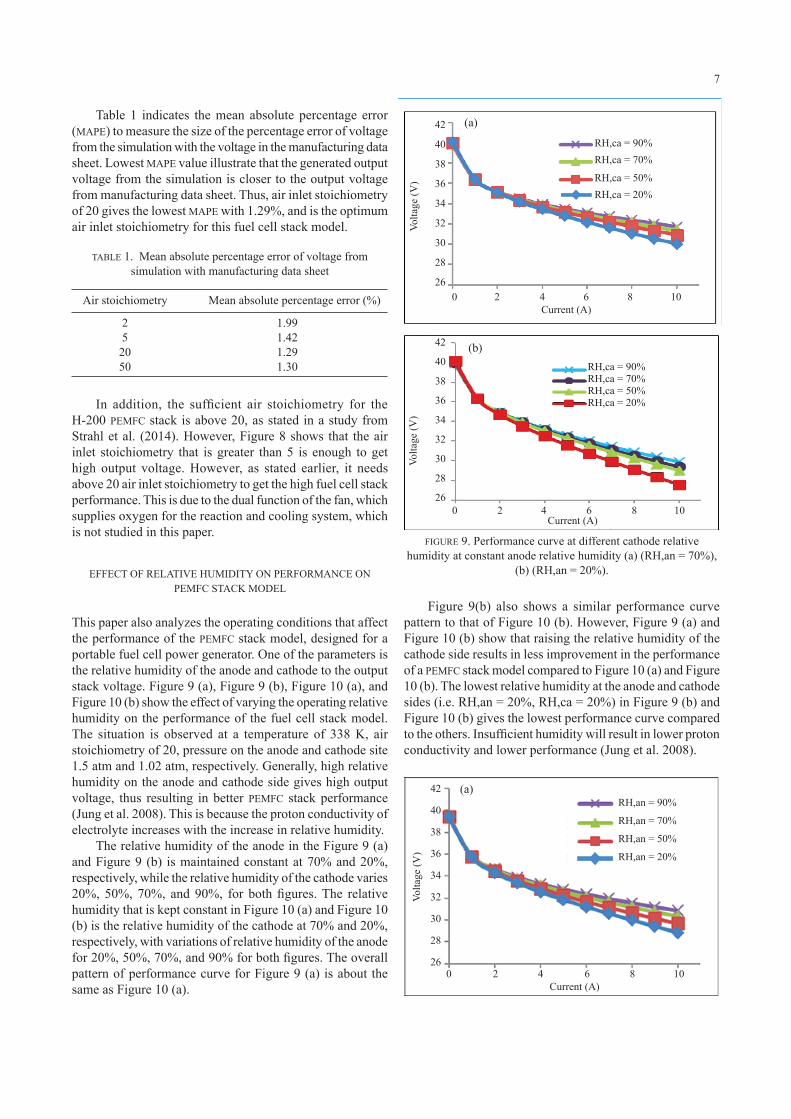
This paper also analyzes the operating conditions that affect the performance of the PEMFC stack model, designed for a portable fuel cell power generator. One of the parameters is the relative humidity of the anode and cathode to the output stack voltage. Figure 9 (a), Figure 9 (b), Figure 10 (a), and Figure 10 (b) show the effect of varying the operating relative humidity on the performance of the fuel cell stack model. The situation is observed at a temperature of 338 K, air stoichiometry of 20, pressure on the anode and cathode site 1.5 atm and 1.02 atm, respectively. Generally, high relative humidity on the anode and cathode side gives high output voltage, thus resulting in better PEMFC stack performance (Jung et al. 2008). This is because the proton conductivity of electrolyte increases with the increase in relative humidity.
The relative humidity of the anode in the Figure 9 (a) and Figure 9 (b) is maintained constant at 70% and 20%, respectively, while the relative humidity of the cathode varies 20%, 50%, 70%, and 90%, for both figures. The relative humidity that is kept constant in Figure 10 (a) and Figure 10 (b) is the relative humidity of the cathode at 70% and 20%, respectively, with variations of relative humidity of the anode for 20%, 50%, 70%, and 90% for both figures. The overall pattern of performance curve for Figure 9 (a) is about the same as Figure 10 (a).
FIGURE 9. Performance curve at different cathode relative humidity at constant anode relative humidity (a) (RH,an = 70%),
(b) (RH,an = 20%).
0 2 4 6 8 10Current (A)
42
40
38
36
34
32
30
28
26
Volta
ge (V
)
RH,ca = 90%RH,ca = 70%
RH,ca = 50%RH,ca = 20%
Figure 9(b) also shows a similar performance curve pattern to that of Figure 10 (b). However, Figure 9 (a) and Figure 10 (b) show that raising the relative humidity of the cathode side results in less improvement in the performance of a PEMFC stack model compared to Figure 10 (a) and Figure 10 (b). The lowest relative humidity at the anode and cathode sides (i.e. RH,an = 20%, RH,ca = 20%) in Figure 9 (b) and Figure 10 (b) gives the lowest performance curve compared to the others. Insufficient humidity will result in lower proton conductivity and lower performance (Jung et al. 2008).
(a)
0 2 4 6 8 10Current (A)
42
40
38
36
34
32
30
28
26
Volta
ge (V
)
RH,ca = 90%RH,ca = 70%RH,ca = 50%RH,ca = 20%
(b)
(a)
0 2 4 6 8 10Current (A)
42
40
38
36
34
32
30
28
26
Volta
ge (V
)
RH,an = 90%
RH,an = 70%
RH,an = 50%
RH,an = 20%
8
osmotic drag) especially at high current will result membrane dehydration at the anode side. In addition, the extra size and weight of the humidifier is not suitable for a portable fuel cell application as stated earlier. Thus, the open-cathode PEMFC stack and periodical anode purge system in H-200 is fed with highly pure dry hydrogen without humidity, resulting in 0% relative humidity at the inlet of the anode. The initial water concentration at the anode side that is lower than the water concentration at the cathode side will increase the back diffusion rate more than the electro-osmotic drag (Voss et al. 1995).
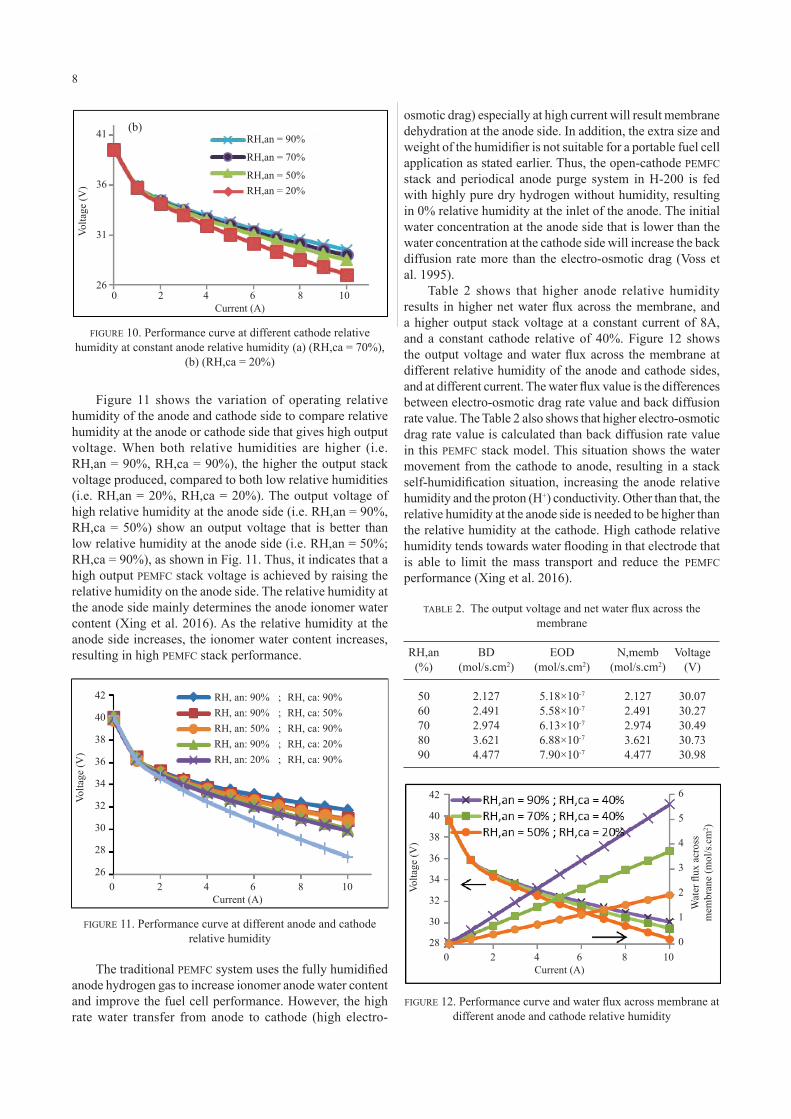
Table 2 shows that higher anode relative humidity results in higher net water flux across the membrane, and a higher output stack voltage at a constant current of 8A, and a constant cathode relative of 40%. Figure 12 shows the output voltage and water flux across the membrane at different relative humidity of the anode and cathode sides, and at different current. The water flux value is the differences between electro-osmotic drag rate value and back diffusion rate value. The Table 2 also shows that higher electro-osmotic drag rate value is calculated than back diffusion rate value in this PEMFC stack model. This situation shows the water movement from the cathode to anode, resulting in a stack self-humidification situation, increasing the anode relative humidity and the proton (H+) conductivity. Other than that, the relative humidity at the anode side is needed to be higher than the relative humidity at the cathode. High cathode relative humidity tends towards water flooding in that electrode that is able to limit the mass transport and reduce the PEMFC performance (Xing et al. 2016).
FIGURE 10. Performance curve at different cathode relative humidity at constant anode relative humidity (a) (RH,ca = 70%),
(b) (RH,ca = 20%)
(b)
0 2 4 6 8 10Current (A)
41
36
31
26
Volta
ge (V
)
RH,an = 90%
RH,an = 70%
RH,an = 50%RH,an = 20%
Figure 11 shows the variation of operating relative humidity of the anode and cathode side to compare relative humidity at the anode or cathode side that gives high output voltage. When both relative humidities are higher (i.e. RH,an = 90%, RH,ca = 90%), the higher the output stack voltage produced, compared to both low relative humidities (i.e. RH,an = 20%, RH,ca = 20%). The output voltage of high relative humidity at the anode side (i.e. RH,an = 90%, RH,ca = 50%) show an output voltage that is better than low relative humidity at the anode side (i.e. RH,an = 50%; RH,ca = 90%), as shown in Fig. 11. Thus, it indicates that a high output PEMFC stack voltage is achieved by raising the relative humidity on the anode side. The relative humidity at the anode side mainly determines the anode ionomer water content (Xing et al. 2016). As the relative humidity at the anode side increases, the ionomer water content increases, resulting in high PEMFC stack performance.
FIGURE 11. Performance curve at different anode and cathode relative humidity
0 2 4 6 8 10Current (A)
42
40
38
36
34
32
30
28
26
Volta
ge (V
)
RH, an: 90% ; RH, ca: 90% RH, an: 90% ; RH, ca: 50% RH, an: 50% ; RH, ca: 90% RH, an: 90% ; RH, ca: 20% RH, an: 20% ; RH, ca: 90%
The traditional PEMFC system uses the fully humidified anode hydrogen gas to increase ionomer anode water content and improve the fuel cell performance. However, the high rate water transfer from anode to cathode (high electro-
TABLE 2. The output voltage and net water flux across the membrane
RH,an BD EOD N,memb Voltage (%) (mol/s.cm2) (mol/s.cm2) (mol/s.cm2) (V)
50 2.127 5.18×10⁻⁷ 2.127 30.0760 2.491 5.58×10⁻⁷ 2.491 30.2770 2.974 6.13×10⁻⁷ 2.974 30.4980 3.621 6.88×10⁻⁷ 3.621 30.7390 4.477 7.90×10⁻⁷ 4.477 30.98
FIGURE 12. Performance curve and water flux across membrane at different anode and cathode relative humidity
0 2 4 6 8 10Current (A)
42
40
38
36
34
32
30
28
Volta
ge (V
)
6
5
4
3
2
1
0
Wat
er fl
ux a
cros
sm
embr
ane
(mol
/s.c
m2 )
9
CONCLUSION
A simplified zero-dimensional mathematical model of PEMFC has been developed based on the 200 W Horizon stack by modeling that major electric and thermodynamic variables and parameters involved in the operation of the PEMFC, along with the influence of the environment and conditions of the fuel cell operation. Initial test results are presented in this work. The performance of the proposed model is validated with the performance from the data sheet of the Horizon PEMFC stack. In the sensitivity of the fuel cell stack model, air stoichiometry above 15 is sufficient to get a high air inlet flow rate and show the high stack performance. Furthermore, an increase in the anode relative humidity rather than an increase in cathode relative humidity gets a high output stack voltage. However, other block models such as the thermal model, auxiliary components such as purge valve, fan, and hydrogen supply valve can enhance the accuracy of the proposed developed model for future research.
ACKNOWLEDGMENTS
A part of this study was supported by Universiti Kebangsaan Malaysia (UKM) from grants GUP-2016-043 and UKM–YSD Research Project under code KK-2014-013.
REFERENCES
Amphlett, J.C., Baumert, R.M., Mann, R.F., Peppley, B.A., Roberge, P.A. & Rodrigues, A. 1994. Parametric modelling of the performance of a 5-KW proton-exchange membrane fuel cell stack. Journal of Power Sources 49(1-3): 349-56.
Enearu, O., Chen, Y.K. & Kalyvas, C. 2017. A new approach to modelling of pemfc flow field. ICMIC (9th International Conference on Modelling, Identification and Control) 2017, IEEE Conference; 958-64.
Ge, S.-H. & Yi. B.-L. 2003. A mathematical model for pemfc in different flow modes. Journal of Power Sources 124(1): 1-11.
Heinzel, A., Hebling, C., Müller, M., Zedda, M. & Müller., C. 2002. Fuel cells for low power applications. Journal of Power Sources 105(2): 250-55.
Ishaku, J., Nima, L., Hesam, Z. & Robert, G.L. 2014. Control-oriented modeling for open-cathode fuel cell systems. ACC (American Control Conference) 2014, IEEE Conference 268-73.
Jiao, J., Chen, F.,Yu, Y., He, J. & Chen, X. 2017. Modeling and simulation of pemfc stack dynamic performance. CAC (Chinese Automation Congress) 2017, IEEE Conference 2871-76.
Jung, G.B., Kai, F.L., Ay, S., Feng, B.W., Cheng, H.T., Teng, F.Y. & Shih, H.C. 2008. Experimental evaluation of an ambient forced-feed air-supply pem fuel cell. International Journal of Hydrogen Energy 33(12): 2980-85.
Kamarudin, S. K., Daud, W.R.W., Som, A.M. & Masdar, M. S. 2007. Conceptual design of 5 kW pem fuel cell stack. Jurnal Kejuruteraan 19: 43-54.
Kamarudin, S.K., Achmad, F. & Daud, W.R.W. 2009. Overview on the application of direct methanol fuel cell (DMFC) for portable electronic devices. International Journal of Hydrogen Energy 34(16): 6902-16.
Kennedy, D.M., Donald, R.C., Wenhua, H.Z., Kenneth, C.W., Mark, R.N. & Bruce J.T. 2007. Fuel cell cathode air filters: methodologies for design and optimization. Journal of Power Sources 168(2): 391-99.
Larminie, J., Dicks, A. & McDonald, M.S. 2003. Fuel cell systems explained. 2nd ed. Chichester,UK: John Wiley & Sons Ltd.
Pukrushpan, J.T., Anna, G.S. & Huei, P. 2004. Fuel cell system model: fuel cell stack. Control of fuel cell power system, Springer London: 31-56.
Rahman, H.A., Andanastuti Muchtar, A., Muhamad, N. & Abdullah, H. 2010. Komposit La1-x Srx Co1-y Fey O3-δ (LSCF) sebagai bahan katod tahan lama bagi sel fuel oksida pejal bersuhu sederhana-rendah: Ulasan kajian. Jurnal Kejuruteraan 22: 1-10.
Rahman, S.N.A., Masdar, M.S., Rosli, M.I., Majlan, E.H., Husaini, T., Kamarudin, S.K. & Daud, W.R.W. 2016. Overview biohydrogen technologies and application in fuel cell technology. Renewable and Sustainable Energy Reviews 66: 137-62.
Rahman, S.N.A., Masdar, M.S., Rosli, M.I., Majlan, E.H., & Husaini, T. 2016. Portable pem fuel cell system: water and heat management. Journal of Science and Technology, 11;102-116.
Sharma, M., Pachauri, R. K. & Goel., S. K. 2015. MATLAB/Simulink modeling and analysis of parametric effects on pemfc performance. RDCAPE (International Conference on Recent Developments in Control, Automation and Power Engineering) 226-31.
Strahl, S., Husar, A. & Riera, J. 2014. Experimental study of hydrogen purge effects on performance and efficiency of an open-cathode proton exchange membrane fuel cell system. Journal of Power Sources 248: 474-82.
Voss, H.H., Wilkinson, D.P., Pickup, P.G., Johnson, M.C. & Basura, V. 1995. Anode water removal: a water management and diagnostic technique for solid polymer fuel cells. Electrochimica Acta 40 (3): 321-28.
Xing, L., Cai, Q., Xu, C., Liu, C., Scott, K. & Yan, Y. 2016. Numerical study of the effect of relative humidity and stoichiometric flow ratio on pem (proton exchange membrane) fuel cell performance with various channel lengths: An anode partial flooding modelling. Energy 106: 631-45.
Yu, X., Zhou, B. & Sobiesiak, A. 2005. Water and thermal management for ballard pem fuel cell stack. Journal of Power Source 147(1): 184-95.
Zhang, L., Xu, D. & Hurley, W.G. 2010. Modelling and simulation of a portable fuel cell system. EPE-PEMC (14th International Power Electronics and Motion Control Conference) 2010, IEEE Conference; T12-96.

10
Zhong, C. & Li., S. 2016. Control strategies for the air supply system in pemfc. CCC (35th Chinese Control Conference) 2016, IEEE Conference 4336-41.
Siti Najibah Abd RahmanFuel Cell Institute, Universiti Kebangsaan Malaysia, Bangi, Malaysia
*Mohd Shahbudin Masdar
Fuel Cell Institute, Universiti Kebangsaan Malaysia,Programme for Chemical Engineering,Research Center for Sustainable Process Technology (CESPRO),Faculty of Engineering & Built Environment, Universiti Kebangsaan Malaysia,Bangi, Malaysia
Masli Irwan RosliFuel Cell Institute, Universiti Kebangsaan Malaysia,Programme for Chemical Engineering,Research Center for Sustainable Process Technology (CESPRO),Faculty of Engineering & Built Environment, Universiti Kebangsaan Malaysia,Bangi, Malaysia
Edy Herianto MajlanFuel Cell Institute, Universiti Kebangsaan Malaysia, Bangi, Malaysia
T. HusainiFuel Cell Institute, Universiti Kebangsaan Malaysia, Bangi, Malaysia
*Corresponding author; email: [email protected]
Received date: 10th July 2018Accepted date: 13th September 2018Online first date: 1st October 2018Published date: 30th November 2018