shahid lecture-5- mkag1273
TRANSCRIPT
MAL1303: Statistical Hydrology
Correlation
Dr. Shamsuddin ShahidDepartment of Hydraulics and Hydrology
Faculty of Civil Engineering, Universiti Teknologi MalaysiaRoom No. M46-332; E-mail: [email protected]
Mobile: 0182051586
11/23/2015 Shamsuddin Shahid, FKA, UTM
You created this PDF from an application that is not licensed to print to novaPDF printer (http://www.novapdf.com)
Research Questions: Are two variables related?
Example questions in hydrology:– “Is there any relation between rainfall and river
discharge?”– “Is there any relation between low river flow and river
water quality?”– “Is there any relation between elevation and rainfall?”– “Is there any relation between rainfall intensity and
landslides?
Test the relationship: Correlation
11/23/2015 Shamsuddin Shahid, FKA, UTM
You created this PDF from an application that is not licensed to print to novaPDF printer (http://www.novapdf.com)
Correlation
Definition: Correlation is a statistical method that is used toexamine the extent to which two variables have a simple linearrelationship.
Questions: What does it mean to say that two variables are associated with
one another?
How can we mathematically formalize the concept ofassociation?
Answer:Correlation
11/23/2015 Shamsuddin Shahid, FKA, UTM
You created this PDF from an application that is not licensed to print to novaPDF printer (http://www.novapdf.com)
Correlation gives relationship between two variables:
– direction– Strength– Significance
Sign indicates direction Size indicates strengthComparison with critical values gives significance
Correlation
11/23/2015 Shamsuddin Shahid, FKA, UTM
You created this PDF from an application that is not licensed to print to novaPDF printer (http://www.novapdf.com)
Scatter Plots
• Plot each pair of observations (X, Y)• x = predictor variable (independent)• y = criterion variable (dependent)• Check for:
– outliers– linearity
11/23/2015 Shamsuddin Shahid, FKA, UTM
You created this PDF from an application that is not licensed to print to novaPDF printer (http://www.novapdf.com)
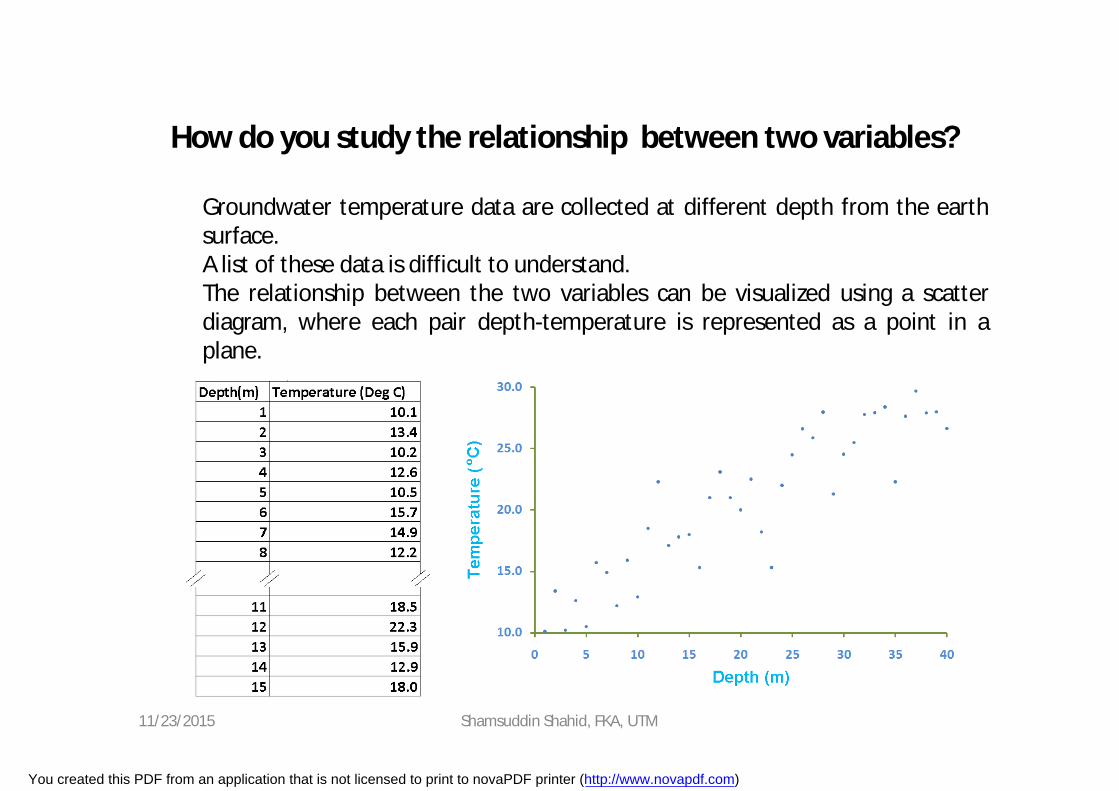
How do you study the relationship between two variables?
Groundwater temperature data are collected at different depth from the earthsurface.A list of these data is difficult to understand.The relationship between the two variables can be visualized using a scatterdiagram, where each pair depth-temperature is represented as a point in aplane.
11/23/2015 Shamsuddin Shahid, FKA, UTM
You created this PDF from an application that is not licensed to print to novaPDF printer (http://www.novapdf.com)
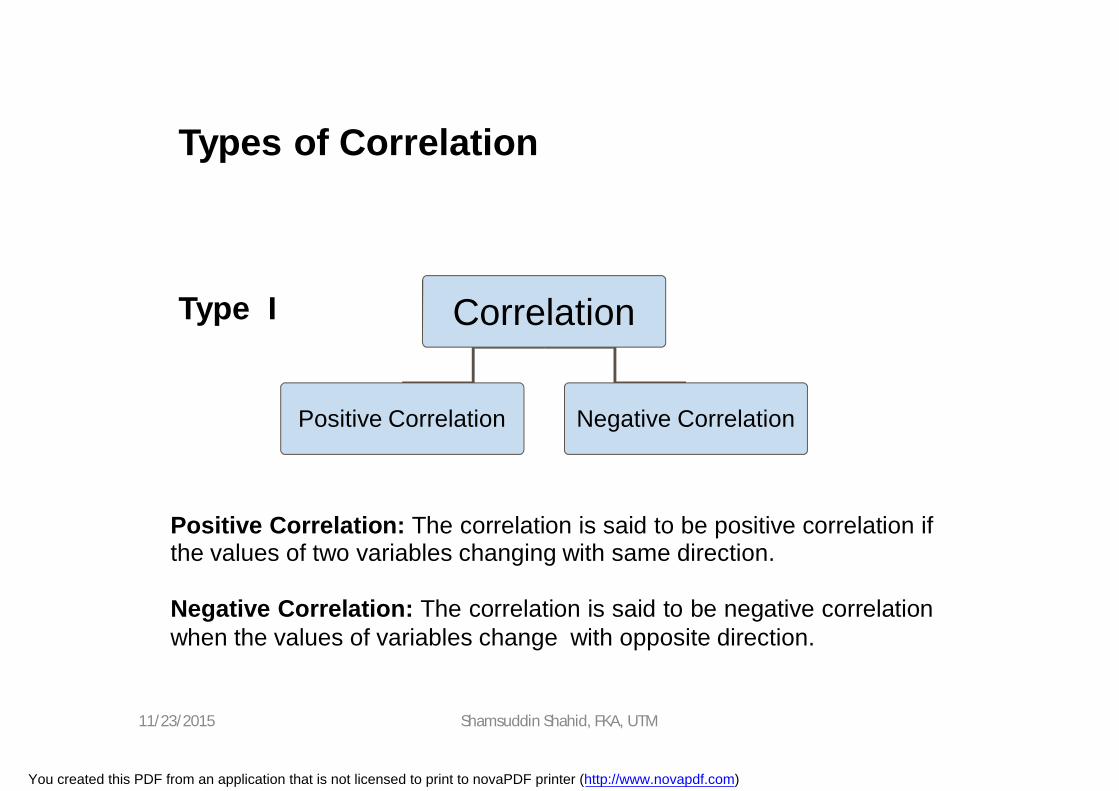
Types of Correlation
Correlation
Positive Correlation Negative Correlation
Positive Correlation: The correlation is said to be positive correlation ifthe values of two variables changing with same direction.
Negative Correlation: The correlation is said to be negative correlationwhen the values of variables change with opposite direction.
Type I
11/23/2015 Shamsuddin Shahid, FKA, UTM
You created this PDF from an application that is not licensed to print to novaPDF printer (http://www.novapdf.com)
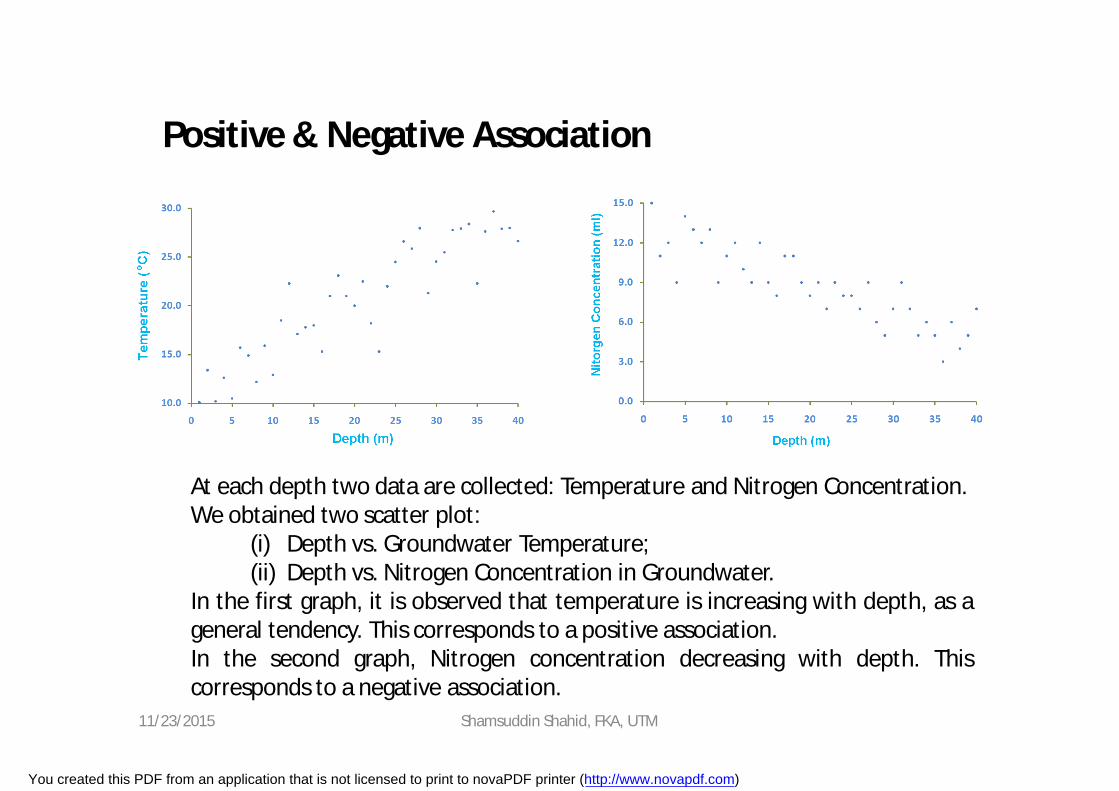
Positive & Negative Association
At each depth two data are collected: Temperature and Nitrogen Concentration.We obtained two scatter plot:
(i) Depth vs. Groundwater Temperature;(ii) Depth vs. Nitrogen Concentration in Groundwater.
In the first graph, it is observed that temperature is increasing with depth, as ageneral tendency. This corresponds to a positive association.In the second graph, Nitrogen concentration decreasing with depth. Thiscorresponds to a negative association.
11/23/2015 Shamsuddin Shahid, FKA, UTM
You created this PDF from an application that is not licensed to print to novaPDF printer (http://www.novapdf.com)

Types of Correlation
Correlation
Simple Multiple
Partial Total
Type II
11/23/2015 Shamsuddin Shahid, FKA, UTM
You created this PDF from an application that is not licensed to print to novaPDF printer (http://www.novapdf.com)
Types of Correlation Type II
• Simple correlation: Under simple correlation problem thereare only two variables are studied.
• Multiple Correlation: Under Multiple Correlation three ormore than three variables are studied.
• Partial correlation: analysis recognizes more than twovariables but considers only two variables keeping the otherconstant.
• Total correlation: is based on all the relevant variables, whichis normally not feasible.
11/23/2015 Shamsuddin Shahid, FKA, UTM
You created this PDF from an application that is not licensed to print to novaPDF printer (http://www.novapdf.com)
Types of Correlation
Correlation
LINEAR NON LINEAR
Type III
11/23/2015 Shamsuddin Shahid, FKA, UTM
You created this PDF from an application that is not licensed to print to novaPDF printer (http://www.novapdf.com)
Types of Correlation Type III
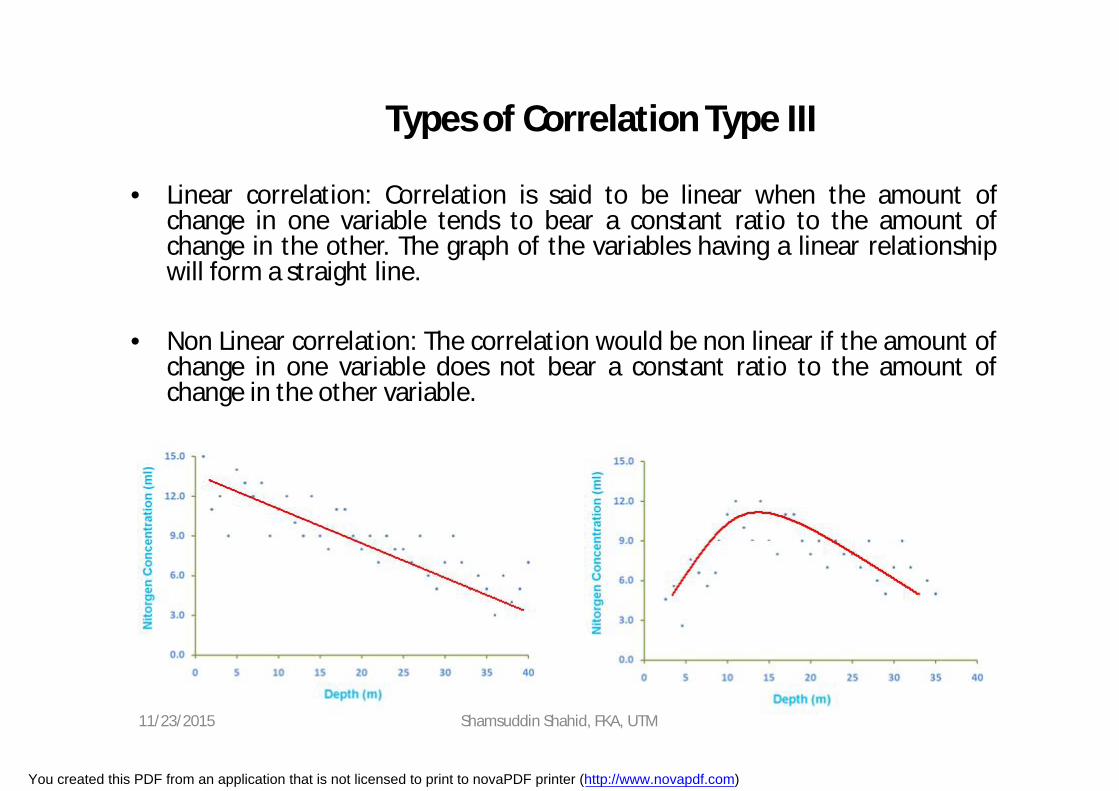
• Linear correlation: Correlation is said to be linear when the amount ofchange in one variable tends to bear a constant ratio to the amount ofchange in the other. The graph of the variables having a linear relationshipwill form a straight line.
• Non Linear correlation: The correlation would be non linear if the amount ofchange in one variable does not bear a constant ratio to the amount ofchange in the other variable.
11/23/2015 Shamsuddin Shahid, FKA, UTM
You created this PDF from an application that is not licensed to print to novaPDF printer (http://www.novapdf.com)
Correlation Coefficient
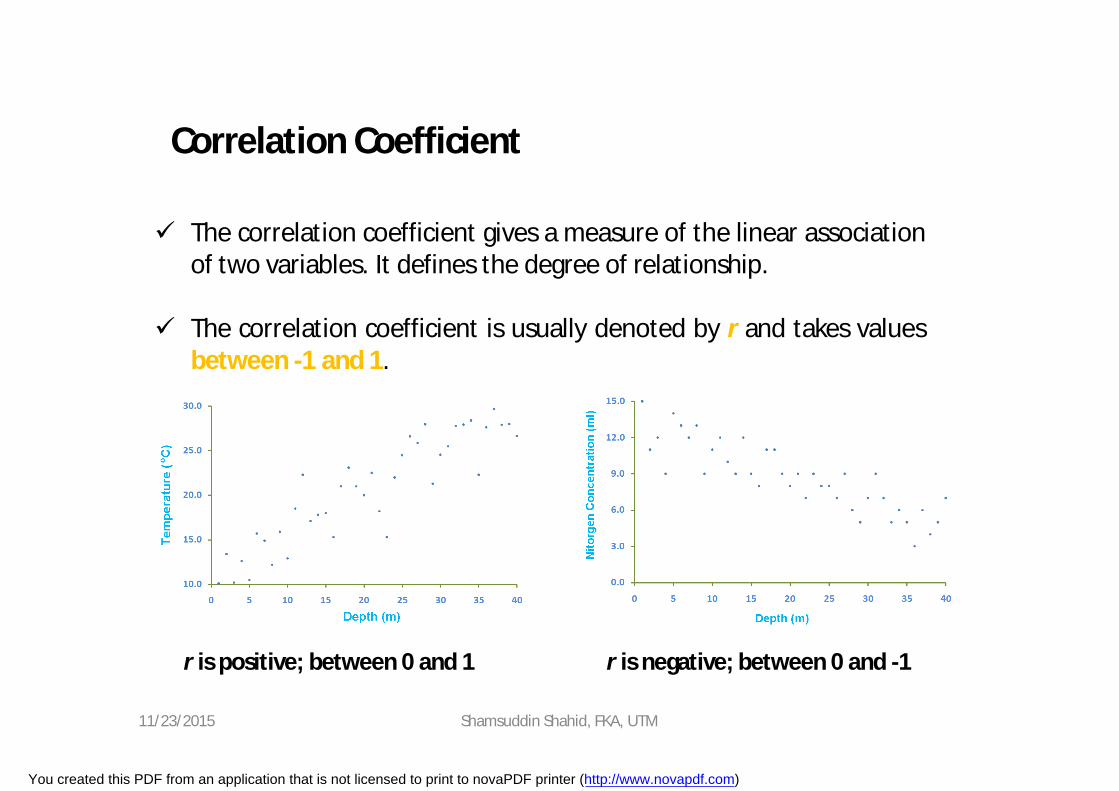
The correlation coefficient gives a measure of the linear associationof two variables. It defines the degree of relationship.
The correlation coefficient is usually denoted by r and takes valuesbetween -1 and 1.
r is positive; between 0 and 1 r is negative; between 0 and -1
11/23/2015 Shamsuddin Shahid, FKA, UTM
You created this PDF from an application that is not licensed to print to novaPDF printer (http://www.novapdf.com)
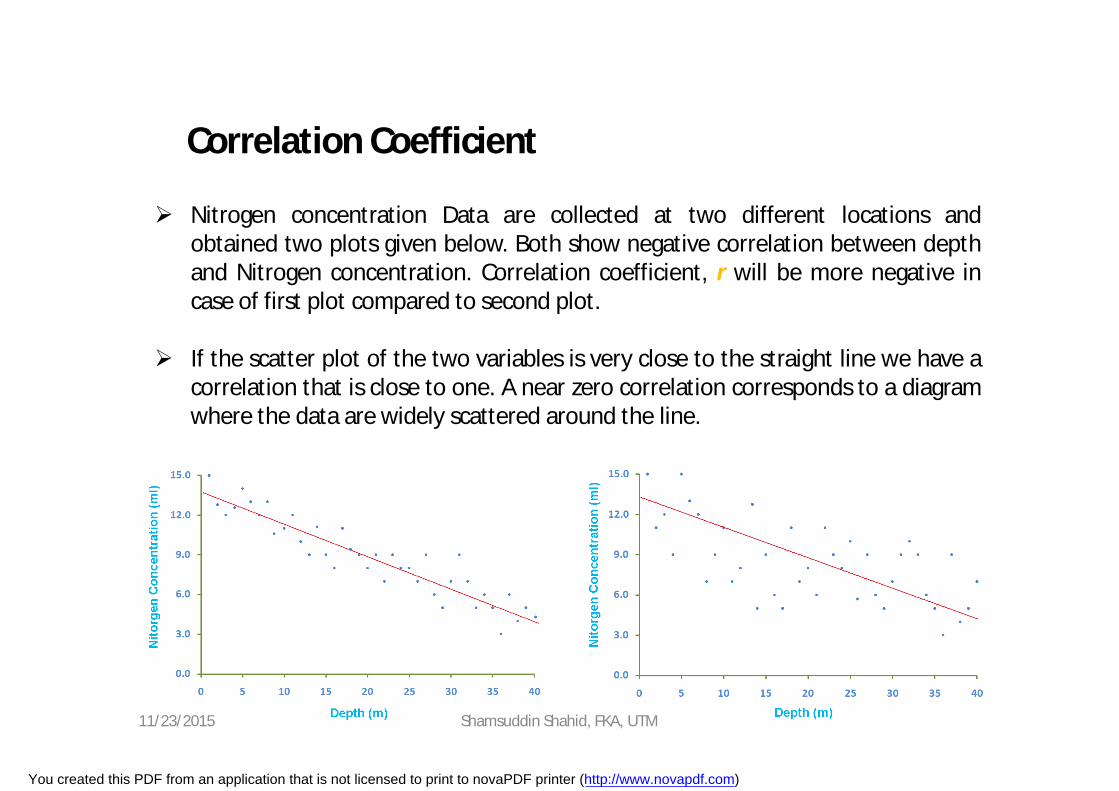
Correlation Coefficient
Nitrogen concentration Data are collected at two different locations andobtained two plots given below. Both show negative correlation between depthand Nitrogen concentration. Correlation coefficient, r will be more negative incase of first plot compared to second plot.
If the scatter plot of the two variables is very close to the straight line we have acorrelation that is close to one. A near zero correlation corresponds to a diagramwhere the data are widely scattered around the line.
11/23/2015 Shamsuddin Shahid, FKA, UTM
You created this PDF from an application that is not licensed to print to novaPDF printer (http://www.novapdf.com)
11/23/2015 Shamsuddin Shahid, FKA, UTM
You created this PDF from an application that is not licensed to print to novaPDF printer (http://www.novapdf.com)
Correlation Coefficient - Summary
A positive coefficient means that the data are clustered around lines with apositive slope. That is, as one variable increases, the other one alsoincreases.
A negative coefficient means that the data are clustered around lines with anegative slope. That is, as one variable increases, the other one decreases.
The closer r is to 1 the stronger the positive linear association between thevariables.
The closer r is to -1 the stronger the negative linear association between thevariables.
When r is equal to or near to 1 or -1 there is a linear association betweenthe variables.
When r is equal to or near to 0, there no association between the variables.11/23/2015 Shamsuddin Shahid, FKA, UTM
You created this PDF from an application that is not licensed to print to novaPDF printer (http://www.novapdf.com)
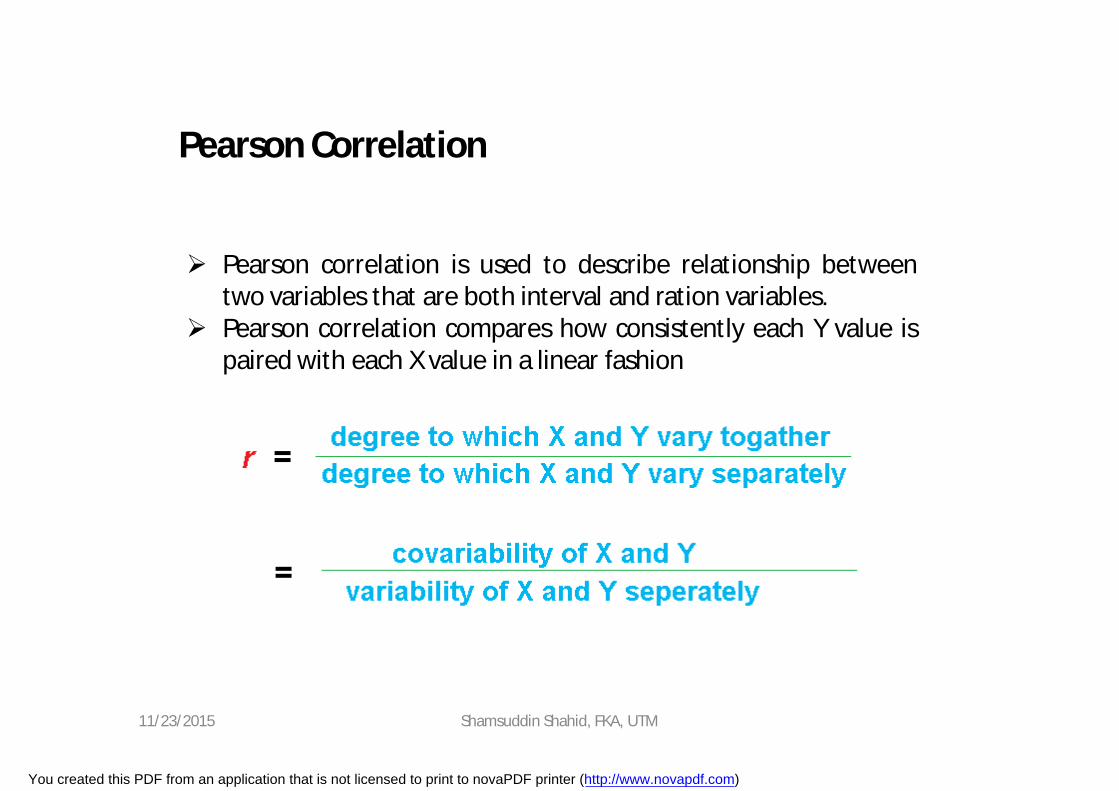
Pearson Correlation
Pearson correlation is used to describe relationship betweentwo variables that are both interval and ration variables.
Pearson correlation compares how consistently each Y value ispaired with each X value in a linear fashion
11/23/2015 Shamsuddin Shahid, FKA, UTM
You created this PDF from an application that is not licensed to print to novaPDF printer (http://www.novapdf.com)
Covariance
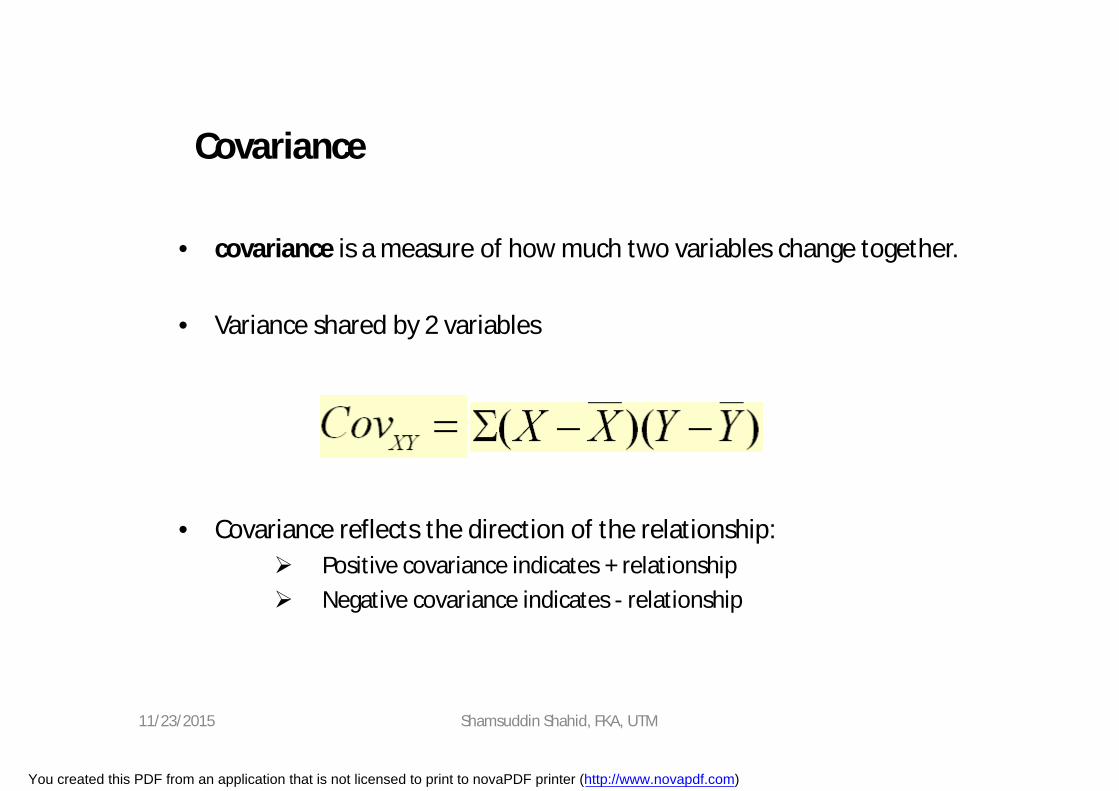
• covariance is a measure of how much two variables change together.
• Variance shared by 2 variables
• Covariance reflects the direction of the relationship: Positive covariance indicates + relationship Negative covariance indicates - relationship
11/23/2015 Shamsuddin Shahid, FKA, UTM
You created this PDF from an application that is not licensed to print to novaPDF printer (http://www.novapdf.com)
Computational Formula
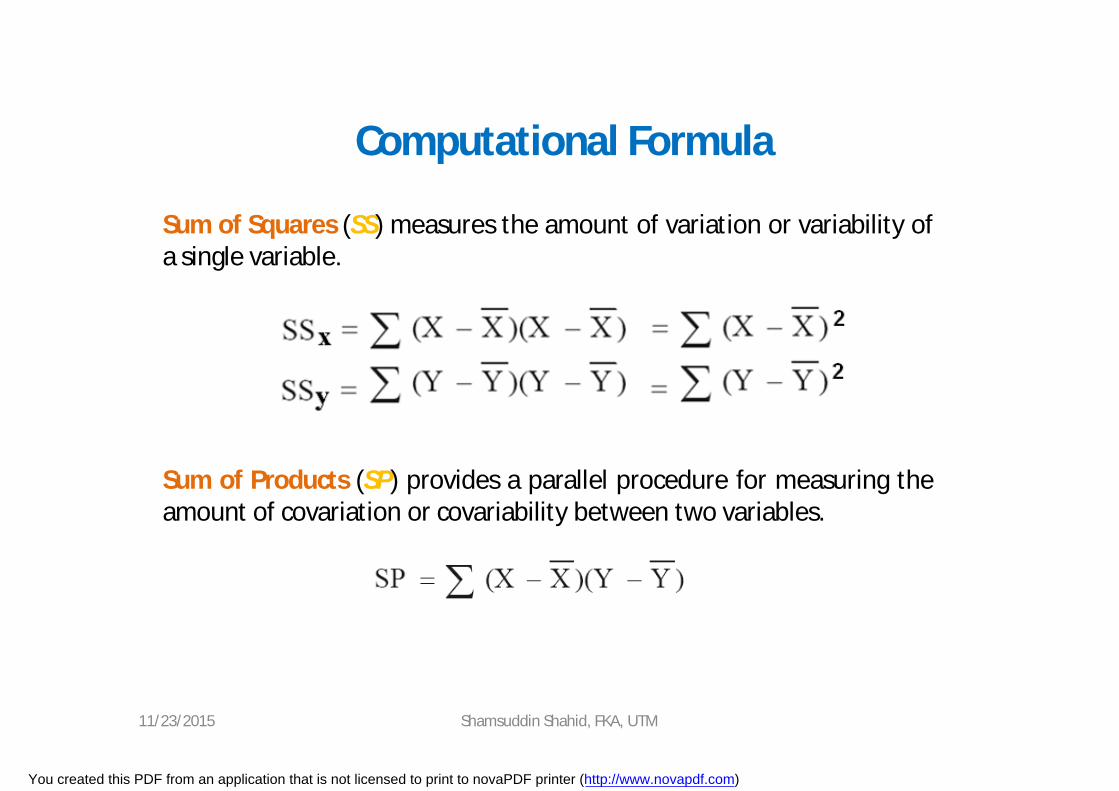
Sum of Squares (SS) measures the amount of variation or variability ofa single variable.
Sum of Products (SP) provides a parallel procedure for measuring theamount of covariation or covariability between two variables.
11/23/2015 Shamsuddin Shahid, FKA, UTM
You created this PDF from an application that is not licensed to print to novaPDF printer (http://www.novapdf.com)
Calculation of Pearson’s Correlation Coefficient
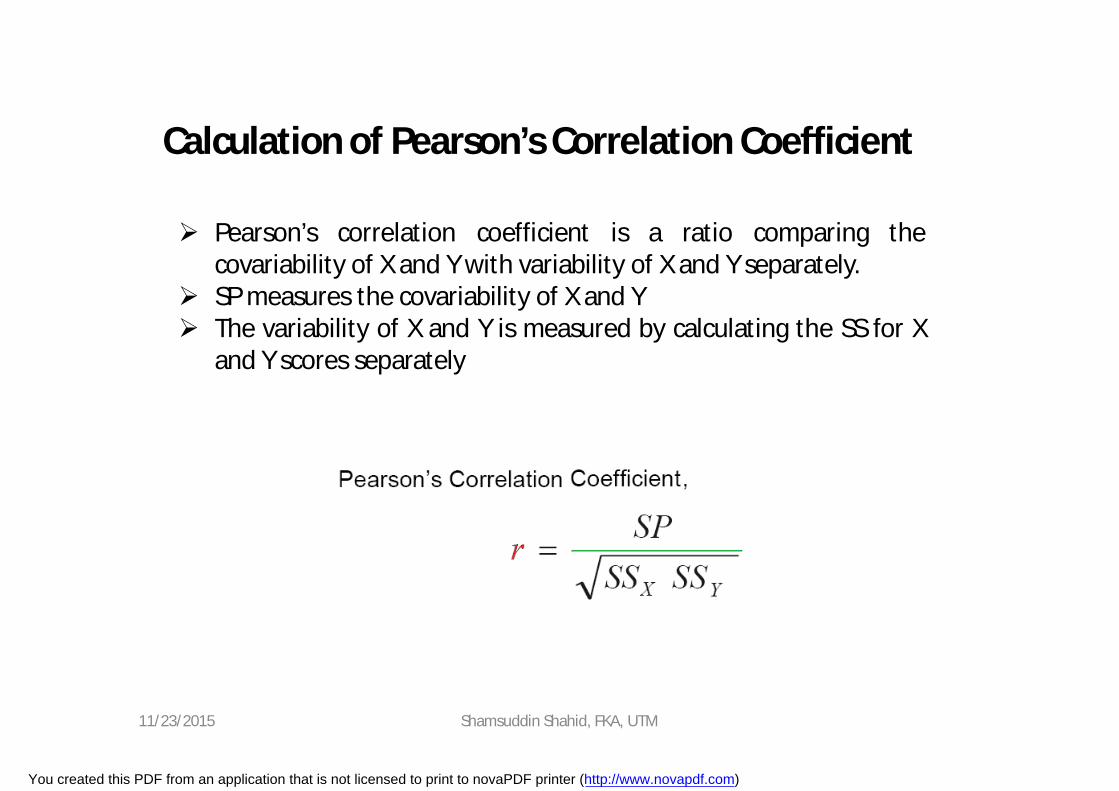
Pearson’s correlation coefficient is a ratio comparing thecovariability of X and Y with variability of X and Y separately.
SP measures the covariability of X and Y The variability of X and Y is measured by calculating the SS for X
and Y scores separately
11/23/2015 Shamsuddin Shahid, FKA, UTM
You created this PDF from an application that is not licensed to print to novaPDF printer (http://www.novapdf.com)
Calculation of Pearson’s Correlation Coefficient
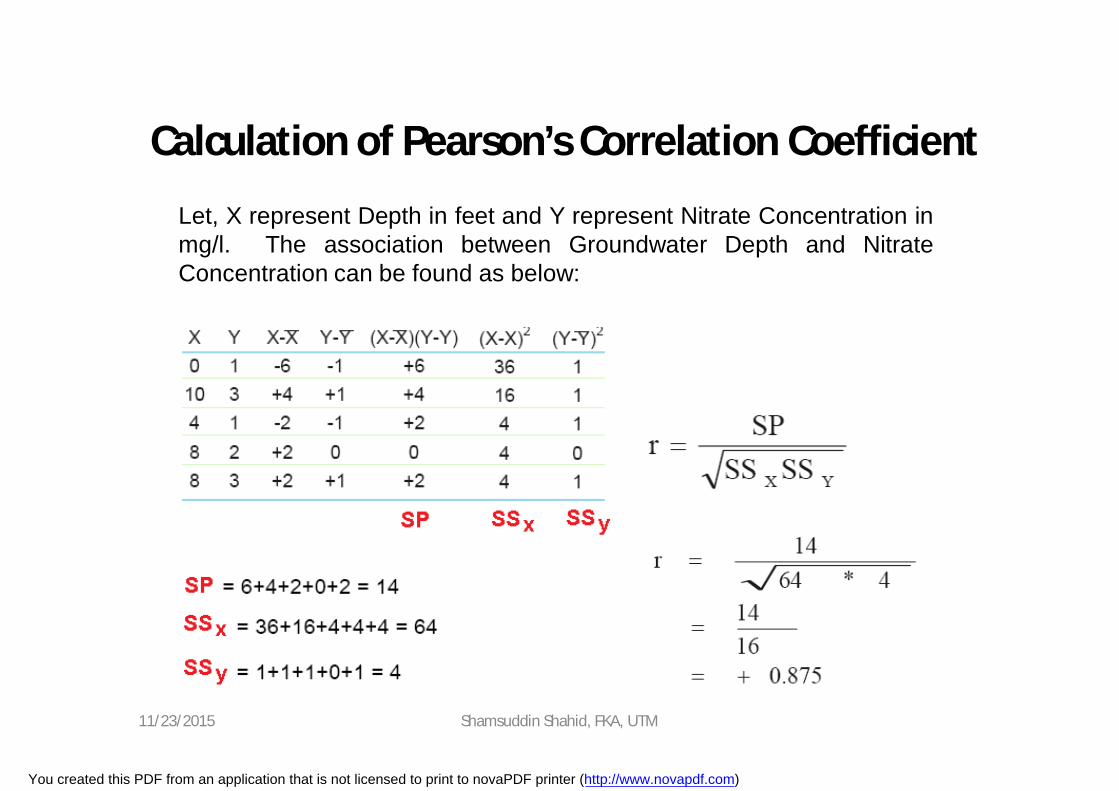
Let, X represent Depth in feet and Y represent Nitrate Concentration inmg/l. The association between Groundwater Depth and NitrateConcentration can be found as below:
11/23/2015 Shamsuddin Shahid, FKA, UTM
You created this PDF from an application that is not licensed to print to novaPDF printer (http://www.novapdf.com)
Hypothesis Testing
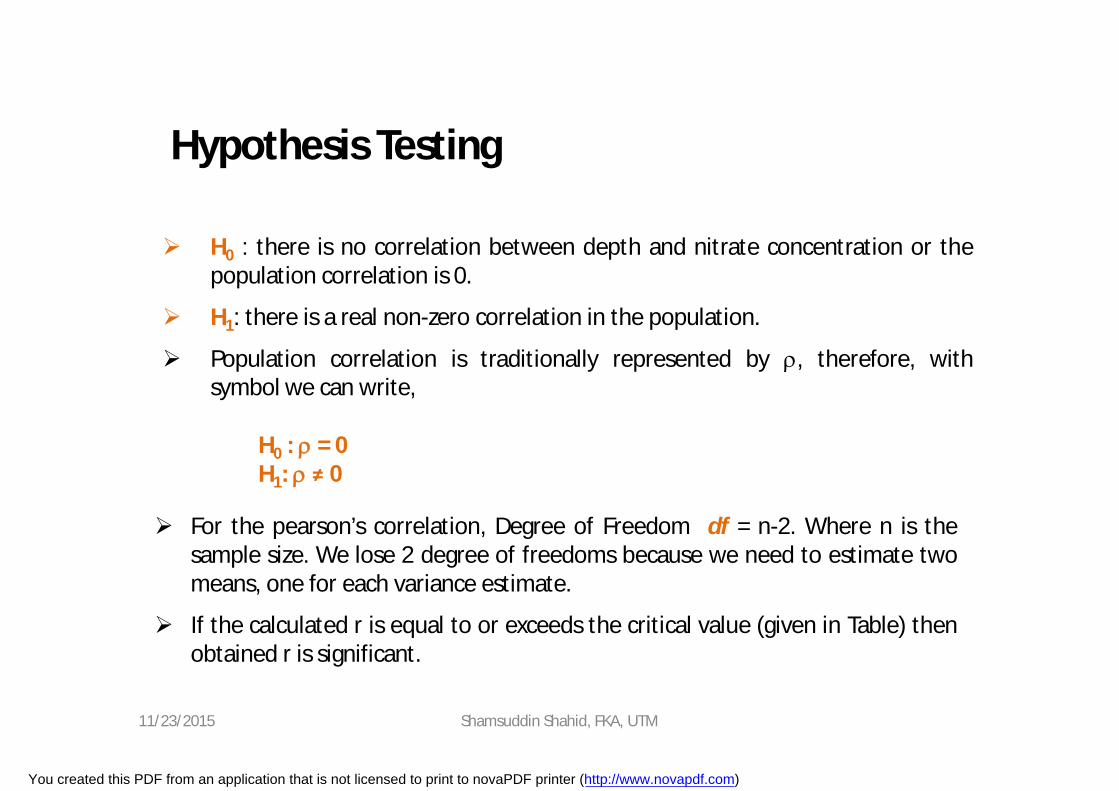
H0 : there is no correlation between depth and nitrate concentration or thepopulation correlation is 0.
H1: there is a real non-zero correlation in the population.
Population correlation is traditionally represented by , therefore, withsymbol we can write,
H0 : = 0H1: ≠ 0
For the pearson’s correlation, Degree of Freedom df = n-2. Where n is thesample size. We lose 2 degree of freedoms because we need to estimate twomeans, one for each variance estimate.
If the calculated r is equal to or exceeds the critical value (given in Table) thenobtained r is significant.
11/23/2015 Shamsuddin Shahid, FKA, UTM
You created this PDF from an application that is not licensed to print to novaPDF printer (http://www.novapdf.com)

Hypothesis Testing
In the present case, r = 0.875
df = n-2= 5-2= 3
Critical value for α = 0.05, df = 3 is 0.878.
Therefore, we accept H0 : = 0
There is no correlation between the populations
11/23/2015 Shamsuddin Shahid, FKA, UTM
You created this PDF from an application that is not licensed to print to novaPDF printer (http://www.novapdf.com)
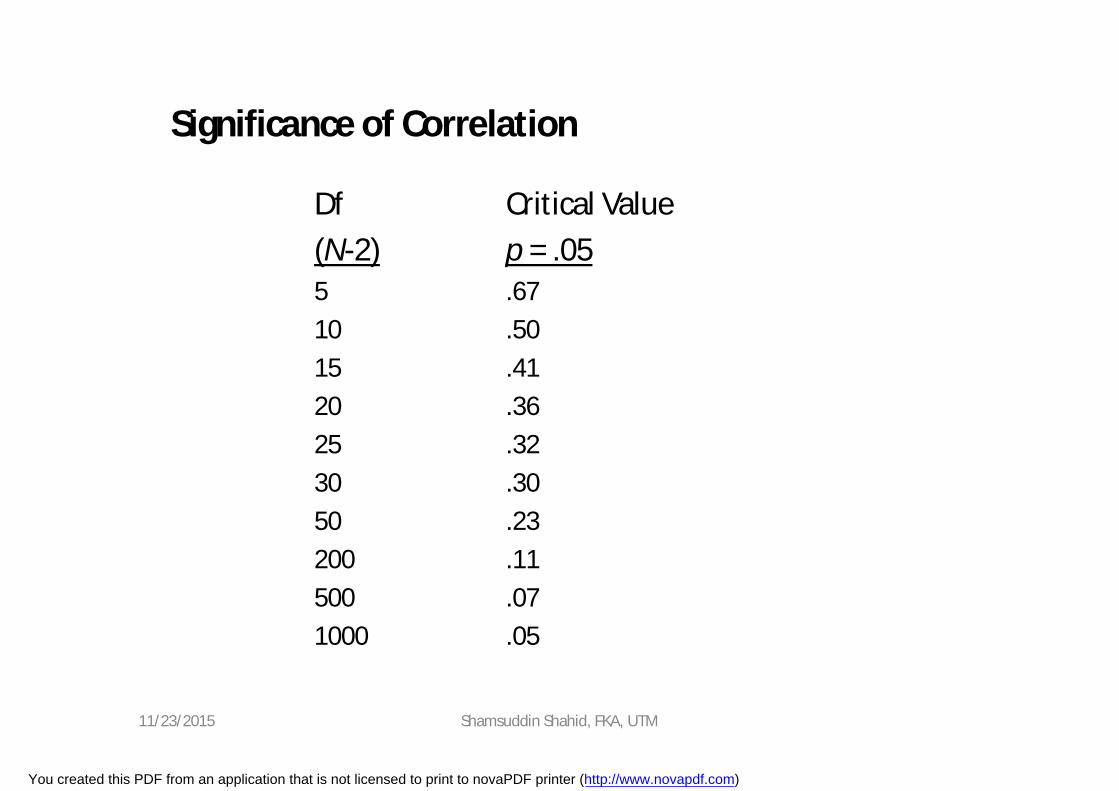
Significance of Correlation
Df Critical Value(N-2) p = .055 .6710 .5015 .4120 .3625 .3230 .3050 .23200 .11500 .071000 .05
11/23/2015 Shamsuddin Shahid, FKA, UTM
You created this PDF from an application that is not licensed to print to novaPDF printer (http://www.novapdf.com)
Correlation: r & r2
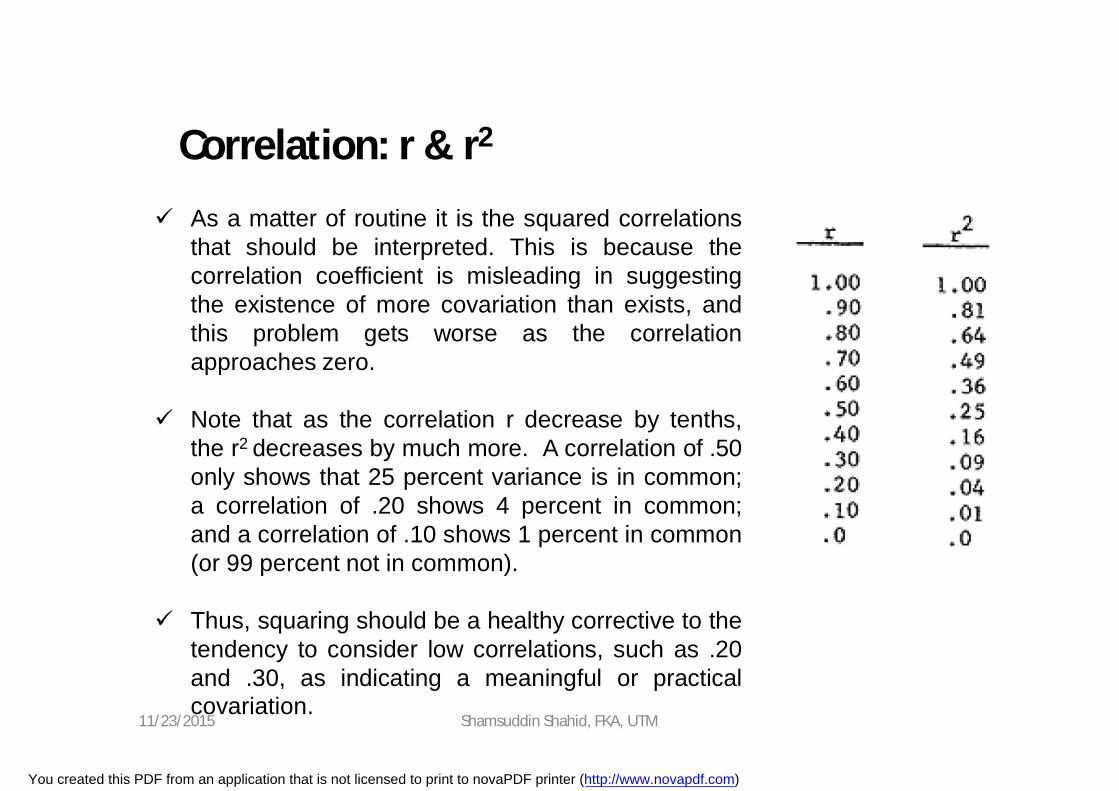
As a matter of routine it is the squared correlationsthat should be interpreted. This is because thecorrelation coefficient is misleading in suggestingthe existence of more covariation than exists, andthis problem gets worse as the correlationapproaches zero.
Note that as the correlation r decrease by tenths,the r2 decreases by much more. A correlation of .50only shows that 25 percent variance is in common;a correlation of .20 shows 4 percent in common;and a correlation of .10 shows 1 percent in common(or 99 percent not in common).
Thus, squaring should be a healthy corrective to thetendency to consider low correlations, such as .20and .30, as indicating a meaningful or practicalcovariation.
11/23/2015 Shamsuddin Shahid, FKA, UTM
You created this PDF from an application that is not licensed to print to novaPDF printer (http://www.novapdf.com)

Assumptions
• Scale of measurement is interval• Linear relationships• Homoscedasticity• Similar normal underlying distributions• No outliers
11/23/2015 Shamsuddin Shahid, FKA, UTM
You created this PDF from an application that is not licensed to print to novaPDF printer (http://www.novapdf.com)
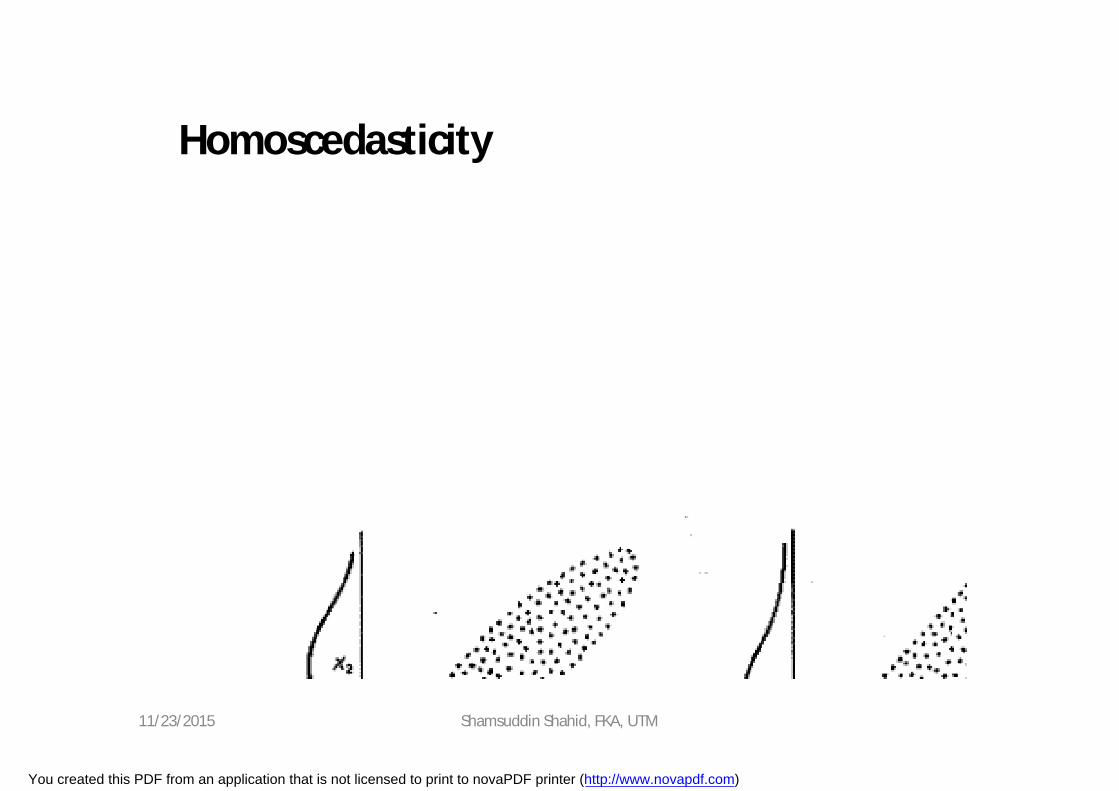
Homoscedasticity
11/23/2015 Shamsuddin Shahid, FKA, UTM
You created this PDF from an application that is not licensed to print to novaPDF printer (http://www.novapdf.com)
Advantages and Disadvanateges of Pearson’s Coefficient
Advantages• It summarizes in one value, the degree of correlation &
direction of correlation also.
Limitations• Always assume linear relationship
• Interpreting the value of r is difficult.
• Value of Correlation Coefficient is affected by the extreme values.
11/23/2015 Shamsuddin Shahid, FKA, UTM
You created this PDF from an application that is not licensed to print to novaPDF printer (http://www.novapdf.com)
Parametric and Non-parametric Correlation
Parametric correlation: when distribution of data is normal.
Example: Pearson Correlation
Non-parametric correlation: when distribution of data is not normal
Example: Spearman’s Rank Correlation, Kendall- Correlation
11/23/2015 Shamsuddin Shahid, FKA, UTM
You created this PDF from an application that is not licensed to print to novaPDF printer (http://www.novapdf.com)

The Spearman Correlation
Spearman’s correlation is designed to measure the relationship betweenvariables measured on an ordinal scale of measurement
A perfectly positive relationship means that every time X increases Y alsoincreases; i.e., the smallest value of X is paired with the smallest value ofY and so on
The original scores are first converted to ranks, then the Spearmancorrelation coefficient is used to measure the relationship for the ranks.The degree of relationship for the ranks provides a measure of thedegree of consistency for the original scores.
Calculation of Spearman’s Correlation Coefficient
Be sure you have ordinal data for X and Y scores The smallest value gets the rank 1 and the second smallest 2 and so on Rank X and Y separately Use the same formula on the ranked data as you used for Pearson’s r
11/23/2015 Shamsuddin Shahid, FKA, UTM
You created this PDF from an application that is not licensed to print to novaPDF printer (http://www.novapdf.com)

Rank Correlation
• Spearman Rank-Correlation Coefficient, rs
where: n = number of items being rankedxi = rank of item i with respect to one variableyi = rank of item i with respect to a second
variabledi = xi - yi
11/23/2015 Shamsuddin Shahid, FKA, UTM
You created this PDF from an application that is not licensed to print to novaPDF printer (http://www.novapdf.com)
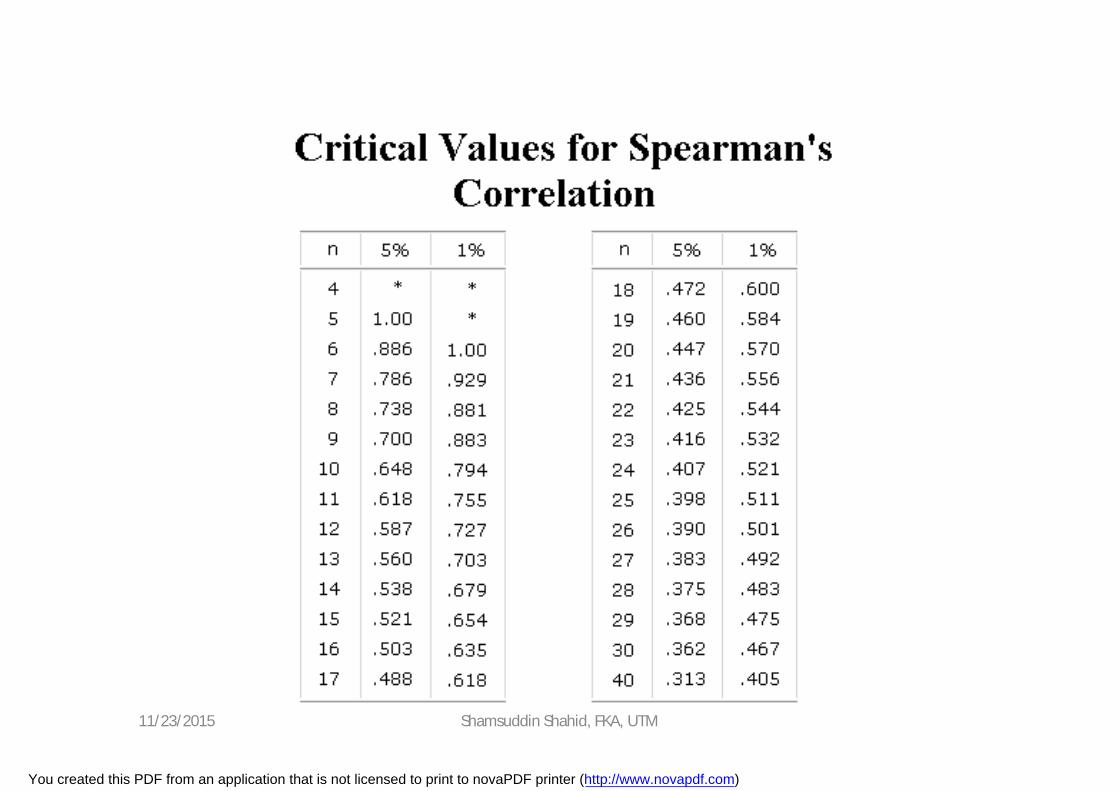
Test for Significant Rank Correlation
• We may want to use sample results to make an inference about the population rank correlation ps.
• To do so, we must test the hypotheses:
H0: ps = 0Ha: ps 0
11/23/2015 Shamsuddin Shahid, FKA, UTM
You created this PDF from an application that is not licensed to print to novaPDF printer (http://www.novapdf.com)
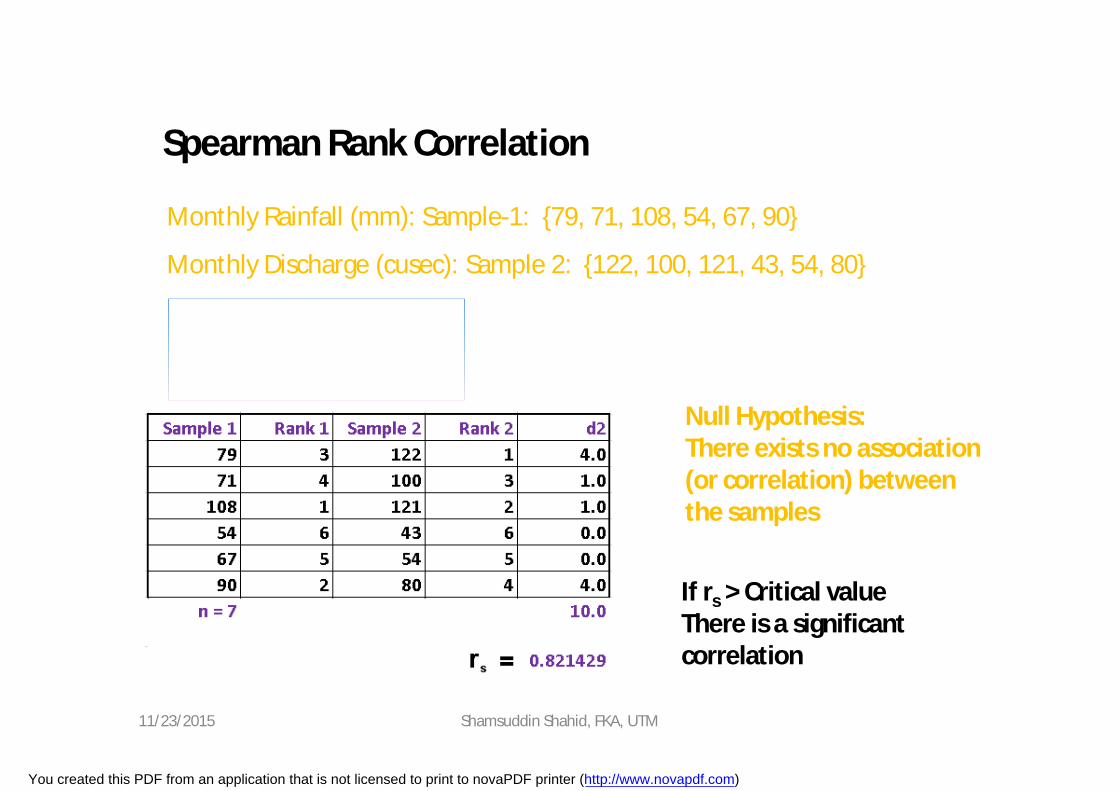
Spearman Rank Correlation
Monthly Rainfall (mm): Sample-1: {79, 71, 108, 54, 67, 90}
Monthly Discharge (cusec): Sample 2: {122, 100, 121, 43, 54, 80}
If rs > Critical valueThere is a significant correlation
Null Hypothesis:There exists no association (or correlation) between the samples
11/23/2015 Shamsuddin Shahid, FKA, UTM
You created this PDF from an application that is not licensed to print to novaPDF printer (http://www.novapdf.com)
11/23/2015 Shamsuddin Shahid, FKA, UTM
You created this PDF from an application that is not licensed to print to novaPDF printer (http://www.novapdf.com)
Merits Spearman’s Rank Correlation
• This method is simpler to understand and easier to applycompared to karl pearson’s correlation method.
• This method is useful where we can give the ranks andnot the actual data. (qualitative term)
• This method is to use where the initial data in the formof ranks.
11/23/2015 Shamsuddin Shahid, FKA, UTM
You created this PDF from an application that is not licensed to print to novaPDF printer (http://www.novapdf.com)
Limitation Spearman’s Correlation
• Cannot be used for finding out correlation in a groupedfrequency distribution.
• This method should be applied where N exceeds 30.
11/23/2015 Shamsuddin Shahid, FKA, UTM
You created this PDF from an application that is not licensed to print to novaPDF printer (http://www.novapdf.com)

Kendall's rank correlation provides a distribution free test ofindependence and a measure of the strength of dependencebetween two variables.
Spearman's rank correlation is satisfactory for testing a nullhypothesis of independence between two variables but Kendall'srank correlation is much powerful.
Kendall-tau Rank Correlation
11/23/2015 Shamsuddin Shahid, FKA, UTM
You created this PDF from an application that is not licensed to print to novaPDF printer (http://www.novapdf.com)
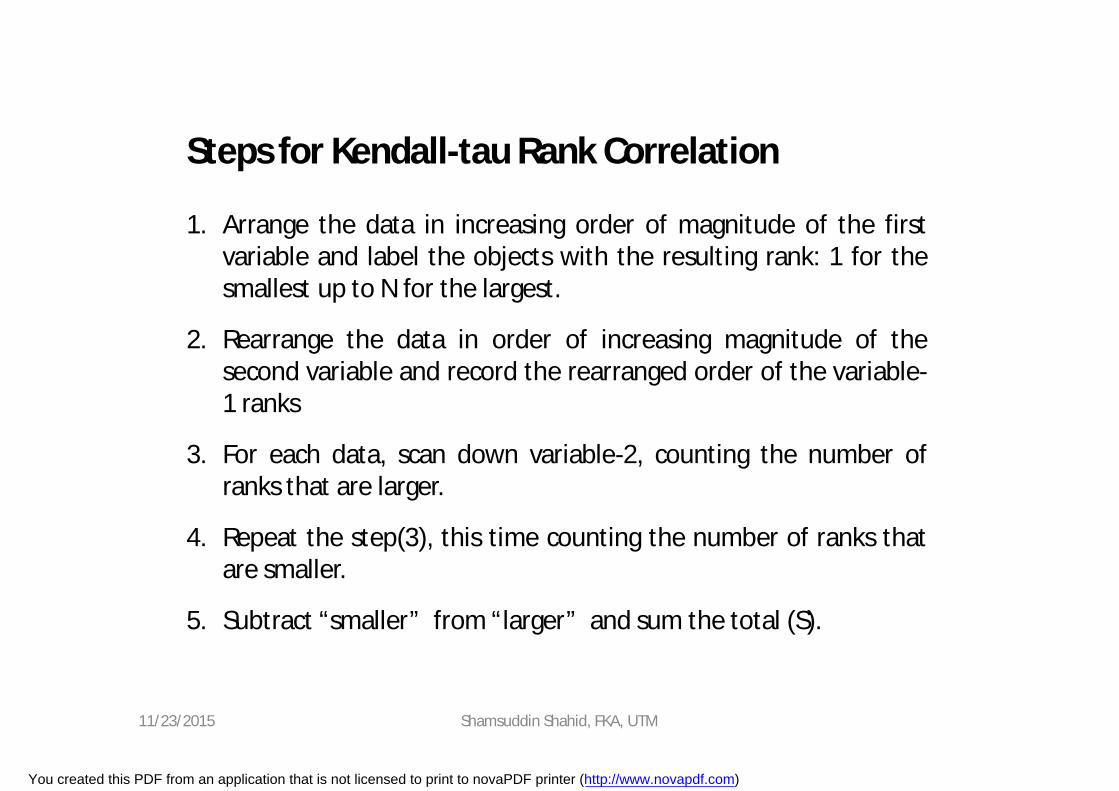
Steps for Kendall-tau Rank Correlation
1. Arrange the data in increasing order of magnitude of the firstvariable and label the objects with the resulting rank: 1 for thesmallest up to N for the largest.
2. Rearrange the data in order of increasing magnitude of thesecond variable and record the rearranged order of the variable-1 ranks
3. For each data, scan down variable-2, counting the number ofranks that are larger.
4. Repeat the step(3), this time counting the number of ranks thatare smaller.
5. Subtract “smaller” from “larger” and sum the total (S).
11/23/2015 Shamsuddin Shahid, FKA, UTM
You created this PDF from an application that is not licensed to print to novaPDF printer (http://www.novapdf.com)

6. Kendall’s is given by: = (2 x S) / [N x (N-1)]
7. Computer z-statistics asz = x [9 x N x (N-1)] / [2 x (2N + 5)]
8. Null hypothesis rejected if z is out of the following range:-1.96 < z > 1.96
Steps for Kendall-tau Rank Correlation
11/23/2015 Shamsuddin Shahid, FKA, UTM
You created this PDF from an application that is not licensed to print to novaPDF printer (http://www.novapdf.com)
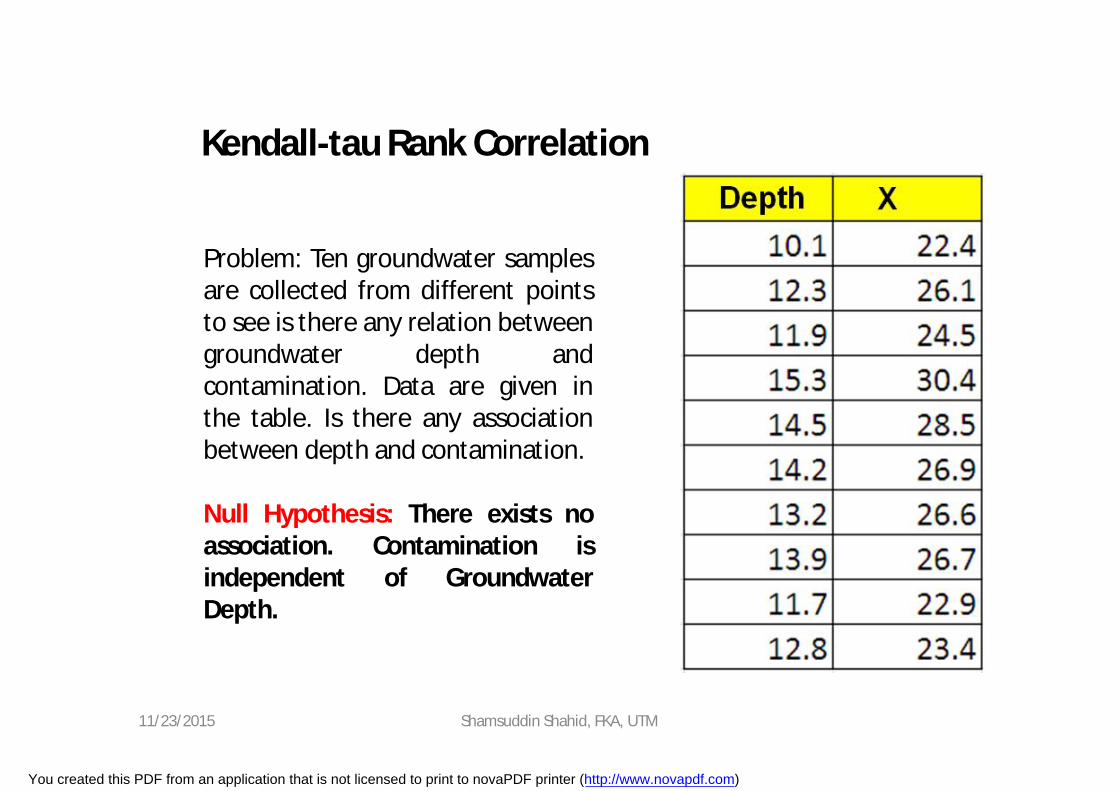
Kendall-tau Rank Correlation
Problem: Ten groundwater samplesare collected from different pointsto see is there any relation betweengroundwater depth andcontamination. Data are given inthe table. Is there any associationbetween depth and contamination.
Null Hypothesis: There exists noassociation. Contamination isindependent of GroundwaterDepth.
11/23/2015 Shamsuddin Shahid, FKA, UTM
You created this PDF from an application that is not licensed to print to novaPDF printer (http://www.novapdf.com)
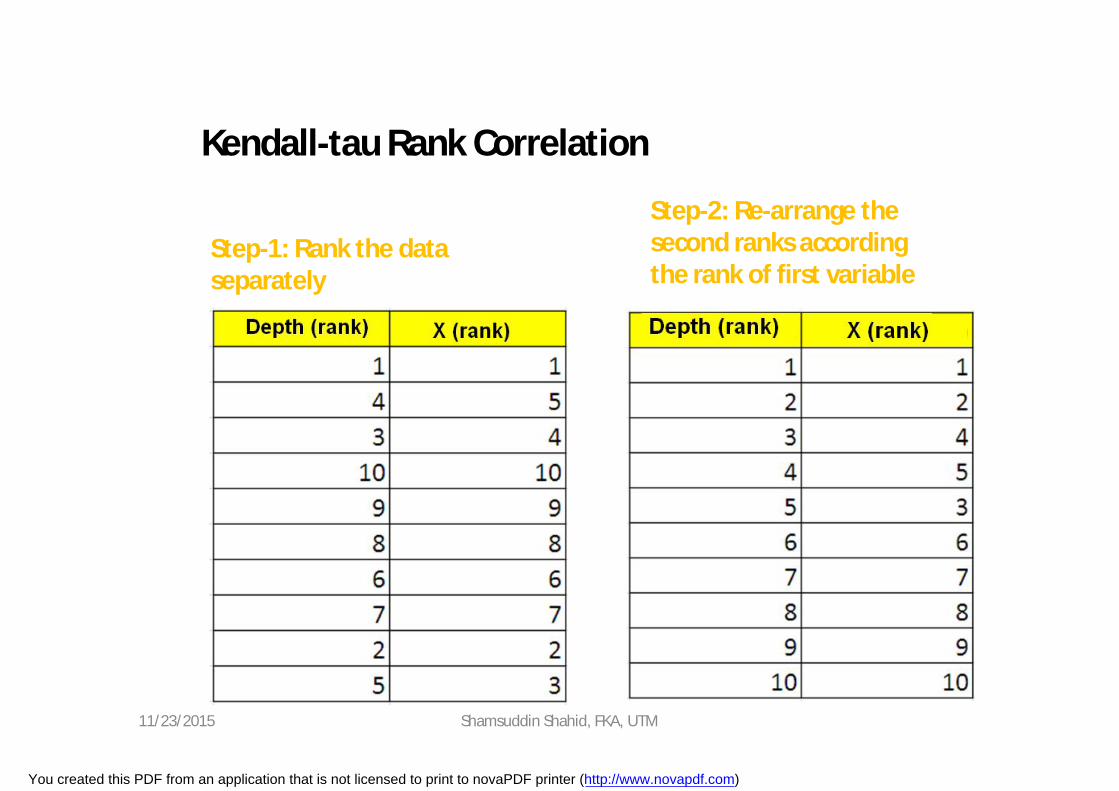
Kendall-tau Rank Correlation
Step-1: Rank the data separately
Step-2: Re-arrange the second ranks according the rank of first variable
11/23/2015 Shamsuddin Shahid, FKA, UTM
You created this PDF from an application that is not licensed to print to novaPDF printer (http://www.novapdf.com)
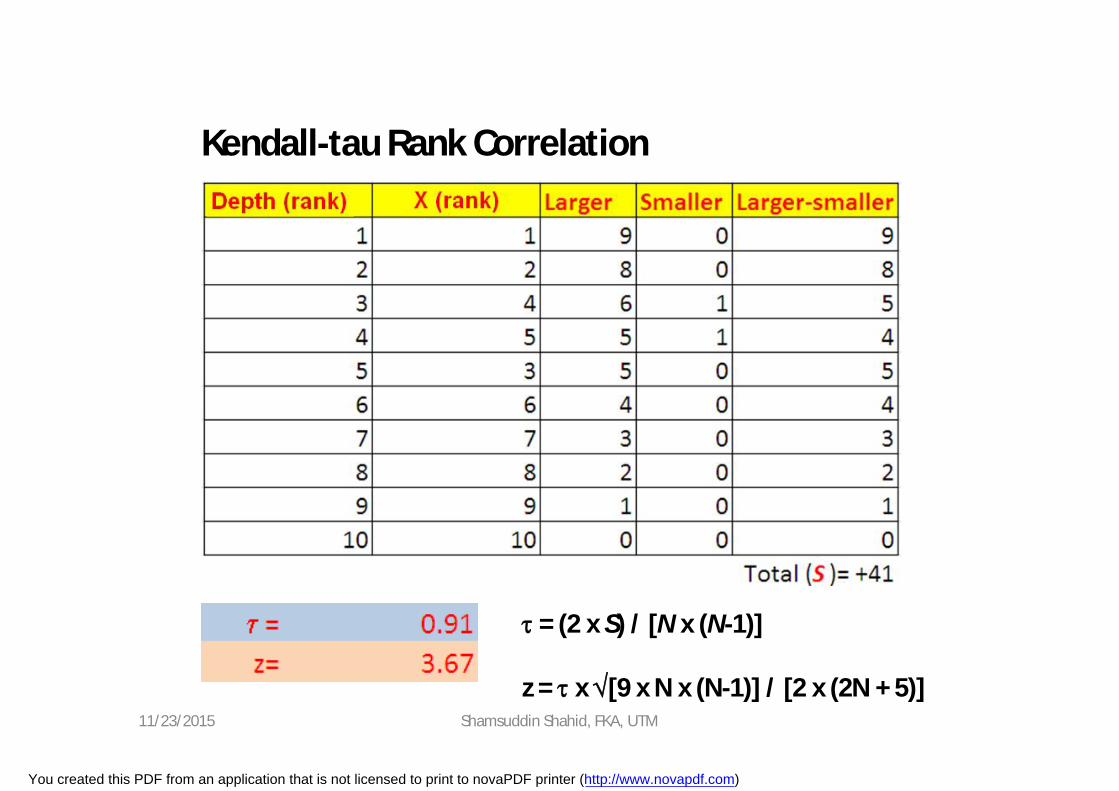
Kendall-tau Rank Correlation
= (2 x S) / [N x (N-1)]
z = x [9 x N x (N-1)] / [2 x (2N + 5)]11/23/2015 Shamsuddin Shahid, FKA, UTM
You created this PDF from an application that is not licensed to print to novaPDF printer (http://www.novapdf.com)
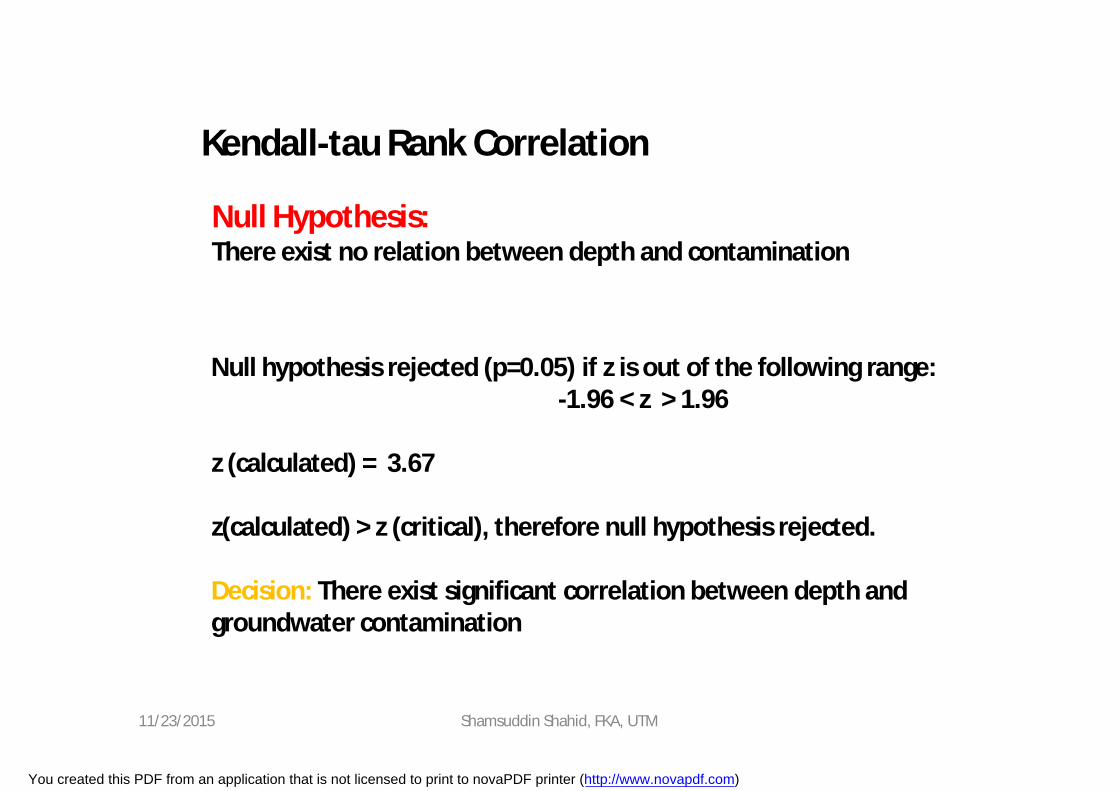
Kendall-tau Rank Correlation
Null Hypothesis:There exist no relation between depth and contamination
Null hypothesis rejected (p=0.05) if z is out of the following range:-1.96 < z > 1.96
z (calculated) = 3.67
z(calculated) > z (critical), therefore null hypothesis rejected.
Decision: There exist significant correlation between depth and groundwater contamination
11/23/2015 Shamsuddin Shahid, FKA, UTM
You created this PDF from an application that is not licensed to print to novaPDF printer (http://www.novapdf.com)
Features of Correlation Coefficient
The correlation coefficient has the following properties:
The correlation is not affected when the two variables areinterchanged.
The correlation is not changed if the same number is added to allthe values of one of the variables.
The correlation is not changed if all the values of one of thevariables is multiplied by the same positive number. It will changesign if the number is negative.
11/23/2015 Shamsuddin Shahid, FKA, UTM
You created this PDF from an application that is not licensed to print to novaPDF printer (http://www.novapdf.com)
Factors affect correlation
• Restricted range• Heterogenous samples• Outliers• Scale
11/23/2015 Shamsuddin Shahid, FKA, UTM
You created this PDF from an application that is not licensed to print to novaPDF printer (http://www.novapdf.com)

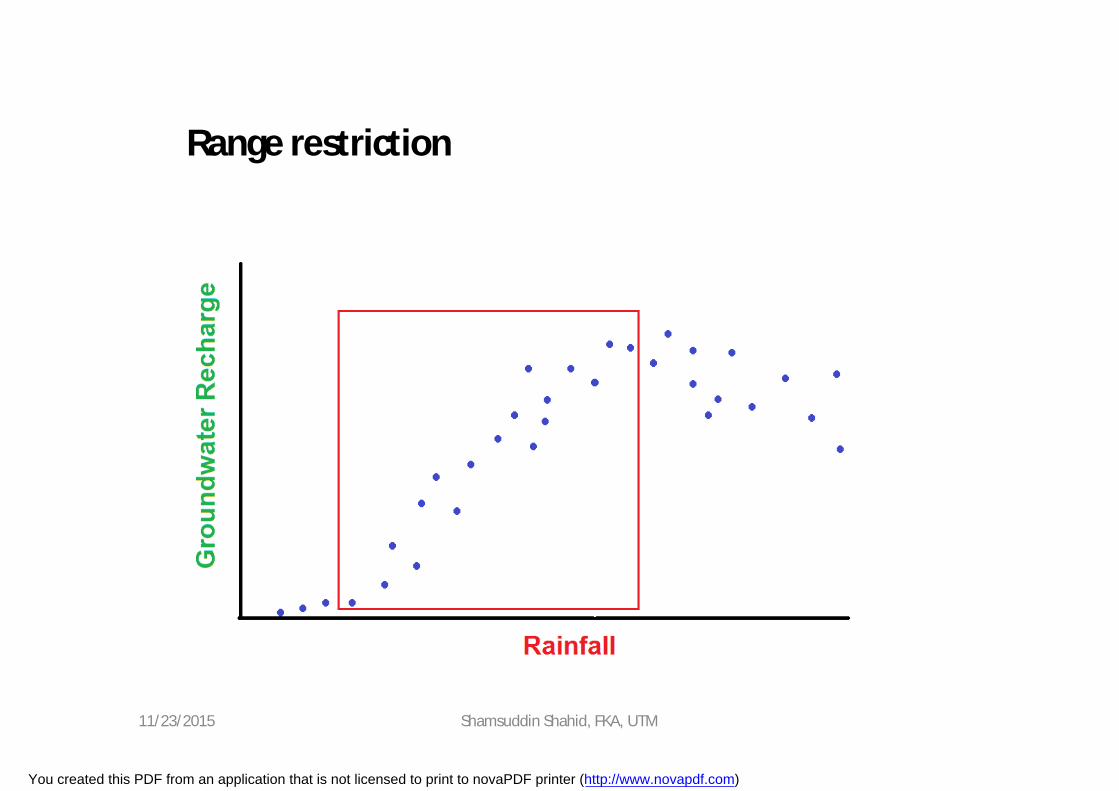
Range restriction
• Range restriction is when sample contains restricted (or truncated) range of scores– e.g., Groundwater Recharge and Rainfall > 5mm
• If range restriction, be cautious in generalising beyond the range for which data is available– e.g., Groundwater recharge less when rainfall is less, but below
a threshold level, there is no relation
11/23/2015 Shamsuddin Shahid, FKA, UTM
You created this PDF from an application that is not licensed to print to novaPDF printer (http://www.novapdf.com)
Range restriction
11/23/2015 Shamsuddin Shahid, FKA, UTM
You created this PDF from an application that is not licensed to print to novaPDF printer (http://www.novapdf.com)
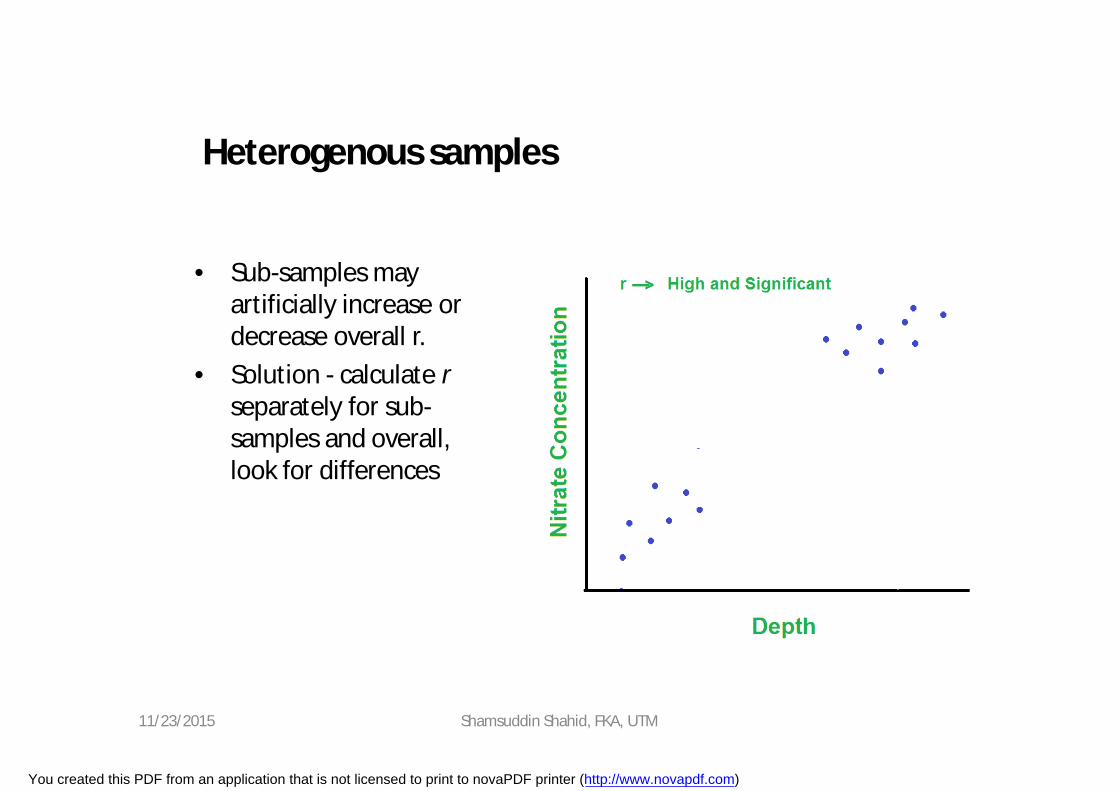
Heterogenous samples
• Sub-samples may artificially increase or decrease overall r.
• Solution - calculate rseparately for sub-samples and overall, look for differences
11/23/2015 Shamsuddin Shahid, FKA, UTM
You created this PDF from an application that is not licensed to print to novaPDF printer (http://www.novapdf.com)

Heterogenous samples
11/23/2015 Shamsuddin Shahid, FKA, UTM
You created this PDF from an application that is not licensed to print to novaPDF printer (http://www.novapdf.com)
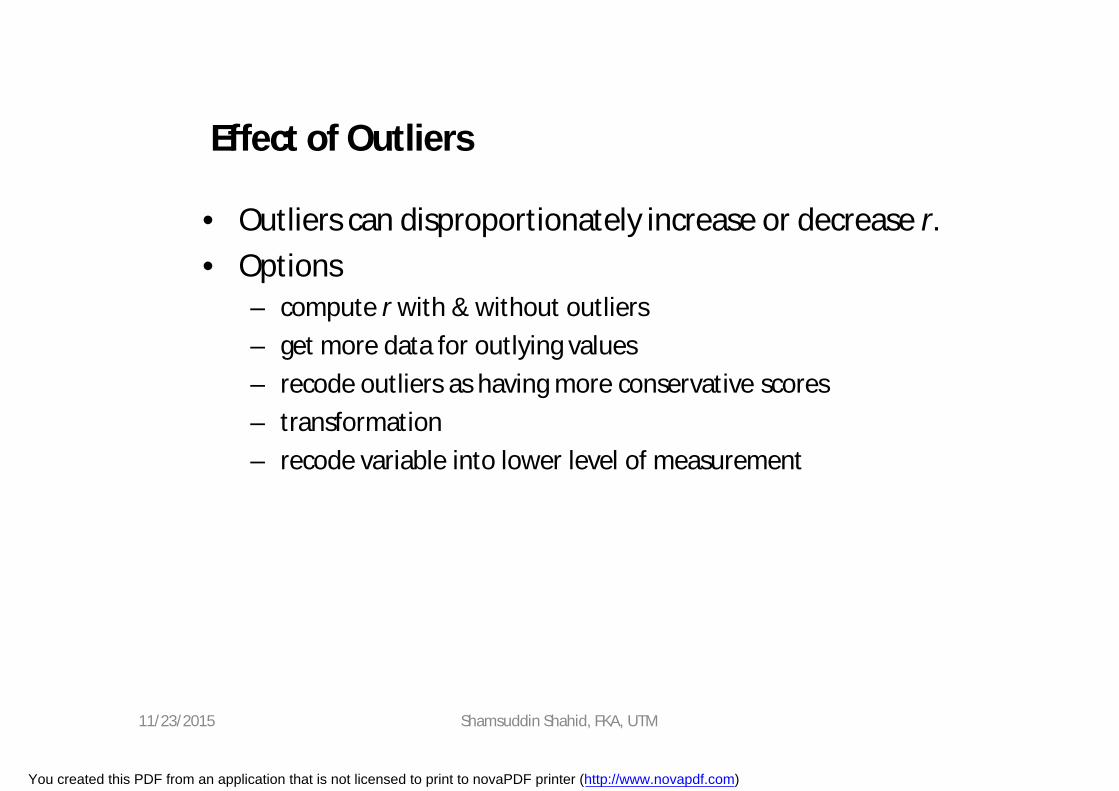
Effect of Outliers
• Outliers can disproportionately increase or decrease r.• Options
– compute r with & without outliers– get more data for outlying values– recode outliers as having more conservative scores– transformation– recode variable into lower level of measurement
11/23/2015 Shamsuddin Shahid, FKA, UTM
You created this PDF from an application that is not licensed to print to novaPDF printer (http://www.novapdf.com)
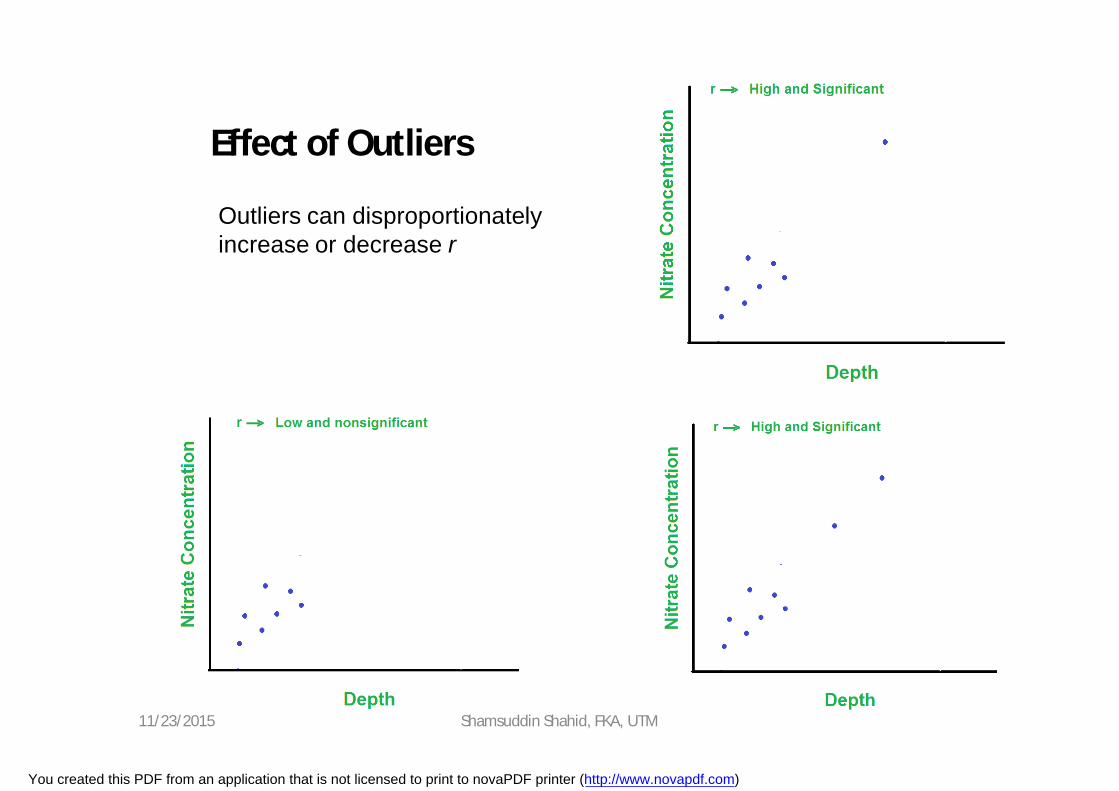
Effect of Outliers
Outliers can disproportionately increase or decrease r
11/23/2015 Shamsuddin Shahid, FKA, UTM
You created this PDF from an application that is not licensed to print to novaPDF printer (http://www.novapdf.com)
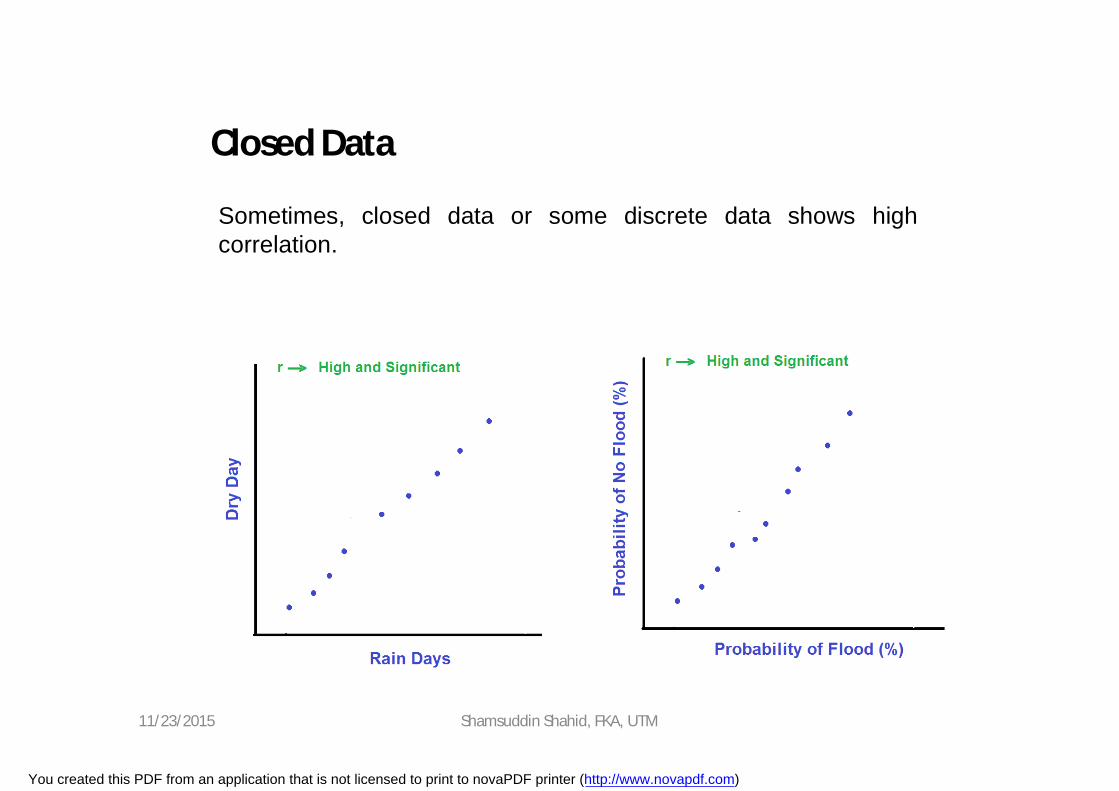
Closed Data
Sometimes, closed data or some discrete data shows highcorrelation.
11/23/2015 Shamsuddin Shahid, FKA, UTM
You created this PDF from an application that is not licensed to print to novaPDF printer (http://www.novapdf.com)
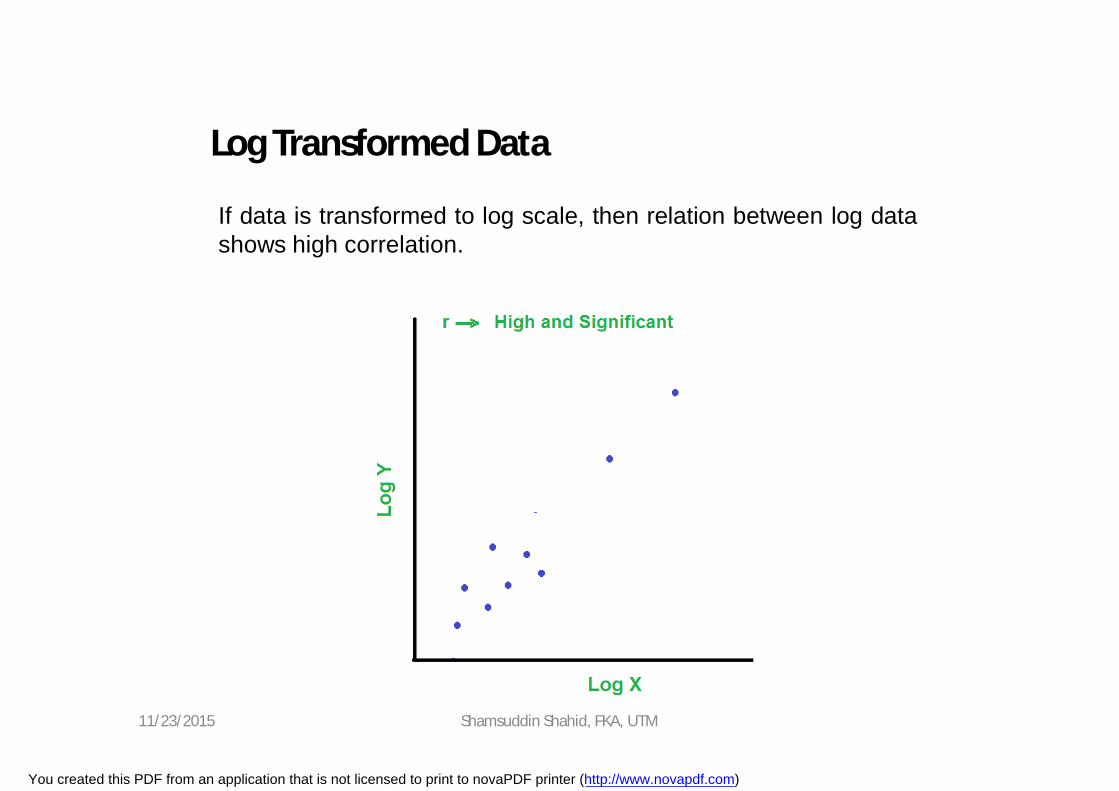
Log Transformed Data
If data is transformed to log scale, then relation between log datashows high correlation.
11/23/2015 Shamsuddin Shahid, FKA, UTM
You created this PDF from an application that is not licensed to print to novaPDF printer (http://www.novapdf.com)
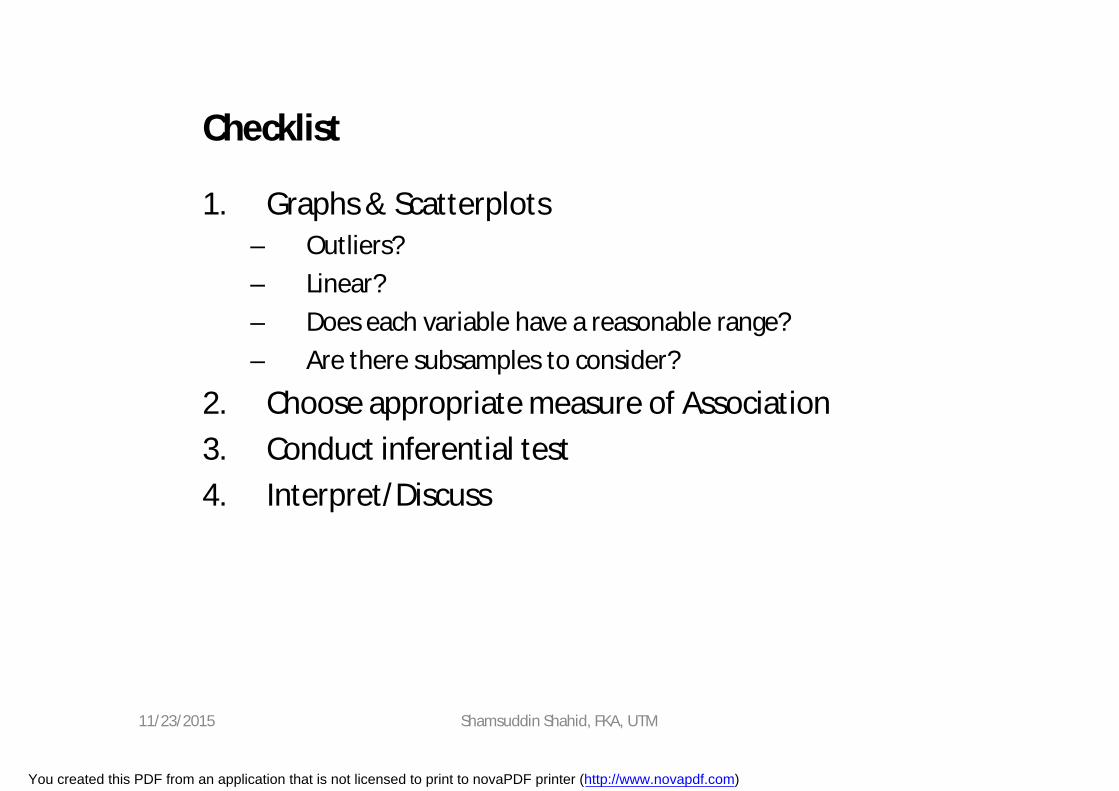
Checklist
1. Graphs & Scatterplots– Outliers?– Linear?– Does each variable have a reasonable range?– Are there subsamples to consider?
2. Choose appropriate measure of Association3. Conduct inferential test4. Interpret/Discuss
11/23/2015 Shamsuddin Shahid, FKA, UTM
You created this PDF from an application that is not licensed to print to novaPDF printer (http://www.novapdf.com)

Association and Causation
ASSOCIATION • If two attributes say A and B are found to co-exit more often
than an ordinary chance. Then they are correlated. We can say that there is an association between attributes A and B.
• Correlation indicates the degree of association between two variables.
CAUSATION If one of these attributes say A is the suspected cause and the other say B is the outcome then we have a reason to suspect that A has caused B.
11/23/2015 Shamsuddin Shahid, FKA, UTM
You created this PDF from an application that is not licensed to print to novaPDF printer (http://www.novapdf.com)
Association and Causation
• Association does not mean causation.• If association is consistence, then there may be
causation.• If a relationship is causal, the findings should be
consistent with other data• Causation always implies correlation but correlation
does not necessarily implies causation.
11/23/2015 Shamsuddin Shahid, FKA, UTM
You created this PDF from an application that is not licensed to print to novaPDF printer (http://www.novapdf.com)
Reporting
• State the research hypothesis
• Describe & interpret correlation– direction of relationship– size/strength of relationship– Significance of relationship
• Acknowledge limitations e.g.,– Heterogeneity (sub-samples)– Range restriction– Causality?
11/23/2015 Shamsuddin Shahid, FKA, UTM
You created this PDF from an application that is not licensed to print to novaPDF printer (http://www.novapdf.com)

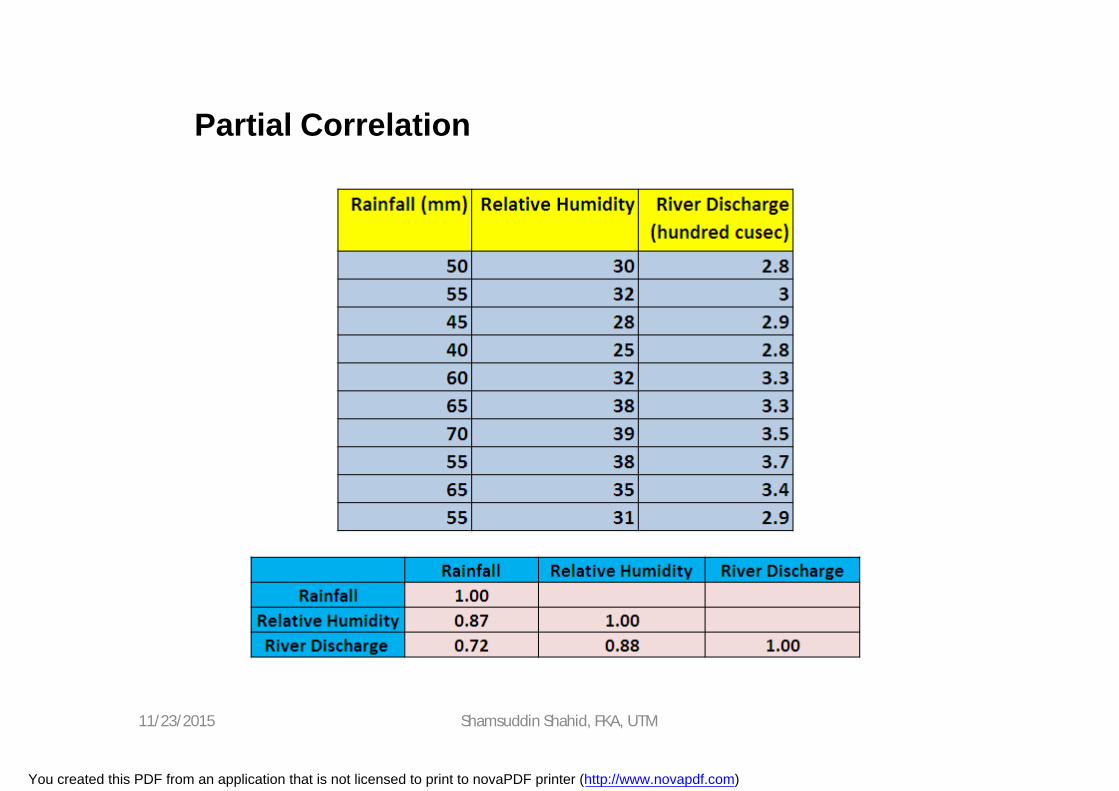
Partial Correlation
River discharge depends on many factors, such as rainfall, soilproperty, evapotranspiration, groundwater storage, etc. Eachindependent factors are also correlated with each other.
11/23/2015 Shamsuddin Shahid, FKA, UTM
You created this PDF from an application that is not licensed to print to novaPDF printer (http://www.novapdf.com)
Partial Correlation
11/23/2015 Shamsuddin Shahid, FKA, UTM
You created this PDF from an application that is not licensed to print to novaPDF printer (http://www.novapdf.com)
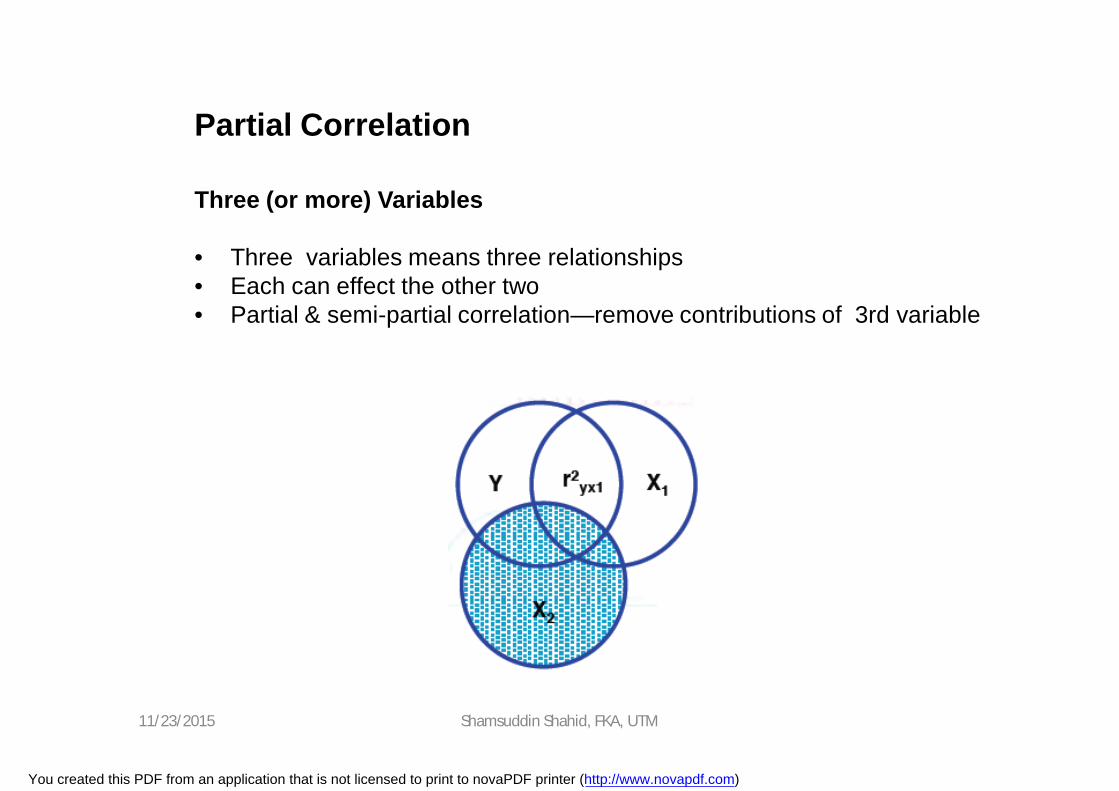
Three (or more) Variables
• Three variables means three relationships• Each can effect the other two• Partial & semi-partial correlation—remove contributions of 3rd variable
Partial Correlation
11/23/2015 Shamsuddin Shahid, FKA, UTM
You created this PDF from an application that is not licensed to print to novaPDF printer (http://www.novapdf.com)

• Sometimes it is desirable to know the relationship between twovariables with the effects of a third variable held constant. Wecan do it by using Partial correlation
• It helps us to find the ‘pure’ correlation between two variable withholding the others constant.
• ‘Holding constant’ in this situation is known as partialling out, andthe technique for partialling out the effects of one or morevariables from two others, in order to find the relationshipbetween them is called partial correlation.
Partial Correlation
11/23/2015 Shamsuddin Shahid, FKA, UTM
You created this PDF from an application that is not licensed to print to novaPDF printer (http://www.novapdf.com)
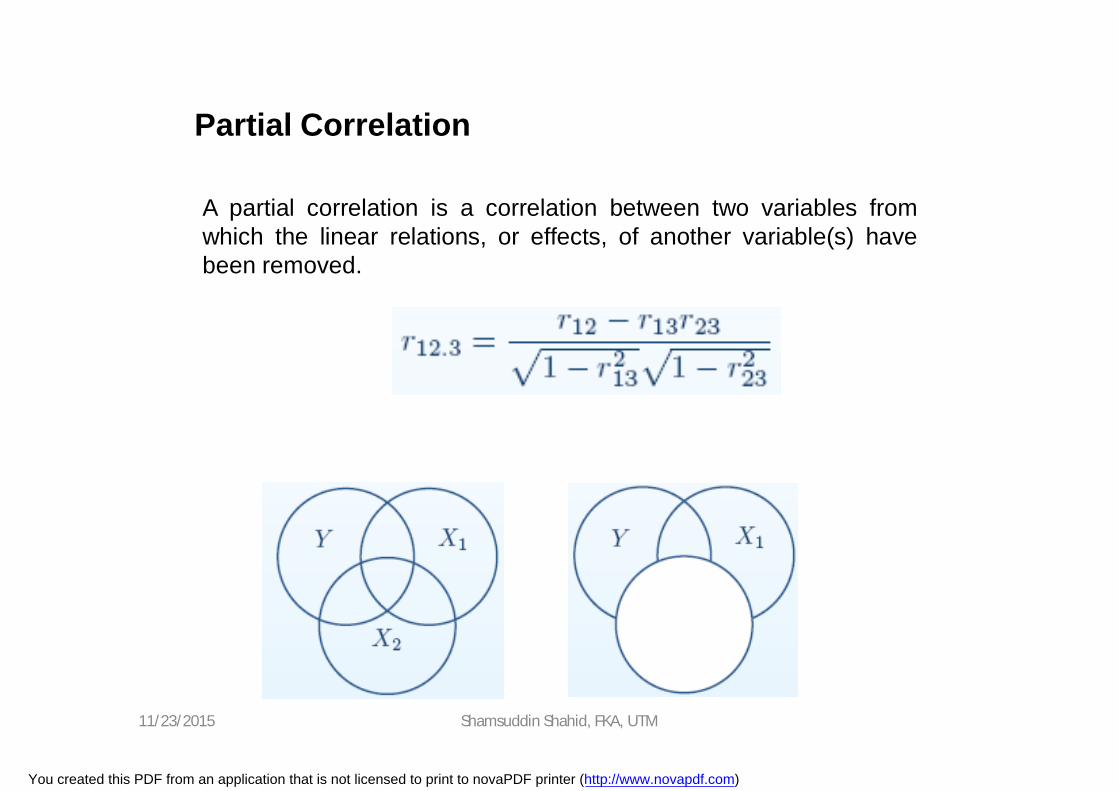
A partial correlation is a correlation between two variables fromwhich the linear relations, or effects, of another variable(s) havebeen removed.
Partial Correlation
11/23/2015 Shamsuddin Shahid, FKA, UTM
You created this PDF from an application that is not licensed to print to novaPDF printer (http://www.novapdf.com)
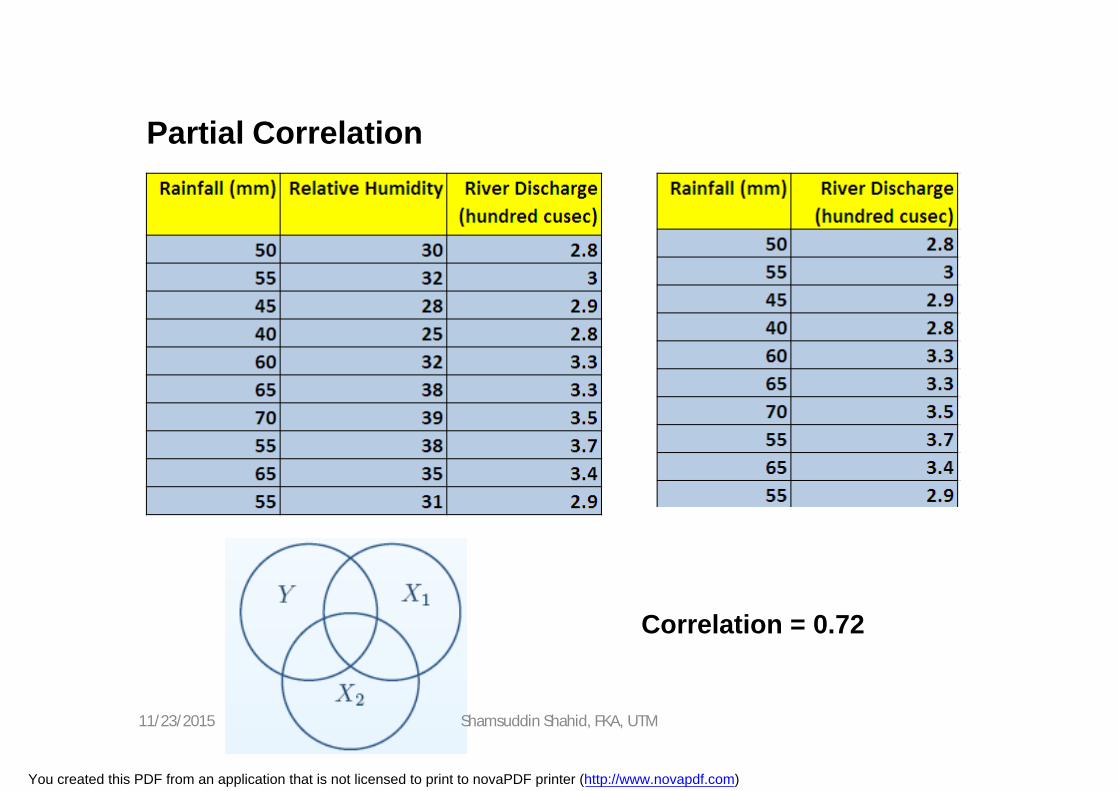
Partial Correlation
Correlation = 0.72
11/23/2015 Shamsuddin Shahid, FKA, UTM
You created this PDF from an application that is not licensed to print to novaPDF printer (http://www.novapdf.com)
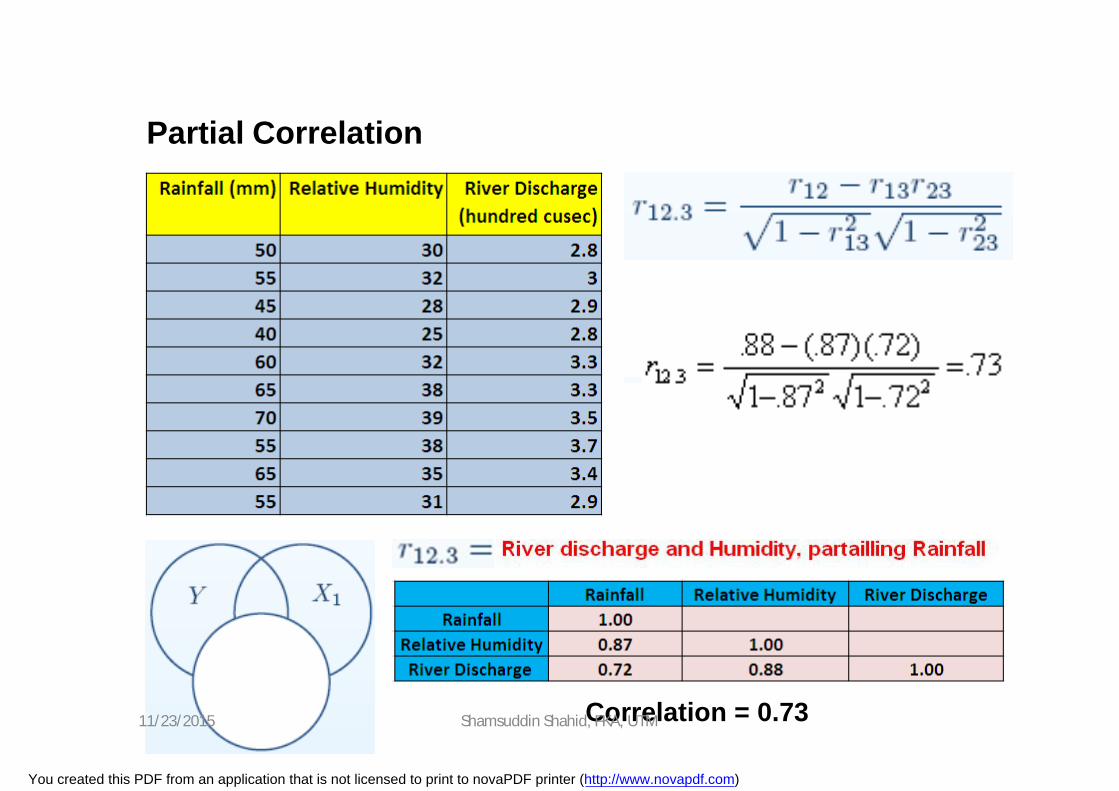
Partial Correlation
Correlation = 0.7311/23/2015 Shamsuddin Shahid, FKA, UTM
You created this PDF from an application that is not licensed to print to novaPDF printer (http://www.novapdf.com)

Higher-Order Partial Correlation
The second-order partial correlation is the correlation between twovariables with the effects of two other variables being removed.
11/23/2015 Shamsuddin Shahid, FKA, UTM
You created this PDF from an application that is not licensed to print to novaPDF printer (http://www.novapdf.com)
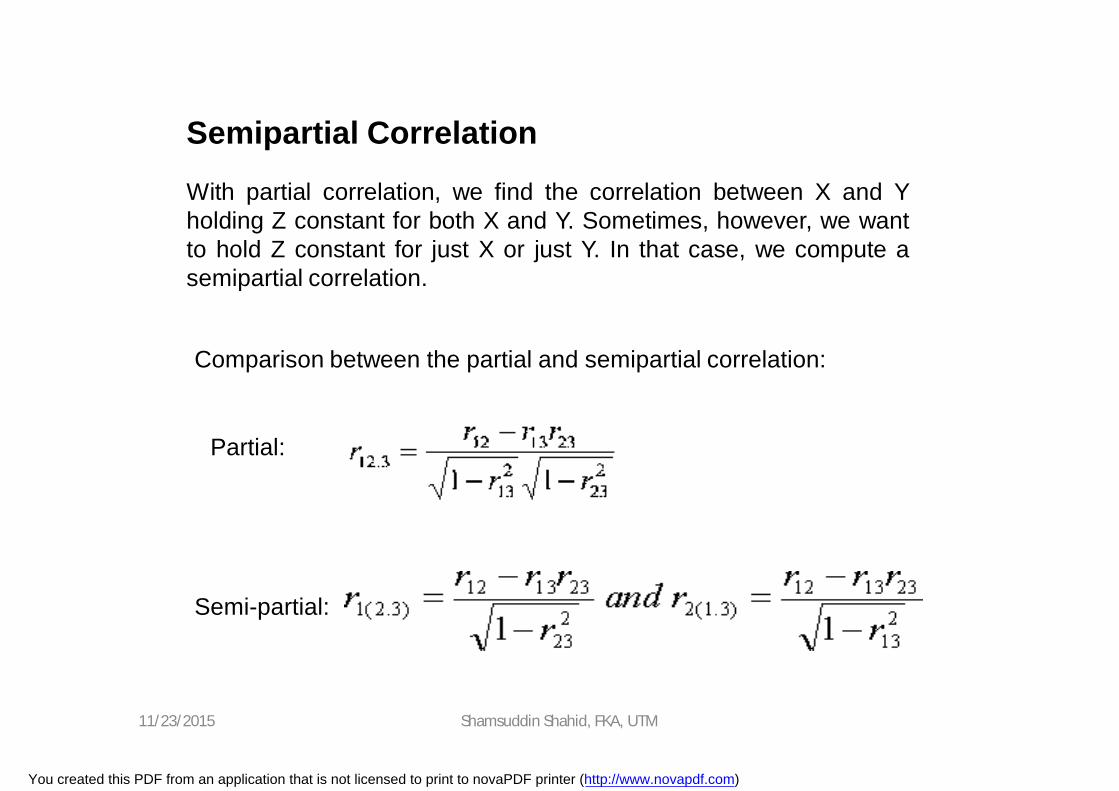
With partial correlation, we find the correlation between X and Yholding Z constant for both X and Y. Sometimes, however, we wantto hold Z constant for just X or just Y. In that case, we compute asemipartial correlation.
Semipartial Correlation
Comparison between the partial and semipartial correlation:
Partial:
Semi-partial:
11/23/2015 Shamsuddin Shahid, FKA, UTM
You created this PDF from an application that is not licensed to print to novaPDF printer (http://www.novapdf.com)
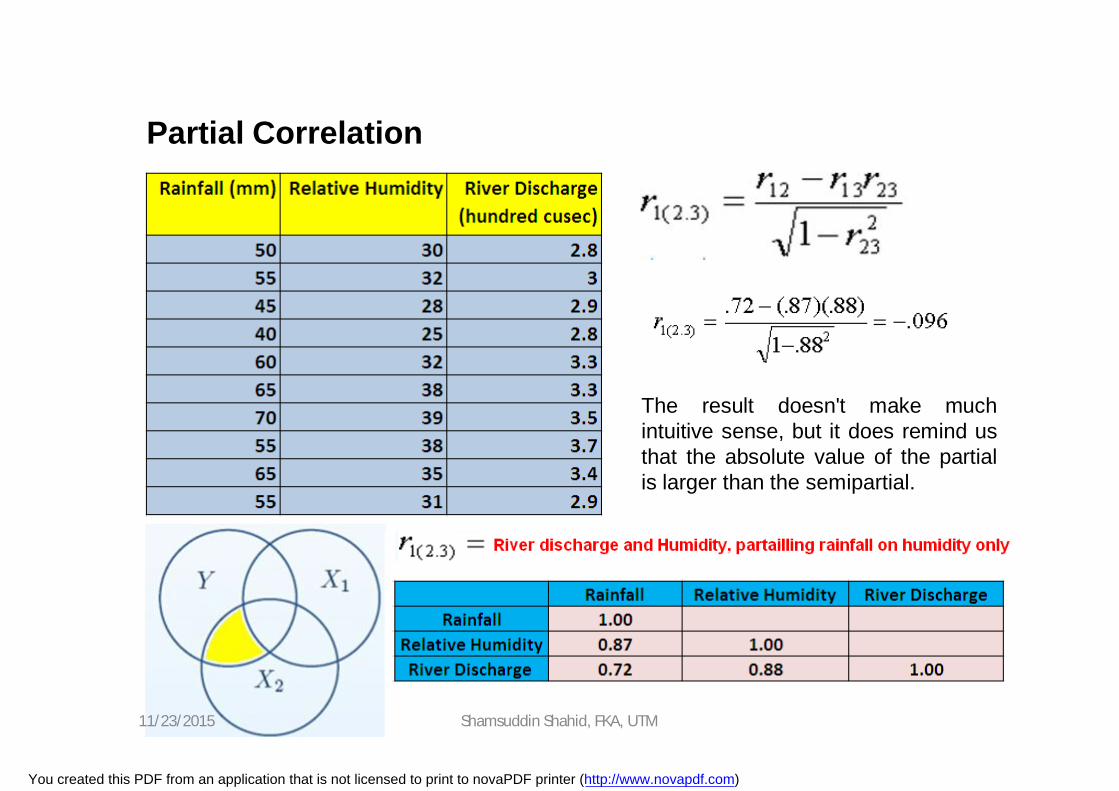
Partial Correlation
The result doesn't make muchintuitive sense, but it does remind usthat the absolute value of the partialis larger than the semipartial.
11/23/2015 Shamsuddin Shahid, FKA, UTM
You created this PDF from an application that is not licensed to print to novaPDF printer (http://www.novapdf.com)
• The partial and semipartial correlation formulas are thesame in the numerator and almost the same in thedenominator.
• The partial contains something extra, that is, somethingmissing from the semipartial correlation in thedenominator.
• This means that the partial correlation is going to belarger in absolute value than the semipartial.
• This will be true except when the controlling or partiallingvariable is uncorrelated with the variable to be controlled.
Semipartial Correlation
11/23/2015 Shamsuddin Shahid, FKA, UTM
You created this PDF from an application that is not licensed to print to novaPDF printer (http://www.novapdf.com)
Advantages of Correlation studies
• Show the amount (strength) of relationship present
• Can be used to make predictions about the variablesunder study.
• Can be used in many places, including natural settings,libraries, etc.
• Easier to collect co relational data
11/23/2015 Shamsuddin Shahid, FKA, UTM
You created this PDF from an application that is not licensed to print to novaPDF printer (http://www.novapdf.com)
Disadvantages of correlation studies
• Can’t assume that a cause-effect relationship exists
• Little or no control (experimental manipulation) of thevariables is possible
• Relationships may be accidental or due to a third,unmeasured factor common to the 2 variables that aremeasured
11/23/2015 Shamsuddin Shahid, FKA, UTM
You created this PDF from an application that is not licensed to print to novaPDF printer (http://www.novapdf.com)