response characteristic of sno2 based ceramic gas...
TRANSCRIPT
UNIVERSITI PUTRA MALAYSIA SENSOR CHARACTERISTIC STUDIES AND THERMAL
DIFFUSIVITY MEASUREMENT OF TIN (IV) OXIDE-BASED CERAMIC GAS SENSORS
ROSYAINI AFINDI ZAMAN
FS 2004 19
SENSOR CHARACTERISTIC STUDIES AND THERMAL DIFFUSIVITY MEASUREMENT OF TIN (IV) OXIDE-BASED
CERAMIC GAS SENSORS
ROSYAINI AFINDI ZAMAN
MASTER OF SCIENCE
UNIVERSITI PUTRA MALAYSIA
2004
SENSOR CHARACTERISTIC STUDIES AND THERMAL DIFFUSIVITY MEASUREMENT OF TIN (IV) OXIDE-BASED
CERAMIC GAS SENSORS
By
ROSYAINI AFINDI ZAMAN
Thesis Submitted to the School of Graduate Studies, Universiti Putra Malaysia, in Fulfilment of the Requirements for the Degree of Master of Science
December 2004

ii
DEDICATION
Specially Dedicated to My Beloved Family And to My Beloved ONE …
iii
Abstract of thesis presented to the Senate of Universiti Putra Malaysia in fulfilment of the requirement for the degree of Master of Science
SENSOR CHARACTERISTIC STUDIES AND THERMAL DIFFUSIVITY
MEASUREMENT OF TIN (IV) OXIDE-BASED CERAMIC GAS SENSORS
By
ROSYAINI AFINDI ZAMAN
December 2004
Chairman: Professor W. Mahmood Mat Yunus, PhD Faculty : Science
The atmospheric pollution has lead to the research and development of a variety of
sensors using different materials and technologies particularly for low cost and lower
operating temperatures. An n-type semiconducting oxide such as tin oxide (SnO2) is
one of the most important and extensively used materials for the detection of gases.
In this project, the I-V characteristic and thermal diffusivity of pure SnO2 and SnO2-
CuO was studied. The I-V characteristic was measured using two-probe technique
while the thermal diffusivity was measured using a photoflash method. The X-Ray
Diffraction was used for identification of the phase in the sample and Scanning
Electron Microscopy (SEM) was used to provide supportive evidence for the factor
causing the changes of the parameters included. These methods are important to
confirm the existence of SnO2 peaks which is critical to CO2 gas.
It was found that the I-V characteristics of sensor materials remain linear in a
temperature range of 27 0C 340 0C both in air and CO2 environment. Sensor
sensitivity was found to be dependent on temperature. Pure SnO2 showed maximum
iv
sensitivity (~2.5) at operating temperature 300 0C. Operating temperature is defined
as the temperature that gas sensor give a maximum reaction (sensitivity) with tested
gas. With addition of CuO into SnO2, the gas sensing temperature and electrical
conductivity of the sensor was found to decrease. The operating temperature also
rapidly decreased from 300 0C (pure SnO2) to 220 0C (addition of 40 mol% CuO). It
is also observed that the annealing process has lowered the operating temperature of
the sensor from 220 0C (sample as prepared) to 180 0C (samples annealed 600 0C,
700 0C and 800 0C). The effect of gas pressure on operating temperature did not
change with increasing gas pressure but it showed higher sensitivity at higher gas
pressure. The sensor response time was also studied as a function of SnO2
composition and gas pressure. It was found that by increasing the gas pressure, the
sensor response time decreased. The addition of CuO also has lowered the response
time of SnO2 from 10 minutes to 6 minutes. We found that 60 mol% SnO2 - 40
mol% CuO system which annealed at 600 0C, 700 0C and 800 0C has the best sensing
properties and lower operating temperature at 180 0C. In this study, thermal
diffusivity of SnO2 - CuO system and 60 mol% SnO2 - 40 mol% CuO system was in
range of 1.4 to 7.8 x10⁻² cm2/s.
v
Abstrak tesis ini yang dikemukakan kepada Senat Universiti Putra Malaysia sebagai memenuhi keperluan untuk ijazah Master Sains
KAJIAN CIRI-CIRI SENSOR DAN PENGUKURAN PENYERAPAN TERMA
SENSOR GAS SERAMIK BERASASKAN OKSIDA STANUM (IV)
Oleh
ROSYAINI AFINDI ZAMAN
Disember 2004
Pengerusi: Professor W. Mahmood Mat Yunus, PhD Fakulti : Sains
Peningkatan pencemaran alam sekitar telah menggalakkan penyelidikan dan
pembangunan dalam menghasilkan pelbagai pengesan (sensor) daripada bahan-bahan
yang berbeza untuk mengurangkan kos dan menghasilkan pengesan pada suhu
operasi yang rendah. Semikonduktor jenis n seperti Oksida Stanum (SnO2) adalah
satu bahan yang selalu digunakan dalam mengesan gas.
Dalam projek ini, ciri-ciri arus-voltan dan penyerapan terma ke atas SnO2 and CuO-
SnO2 telah dikaji. Ciri-ciri arus-voltan ini dikaji menggunakan kaedah dua penduga
sementara penyerapan terma dikaji menggunakan kaedah sinaran flash kamera.
Belaun sinar-X telah digunakan untuk mengenal pasti fasa-fasa bahan di dalam
sampel dan Elektron Mikroskop (SEM) telah digunakan bagi menyokong faktor
perubahan parameter yang diukur. Kaedah-kaedah ini penting untuk memastikan
kewujudan SnO2 di mana ia penting di dalam tindak balas gas CO2.
Didapati bahawa ciri-ciri arus voltan adalah lurus dalam julat suhu 27 0C 340 0C
sama ada di udara atau CO2. Tindak balas sensor didapati bergantung kepada suhu.
vi
SnO2 menunjukkan tindak balas maksimun (~2.5) pada suhu 300 0C. Suhu tindak
balas di definisikan sebagai suhu di mana sensor gas bertindak balas secara
maksimum (sensitiviti) dengan gas yang diuji. Penambahan CuO ke dalam SnO2
mengurangkan suhu tindak balas dan kekonduksian elektrik. Suhu tindak balas
berkurang daripada 300 0C (SnO2) kepada 220 0C (dengan penambahan 40 mol%
CuO). Proses rawatan haba juga mengurangkan suhu tindak balas daripada 220 0C
(sampel yang disediakan) kepada 180 0C (sampel yang melalui perawatan haba pada
suhu 600 0C, 700 0C and 800 0C). Masa tindak balas oleh SnO2 berubah dengan
komposisi bahan dan tekanan gas. Dengan meningkatnya tekanan gas, masa bagi
sensor bertindak balas dengan gas berkurang. Penambahan CuO kepada SnO2 telah
mengurangkan tindak balas masa SnO2 daripada 10 minit kepada 6 minit. Didapati
bahawa sistem 60 mol% SnO2 - 40 mol% CuO yang melalui perawatan haba pada
suhu 600 0C, 700 0C and 800 0C mempunyai ciri-ciri pengesan terbaik dan suhu
tindak balas paling rendah pada 180 0C. Dalam kajian ini kadar serapan terma bagi
sistem SnO2 - CuO dan sistem 60 mol% SnO2 - 40 mol% CuO ialah dalam julat 1.4
to 7.8 x 10⁻² cm2/s.
vii
ACKNOWLEDGEMENTS
Bismillahirrahmanirrahim
First and foremost, I would like to extend my praise to Allah s.w.t. that gives me the
patience, strength, determination, and courage to produce this thesis.
It is a great pleasure to acknowledge my supervisor, Prof. Dr. W. Mahmood Mat
Yunus for his guidance, suggestion, assistance, patient, tremendous support and
invaluable advice throughout the duration of this project. I would like also like to
extend my sincere appreciation to my co-supervisor Assoc. Prof. Dr. Zainal Abidin
Talib and Assoc. Prof. Dr. Mansor Hashim for their advice and helpful discussion
during this period of study.
Special thanks to Assoc. Prof. Dr. Zaidan Abdul Wahab, Prof. Dr. Abdul Halim
Shaari for their advice on setup arrangement and sample preparation. I would also
like to thank all the staff in the Physics Department especially En. Roslim and En.
Nordin for their help and co-operation given throughout my work.
I gratefully acknowledge the award of the PASCA Scholarship from Universiti Putra
Malaysia, which enable me to undertake this work. Last but not least, my sincere
thanks to all my friends, seniors and lecturers, especially to Yap, Linda, Yus,
Josephine, Chia, Sabrina, Maznaliza, Liaw and Dr. Lim, who have directly or
indirectly contributed towards the success of this study. Thank you for making my
study of Master Science at UPM a memorable and enjoyable one.
May Allah bless and take care of you. In truth, Only Allah can reciprocate all the
kindness.
Rosyaini Afindi Zaman,
Physics Department,
Faculty of Science, UPM.
viii
I certify that an Examination Committee met on 22nd December 2004 to conduct the final examination of Rosyaini Afindi Zaman on her Master of Science thesis entitled Sensor Characteristic Studies and Thermal Diffusivity Measurement of Tin (IV) Oxide-Based Ceramic Gas Sensors in accordance with Universiti Pertanian Malaysia (Higher Degree) Act 1980 and Universiti Pertanian Malaysia (Higher Degree) Regulations 1981. The committee recommends that the candidate be awarded the relevant degree. Members of the Examination Committee are as follows: Mohd Maarof Mokhsin, PhD Professor Faculty of Science Universiti Putra Malaysia (Chairperson) Ibrahim Abdul Talib, PhD Professor Faculty of Science and Technology Universiti Kebangsaan Malaysia (External Examiner) Azmi Zakaria, PhD Associate Professor Faculty of Science Universiti Putra Malaysia (Internal Examiner) Jumiah Hassan, PhD Faculty of Science Universiti Putra Malaysia (Internal Examiner) GULAM RUSUL RAHMAT ALI, PhD Professor/Deputy Dean School of Graduate Studies Universiti Putra Malaysia Date:
ix
This thesis submitted to the Senate of Universiti Putra Malaysia and has been accepted as partial fulfilment of the requirements for the degree of Master of Science. The members of the Supervisory Committee are follows: W. Mahmood Mat Yunus, PhD Professor Faculty of Science Universiti Putra Malaysia (Chairman) Zainal Abidin Talib, PhD Associate Professor Faculty of Science Universiti Putra Malaysia (Member) Mansor Hashim, PhD Associate Professor Faculty of Science Universiti Putra Malaysia (Member) AINI IDERIS, PhD Professor/ Dean School of Graduate Studies Universiti Putra Malaysia Date:
x
DECLARATION I hereby declare that the thesis is based on my original work except for quotations and citations which have been duly acknowledged. I also declare that it has not been previously or concurrently submitted for any other degree at UPM or other institutions. ROSYAINI AFINDI ZAMAN Date:

xi
TABLE OF CONTENTS Page DEDICATION ii ABSTRACT iii ABSTRAK v ACKNOWLEDGMENTS vii APPROVAL viii DECLARATION x LISTS OF TABLES xiii LISTS OF FIGURES xiv LISTS OF ABBREVIATIONS xvi LISTS OF SYMBOLS xvii CHAPTERS 1 INTRODUCTION 1.1 Introduction 1.1 1.2 Tin Oxide (SnO2) 1.3 1.3 Carbon Dioxide (CO2) 1.5 1.4 Background of Electrical Properties Measurement 1.6 1.5 Thermal Diffusivity 1.7 1.6 The Objective of Study 1.8 2 LITERATURE REVIEW 2.1 Introduction 2.1 2.2 The History of Gas Sensor 2.1 2.3 Sensing Characterization 2.2 2.4 SnO2 Gas Sensor 2.3 2.5 Measurement of Thermal Diffusivity Using Photoflash
Technique
2.8 3
THEORY
3.1 Semiconductor Material 3.1 3.2 Ohmic Contact 3.2 3.3 Sensing Properties of SnO2 Ceramic Gas Sensor 3.3 3.4 Photoflash Technique 3.5 4 METHODOLOGY 4.1 Sample Preparation 4.1 4.2 X-ray Diffraction Analysis 4.5 4.3 Microstructure Analysis 4.5 4.4 Sensing Characteristics System (SCS) 4.6 4.4.1 Experimental Procedure of Sensing Characteristic
System 4.13
4.5 Photoflash Technique 4.14 4.5.1 Experimental Procedure of Photoflash Technique 4.16
xii
5 RESULTS AND DISCUSSION 5.1 Introduction 5.1 5.2 I-V Measurement Using Two-Probe Technique 5.1 5.2.1 I-V Characteristic of Pure SnO2 and SnO2 - CuO
System at Different Temperatures 5.2
5.2.2 The Effect of Gas Pressure on I-V Characteristic of Pure SnO2 and SnO2 - CuO System
5.7
5.2.3 The Influence of Annealing Temperature on I-V Characteristic of 60 mol% SnO2 - 40 mol% CuO System
5.10
5.3 Sensing Characteristics 5.14 5.3.1 Sensing Characteristic of Pure SnO2 and (SnO2 - CuO)
System 5.15
5.3.2 The Effect of Gas Pressure on Sensing Properties of SnO2 - CuO System
5.20
5.3.3 Sensor Sensitivity of (60 mol% SnO2 - 40 mol% CuO) at Different Annealing Temperature
5.24
5.4 Response Time Characteristics 5.28 5.4.1 Response Time of Pure SnO2 and SnO2 - CuO System 5.28 5.4.2 The Influence of Gas Pressure on Response Time of
Pure SnO2 and SnO2 - CuO System 5.31
5.4.3 Effect of Annealing Temperature on the Sensor Response Time of 60 mol% SnO2 - 40 mol% CuO
5.33
5.5 Thermal Diffusivity 5.35 5.5.1 The Effect of CuO Composition on Thermal
Diffusivity of SnO2 - CuO System 5.35
5.5.2 The Annealing Effect on Thermal Diffusivity of 60 mol% SnO2 - 40 mol% CuO System
5.39
6
CONCLUSION
6.1 Conclusion 6.1 6.2 I-V Measurement Using Two-Probe Technique 6.1 6.3 Sensing Characteristics 6.2 6.4 Response Time Characteristics 6.3 6.5 Thermal Diffusivity 6.4 6.6 Recommendation 6.5 REFERENCES R.1 APPENDIXS A.1 BIODATA OF THE AUTHOR B.1
xiii
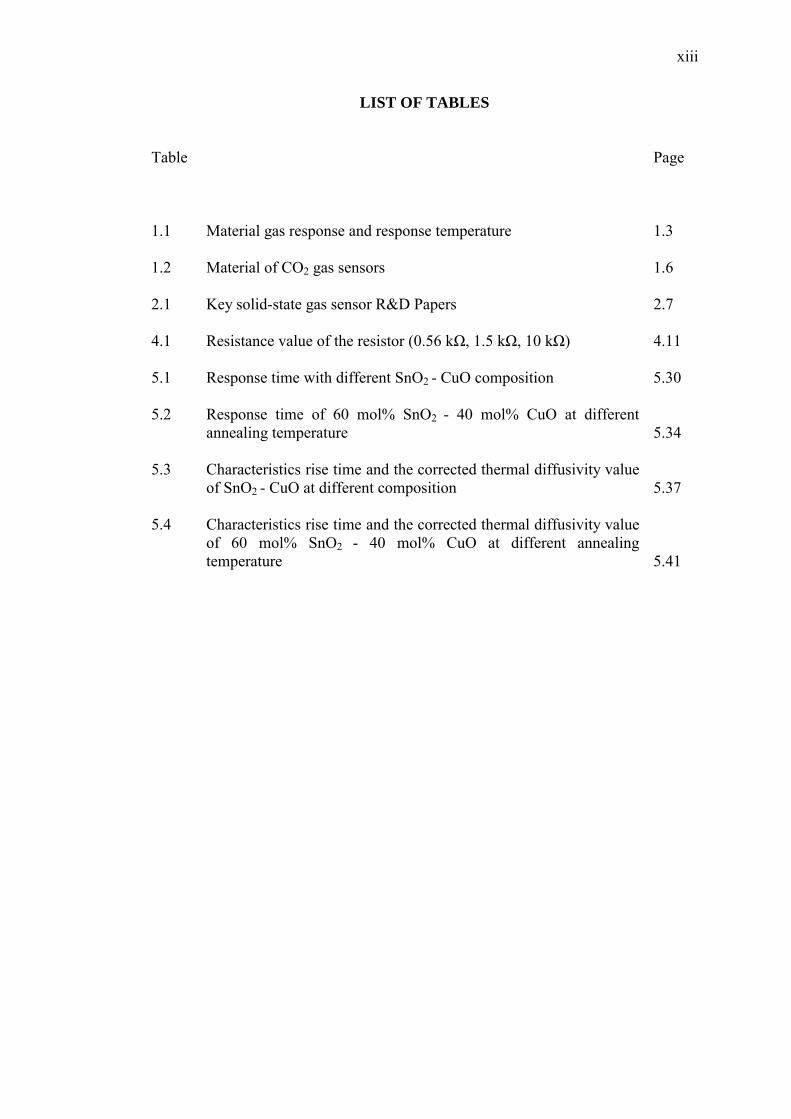
LIST OF TABLES Table Page
1.1 Material gas response and response temperature 1.3
1.2 Material of CO2 gas sensors 1.6
2.1 Key solid-state gas sensor R&D Papers 2.7
4.1 Resistance value of the resistor (0.56 kΩ, 1.5 kΩ, 10 kΩ) 4.11
5.1 Response time with different SnO2 - CuO composition 5.30
5.2 Response time of 60 mol% SnO2 - 40 mol% CuO at different annealing temperature
5.34
5.3
Characteristics rise time and the corrected thermal diffusivity value of SnO2 - CuO at different composition
5.37
5.4
Characteristics rise time and the corrected thermal diffusivity value of 60 mol% SnO2 - 40 mol% CuO at different annealing temperature
5.41

xiv
LISTS OF FIGURES Figure Page 1.1 The structure of SnO2 1.4
1.2 The structure of CuO 1.5
3.1 Resistivity scale of materials found in nature 3.2
3.2 Model of n-type semiconductor grains (a) Physical model of three contacting grains are shown to illustrate how depletion region dominates the intergranular contact (b) Band model corresponding to Figure 3.1 (a)
3.5
4.1 Flow chart for sample preparation 4.4
4.2 The front panel of the data acquisition program 4.9
4.3 Block diagram of the data acquisition program 4.10
4.4 The I-V characteristics of resistor (0.56 kΩ, 1.5 kΩ, 10 kΩ) 4.10
4.5 (a) Schematic diagram of chamber
(b) Schematic diagram of sample
4.12
4.13
4.6 Schematic diagram of the I-V characteristic experiment 4.14
4.7 Schematic diagram of the photoflash experiment 4.15
5.1 I-V characteristics of pure SnO2 at different temperature in (a) air and (b) CO2 (gas pressure: 15 Torr)
5.3
5.2 Variation of current at 10 V with addition of CuO into SnO2 in (a) air (b) CO2
5.4
5.3 (a) Conductivity of SnO2 -CuO system at different temperature (b) Conductivity of SnO2 -CuO system measured at 160 0C, 260 0C and 320 0C in CO2 environment
5.6
5.4 I-V characteristics at different gas pressure of (a) pure SnO2 (b) 60 mol% SnO2 - 40 mol% CuO
5.8
5.5 Resistance and conductivity with different gas pressure of (a) SnO2 at 300 0C (b) 60 mol% SnO2 - 40 mol% CuO at 220 0C
5.9
5.6 Model illustrating CO2 sensing mechanism in SnO2 gas sensor 5.10
xv
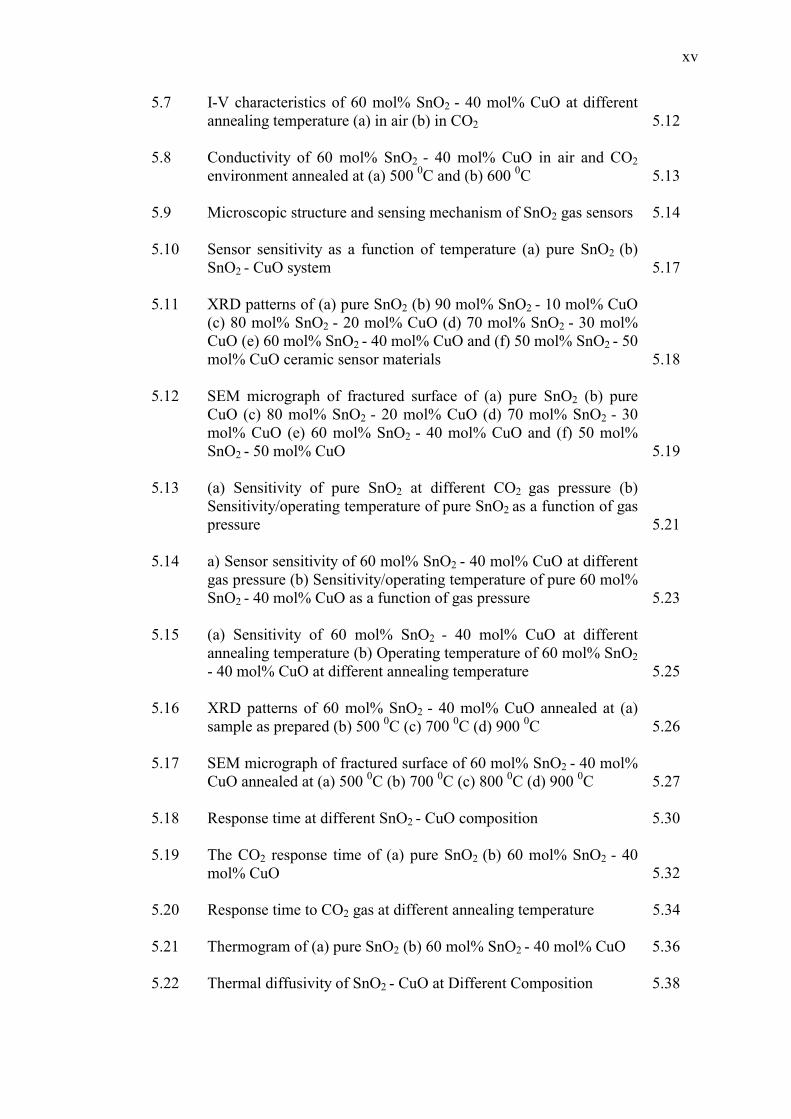
5.7 I-V characteristics of 60 mol% SnO2 - 40 mol% CuO at different annealing temperature (a) in air (b) in CO2
5.12
5.8 Conductivity of 60 mol% SnO2 - 40 mol% CuO in air and CO2 environment annealed at (a) 500 0C and (b) 600 0C
5.13
5.9 Microscopic structure and sensing mechanism of SnO2 gas sensors 5.14
5.10 Sensor sensitivity as a function of temperature (a) pure SnO2 (b) SnO2 - CuO system
5.17
5.11 XRD patterns of (a) pure SnO2 (b) 90 mol% SnO2 - 10 mol% CuO (c) 80 mol% SnO2 - 20 mol% CuO (d) 70 mol% SnO2 - 30 mol% CuO (e) 60 mol% SnO2 - 40 mol% CuO and (f) 50 mol% SnO2 - 50 mol% CuO ceramic sensor materials
5.18
5.12 SEM micrograph of fractured surface of (a) pure SnO2 (b) pure CuO (c) 80 mol% SnO2 - 20 mol% CuO (d) 70 mol% SnO2 - 30 mol% CuO (e) 60 mol% SnO2 - 40 mol% CuO and (f) 50 mol% SnO2 - 50 mol% CuO
5.19
5.13 (a) Sensitivity of pure SnO2 at different CO2 gas pressure (b) Sensitivity/operating temperature of pure SnO2 as a function of gas pressure
5.21
5.14 a) Sensor sensitivity of 60 mol% SnO2 - 40 mol% CuO at different gas pressure (b) Sensitivity/operating temperature of pure 60 mol% SnO2 - 40 mol% CuO as a function of gas pressure
5.23
5.15 (a) Sensitivity of 60 mol% SnO2 - 40 mol% CuO at different annealing temperature (b) Operating temperature of 60 mol% SnO2 - 40 mol% CuO at different annealing temperature
5.25
5.16 XRD patterns of 60 mol% SnO2 - 40 mol% CuO annealed at (a) sample as prepared (b) 500 0C (c) 700 0C (d) 900 0C
5.26
5.17 SEM micrograph of fractured surface of 60 mol% SnO2 - 40 mol% CuO annealed at (a) 500 0C (b) 700 0C (c) 800 0C (d) 900 0C
5.27
5.18 Response time at different SnO2 - CuO composition 5.30
5.19 The CO2 response time of (a) pure SnO2 (b) 60 mol% SnO2 - 40 mol% CuO
5.32
5.20 Response time to CO2 gas at different annealing temperature 5.34
5.21 Thermogram of (a) pure SnO2 (b) 60 mol% SnO2 - 40 mol% CuO 5.36
5.22 Thermal diffusivity of SnO2 - CuO at Different Composition 5.38
xvi
5.23 Thermogram of 60 mol% SnO2 - 40 mol% CuO annealed at (a) 600 0C (thickness, L=0.2079 cm) (b) 800 0C (thickness, L=0.2076 cm)
5.40
5.24 Thermal diffusivity of 60 mol% SnO2 - 40 mol% CuO at different annealing temperature
5.41
xvii
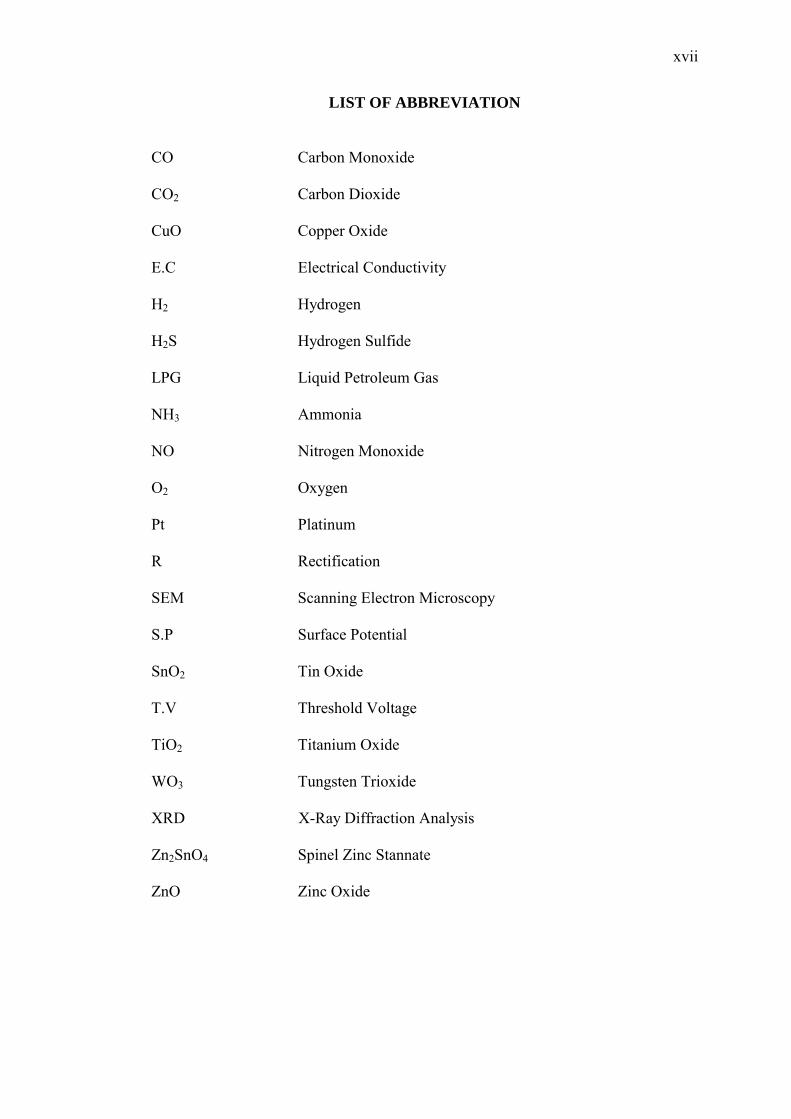
LIST OF ABBREVIATION CO Carbon Monoxide
CO2 Carbon Dioxide
CuO Copper Oxide
E.C Electrical Conductivity
H2 Hydrogen
H2S Hydrogen Sulfide
LPG Liquid Petroleum Gas
NH3 Ammonia
NO Nitrogen Monoxide
O2 Oxygen
Pt Platinum
R Rectification
SEM Scanning Electron Microscopy
S.P Surface Potential
SnO2 Tin Oxide
T.V Threshold Voltage
TiO2 Titanium Oxide
WO3 Tungsten Trioxide
XRD X-Ray Diffraction Analysis
Zn2SnO4 Spinel Zinc Stannate
ZnO Zinc Oxide
xviii
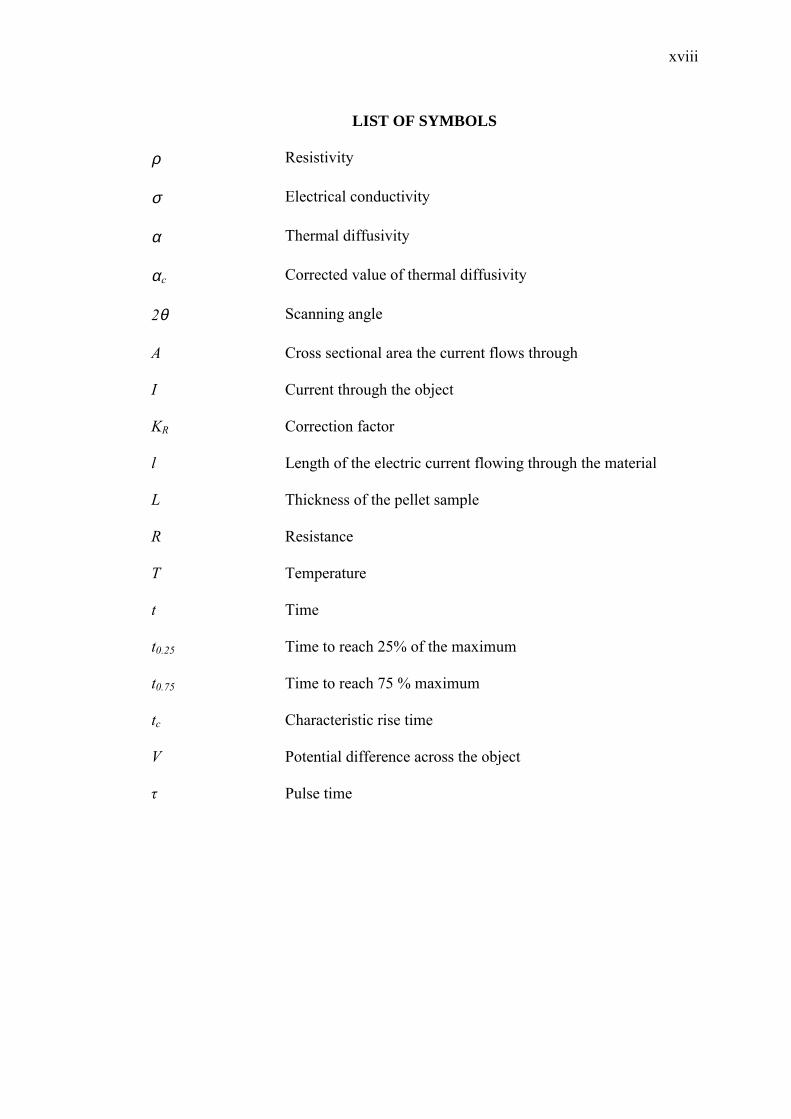
LIST OF SYMBOLS
ρ Resistivity
σ Electrical conductivity
α Thermal diffusivity
αc Corrected value of thermal diffusivity
2θ Scanning angle
A Cross sectional area the current flows through
I Current through the object
KR Correction factor
l Length of the electric current flowing through the material
L Thickness of the pellet sample
R Resistance
T Temperature
t Time
t0.25 Time to reach 25% of the maximum
t0.75 Time to reach 75 % maximum
tc Characteristic rise time
V Potential difference across the object
τ Pulse time
CHAPTER 1
INTRODUCTION
1.1 Introduction
In recent years, world awareness on environmental problems continue to increase.
The continuous release to the atmosphere of chemical pollutants, originating mainly
from combustion processes, is the main cause of the deterioration of environmental
quality. The development of new methods to monitor polluted gases in the air is of
primary concern for the knowledge of the extension of the environmental
deterioration. Measurements of gas concentrations in air are being carried out mostly
by analytical instruments, which are precise, but also very costly. They often cannot
be placed on-site and need long periods for data acquisition. Thus they are not
suitable for on-line gas monitoring (Traversa et al., 1998).
Since the demonstration of almost 50 years ago (Zakrzewska, 2001, Sberveglieri,
1995) that the adsorption of gas on the surface of a semiconductor can bring about a
significant change in the electrical resistance of the materials, there has been a
sustained and successful effort to make use of this change for the purpose of gas
detection (Kohl, 1990). From that time, a great amount of research was carried out
in order to realize commercial semiconducting devices for gas detection
(Sberveglieri, 1995, Brattain and Bardeen, 1953).
1.2
Semiconducting gas sensors using SnO2 have been studied extensively since it was
first proposed in 1962 (Seiyama et al., 1962). The development of gas sensors to
monitor the toxic and combustible gases is imperative due to the concerns for
environmental pollution and the safety requirements for the industry (Chang et al.,
2002). The sensors are used as the active part of gas and fire alarm system as well as
for measuring or detecting the concentration of combustibles or other gas in the air
(Mizsei, 1995).
In general, sensor provides an interface between the electronic equipment and the
physical world typically by converting non-electrical physical or chemical quantities
into electrical signals. The fundamental sensing principle relies on the change of
conductivity of the sensors when they are exposed to certain target gases at moderate
temperatures. Ponce et al. in 2003 said that gas sensors based on semiconducting
metal oxides are devices which present a change in the resistivity with the gas
exposure and the sensing mechanism involves an electrical conductance change
caused by gas adsorption on the chemical surface.
It is well accepted that the sensitivity of a semiconductor oxide gas sensors comes
from the change of the electrical conductivity of a sensor due to the gas atmosphere
surrounding the sensor. The conducting of an n-type semiconductor gas sensor is an
oxidizing at atmosphere and when the sensor comes into contact with reducing gas
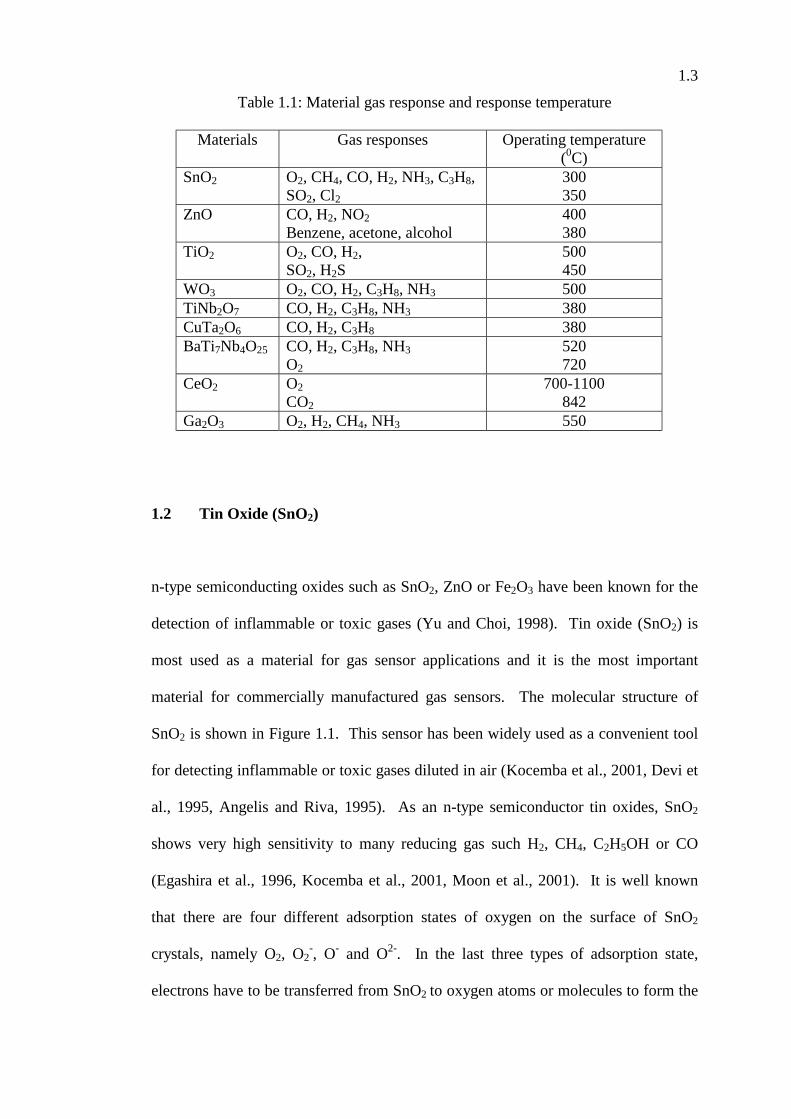
such as CO, CO2 or H2. For example, Table 1.1 shows the materials and gas
response of each gas sensors. The surface reactions taking place between surface
oxygen species and reducing gases are believed to play key roles in increasing the
conductivity of the sensors (Li et al., 1999).
1.3
Table 1.1: Material gas response and response temperature
Materials Gas responses Operating temperature (0C)
SnO2 O2, CH4, CO, H2, NH3, C3H8, SO2, Cl2
300 350
ZnO CO, H2, NO2 Benzene, acetone, alcohol
400 380
TiO2 O2, CO, H2, SO2, H2S
500 450
WO3 O2, CO, H2, C3H8, NH3 500 TiNb2O7 CO, H2, C3H8, NH3 380 CuTa2O6 CO, H2, C3H8 380 BaTi7Nb4O25 CO, H2, C3H8, NH3
O2 520 720
CeO2 O2 CO2
700-1100 842
Ga2O3 O2, H2, CH4, NH3 550
1.2 Tin Oxide (SnO2)
n-type semiconducting oxides such as SnO2, ZnO or Fe2O3 have been known for the
detection of inflammable or toxic gases (Yu and Choi, 1998). Tin oxide (SnO2) is
most used as a material for gas sensor applications and it is the most important
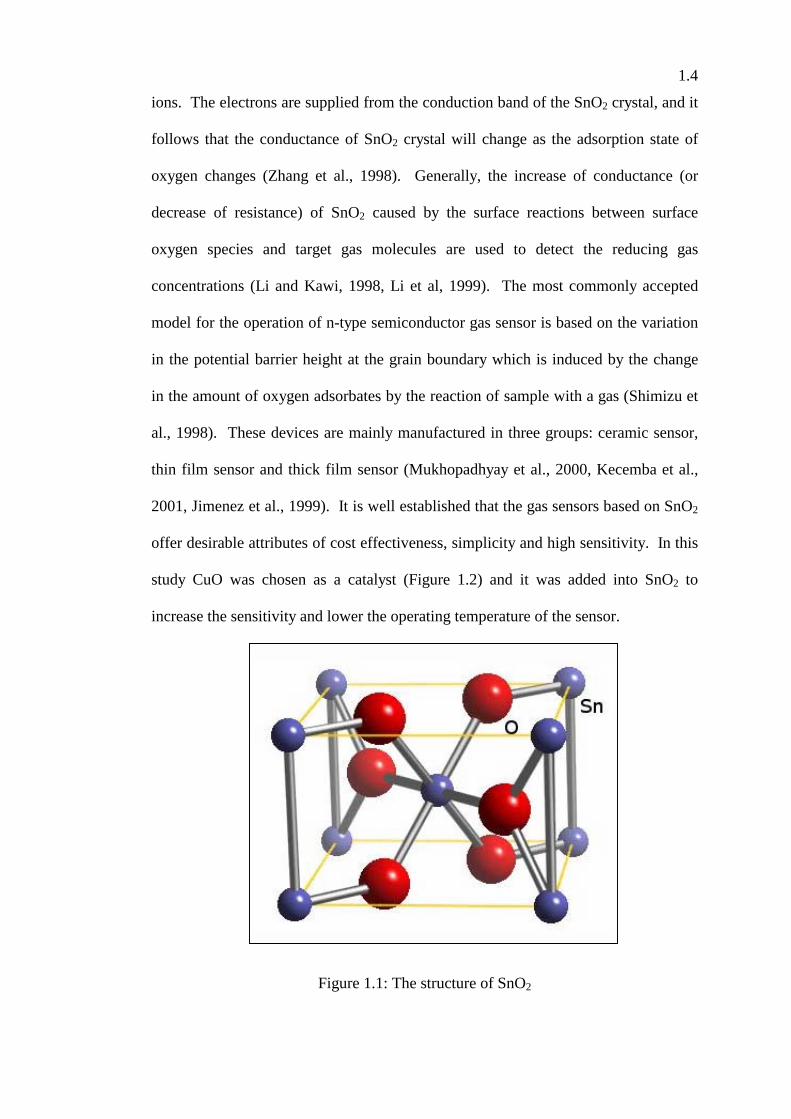
material for commercially manufactured gas sensors. The molecular structure of
SnO2 is shown in Figure 1.1. This sensor has been widely used as a convenient tool
for detecting inflammable or toxic gases diluted in air (Kocemba et al., 2001, Devi et
al., 1995, Angelis and Riva, 1995). As an n-type semiconductor tin oxides, SnO2
shows very high sensitivity to many reducing gas such H2, CH4, C2H5OH or CO
(Egashira et al., 1996, Kocemba et al., 2001, Moon et al., 2001). It is well known
that there are four different adsorption states of oxygen on the surface of SnO2
crystals, namely O2, O2-, O- and O2-. In the last three types of adsorption state,
electrons have to be transferred from SnO2 to oxygen atoms or molecules to form the
1.4
ions. The electrons are supplied from the conduction band of the SnO2 crystal, and it
follows that the conductance of SnO2 crystal will change as the adsorption state of
oxygen changes (Zhang et al., 1998). Generally, the increase of conductance (or
decrease of resistance) of SnO2 caused by the surface reactions between surface
oxygen species and target gas molecules are used to detect the reducing gas
concentrations (Li and Kawi, 1998, Li et al, 1999). The most commonly accepted
model for the operation of n-type semiconductor gas sensor is based on the variation
in the potential barrier height at the grain boundary which is induced by the change
in the amount of oxygen adsorbates by the reaction of sample with a gas (Shimizu et
al., 1998). These devices are mainly manufactured in three groups: ceramic sensor,
thin film sensor and thick film sensor (Mukhopadhyay et al., 2000, Kecemba et al.,
2001, Jimenez et al., 1999). It is well established that the gas sensors based on SnO2
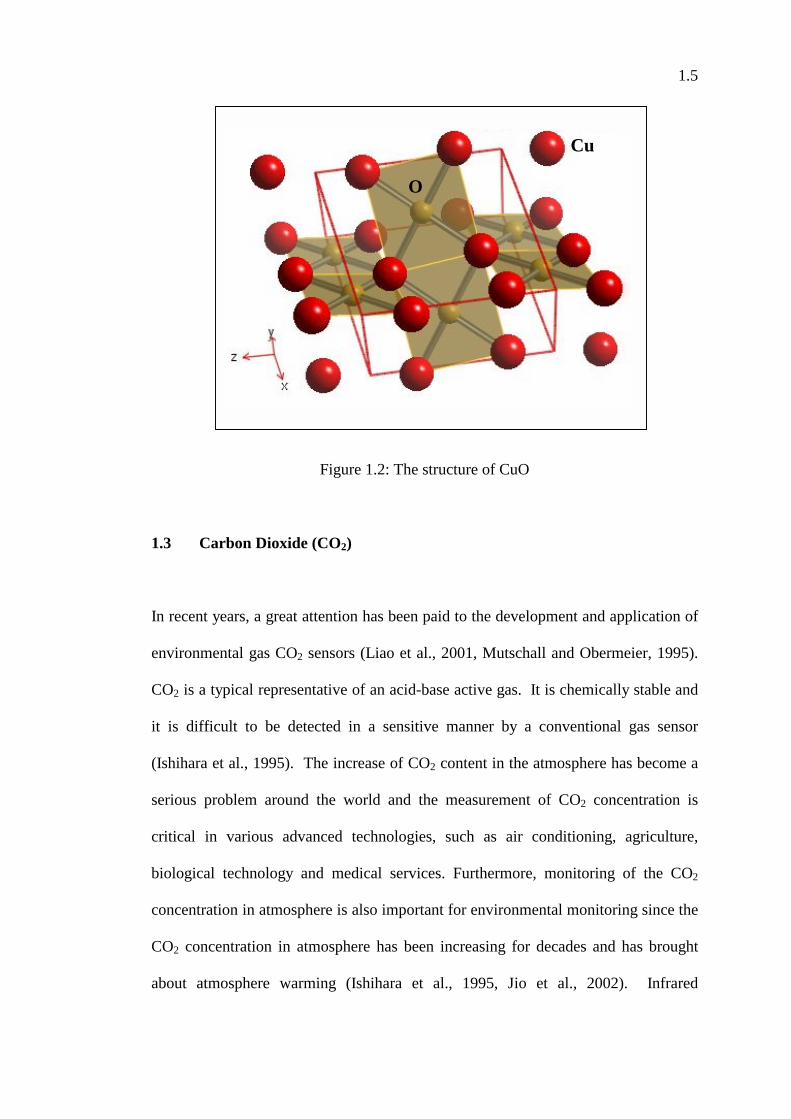
offer desirable attributes of cost effectiveness, simplicity and high sensitivity. In this
study CuO was chosen as a catalyst (Figure 1.2) and it was added into SnO2 to
increase the sensitivity and lower the operating temperature of the sensor.
Figure 1.1: The structure of SnO2
1.5
Figure 1.2: The structure of CuO
1.3 Carbon Dioxide (CO2)
In recent years, a great attention has been paid to the development and application of
environmental gas CO2 sensors (Liao et al., 2001, Mutschall and Obermeier, 1995).
CO2 is a typical representative of an acid-base active gas. It is chemically stable and
it is difficult to be detected in a sensitive manner by a conventional gas sensor
(Ishihara et al., 1995). The increase of CO2 content in the atmosphere has become a
serious problem around the world and the measurement of CO2 concentration is
critical in various advanced technologies, such as air conditioning, agriculture,
biological technology and medical services. Furthermore, monitoring of the CO2
concentration in atmosphere is also important for environmental monitoring since the
CO2 concentration in atmosphere has been increasing for decades and has brought
about atmosphere warming (Ishihara et al., 1995, Jio et al., 2002). Infrared
Cu
O