lecture 1 pendahuluan
DESCRIPTION
Instrumentasi industriTRANSCRIPT
INSTRUMENTASI INDUSTRI
By :
Bhakti Yudho Suprapto, ST.MT
Djulil Amri, ST.MT
Pendahuluan
KONTRAK BELAJAR• Kehadiran min. 80%• Nilai tugas 10%• Nilai Kuis 15%• Nilai Mid test 30%• Nilai UAS 45%• Terlambat maks 15 menit• Tugas maks 1 minggu
MATERI1. Pendahuluan
- Pengertian Instrumentasi Industri- Arsitektur instrumentasi industri- P&ID diagram- Unit dan standard
2. Basic electrical komponen3. Sistem Sensor
- Analog dan digital elektronik- Tekanan- Temperatur- Aliran- Level- Posisi
Pengukuran Kesalahan dan kalibrasi
3. Proses Kontrol- Pengendali PID dan implementasi- Tuning Pengendali- Metode Feedforward predictive dan ratio control- Metode Cascade, Override dan Split Control
4. Programmable Logic Control 5. Aktuator (Electric, Hidrolic, Pneumatic)6. Pengkondisi sinyal 7.Peralatan Utama Sistem Kelistrikan (Motor,
Generator, Transformator, Rele proteksi)8. Industrial Embedded dan Sistem Komunikasi
REFERENSI
Dunn, William C., 2006,” Introduction to Instrumentation, Sensor and Process Control”, Artech House, ISBN : 1-58053-011-7
Dunn, William C., 2005,”Fundamental of Industrial Instrumentation and Process Control”, McGraw Hill, ISBN : 0-07-145735-6
Scott, David M., 2008,”Industrial Process Sensors”, CRC Press, ISBN : 978-1-4200-4416-4
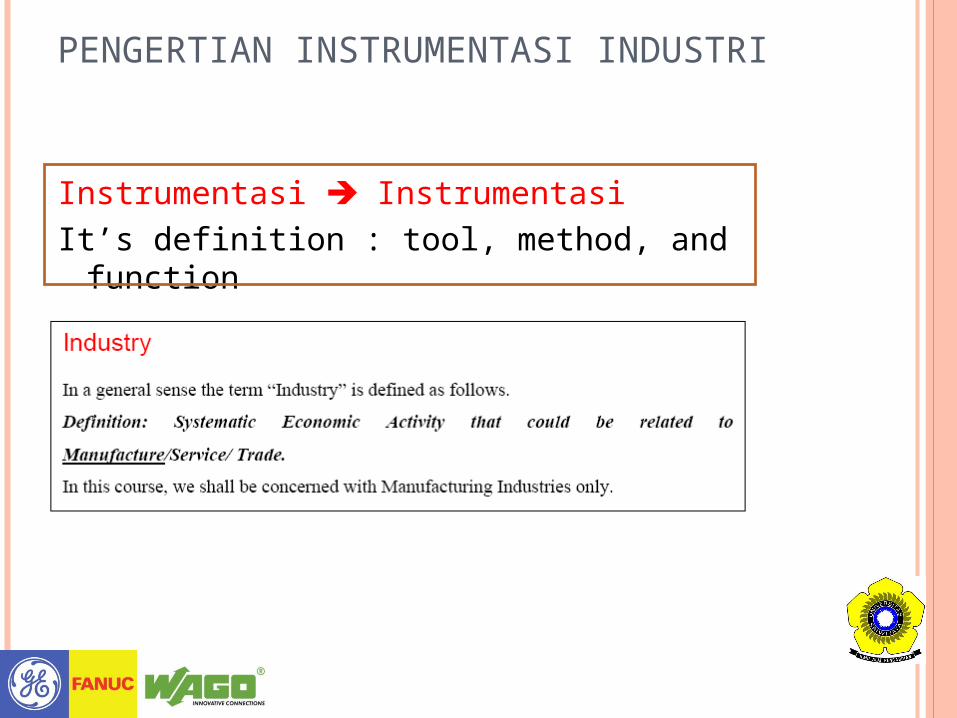
PENGERTIAN INSTRUMENTASI INDUSTRI
Instrumentasi InstrumentasiIt’s definition : tool, method, and function
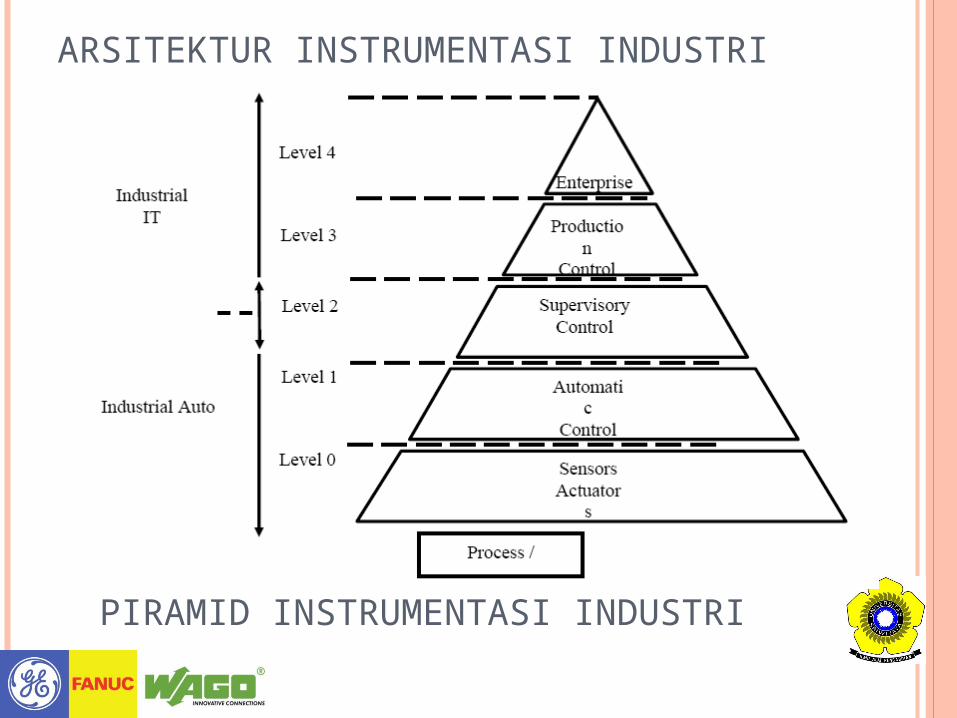
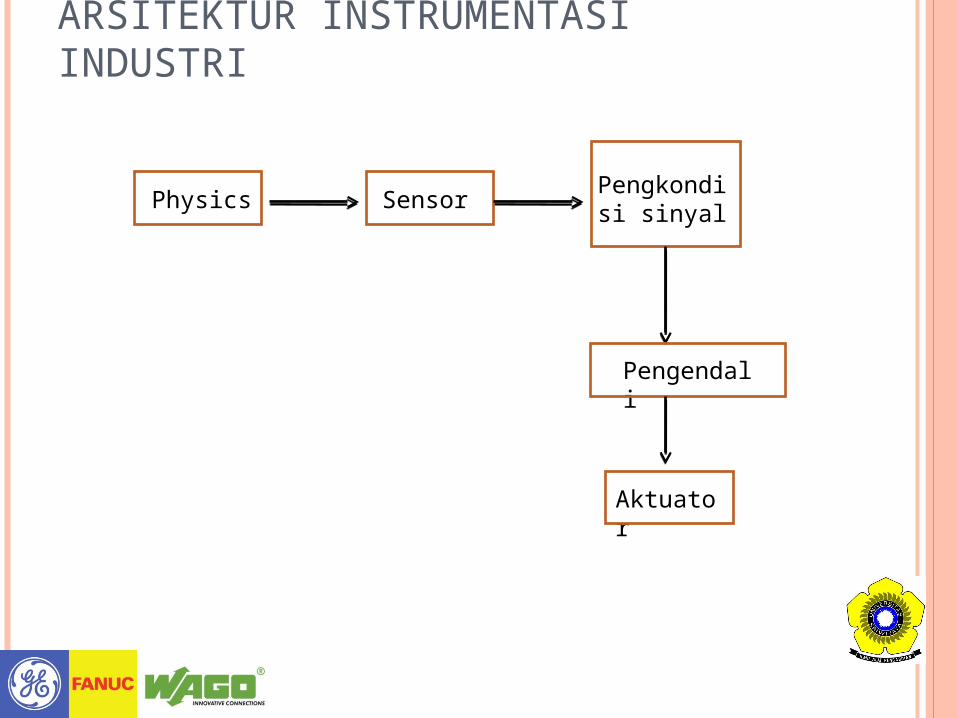
ARSITEKTUR INSTRUMENTASI INDUSTRI
PIRAMID INSTRUMENTASI INDUSTRI
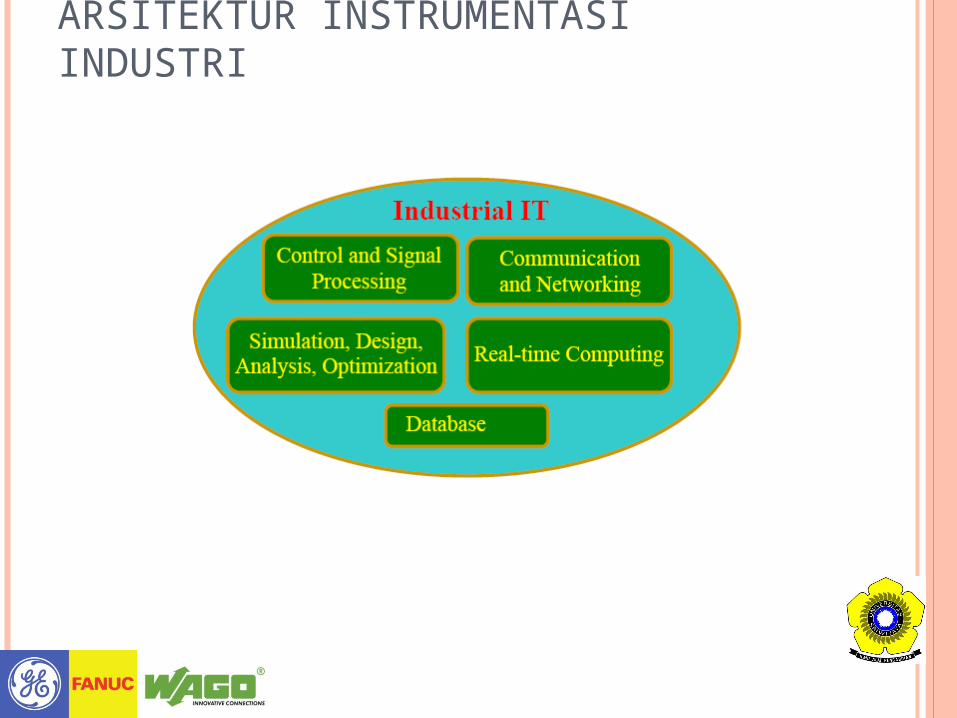
ARSITEKTUR INSTRUMENTASI INDUSTRI
ARSITEKTUR INSTRUMENTASI INDUSTRI
Physics SensorPengkondis
i sinyal
Pengendali
Aktuator
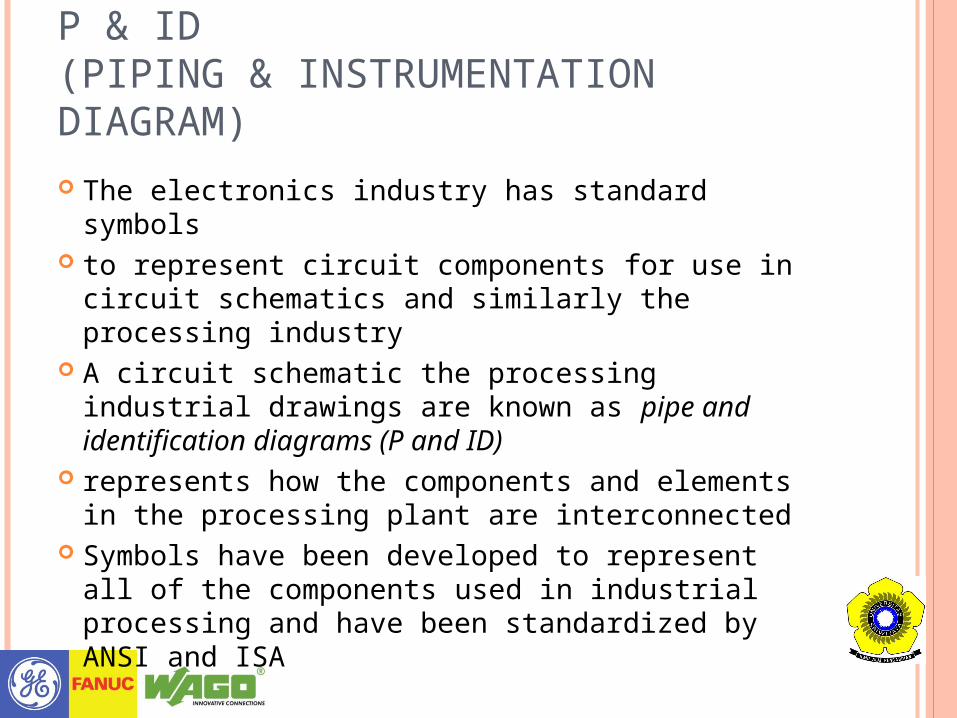
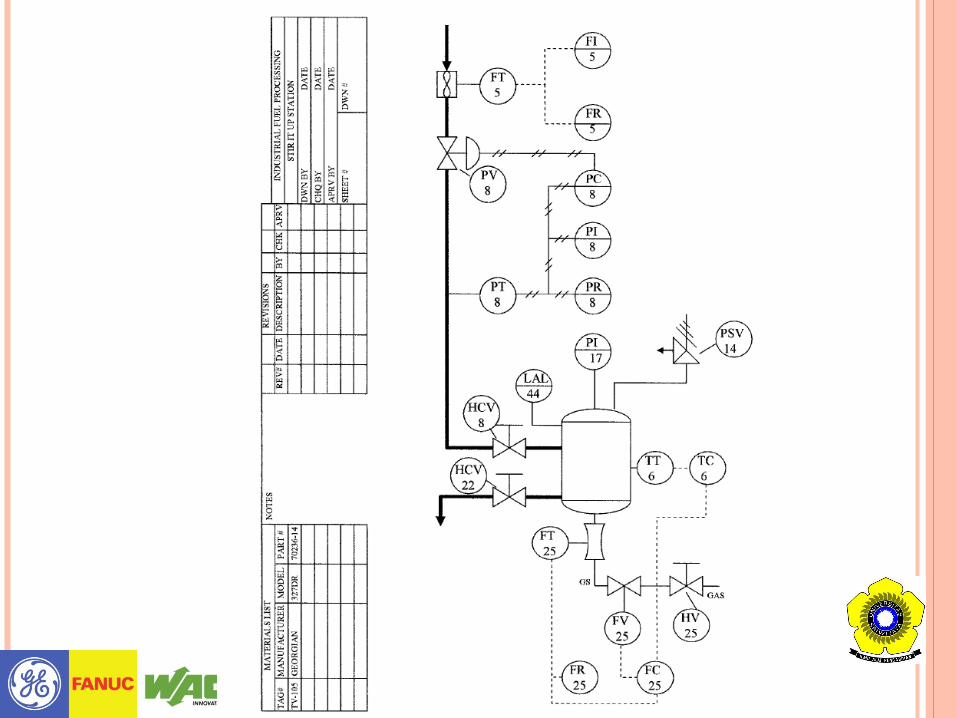
P & ID(PIPING & INSTRUMENTATION DIAGRAM)
The electronics industry has standard symbols to represent circuit components for use in circuit
schematics and similarly the processing industry A circuit schematic the processing industrial
drawings are known as pipe and identification diagrams (P and ID)
represents how the components and elements in the processing plant are interconnected
Symbols have been developed to represent all of the components used in industrial processing and have been standardized by ANSI and ISA
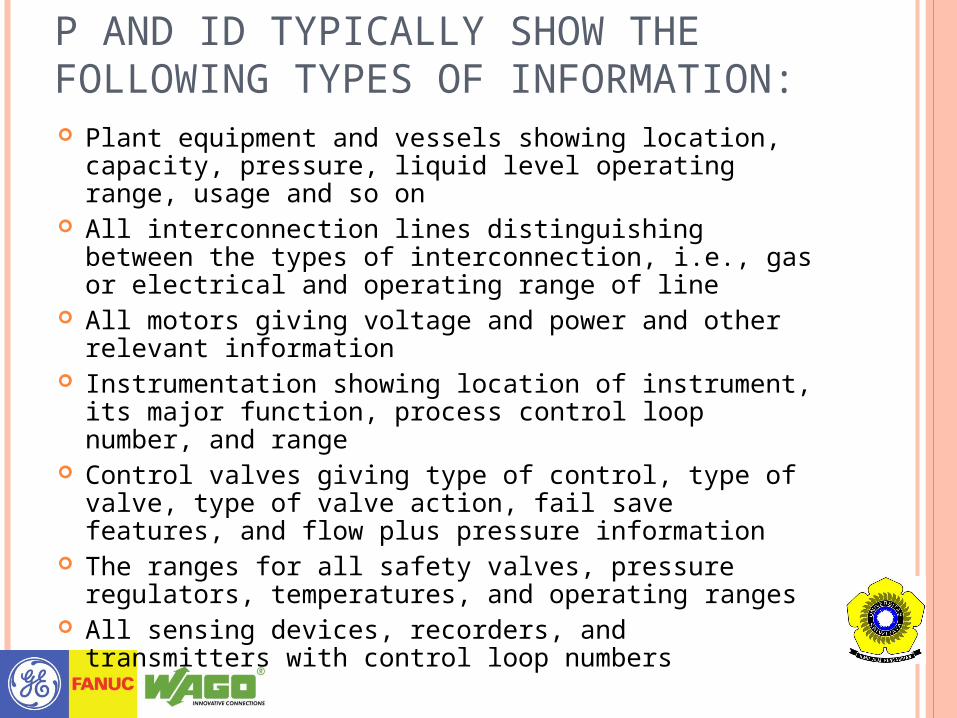
P AND ID TYPICALLY SHOW THE FOLLOWING TYPES OF INFORMATION: Plant equipment and vessels showing location,
capacity, pressure, liquid level operating range, usage and so on
All interconnection lines distinguishing between the types of interconnection, i.e., gas or electrical and operating range of line
All motors giving voltage and power and other relevant information
Instrumentation showing location of instrument, its major function, process control loop number, and range
Control valves giving type of control, type of valve, type of valve action, fail save features, and flow plus pressure information
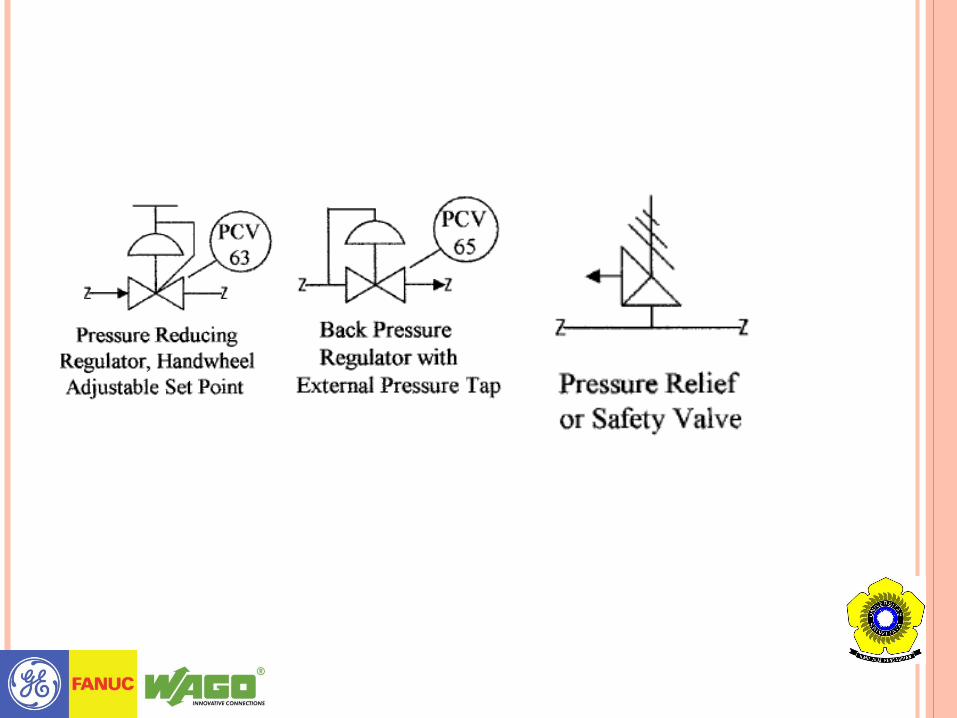
The ranges for all safety valves, pressure regulators, temperatures, and operating ranges
All sensing devices, recorders, and transmitters with control loop numbers
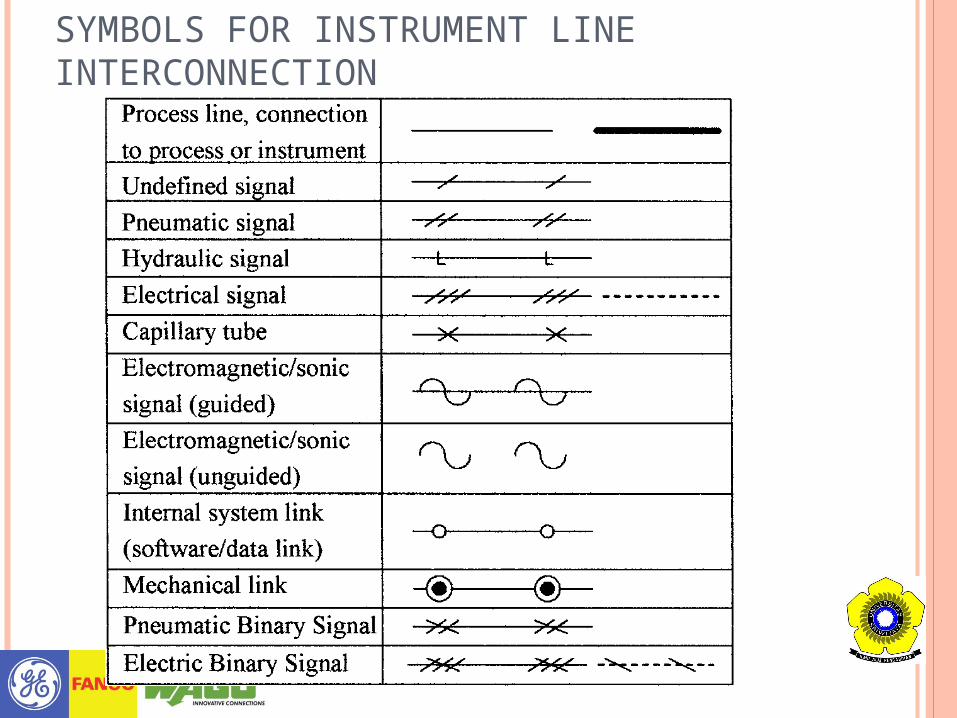
SYMBOLS FOR INSTRUMENT LINE INTERCONNECTION
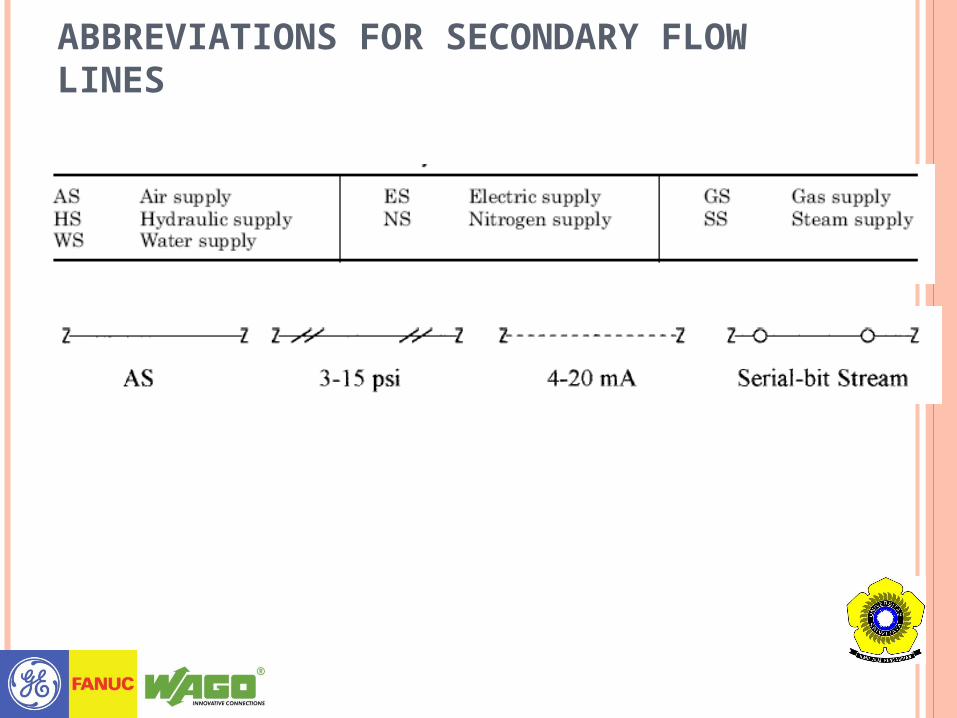
ABBREVIATIONS FOR SECONDARY FLOW LINES
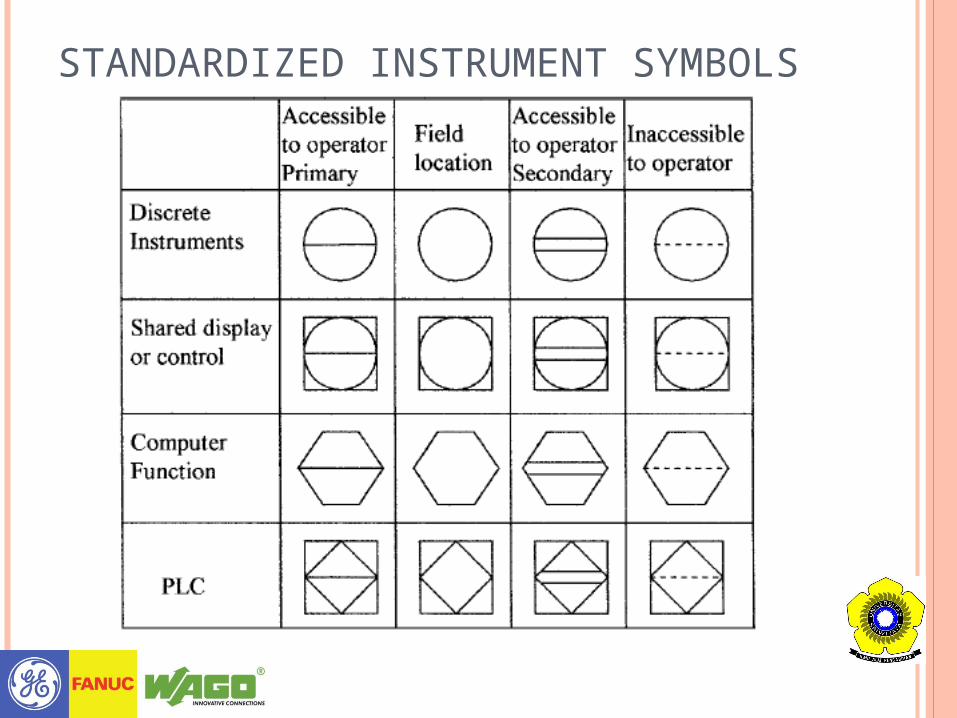
STANDARDIZED INSTRUMENT SYMBOLS
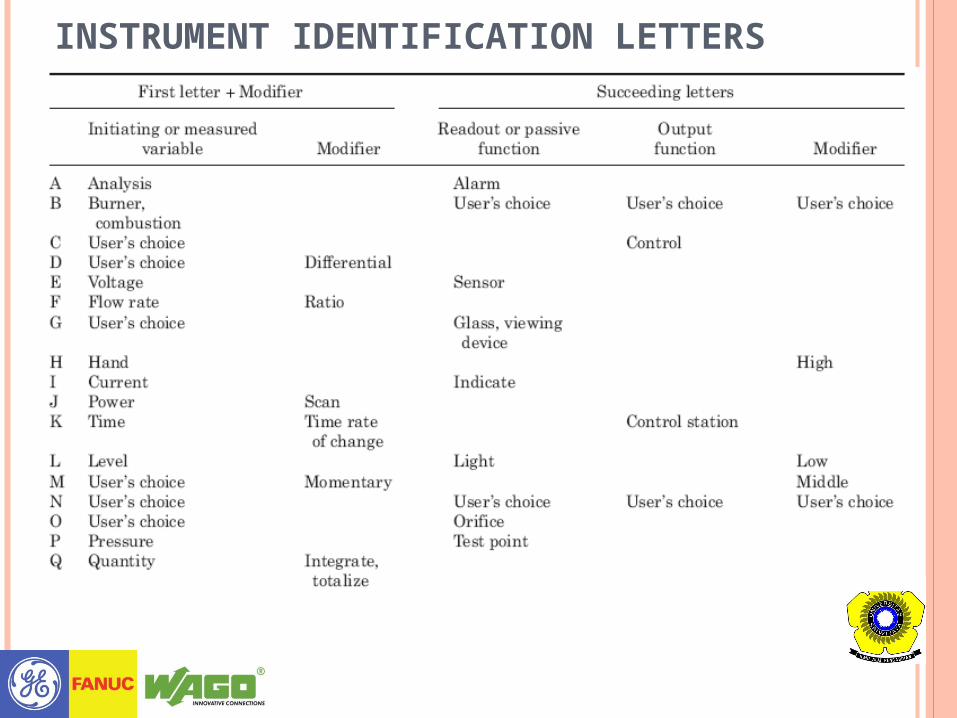
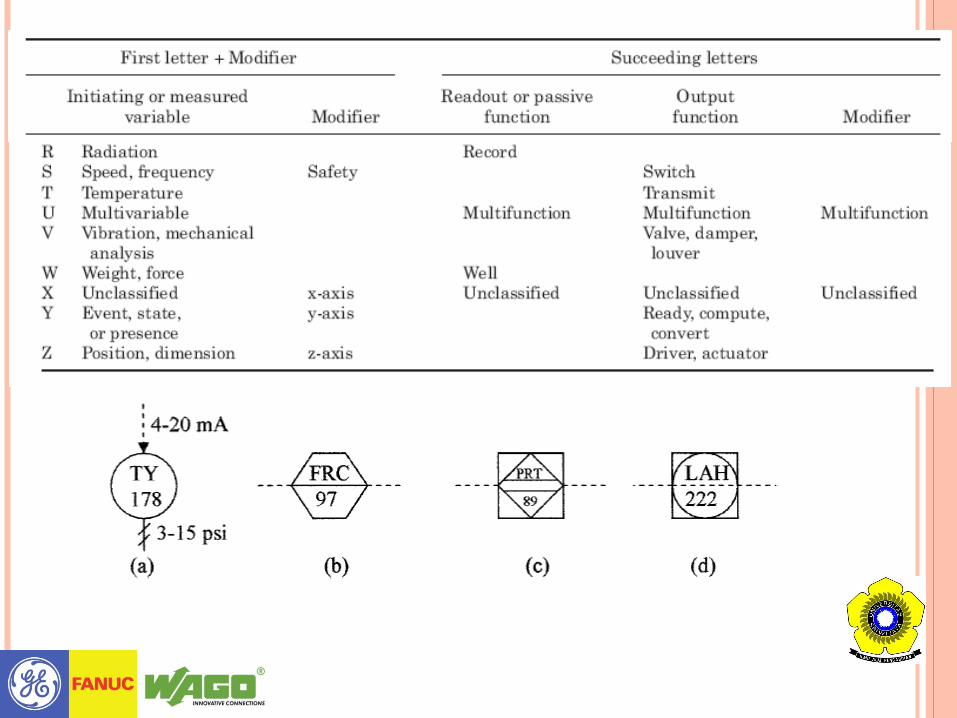
INSTRUMENT IDENTIFICATION LETTERS
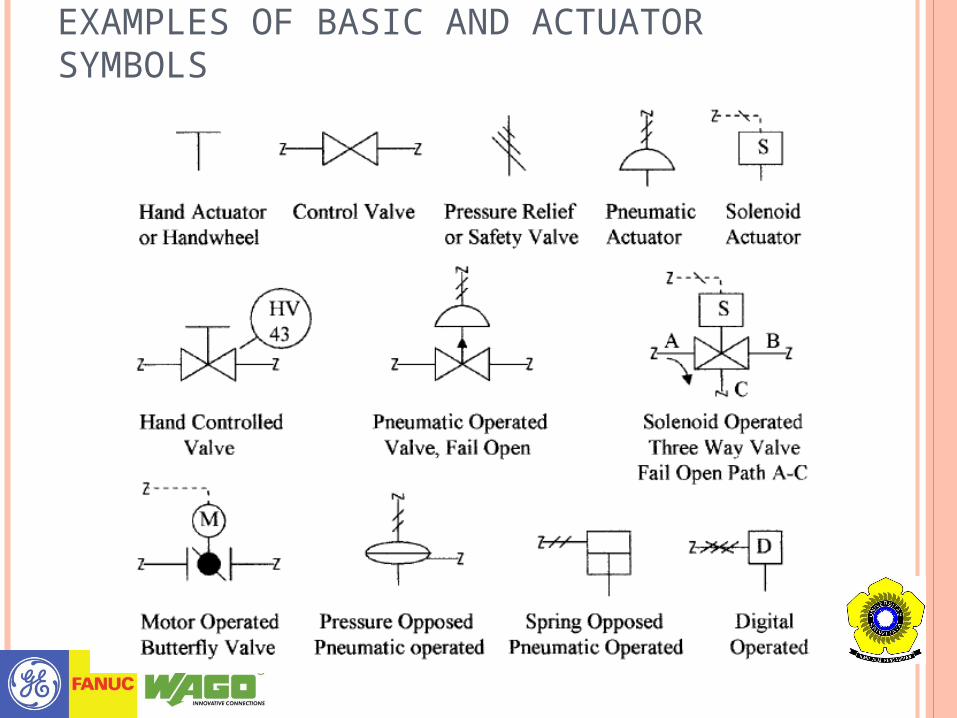
EXAMPLES OF BASIC AND ACTUATOR SYMBOLS
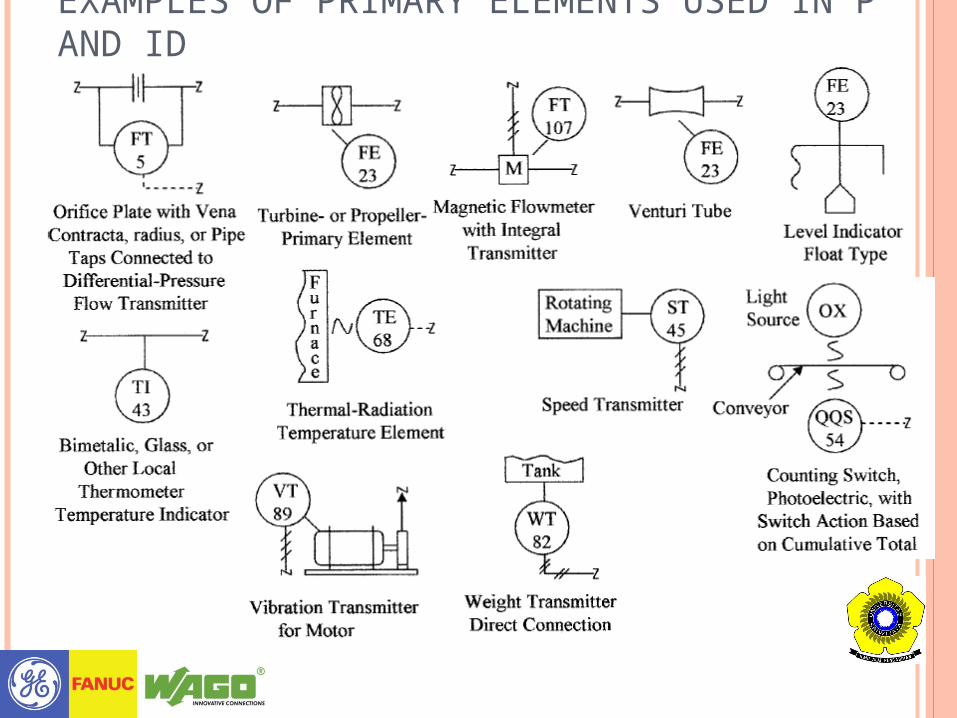
EXAMPLES OF PRIMARY ELEMENTS USED IN P AND ID
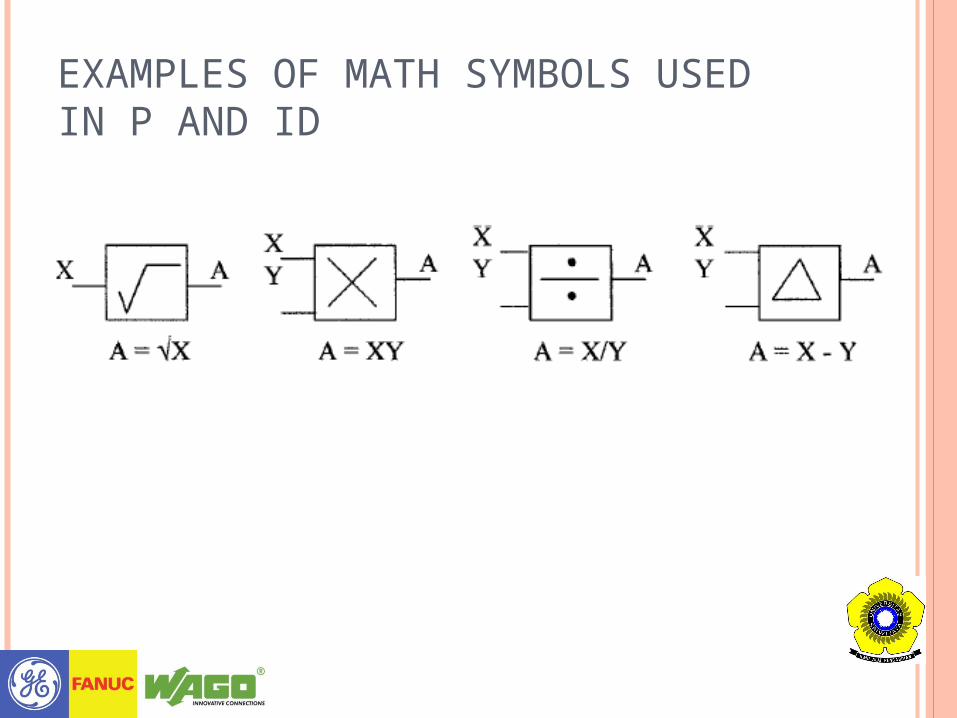
EXAMPLES OF MATH SYMBOLS USED IN P AND ID
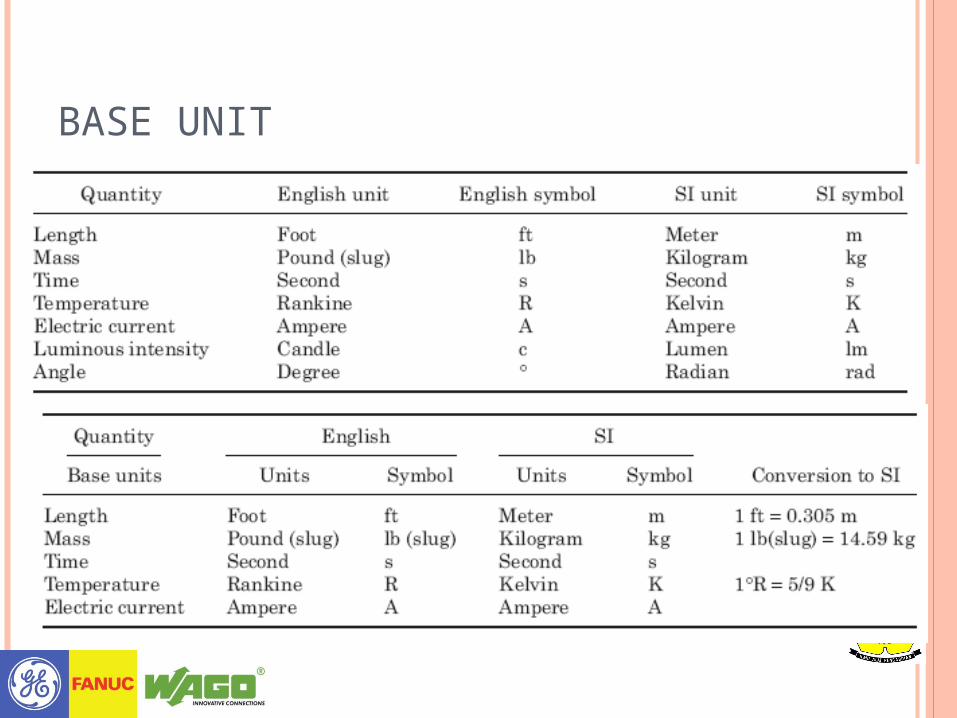
BASE UNIT
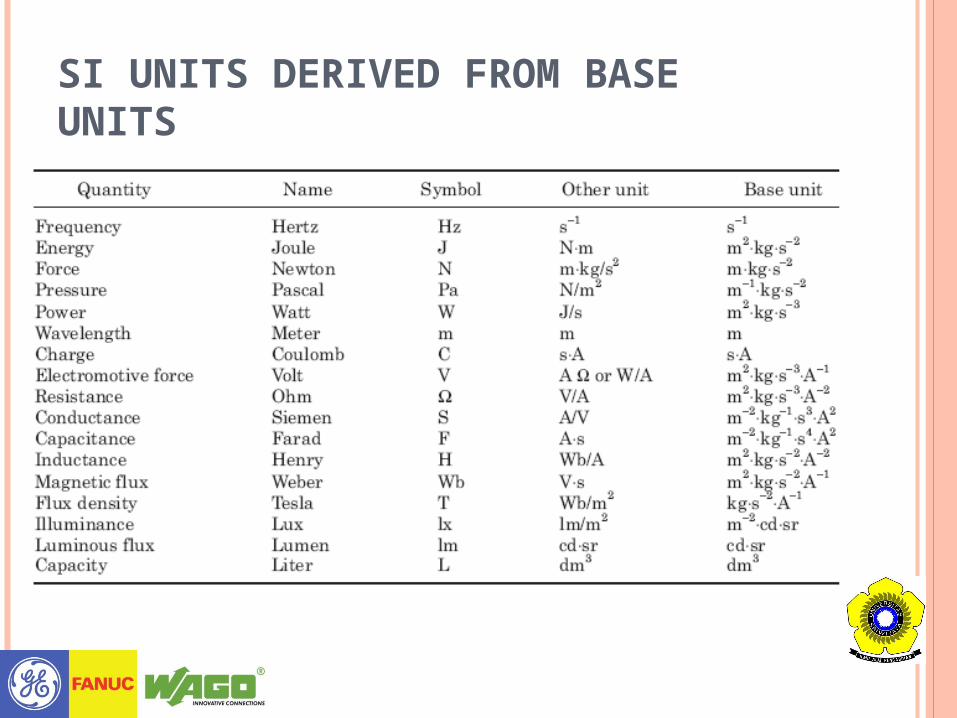
SI UNITS DERIVED FROM BASE UNITS
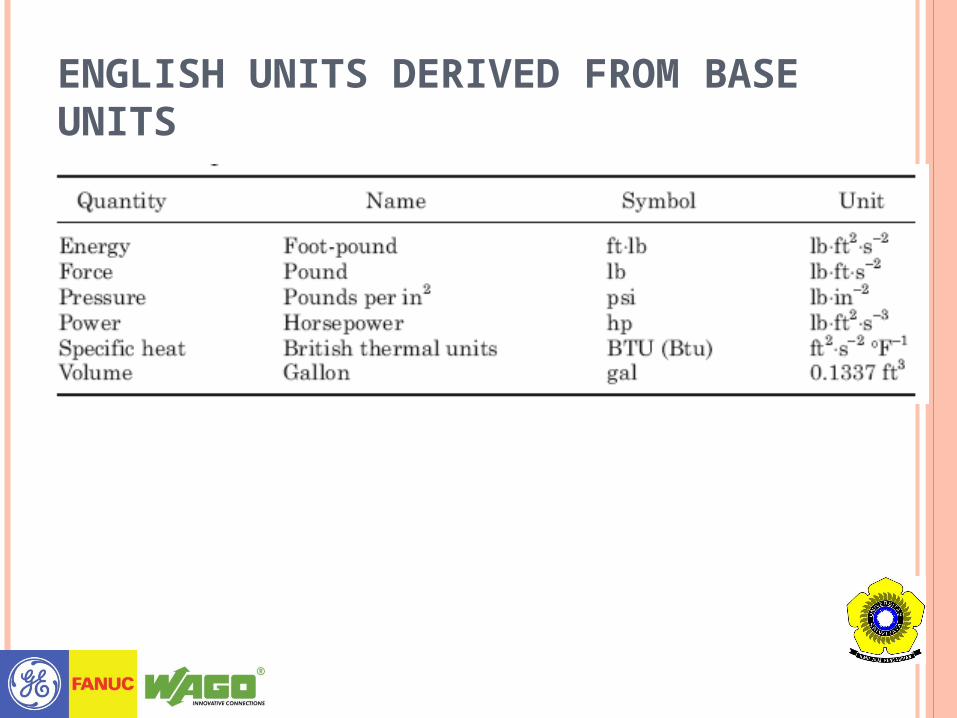
ENGLISH UNITS DERIVED FROM BASE UNITS
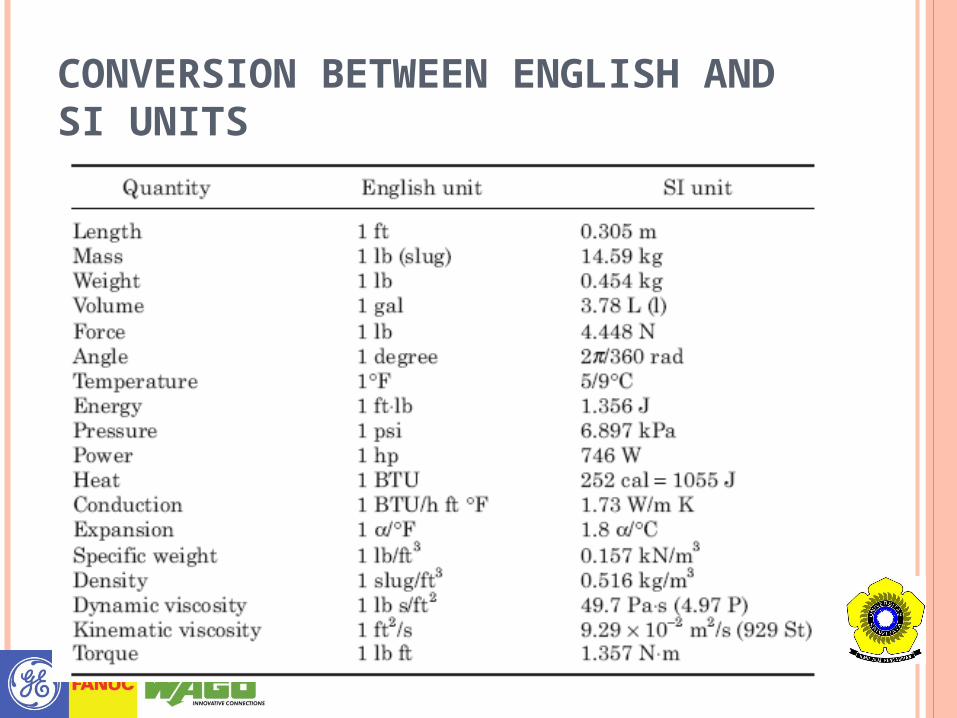
CONVERSION BETWEEN ENGLISH AND SI UNITS
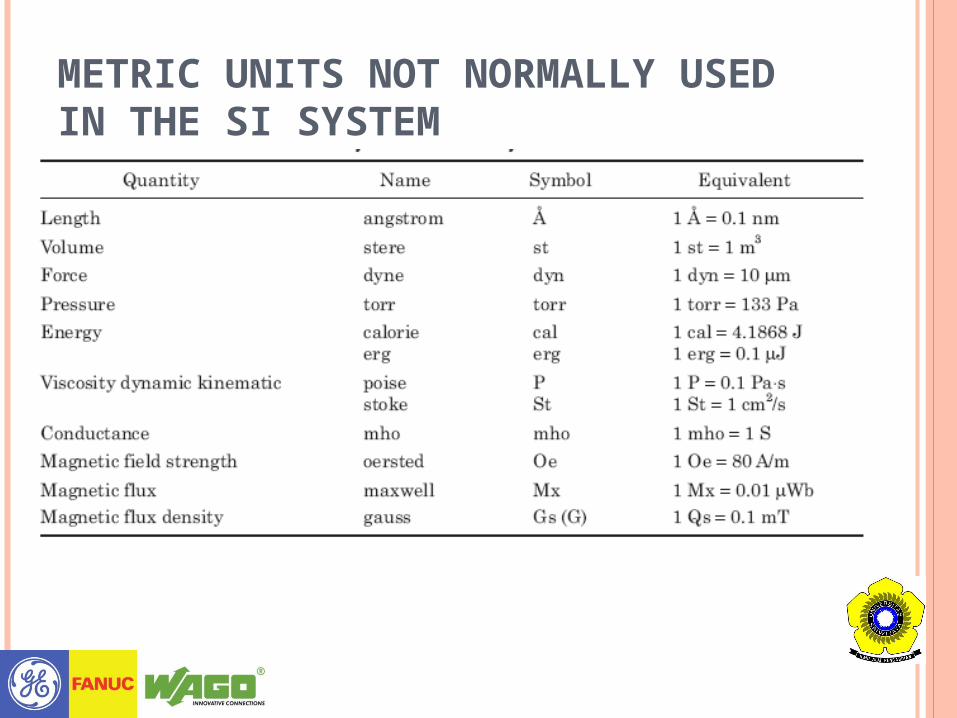
METRIC UNITS NOT NORMALLY USED IN THE SI SYSTEM
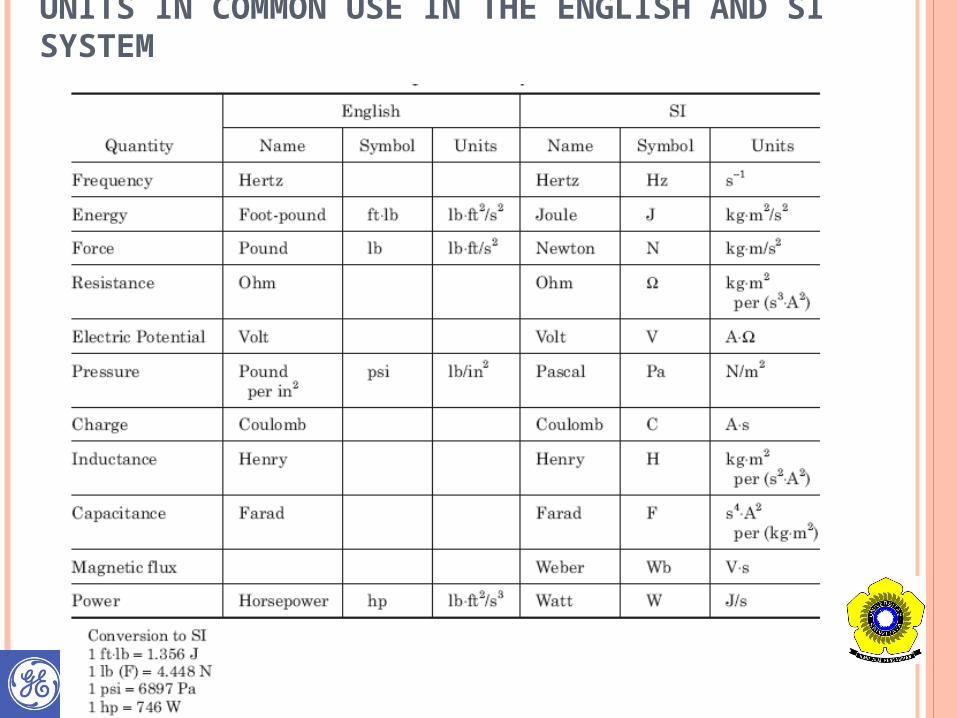
UNITS IN COMMON USE IN THE ENGLISH AND SI SYSTEM
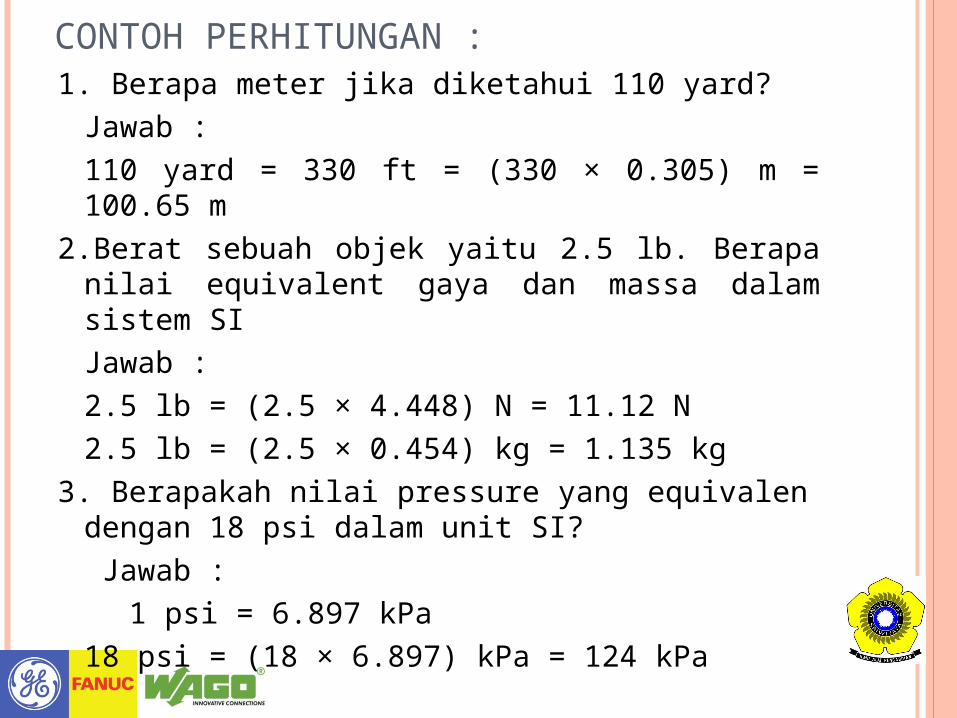
CONTOH PERHITUNGAN :1. Berapa meter jika diketahui 110 yard?
Jawab :110 yard = 330 ft = (330 × 0.305) m = 100.65 m
2.Berat sebuah objek yaitu 2.5 lb. Berapa nilai equivalent gaya dan massa dalam sistem SIJawab :2.5 lb = (2.5 × 4.448) N = 11.12 N2.5 lb = (2.5 × 0.454) kg = 1.135 kg
3. Berapakah nilai pressure yang equivalen dengan 18 psi dalam unit SI? Jawab :
1 psi = 6.897 kPa18 psi = (18 × 6.897) kPa = 124 kPa
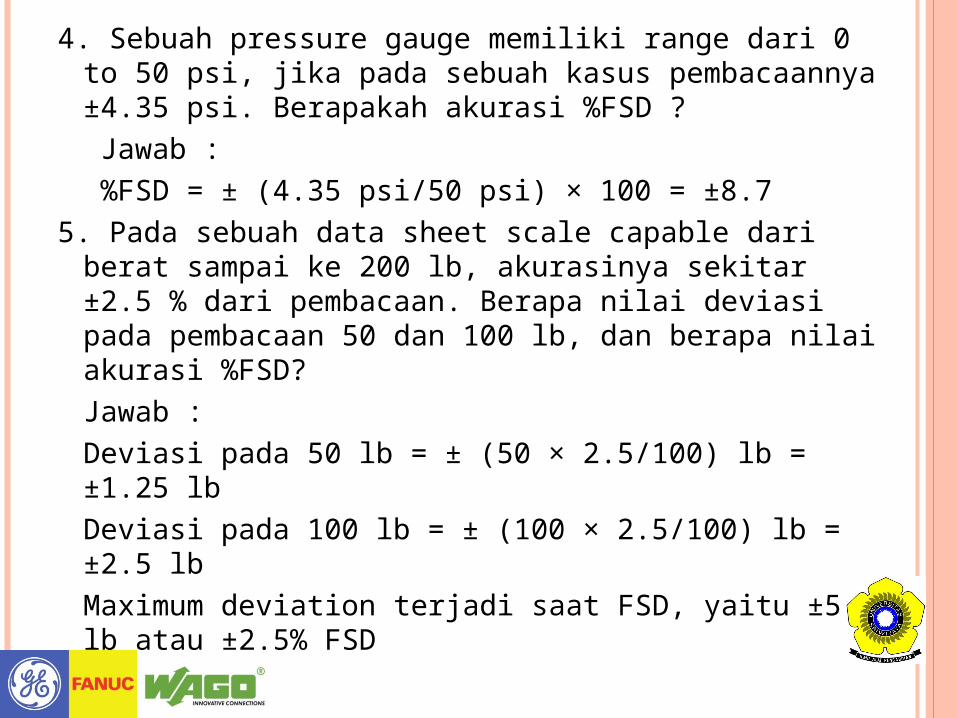
4. Sebuah pressure gauge memiliki range dari 0 to 50 psi, jika pada sebuah kasus pembacaannya ±4.35 psi. Berapakah akurasi %FSD ? Jawab : %FSD = ± (4.35 psi/50 psi) × 100 = ±8.7
5. Pada sebuah data sheet scale capable dari berat sampai ke 200 lb, akurasinya sekitar ±2.5 % dari pembacaan. Berapa nilai deviasi pada pembacaan 50 dan 100 lb, dan berapa nilai akurasi %FSD?Jawab :Deviasi pada 50 lb = ± (50 × 2.5/100) lb = ±1.25 lbDeviasi pada 100 lb = ± (100 × 2.5/100) lb = ±2.5 lbMaximum deviation terjadi saat FSD, yaitu ±5 lb atau ±2.5% FSD

To be condinued......................
.