ljhimeprints.usm.my/10166/1/development_of_nanocrystalline.pdf · laporan akhir projek penyelidikan...
TRANSCRIPT
lJHiMUNIVERSITI SAINS MALAYSIA
Laporan Akhir Projek PenyelidikanJangka Pendek
Development of NanocrystallineFerroelectric PLZT Powder by a Modified
Coprecipitation Method
byProf. Dr. Radzali Othman
Dr. Yeoh Fei-YeeAssoc. Pror. Dr. Azizan Aziz
2008
f ..
\ j
l k
f .,.,
l ....
"iL.
l.~···.if-
[
[
[r :.
UNIVERSITf SAINS MALAYSIA
END OF PROJECT REPORT
Development of Nanocrystalline Ferroelectric PLZT Powder
by a Modified Coprecipitation Method
(A Project Supported By A Grant From The Nippon Sheet Glass Foundation)
NIPPON SHEET GLASS CO.,Ud
Radzali OTHMAN
Fei-Yee YEOH
Azlzan AZIZ
School of Materials & Mineral Resources Engineering
Universiti Sains Malaysia
2008
END OF PROJECT REPORT
Development of Nanocrystalline Ferroelectric PLZT Powder
by a Modified Coprecipitation Method
Radzali Othman & Associates
Abstract
This research was focused on producing nanocrystalline ferroelectric lead lanthanum
zirconate titanate or more commonly known as PLZT. A modified coprecipitation
technique was used in this study to produce the nanocrystalline PLZT powder. The
calcination temperatures were varied so as to obtain the optimum temperature to form
the desired perovskite structure. The powder so produced was then pressed into pellets
and sintered at different temperatures to obtain densified pellets. The pellets were then
examined for microstructure and electrical properties {emphasis on dielectric behaviour}
to determine enhancement in properties of the nanocrystalline PLZT.
Introduction
Ferroelectric PLZT is an important electronic and optoelectronic material. It can be used
as materials for memory devices, piezoelectric actuators, optical modulators, and
capacitors. Sometimes, as a ferroelectric material, it is also referred as a smart material
due to its capability of being used both as sensors and actuators. The PLZT can be
produced in different forms for different applications, viz as powders for capacitors, as
thin films for memory materials, as thick films for piezoelectric devices, and as fibers for
optical devices. Recent advances in technology have enabled miniaturization which is
important to reduce the production cost, enhance product features and improve
materials performance. Thus, nano PLZT powders come into prominence with the
principle objective to reduce the size of capacitors and hence minimize production cost.
Phase morphology and characteristics of PLZT ceramic powder highly depend on their
method of preparation. As with any other ceramic materials, PLZT is conventionally
synthesized from mixed oxide or solid state reactions. Although having the advantages
of cost effectiveness and being a simpler process, its high calcination temperature,
impurities induced during processing, and products with chemical inhomogeneities had
led to attempts to find alternative routes. Thus, several alternative routes such as sol-gel,
, .
r'I
L.
[
[FtL.
coprecipitation, hydrothermal, Pechini's, and partial oxalate methods had been
developed to cater for different needs. Among all the methods, coprecipitation has been
reported as a prominent synthesis method in producing high-purity PLZT product. In the
present work, 3 coprecipitation methods had been carried out to produce PLZT powders.
The method which produced the most desirable PLZT powder (based on XRD results)
was then selected for further work.
Materials & Experimental Methods
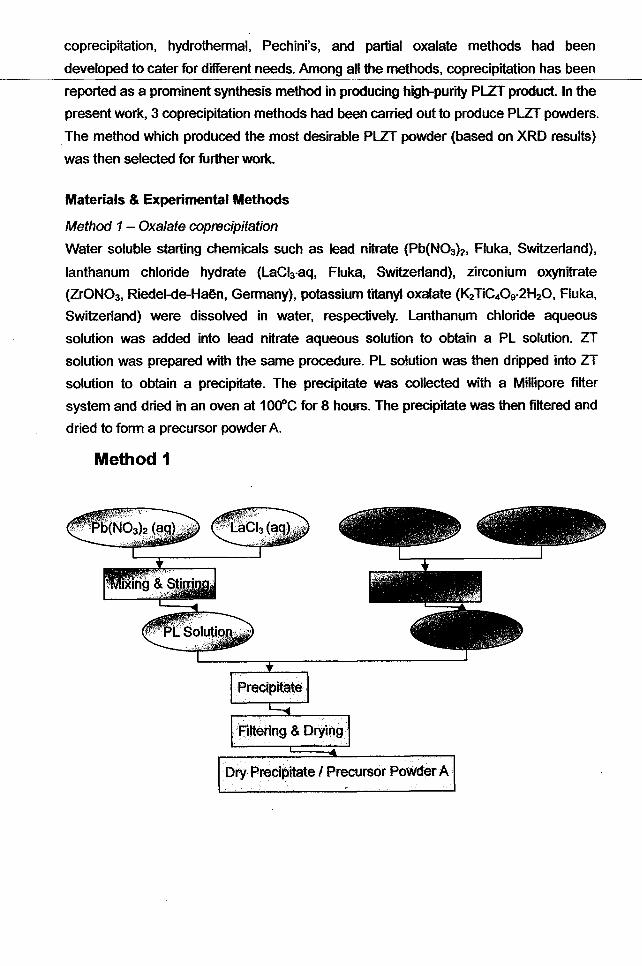
Method 1 - Oxalate coprecipitation
Water soluble starting chemicals such as lead nitrate (Pb(N03h, Fluka, Switzerland),
lanthanum chloride hydrate (LaCh·aq, Fluka, Switzerland), zirconium oxynitrate
(ZrON03, Riedel-de-Haen, Germany), potassium titanyl oxalate (K2TiC40 9·2H20, Fluka,
Switzerland) were dissolved in water, respectively. Lanthanum chloride aqueous
solution was added into lead nitrate aqueous solution to obtain a PL solution. ZT
solution was prepared with the same procedure. PL solution was then dripped into ZT
solution to obtain a precipitate. The precipitate was collected with a Millipore filter
system and dried in an oven at 1000C for 8 hours. The precipitate was then filtered and
dried to form a precursor powder A.
Method 1
Dry Precipitate I Precursor POWder A
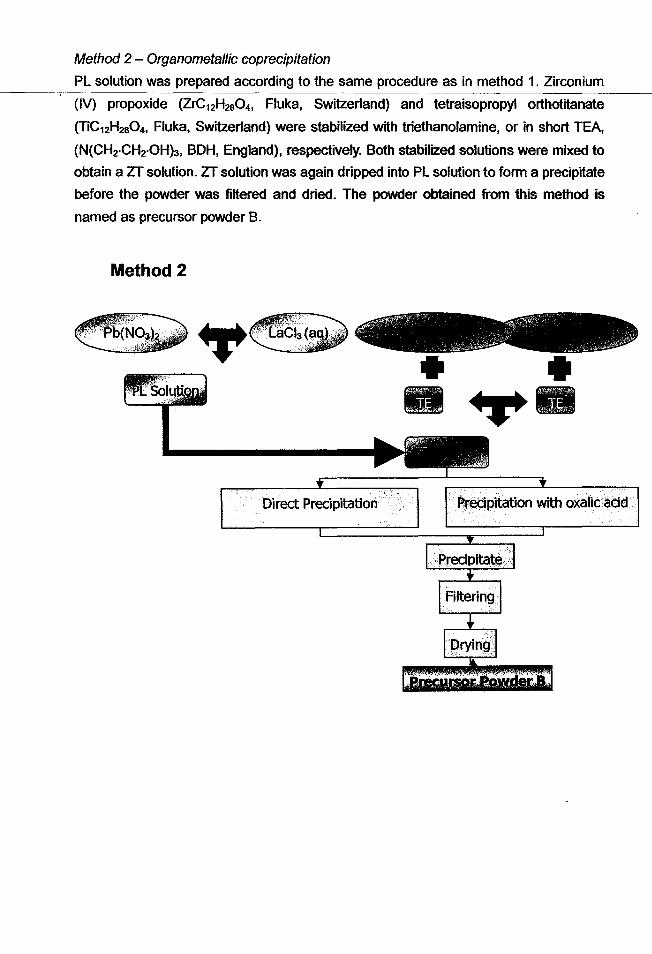
Method 2 - Organometallic coprecipitation
PL solution was prepared according to the same procedure as in method 1. Zirconium
(IV) propoxide (ZrC12H2S04, Fluka, Switzerland) and tetraisopropyl orthotitanate
(l1C12H280 4 , Fluka, Switzerland) were stabilized with triethanolamine, or in short TEA,
(N(CH2·CH2·OHh, BOH, England), respectively. Both stabilized solutions were mixed to
obtain a ZT solution. ZT solution was again dripped into PL solution to form a precipitate
before the powder was filtered and dried. The powder obtained from this method is
named as precursor powder B.
Method 2
r""
r·!"
Direct Precipitation Rre¢ipitation with oxalicijdd
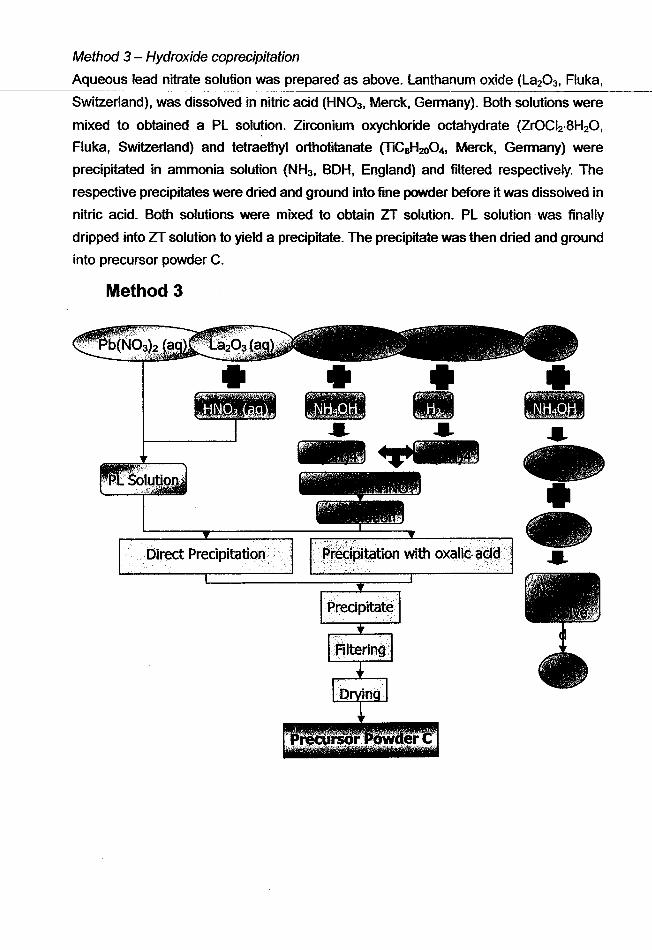
Method 3 - Hydroxide coprecipitation
Aqueous lead nitrate solution was prepared as above. lanthanum oxide (la203, Fluka,
Switzerland), was dissolved in nitric acid (HN03, Merck, Germany). Both solutions were
mixed to obtained a Pl solution. Zirconium oxychloride octahydrate (ZrOCI2·8H20,
Fluka, Switzerland) and tetraethyl orthotitanate (TiCaH200 4, Merck, Germany) were
precipitated in ammonia solution (NH3 , BOH, England) and filtered respectively_ The
respective precipitates were dried and ground into fine powder before it was dissolved in
nitric acid. Both solutions were mixed to obtain ZT solution. Pl solution was finally
dripped into ZT solution to yield a precipitate. The precipitate was then dried and ground
into precursor powder C.
Method 3
Direct Precipitation
r f'
r 0,
I
L.
r'
~ II-- .• •-~
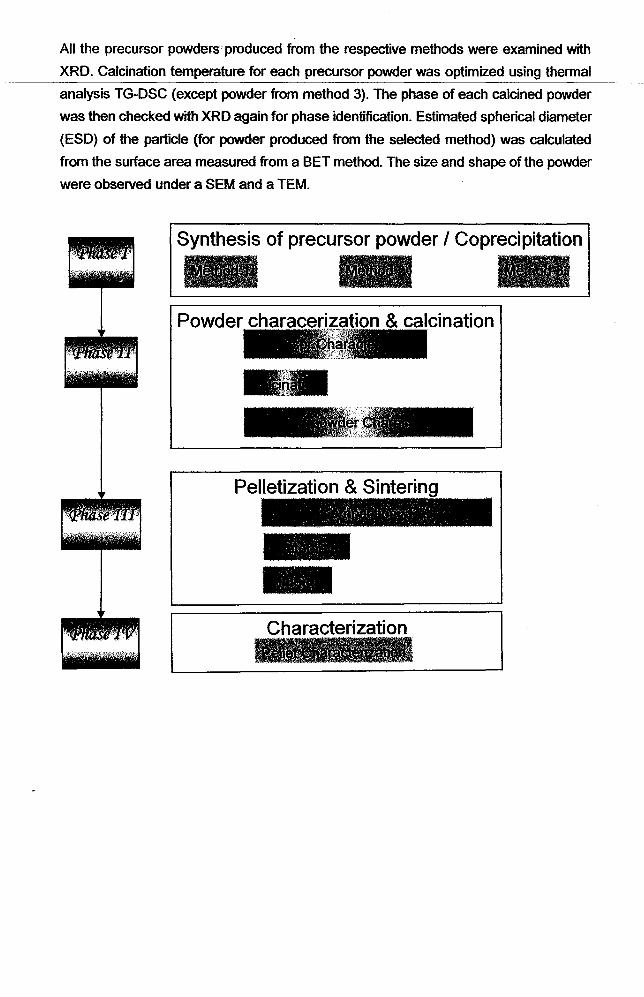
All the precursor powders produced from the respective methods were examined with
XRD. Calcination temperature for each precursor powder was optimized using thermal
analysis TG-DSC (except powder from method 3). The phase of each calcined powder
was then checked with XRD again for phase identification. Estimated spherical diameter
(ESD) of the particle (fqr powder produced from the selected method) was calculated
from the surface area measured from a BET method. The size and shape of the powder
were observed under a SEM and a TEM.
Characterization
Pell~tization & Sintering
-
Powder characerization & calcination
Synthesis of precursor powder I Coprecipitation
r'
L,
[
rL.
2 D G RAP H J C S
I'
L",
f"
Results and Disc"'S:~ic;Ul"
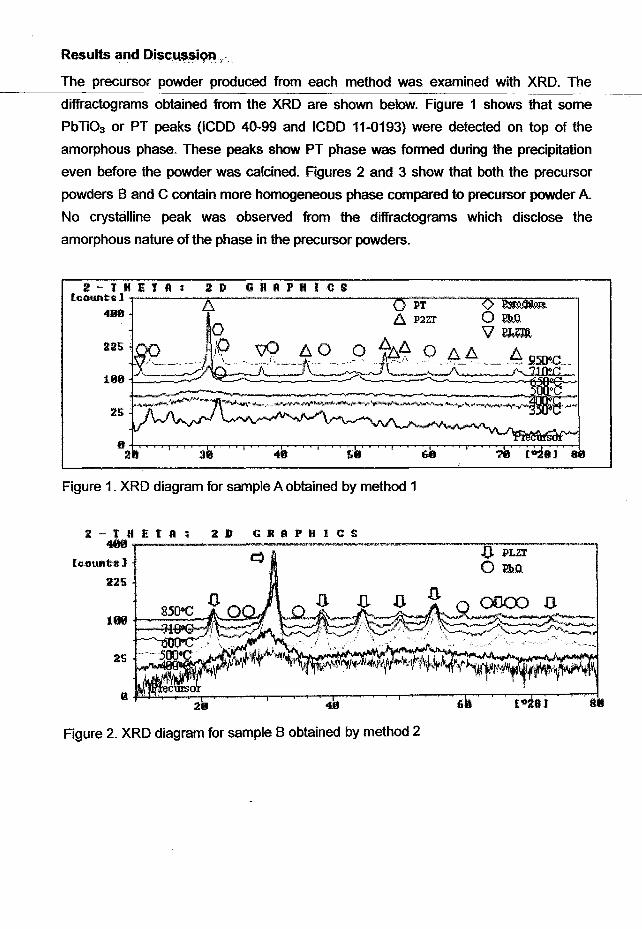
The precursor powder produced from each method was examined with XRD. The
diffractograms obtained from the XRD are shown below. Figure 1 shows that some
PbTi03 or PT peaks (ICDD 40-99 and ICDD 11-0193) were detected on top of the
amorphous phase. These peaks show PT phase was formed during the precipitation
even before the powder was calcined. Figures 2 and 3 show that both the precursor
powders Band C contain more homogeneous phase compared to precursor powder A.
No crystalline peak was observed from the diffractograms which disclose the
amorphous nature of the phase in the precursor powders.
Figure 1. XRD diagram for sample A obtained by method 1
2-tUEtA468 .,.....----~---~~~---~~--~.......,..Q.F--P-Lzr-~~-....,
lc.ounts J q 0 J!.Q.o.225
ooco .(J.
25
iii .J!lUi:l.i:,:::;:::;::;--~"""""--'-~"""""~ttDT, ~~~""""~--""""""-:-r-'"--'-~::=:r::;:-~ ..........-:j8U
Figure 2. XRD diagram for sample B obtained by method 2
'18 [«>tIll 88
GRAPHICS
25
225
2 - ...ie" JLL~, ~""- 2 D
[counts) b..
8-h-...........,-...,.........,..,...,..............-.-,........,~.,...........-.-, ............,...................,....,....-.-.........-.-.-~~ ...........,....,...,,...,...,..,........~.........I28 3 48 58 6.
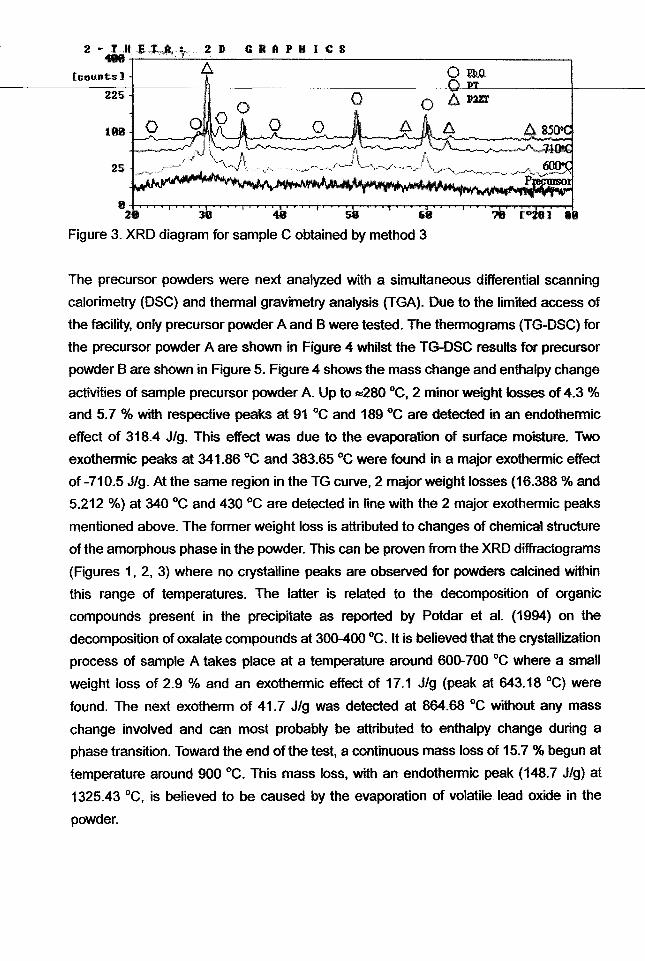
Figure 3. XRD diagram for sample C obtained by method 3
".
" .-,
. t
r"L,
L
lP-
"6
[
The precursor powders were next analyzed with a simultaneous differential scanning
calorimetry (DSC) and thermal gravimetry analysis (TGA). Due to the limited access of
the facility, only precursor powder A and B were tested. The thermograms (TG-DSC) for
the precursor powder A are shown in Figure 4 whilst the TG-DSC results for precursor
powder B are shown in Figure 5. Figure 4 shows the mass change and enthalpy change
activities of sample precursor powder A. Up to ~280 °C, 2 minor weight losses of 4.3 %
and 5.7 % with respective peaks at 91 °C and 189 °C are detected in an endothermic
effect of 318.4 JIg. This effect was due to the evaporation of surface moisture. Two
exothermic peaks at 341.86 °C and 383.65 °C were found in a major exothermic effect
of -710.5 JIg. At the same region in the TG curve, 2 major weight losses (16.388 % and
5.212 %) at 340 °C and 430 °C are detected in line with the 2 major exothermic peaks
mentioned above. The former weight loss is attributed to changes of chemical structure
of the amorphous phase in the powder. This can be proven from the XRD diffractograms
(Figures 1, 2, 3) where no crystalline peaks are observed for powders calcined within
this range of temperatures. The latter is related to the decomposition of organic
compounds present in the precipitate as reported by Potdar et at. (1994) on the
decomposition of oxalate compounds at 300-400 °C. It is believed that the crystallization
process of sample A takes place at a temperature around 600-700 °C where a small
weight loss of 2.9 % and an exothermic effect of 17.1 JIg (peak at 643.18 °C) were
found. The next exotherm of 41.7 JIg was detected at 864.68 °c without any mass
change involved and can most probably be attributed to enthalpy change during a
phase transition. Toward the end of the test, a continuous mass loss of 15.7 % begun at
temperature around 900 °c. This mass loss, with an endothermic peak (148.7 JIg) at
1325.43°C, is believed to be caused by the evaporation of volatile lead oxide in the
powder.
rL
I ~
I
-2
·1
2
Q$C~«nlW!mQl'.j. ex..
1325.43 "C
I-A=, 0148.7 Jig864.68"C
-4U Jig9"" 1
-11.1 Jig; "¥ I
643.1S"C
'i
1341.00"C
60
1-5.718%
60 '-
;E-~~f'80 318.4 Jig \, \r .
'. 383.65"C\i~ _i I -5.212%
70 -710.5JIg :, '.2.870%-+-------_._---~._=~==,==---
-15.650%\ -3.
)-4
50 L~--2"'OO----40""'O---""'600----800:!:-----:1'::':OO':"O---:1200~--~1400~ -5
Temperature rc
TG/%
100 _.-
Figure 4 TG-DSC thermogram for Sample A
TG/%
110.0.;
DSC I(mwlmg)..(.. exo
15
-5
-10
, 10
14001200
Sample 8
-5.04%
_.- 800 1000Temperature rc
600
-3727_00 Jig!314.8 '"C 2.4.9 %407.7 'C 53.5 %591.0 °C 100.0 %
293.1 'C
200
90.0 i
80.0 _
70.0
60.0 -66:O::0.65ilSJiJlgil'"\rl-_=-+-...2:704~.~9"~CC"'l.12Jlg
SO.O
:W.O
40.0.
100.0 i_--=_-3_.26_%-=.
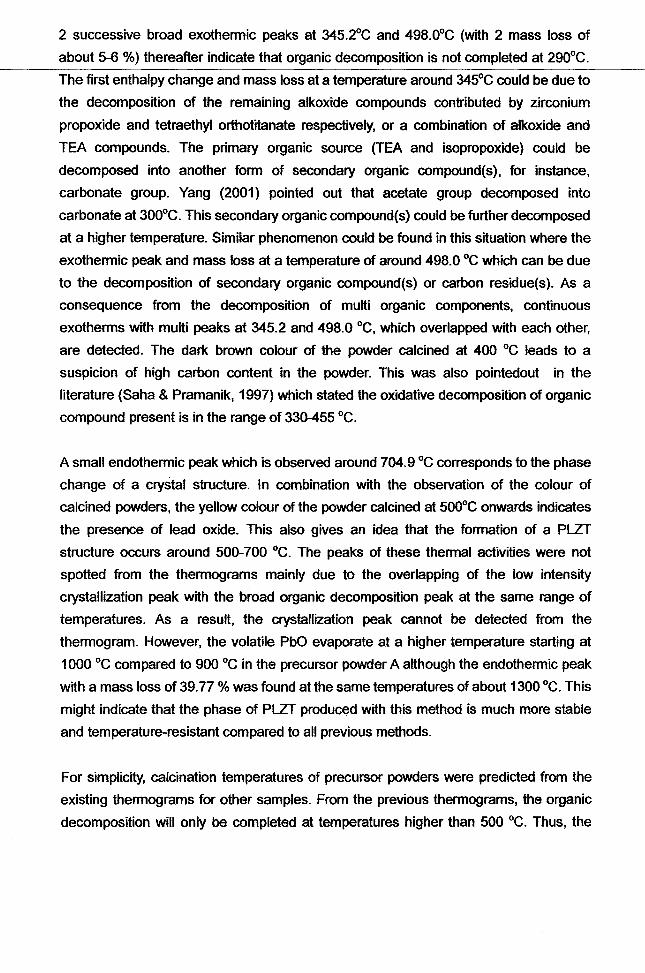
Figure 5. TG-DSC thermogram for Sample B
iI
L~
f
L
L
From the thermogram shown in Figure 5, a total of 3.3 % mass loss and an endotherm
of 60.85 Jig were found up to 200 DC. This event is attributed to the liberation of
surface-adsorbed water which took place at the same region for all the samples. A
sharp exothermic peak is observed at 293.1 DC starting at around 200 DC with a major
mass loss at 291 DC. This sharp peak indicates a large amount of heat is released
concurrently with a mass loss in a short period of time. It is most probably due to the
oxidative decomposition of the organic compound TEA which is supposed to start
decomposing at a temperature of 200 DC (Das et aI., 1998).
[F,L
r1
.~
cy
11'
l.
[
2 successive broad exothennic peaks at 345.2°C and 498.0°C (with 2 mass loss of
about 5-6 %) thereafter indicate that organic decomposition is not completed at 290°C.
The first enthalpy change and mass loss at a temperature around 345°C could be due to
the decomposition of the remaining alkoxide compounds contributed by zirconium
propoxide and tetraethyl orthotitanate respectively, or a combination of alkoxide and
TEA compounds. The primary organic source (TEA and isopropoxide) could be
decomposed into another fonn of secondary organic compound(s), for instance,
carbonate group. Yang (2001) pointed out that acetate group decomposed into
carbonate at 300°C. This secondary organic compound(s) could be further decomposed
at a higher temperature. Similar phenomenon could be found in this situation where the
exothennic peak and mass loss at a temperature of around 498.0 °C which can be due
to the decomposition of secondary organic compound(s) or carbon residue(s). As a
consequence from the decomposition of multi organic components, continuous
exothenns with multi peaks at 345.2 and 498.0 °c, which overlapped with each other,
are detected. The dark brown colour of the powder calcined at 400 °c leads to a
suspicion of high carbon content in the powder. This was also pointedout in the
literature (Saha & Pramanik, 1997) which stated the oxidative decomposition of organic
compound present is in the range of 330-455 °C.
A small endothermic peak which is observed around 704.9 °C corresponds to the phase
change of a crystal structure. In combination with the observation of the colour of
calcined powders, the yellow colour of the powder calcined at 500°C onwards indicates
the presence of lead oxide. This also gives an idea that the fonnation of a PLZT
structure occurs around 500-700 °C. The peaks of these thermal activities were not
spotted from the thermograms mainly due to the overlapping of the low intensity
crystallization peak with the broad organic decomposition peak at the same range of
temperatures. As a result, the crystallization peak cannot be detected from the
thermogram. However, the volatile PbO evaporate at a higher temperature starting at
1000 °C compared to 900°C in the precursor powder A although the endothermic peak
with a mass loss of 39.77 % was found at the same temperatures of about 1300 °C. This
might indicate that the phase of PLZT produced with this method is much more stable
and temperature-resistant compared to all previous methods.
For simplicity, calcination temperatures of precursor powders were predicted from the
existing thermograms for other samples. From the previous thermograms, the organic
decomposition will only be completed at temperatures higher than 500°C. Thus, the
-.
r f
rv
L
L
L[rL
calcination, temperature for precursor powder C was predicted to be 600 and 710°C
which is the temperatures below and above a minor peak, suspected to be a
crystallization peak. It is also calcined at the highest temperature of 850°C since a small
peak is detected at this range of temperature for sample A. Table 1 summarizes the
enthalpy change and mass loss of precursor powders A and B.
Table 1: Summary of TG-DSC results for precursor powders A and B
100-200°C Moisture Removal Moisture Removal
200-600°C Organic Decomposition Organic Decomposition
Phase Formation
600-800°C Phase Transition Phase Transition
800-850°C Phase Transition
> 900°C PbO Evaporation PbO Evaporation
Precursor powder A which was obtained by Method 1 (oxalate coprecipitation) was
calcined according to the peaks obtained from TG-DSC thermogram. From the
thermogram, there are 2 major peaks at 343.2 °c and 436.3 °C. According to the
assumption made in TG-DSC analysis, these peaks refer to the decomposition of
organic compounds. There is a possibility that a crystal formation peak could be
.~>verlapped by these 2 large peaks. Therefore, precursor powder A was calcined in this
range of temperature as well, i.e. 350, 400, and 500 °C.
The X-ray diffractogram shows that the precursor powder A (Figure 1) synthesized with
Method 1 consists of a small amount of crystalline PbTi03 (PT) within an amorphous
matrix. This PT peak disappears as the powder was calcined at 350 -500 °C, where only
an amorphous structure is observed. This agrees with the assumption which has been
made earlier in the TG-DSC discussion that there is almost no crystalline peak untilSOO
°C. It confirms that there is no crystalline phase formation associated with the 343.2 and
436.3 °C TG-DSC peaks as suspected prior to this. As the temperature increases to 650
°C, P~(ZrTi)~ peak (abbreviated as P2ZT - ICDD 14-31) starts to appear which is
confirmed by the peak 643.18°C in the TG-DSC thermogram. The crystalrlZation of
P2ZT is optimised at a temperature around 710°C. as shown by the diffractogram in
Figure 1. Minor peaks which correspond to ~Pb1-xlax{Zr8.27xTIzh.{).25xOa(abbreviated as
(3PlZT) phase (ICDD 29-776) are observed at this temperature. This indicates that the
..
l ~
r"Il.
I r
L
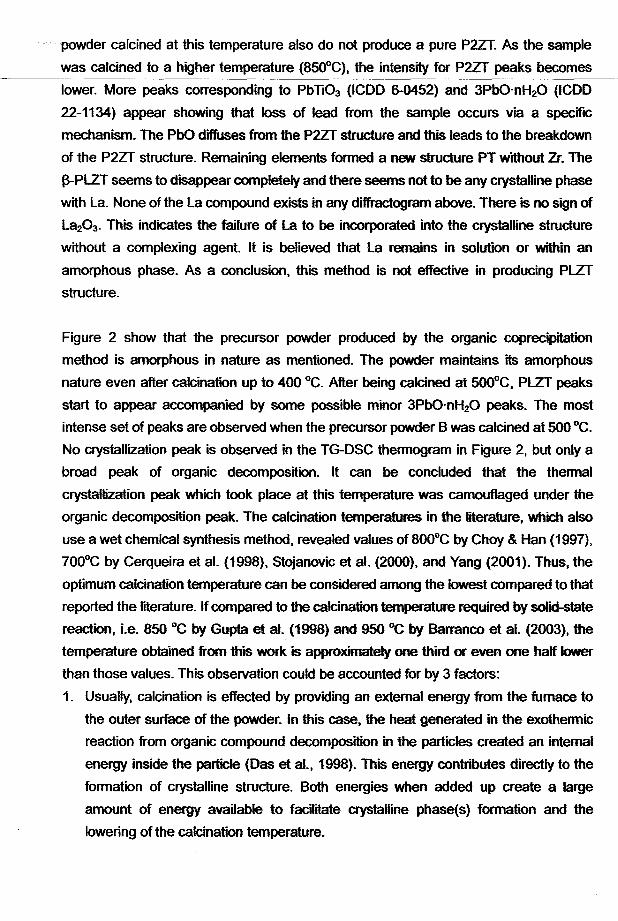
powder calcined at this temperature also do not produce a pure P2ZT. As the sample
was calcined to a higher temperature (85(fC), the intensity for P2ZT peaks becomes
lower. More peaks corresponding to PbTi03 (ICOO 6-(452) and 3PbO'nH20 (ICOD
22-1134) appear showing that loss of lead from the sample occurs via a specifIC
mechanism. The PbO diffuses from the P2ZT structure and this leads to the breakdown
of the P2ZT structure. Remaining elements formed a new structure PT without Zr. The
f3-PLZT seems to disappear completely and there seems not to be any crystalline phase
with La. None of the La compound exists in any diffractogram above. There is no sign of
La203. This indicates the failure of La to be incorporated into the crystalline structure
without a complexing agent. It is believed that La remains in solution or within an
amorphous phase. As a conclusion. this method is not effective in producing PlZT
structure.
Figure 2 show that the precursor powder produced by the organic coprecipitation
method is amorphous in nature as mentioned. The powder maintains its amorphoUS
nature even after calcination up to 400 °c. After being calcined at 500°C, PlZT peaks
start to appear accompanied by some possible minor 3PbO'nH20 peaks. The most
intense set of peaks are observed when the precursor powder B was calcined at 500 °c.
No crystallization peak is observed in the TG-OSC thermogram in Figure 2, but only a
broad peak of organic decomposition. It can be concluded that the thennal
crystallization peak which took place at this temperature was camouflaged under the
organic decomposition peak. The calcination temperatures in the literature, which also
use a wet chemical synthesis method, revealed values of 800°C by Choy & Han (1997),
700°C by Cerqueira et al. (1998), Stojanovic et al. (2000), and Yang (2001). Thus, the
optimum calcination temperature can be considered among the lowest compared to that
reported the literature. If compared to the calcination temperature required by solid-state
reaction, i.e. 850 °c by Gupta et al. (1998) and 950 OC by Barranco et al. (2003), the
temperature obtained from this work. is approximately one third or even one half lower
than those values. This observation could be accounted for by 3 factors:
1. Usually, calcination is effected by providing an external energy from the furnace to
the outer surface of the powder. In this case, the heat generated in the exothermic
reaction from organic compound decomposition in the particles created an internal
energy inside the particle (Das et at, 1998). This energy contributes directly to the
formation of crystalline structure. Both energies when added up create a large
amount of energy available to facilitate crystalline phase(s) formation and the
lowering of the calcination temperature.
r 'I
----------
i ;..
, 1
•. .i.
, T
·2. It is the advantage of coprecipitation method to obtain a homogenous distribution of
the constituent ions. This homogeneous distribution which were achieved at the
atomic level rather than particulate scale during solution mixing (Stojanovic et at,
2000), reduces the diffusion distance among them which accelerates the
monophasic PlZT formation at comparatively low calcination temperatures (Saha &
Pramanik, 1997).
3. The size factor, where a fine powder is known to be highly reactive. Higher reactivity
of the nano-sized powder tends to form crystalline structure at a lower temperature
compared to larger particles due to a surface effect. The size of the powder is shown
in the later part of the report.
When the powder was further calcined at 600°C, the intensity of the peaks for both
PLZT and possibly PbO become slightly weaker. The decrease in intensity became
more obvious at 710°C and 850°C. This indicates that the evaporation of lead oxide in
PLZT solid solution causes the amount of PlZT structure to be lowered or perhaps
altered. The diffractogram does not show the presence of any other crystalline peak and
this indicates that the breakdown products due to PbO volatilization is amorphous in
nature and could not be detected by XRO. Another possibility is that the amount of
crystalline structure from the remnant lZT components such as L~Zr2Ti07 (Stojanovic
et at, 2001), ZrTi04, or La20 3 structure is too small to be detected by XRO (Stojanovic et
al.,2001).
Figure 3 shows the X-ray diffractogram for the powder synthesized with Method 3, i.e.
hydroxide coprecipitation. Apparently similar to precursor powder B, the precursor is
totally amorphous. After it was calcined at 600 °c, crystalline peaks are revealed. P2ZT
(ICDD 14-31) peaks appear as the primary phase accompanied by some PbO (ICDD
5-0561) and tetragonal PT (40-99) peaks. Crystalline peaks reach their maximum
intensity when the powder is calcined at 710°C. The peaks for minor phase PbO and
PT become more obvious as the calcination temperature increases. The intensity
becomes lower as the temperature increases further to 850°C especially for P2ZT
phase. More PT peaks are observed probably due to the breakdown of P2ZT phase,
although the intensity of PT becomes slightly weaker as well. This might be due to the
fact that P2ZT breakdown at higher temperature tends to formed PT structure which is
quite disordered and tends to collapse as well. PT is known to be much
high-temperature resistant compared to PbOand P2ZT which collapse easily at 850 °C.
r~,
l'1<·-
[
[
IT
f:
; '"'i From the result, it is observed that up to the maximum calcination temperature of 850 °C,
PLZT peaks did not exist at all. In conclusion, this method needs further study in the
future work in order to produce the desired PLZT phase.
Equivalent average particle size of powders, which is also called as an estimated
spherical diameter (ESD) by Choy & Han (1997) or particle size from specific surface
area (SSA) by Kong (2002b), were calculated from the specific surface area measured
by the BET method. All the powders produced were assumed to be uniform spheres.
The diameter of the particle is taken as the particle size and is calculated from S.G
which refers to specifIC gravity and SA which refers to specific surface area provided by
the multipoint BET analyzer. Equivalent particle size for the precursor powder was
calculated from the specific surface area provided by the BET technique. Figure 6
shows a plot of particle size vs. the calcination temperature.
From the BET result, the surface area of sample B was found to be 32.93 m2/g. The
equivalent particle size was then calculated from the specifIC surface area and density.
In order to achieve better accuracy, the S.G of the precursor powder was used rather
than the theoretical density of PLZT compared to work done by Choy & Han (1997). The
equivalent particle size of precursor powder is found to be in the nano range viz. 61.32
nm. This result shows that an organometallic coprecipitation method can produce
precipitate within a nano-sized range. Overall, it can be seen very clearly that there is a
non-linear trend in particle size development. First the particle size of the powders
decreases as the temperature increases from room temperature to 400 °C where the
lowest particle size is observed (49.73 nm). Then it goes up again until 600 °C before it
goes down at 710 °C and then up again at 850 °C. The particle size (calculated from
BET measurement) seems to be fluctuating up and down. One of the most important
factors is the size of this particle, which is in nano range, which contributes significantly
to the measurement of particle size by BET if some form of agglomeration take place.
Generally, the higher the temperature, the larger the size is. It is a common fact that,
material with a larger surface area (smaller particle size) is much more reactive
compared to a material with smaller surface area (larger particle size). As the material
with larger surface area (or smaller particle size) is heated to higher temperatures, less
energy is required for the material to rearrange the chemicaVcrystal structure. During
the rearrangement of the structure, the surface area tends to be minimized so that the
reactivity could be minimized.
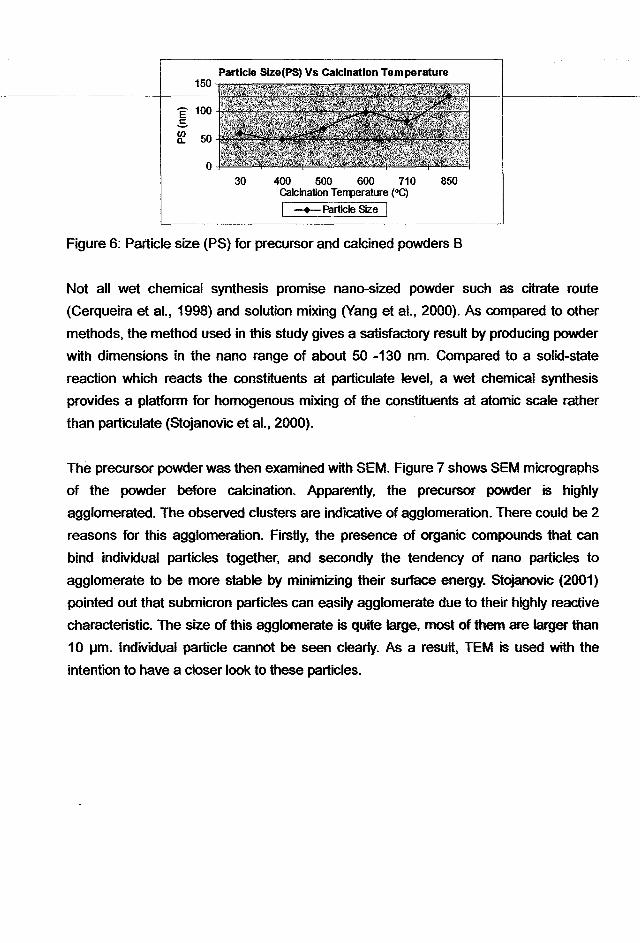
Particle Size(PS) Vs Calcination Temperature150
E 100.s~ 50
o30 400 500 600 710 850
calcination TelJ1)erature (0C)
I -+-Particle Size I
--,-
'.
,,,
r r'!
~
It
..
r=
Figure 6: Particle size (PS) for precursor and calcined powders B
Not all wet chemical synthesis promise nana-sized powder such as citrate route
(Cerqueira et at., 1998) and solution mixing (Yang et at., 2000). As compared to other
methods, the method used in this study gives a satisfactory result by producing powder
with dimensions in the nano range of about 50 -130 nm. Compared to a solid-state
reaction which reacts the constituents at particulate level, a wet chemical synthesis
provides a platform for homogenous mixing of the constituents at atomic scale rather
than particulate (Stojanovic et aI., 2000).
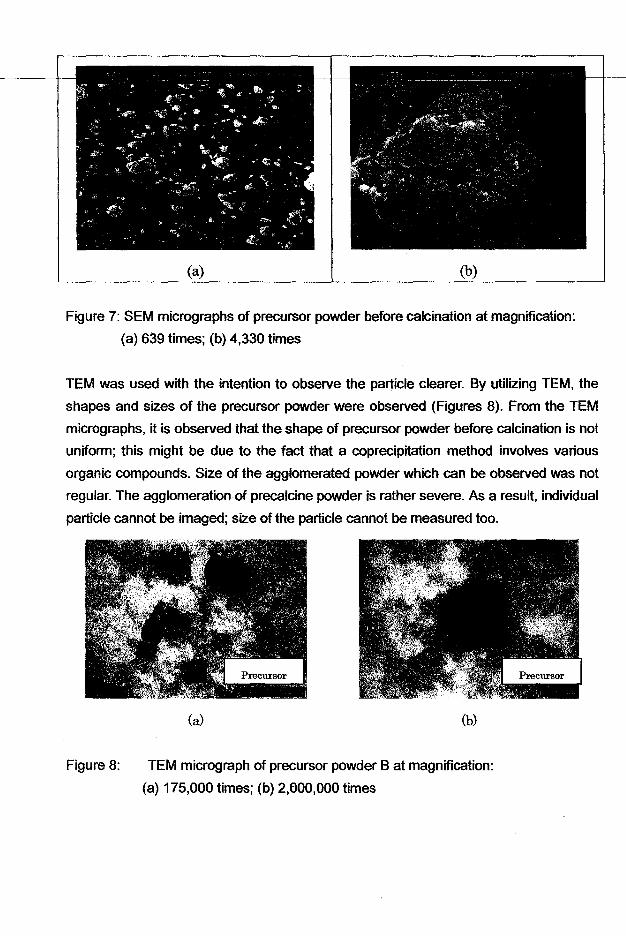
The precursor powder was then examined with SEM. Figure 7 shows SEM micrographs
of the powder before calcination. Apparently, the precursor powder is highly
agglomerated. The observed clusters are indicative of agglomeration. There could be 2
reasons for this agglomeration. Firstly, the presence of organic compounds that can
bind individual particles together, and secondly the tendency of nana particles to
agglomerate to be more stable by minimizing their surface energy. Stojanovic (2001)
pointed out that submicron particles can easily agglomerate due to their highly reactive
characteristic. The size of this agglomerate is quite large, most of them are larger than
10 IJm. Individual particle cannot be seen clearly. As a result, TEM is used with the
intention to have a closer look to these particles.
(a) (b)
Figure 7: SEM micrographs of precursor powder before calcination at magnification:
(a) 639 times; (b) 4,330 times
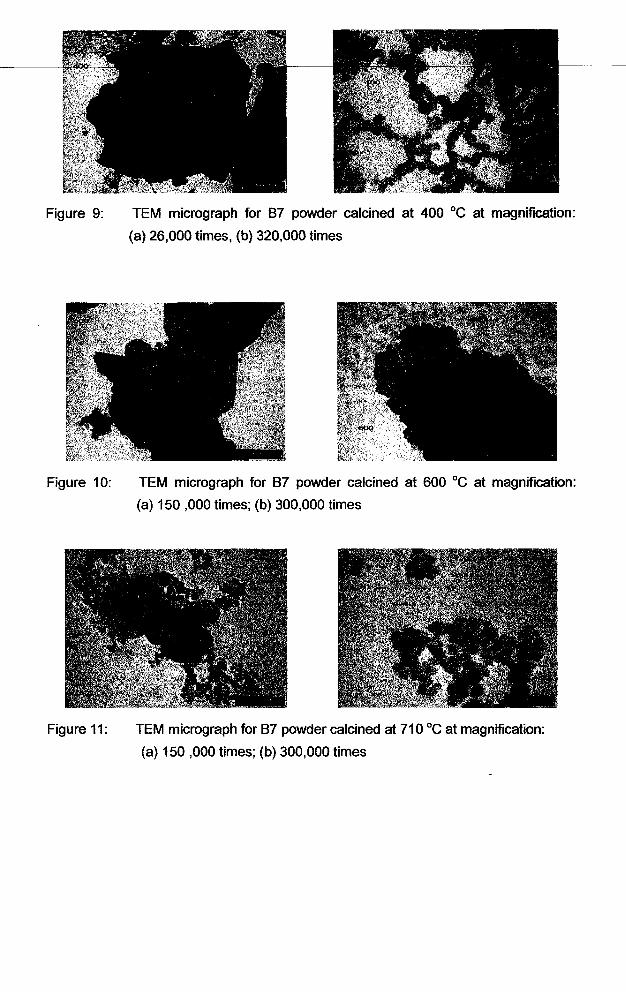
TEM was used with the intention to observe the particle clearer. By utilizing TEM, the
shapes and sizes of the precursor powder were observed (Figures 8). From the TEM
micrographs, it is observed that the shape of precursor powder before calcination is not
uniform; this might be due to the fact that a coprecipitation method involves various
organic compounds. Size of the agglomerated powder which can be observed was not
regular. The agglomeration of precalcine powder is rather severe. As a result, individual
particle cannot be imaged; size of the particle cannot be measured too.
, ~
['
l~
FL
rI
(b)
Figure 8: TEM micrograph of precursor powder B at magnification:
(a) 175,000 times; (b) 2,600,000 times
... '1 1
Figure 9: TEM micrograph for 87 powder calcined at 400°C at magnification:
(a) 26,000 times, (b) 320,000 times
Figure 10: TEM micrograph for 87 powder calcined at 600°C at magnification:
(a) 150 ,000 times; (b) 300,000 times
r t"
rL.
Figure 11: TEM micrograph for 87 powder calcined at 710°C at magnification:
(a) 150 ,000 times; (b) 300,000 times
· I. "l
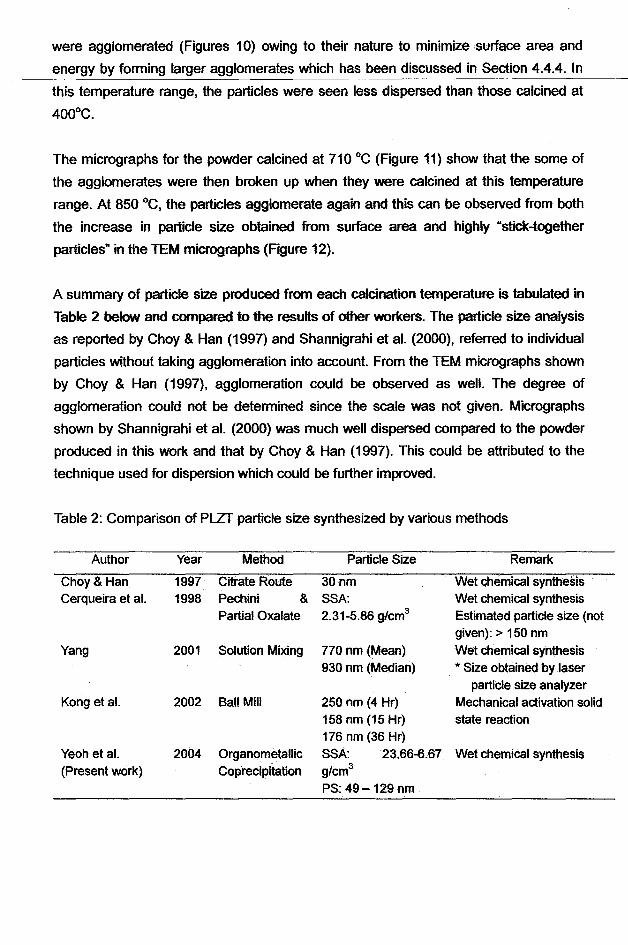
Figure 12: TEM micrograph for 87 powder calcined at 850°C at magnification:
(a) 200,000 times; (b) 400,000 times
"
,./1
[
[
r:
Despite particle agglomeration, individual particles for calcined powders could still be
observed clearly from the TEM micrograph. Figure 9, Figure 10, Figure 11 and Figure
12 show the TEM micrographs for powders calcined at temperatures 400, 600, 710, and
850°C respectively.
When the precursor powder was calcined at 400 DC, some of the organic compounds
were removed (although some other organics might remain as what is probably shown
as large aggregates in Figure 9). In limited places where nano particles are observed to
be truly dispersed, the size is much finer. The average particle size for the powder
calcined at 400°C was found to be 10 nm by taking the mean value of the size
measured from twenty particles.
The nano particles which are observed in this TEM micrograph is suspected to be the
PLZT phase when they are compared to TEM micrograph for powders calcined at some
other temperatures (Figures 10-12) where particles with similar sizes and shapes are
seen. However, upon referring to the XRD diffractogram for powder calcined at 400°C
(Figure 2), only an amorphous phase is detected. Thus, it is suggested that a PLZT
phase has already been formed at 400°C, but it cannot be detected by XRD due to its
amorphous phase or low quantity (probably less than 3 wt. 'Yo, Stojanovic et ai., 2001)
compared to the organic contents as seen in Figure 2. This shows that TEM is also
useful in phase identification for phase of material which exists in low quantity.
With an increase in temperature, more organic compounds were eventually liberated
and only crystallite PLZT powder should remain. As a result, the percentage of PLZT
phases increased. When the powders were calcined at 50D-600 DC, the nano particles
, .
r ';
IL.,
... , , -,
•
were agglomerated (Figures 10) owing to their nature to minimize surface area and
energy by forming larger agglomerates which has been discussed in Section 4.4.4. In
this temperature range, the particles were seen less dispersed than those calcined at
400°C.
The micrographs for the powder calcined at 710°C (Figure 11) show that the some of
the agglomerates were then broken up when they were calcined at this temperature
range. At 850 °c, the particles agglomerate again and this can be observed from both
the increase in particle size obtained from surface area and highly "stick-together
particles" in the TEM micrographs (Figure 12).
A summary of particle size produced from each calcination temperature is tabulated in
Table 2 below and compared to the results of other workers. The particle size analysis
as reported by Choy & Han (1997) and Shannigrahi et al. (2000), referred to individual
particles without taking agglomeration into account. From the TEM micrographs shown
by Choy & Han (1997), agglomeration could be observed as well. The degree of
agglomeration could not be determined since the scale was not given. Micrographs
shown by Shannigrahi et al. (2000) was much well dispersed compared to the powder
produced in this work and that by Choy & Han (1997). This could be attributed to the
technique used for dispersion which could be further improved.
Table 2: Comparison of PLZT particle size synthesized by various methods
Author Year Method Particle Size Remark
Choy& Han 1997 Citrate Route 30nm Wet chemical synthesisCerqueira et al. 1998 Pechini & SSA: Wet chemical synthesis
Partial Oxalate 2.31-5.86 g/cm3 Estimated particle size (notgiven): > 150 nm
Yang 2001 Solution Mixing 770 nm(Mean) Wet chemical synthesis930 nm (Median) '" Size obtained by laser
particle size analyzerKong etal. 2002 Ball Mill 250 nm (4 Hr) Mechanical activation solid
158 nm (15 Hr) state reaction176 nm (36 Hr)
Yeah etal. 2004 Organometallic SSA: 23.66-6.67 Wet chemical synthesis(Present work) Coprecipitation g/cm3
PS: 49 - 129 nm
l'
• ... J ,.
..
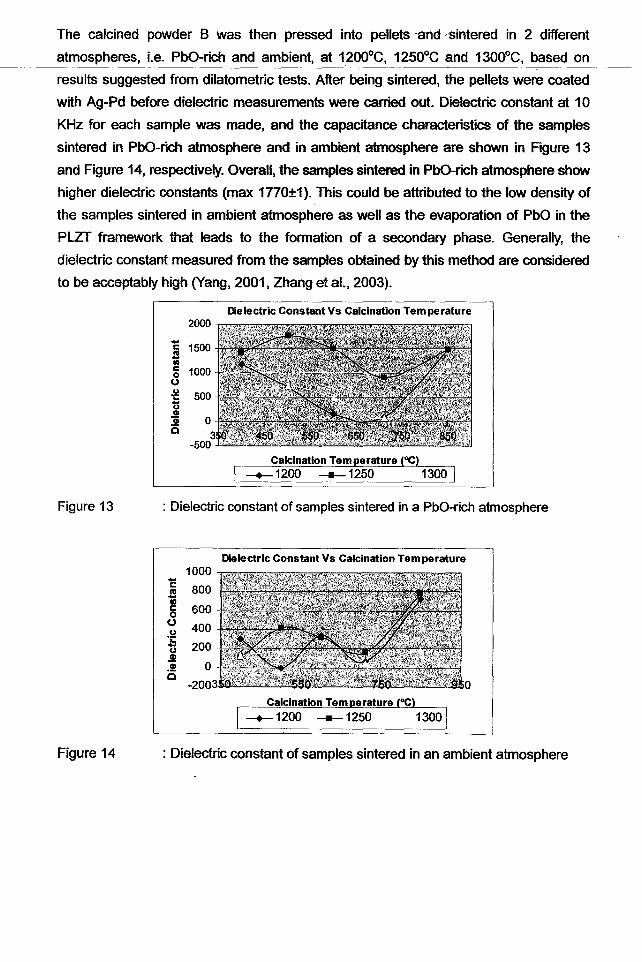
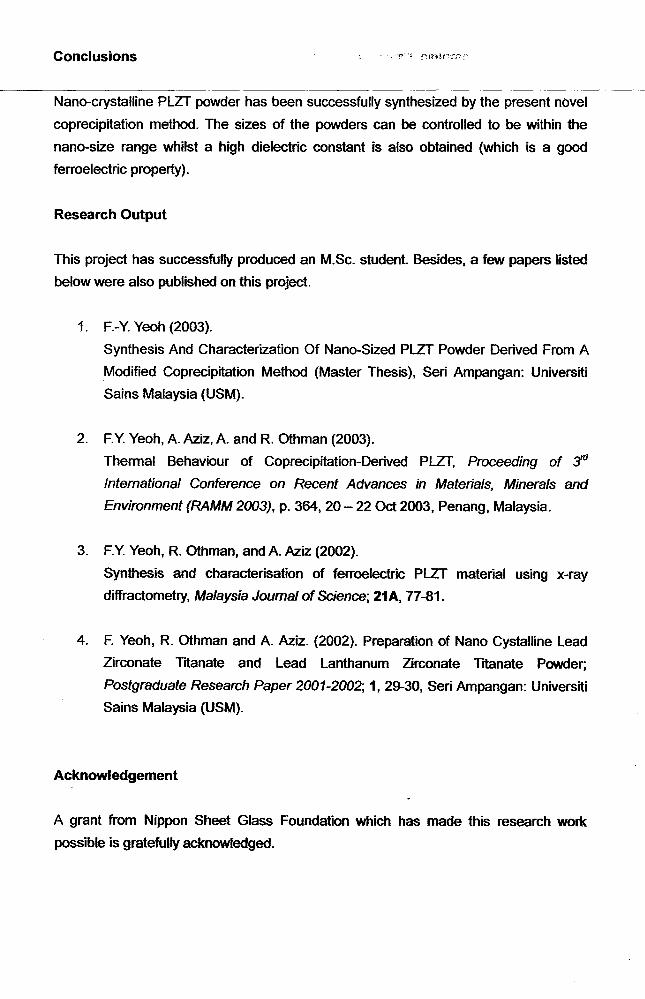
The calcined powder B was then pressed into pellets -andsintered in 2 different
atmospheres, Le. PbO-rich and ambient, at 1200oC, 1250°C and 1300oC, based on
results suggested from dilatometric tests. After being sintered, the pellets were coated
with Ag-Pd before dielectric measurements were carried out. Dielectric constant at 10
KHz for each sample was made, and the capacitance characteristics of the samples
sintered in PhO-rich atmosphere and in ambient atmosphere are shown in Rgure 13
and Figure 14, respectively. Overall, the samples sintered in PhO-rich atmosphere show
higher dielectric constants (max 1770±1). This could be attributed to the low density of
the samples sintered in ambient atmosphere as well as the evaporation of PbO in the
PLZT framework that leads to the formation of a secondary phase. Generally, the
dielectric constant measured from the samples obtained by this method are considered
to be acceptably high (Yang, 2001, Zhang et al., 2003).
Dielectric Constant Vs Calcination Temperature
cS•co(.)U1:
~.!!!Q
Figure 13
Calcination Temperature (OC)
: Dielectric constant of samples sintered in a PbO-rich atmosphere
: Dielectric constant of samples sintered in an ambient atmosphere
, ~.
l ..
r'L.
Figure 14
1000
E 800
~ 600oo 400u.;:ti 200.!!!.91 0c
-200
Dielectric Constant Vs Calcination Tem perature
o
Conclusions
1..1.
If!.
L
[FiL
Nano-crystalline PLZT powder has been successfully synthesized by the present novel
coprecipitation method. The sizes of the powders can be controlled to be within the
nano-size range whilst a high dielectric constant is also obtained (which is a good
ferroelectric property).
Research Output
This project has successfully produced an M.Sc. student. Besides, a few papers listed
below were also published on this project.
1. F.-Y. Yeoh (2003).
Synthesis And Characterization Of Nano-Sized PLZT Powder Derived From A
Modified Coprecipitation Method (Master Thesis), Seri Ampangan: Universiti
Sains Malaysia (USM).
2. F.Y. Yeoh, A. Aziz, A. and R. Othman (2003).
Thermal Behaviour of Coprecipitation-Derived PLZT, Proceeding of :JdInternational Conference on Recent Advances in Materials, Minerals and
Environment (RAMM 2003), p. 364, 20 - 22 Oct 2003, Penang, Malaysia.
3. F.Y. Yeoh, R. Othman, and A. Aziz (2002).
Synthesis and characterisation of ferroelectric PLZT material using x-ray
diffractometry, Malaysia Journal ofScience; 21A, 77-81.
4. F. Yeoh, R. Othman and A. Aziz. (2002). Preparation of Nano Cystalline Lead
Zirconate Titanate and Lead Lanthanum Zirconate Titanate Powder;
Postgraduate Research Paper 2001-2002; 1,29-30, Seri Ampangan: Universiti
Sains Malaysia (USM).
Acknowledgement
A grant from Nippon Sheet Glass Foundation which has made this research work
possible is gratefully acknowledged.
References
r'u,
Barranco, A.P., Tera, A.H., Monjaras, RV., Eiras, JA, Garcia, D., Pinar, EC. & Martinez, O.P.
(2003). Influence of synthesis process on the ac response of PLZT (8/65/35) ferroelectric
ceramics. J. Euro. Ceram. Soc. 23,1337-1343.
Cerqueira, M., Nasar, RS., Leite, E.R., Longo, E. & Varela, J.A. (1998). Synthesis and
characterization of PLZT (9/65/35) by he Pechini method and partial oxalate. Mater. Lett. 35,
166-171
Choy, J. H. & Han, Y.S. (1997). Citrate route to the preparation of nanometer size (Pb, La)(Zr,
Ti)03 oxide. Mater. Lett. 32,209-215.
Das, R.N., Pathak, A. & Pramanik, P. (1998). Low-temperature preparatipon of nanocrystalline
lead zirconate titanate and lead lanthanum zirconate titanate powders using triethanolamine. J.
Am. Ceram. Soc., 81 (12),3357-3360.
Gupta, S.M., Li, J.E & Viehland, D. (1998). Coexistence of relaxor and normal ferroelectric
phases morphotropic phase boundary compositions of lanthanum-modified lead zirconate
titanate. J. Am. Geram. Soc. 81(3), 557-564.
Kong, L.B., Ma, J., Zhu, W. & Tan, OK (2002b). Preparation and characterization of PLZT
(8/65/35) ceramics via reaction sintering from ball milled powder. Mater. Lett. 52, 378-387.
Potdar, H.S., Deshpande, S.B. & Date, SK (1994). Synthesis of PLZT pOWders via a
molecularly modified precursor route. Mater. Lett. 19, 269-274.
Saha, SK & Pramanik, P. (1997). Synthesis of nanophase PLZT (12/40/60) powder by
PVA-solution technique. Nanostructured Material. 8 (1), 29-36.
Shannigrahi, S.R, Choudry, R.N.P., Achrya, H.N. & Sinha, T.P. (2000). Microstructure and
electrical characterizations of K-modified PLZT. J. Mat. Sci. 35, 1737-1742.
Stojanovic, B.D., Zaghete, M.A., Paiva-Santos, C.O., Cilense, M., Magnano, R, Longo, E. &
Varela, J.A. (2000). Hot-pressed 9.5/65/35 PLZT prepared by the polymeric precursor method.
Ceram. Int. 26, 625-630

-~
-,.
-..
f1"
Iu,
IT(!
• •• 1 ~
Stojanovic, B.D., Foschini, C.R., Cilense, M., Zaghete,M.A., Cavalheiro, A.A., Paiva-Santos,
C.O., Longo, E. & Varela, J.A. (2001). Structural characterization of organometallic-derived
9.5/65/35 PLZT ceramics. Materials Chemistry and Physics. 68,136-141.
Yang, W.O. (2001) PZT/PLZT ceramics prepared by hydrolysis and condensation of acetate
precursors. Ceram. Int., 27, 373-384.
Zhang, Y., Ding, A.L., Oiu, P.S., He, X.Y., Zheng, X.S., Zeng, HR & Yin, OR (2003). Effect of La
content on characterization of PLZT ceramics. Mat. Sci. & Eng. B., 99, 360-362.