kursus pengenalan dan hala tuju upm · prof. madya dr. cheah yoke kqueen (fakulti perubatan dan...
TRANSCRIPT
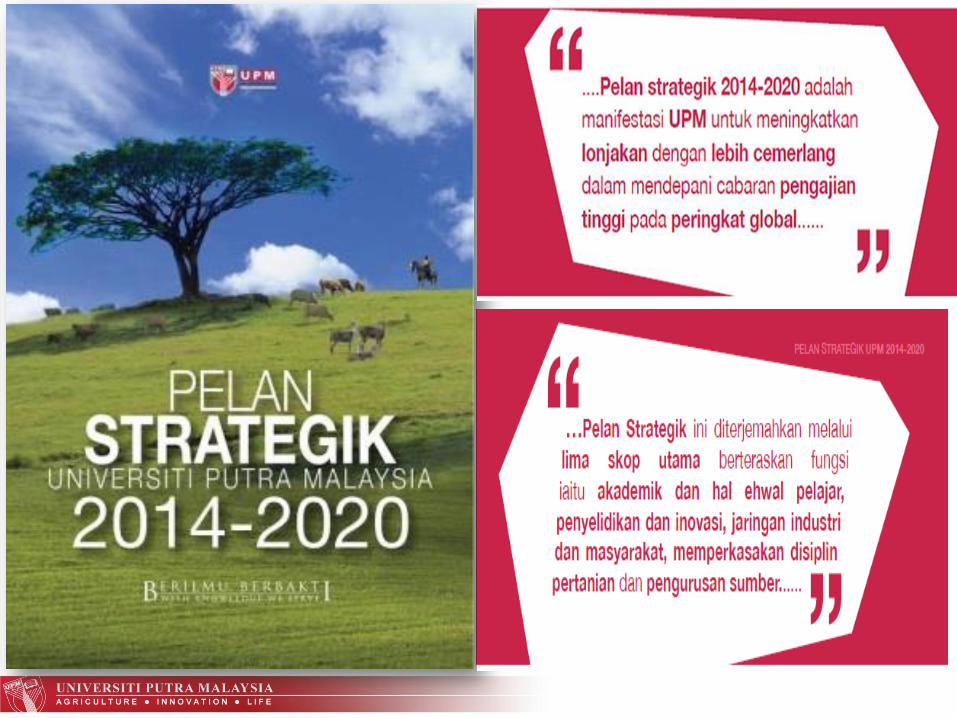
KURSUS PENGENALAN DAN HALA TUJU UPM
Ketua, Bahagian Perancangan Strategik
Abdullah ArshadTimbalan Pengarah
Pejabat Strategi Korporat dan Komunikasi (CoSComm)Universiti Putra Malaysia
PROGRAM TRANSFORMASI MINDA(KUMPULAN AKADEMIK)
15 Januari 2017 | Isnin
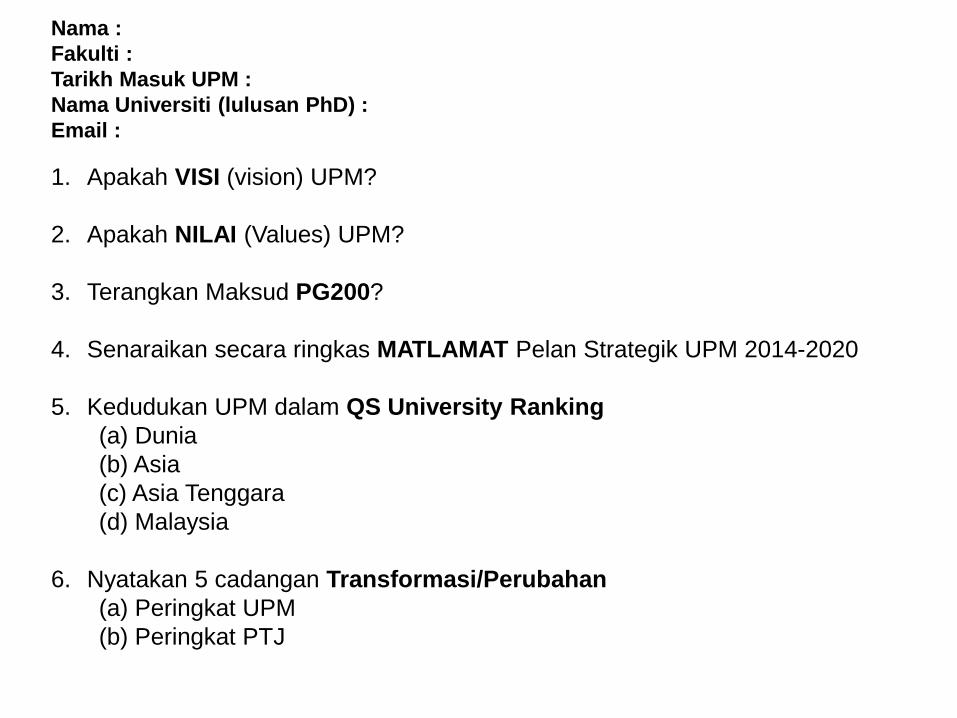
1. Apakah VISI (vision) UPM?
2. Apakah NILAI (Values) UPM?
3. Terangkan Maksud PG200?
4. Senaraikan secara ringkas MATLAMAT Pelan Strategik UPM 2014-2020
5. Kedudukan UPM dalam QS University Ranking
(a) Dunia
(b) Asia
(c) Asia Tenggara
(d) Malaysia
6. Nyatakan 5 cadangan Transformasi/Perubahan
(a) Peringkat UPM
(b) Peringkat PTJ
Nama :
Fakulti :
Tarikh Masuk UPM :
Nama Universiti (lulusan PhD) :
Email :
STATUS SEMASA UPM
HALA TUJU UPM
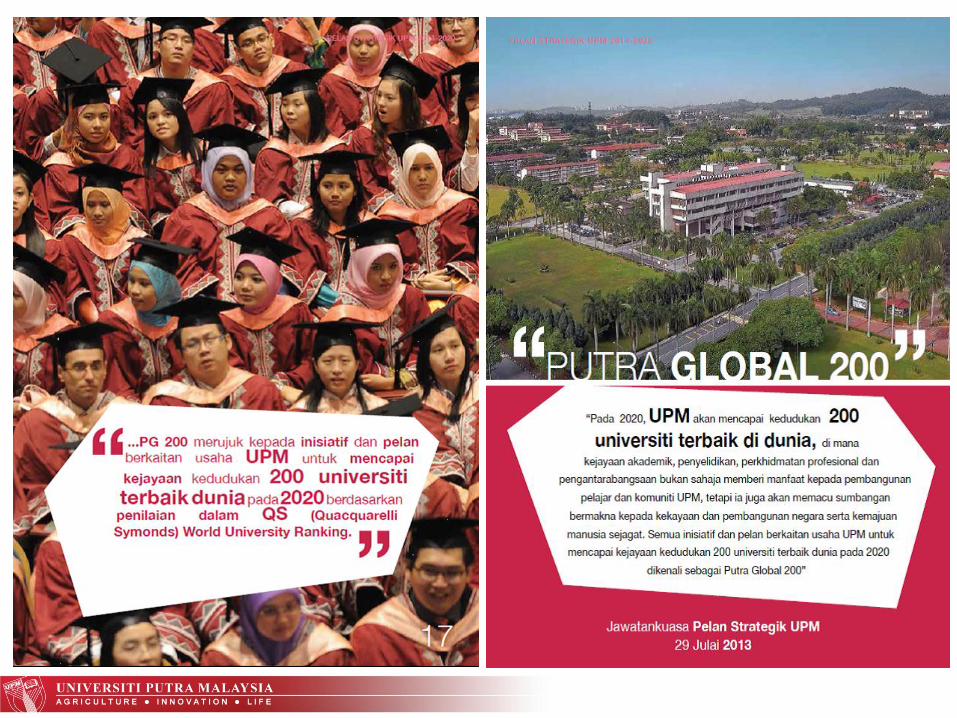
PUTRA GLOBAL 200
RANKING UNIVERSITI
KANDUNGAN
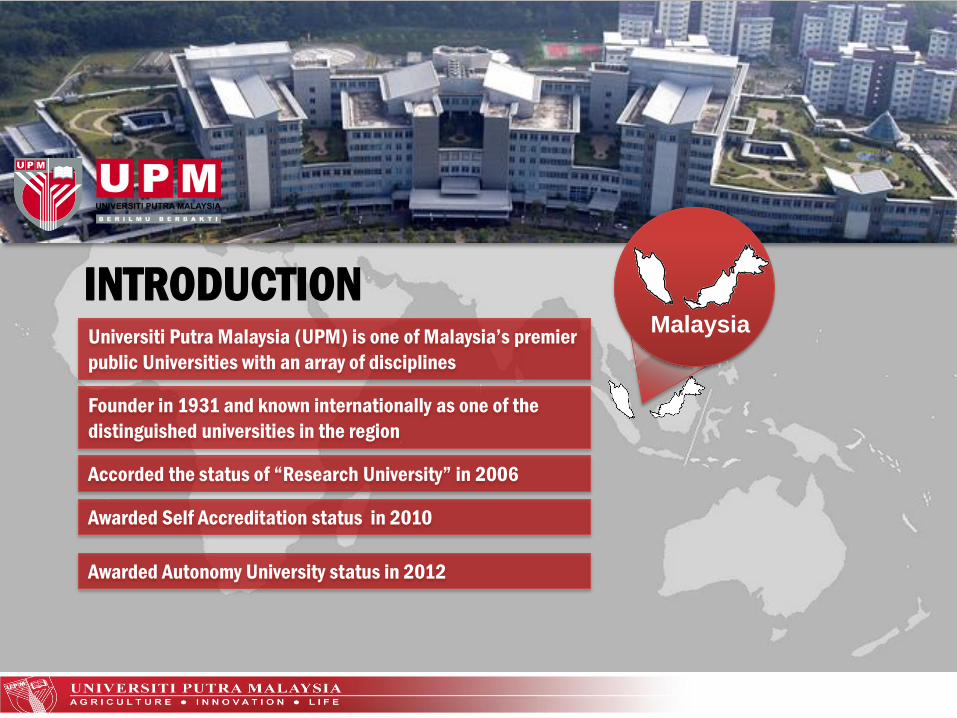
Universiti Putra Malaysia (UPM) is one of Malaysia’s premier
public Universities with an array of disciplines
Founder in 1931 and known internationally as one of the
distinguished universities in the region
Accorded the status of “Research University” in 2006
Awarded Self Accreditation status in 2010
Awarded Autonomy University status in 2012
INTRODUCTIONMalaysia
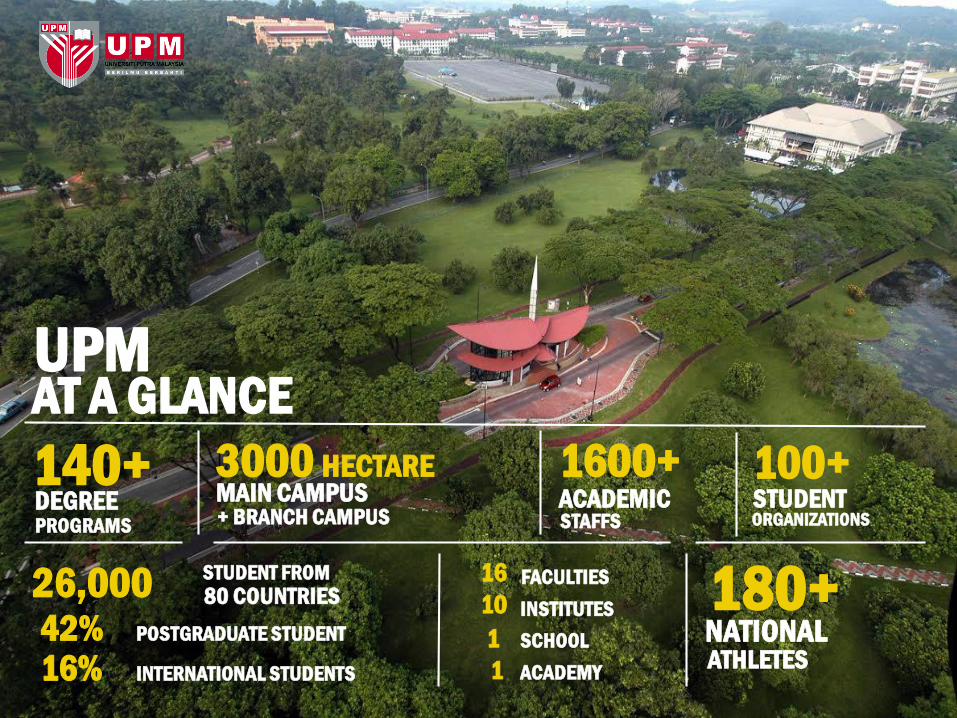
140+DEGREEPROGRAMS
1600+ACADEMICSTAFFS
3000 HECTAREMAIN CAMPUS+ BRANCH CAMPUS
16 FACULTIES
10 INSTITUTES
1 SCHOOL
1 ACADEMY
180+NATIONALATHLETES
100+STUDENTORGANIZATIONS
26,000 STUDENT FROM
80 COUNTRIES
42% POSTGRADUATE STUDENT
16% INTERNATIONAL STUDENTS
AT A GLANCEUPM
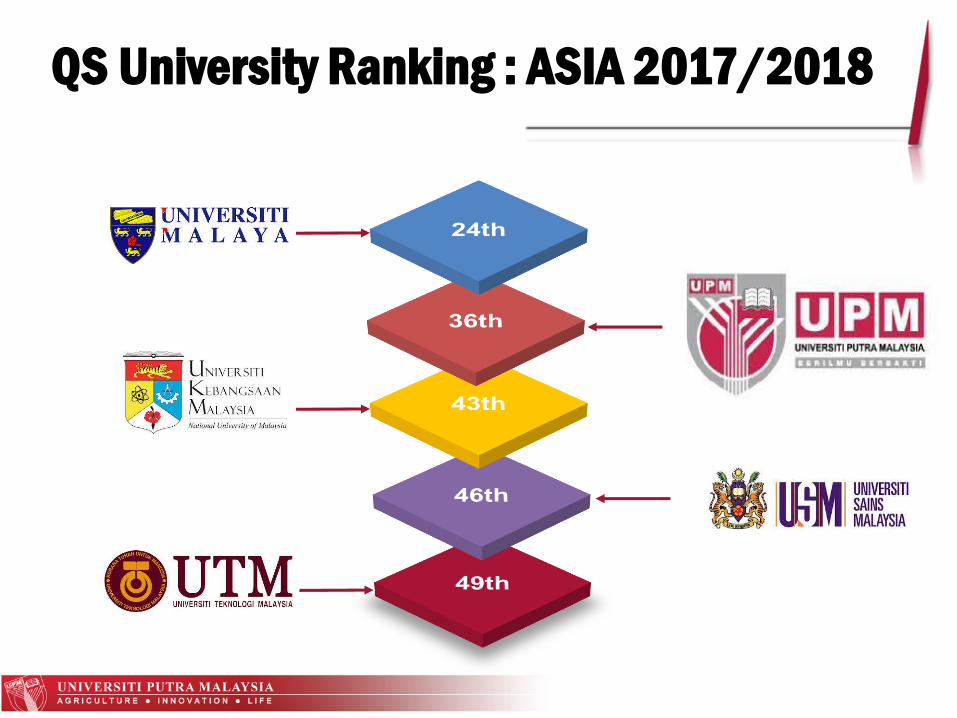
QS University Ranking : ASIA 2017/2018
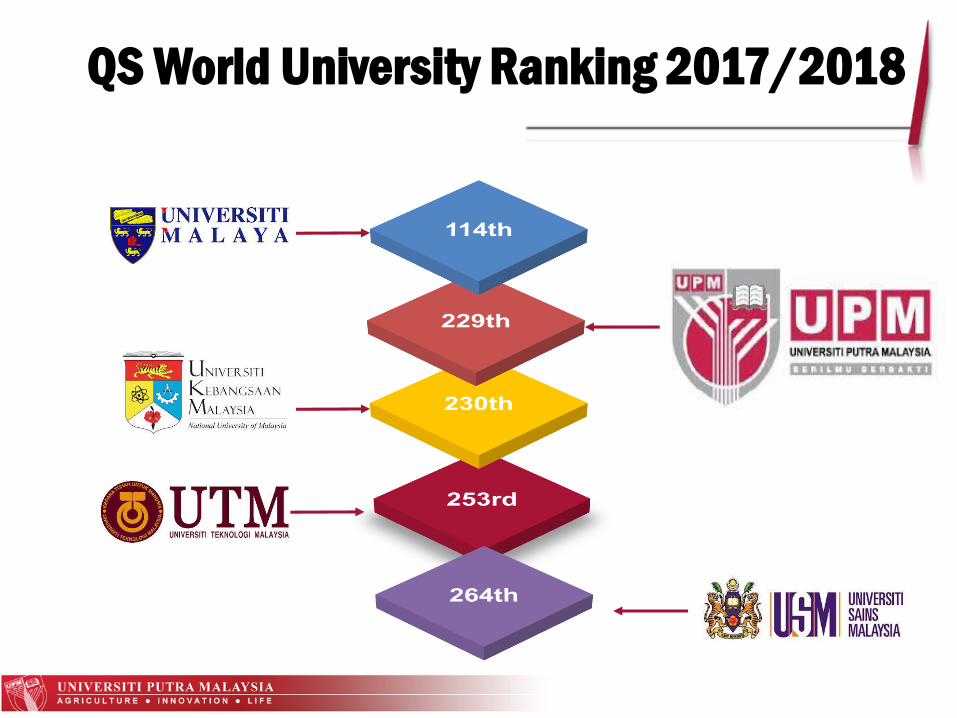
QS World University Ranking 2017/2018
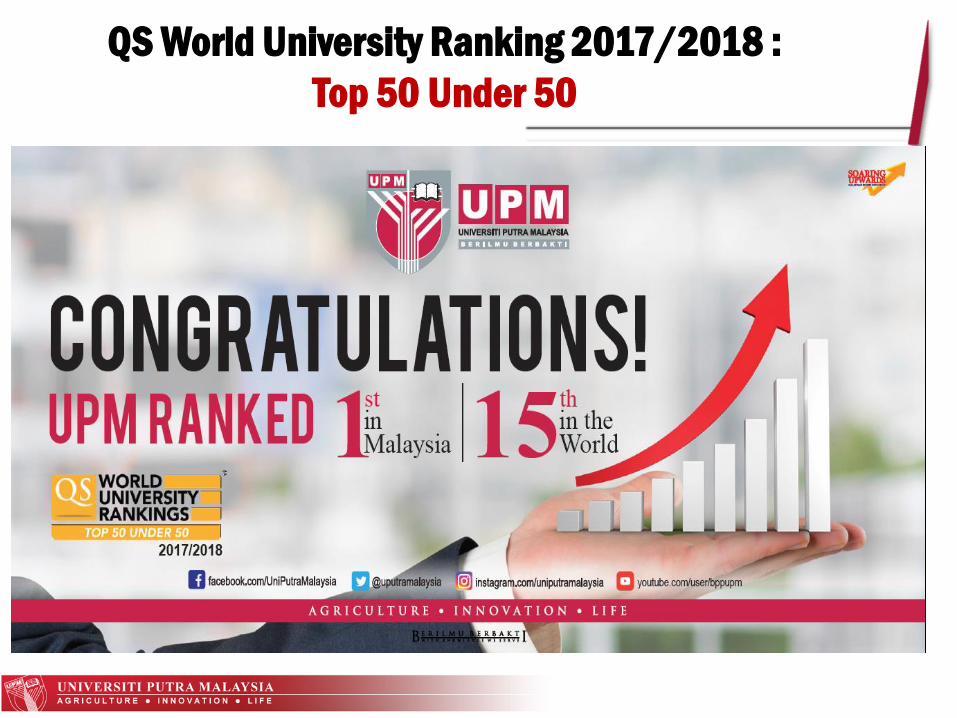
QS World University Ranking 2017/2018 :
Top 50 Under 50
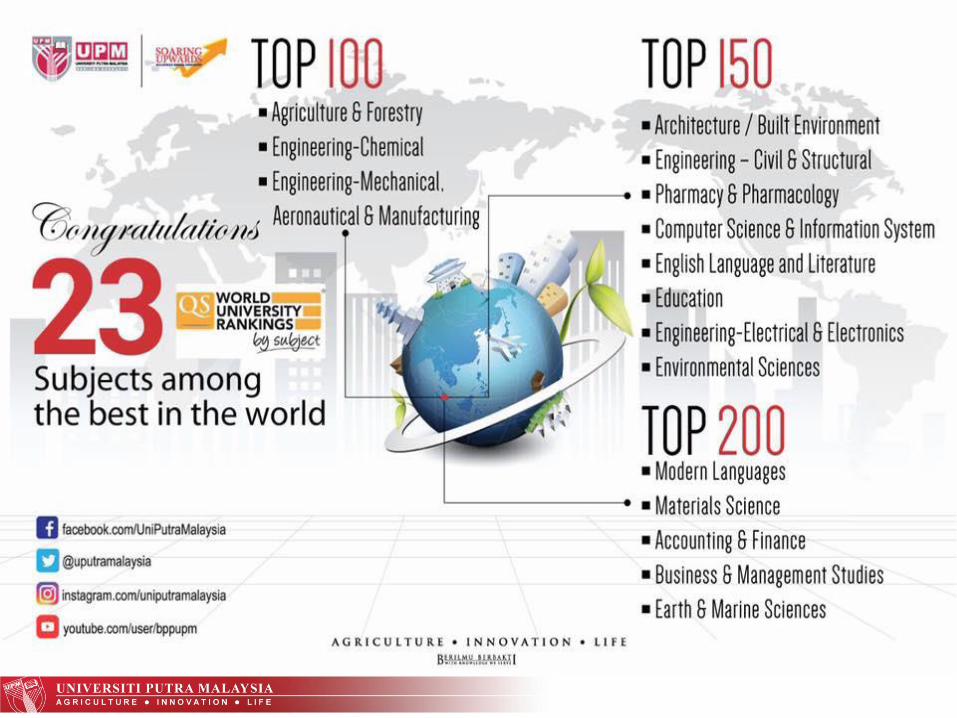
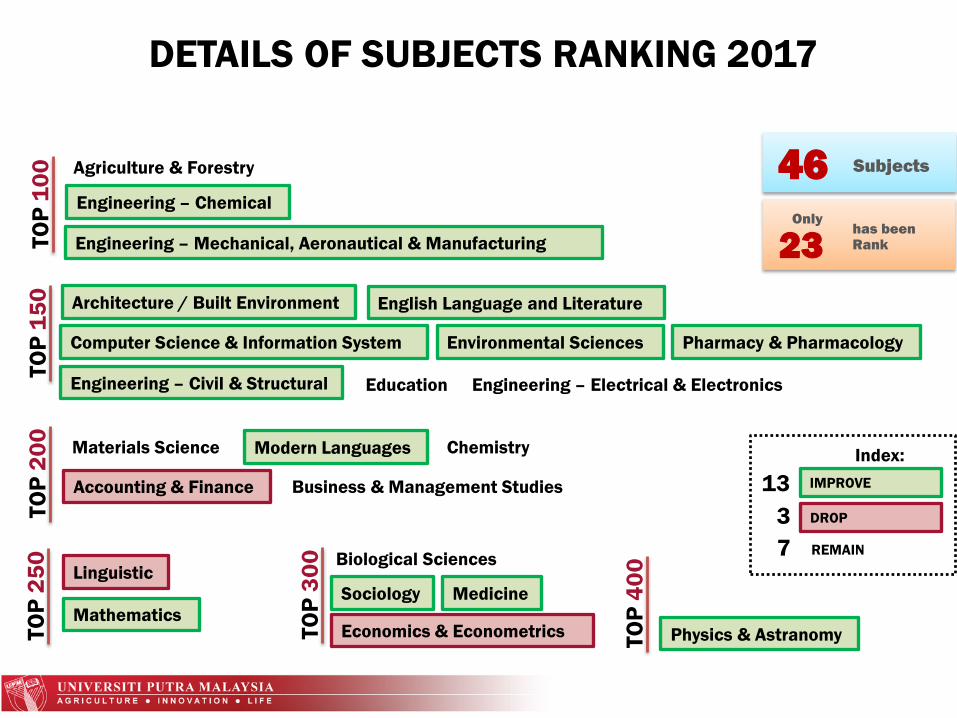
TO
P 1
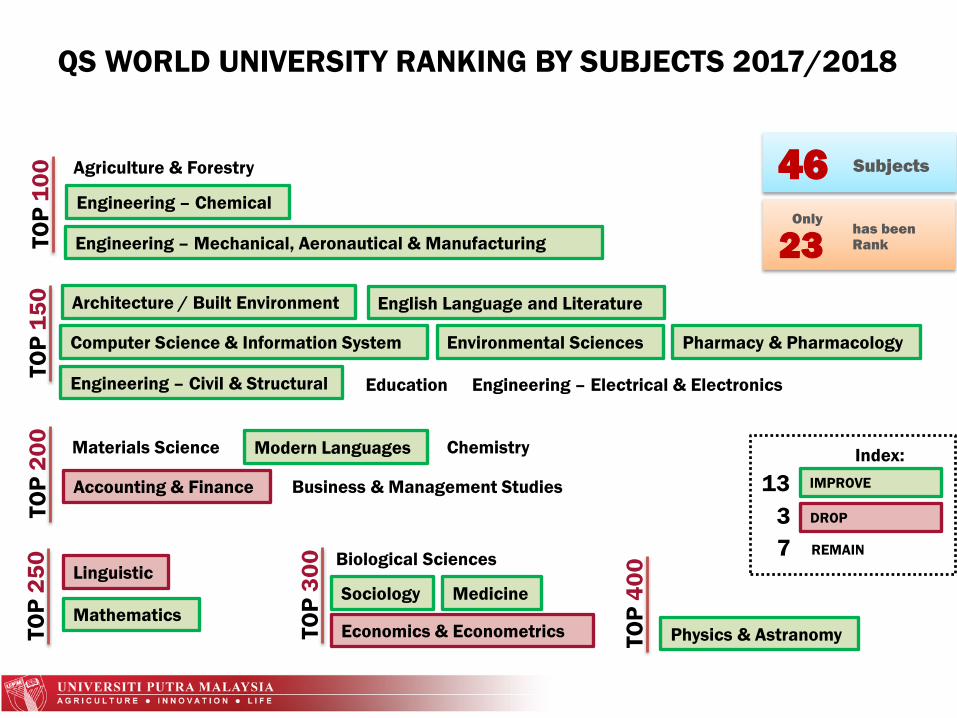
00 Agriculture & Forestry
Engineering – Chemical
Engineering – Mechanical, Aeronautical & Manufacturing
English Language and LiteratureArchitecture / Built Environment
Engineering – Electrical & Electronics
Computer Science & Information System
Engineering – Civil & Structural Education
Environmental Sciences Pharmacy & Pharmacology
Modern LanguagesMaterials Science
Accounting & Finance Business & Management Studies
Chemistry
IMPROVE
DROP
Index:
REMAIN
13
3
7
QS WORLD UNIVERSITY RANKING BY SUBJECTS 2017/2018
23has been Rank
Only
46 Subjects
TO
P 1
50
TO
P 2
00
TO
P 2
50
Linguistic
Mathematics
TO
P 3
00
TO
P 4
00Biological Sciences
Medicine
Economics & Econometrics
Sociology
Physics & Astranomy
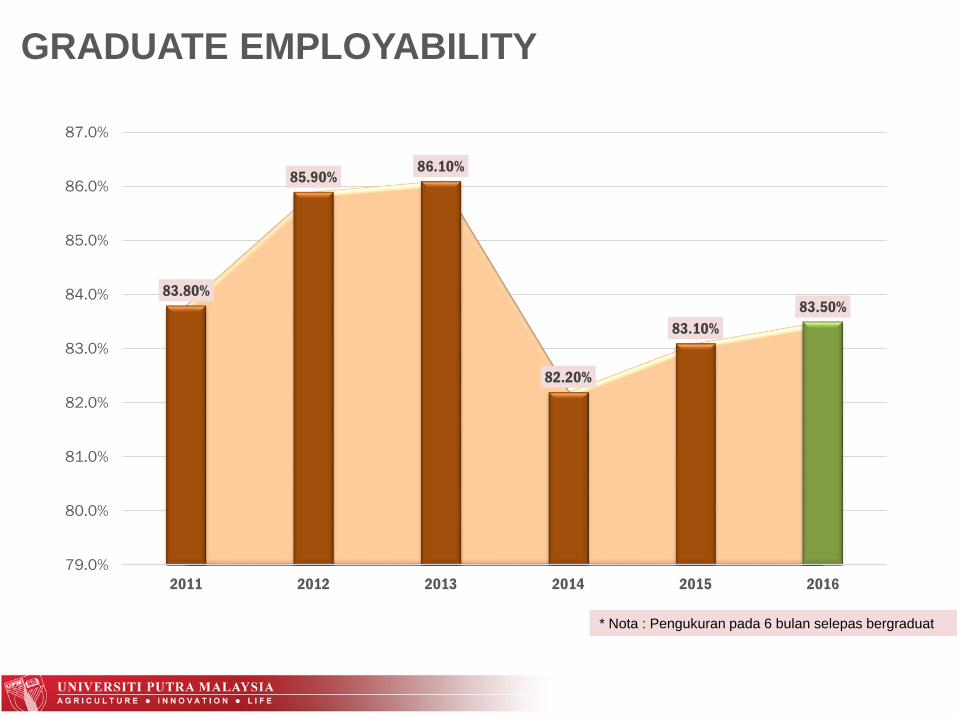
GRADUATE EMPLOYABILITY
* Nota : Pengukuran pada 6 bulan selepas bergraduat
83.80%
85.90%86.10%
82.20%
83.10%
83.50%
79.0%
80.0%
81.0%
82.0%
83.0%
84.0%
85.0%
86.0%
87.0%
2011 2012 2013 2014 2015 2016
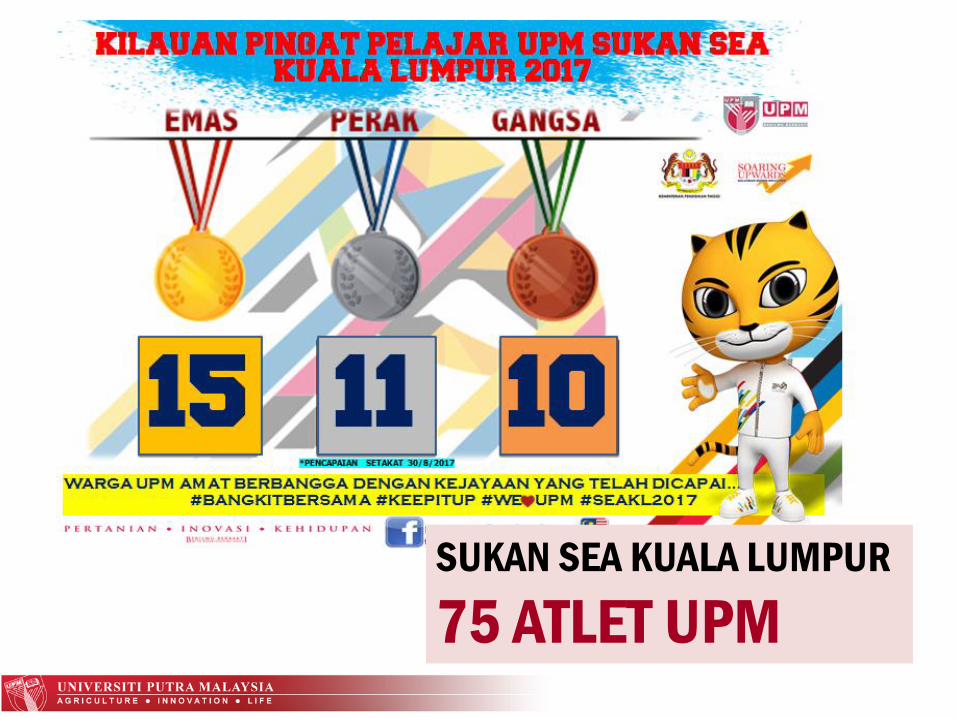
SUKAN SEA KUALA LUMPUR
75 ATLET UPM
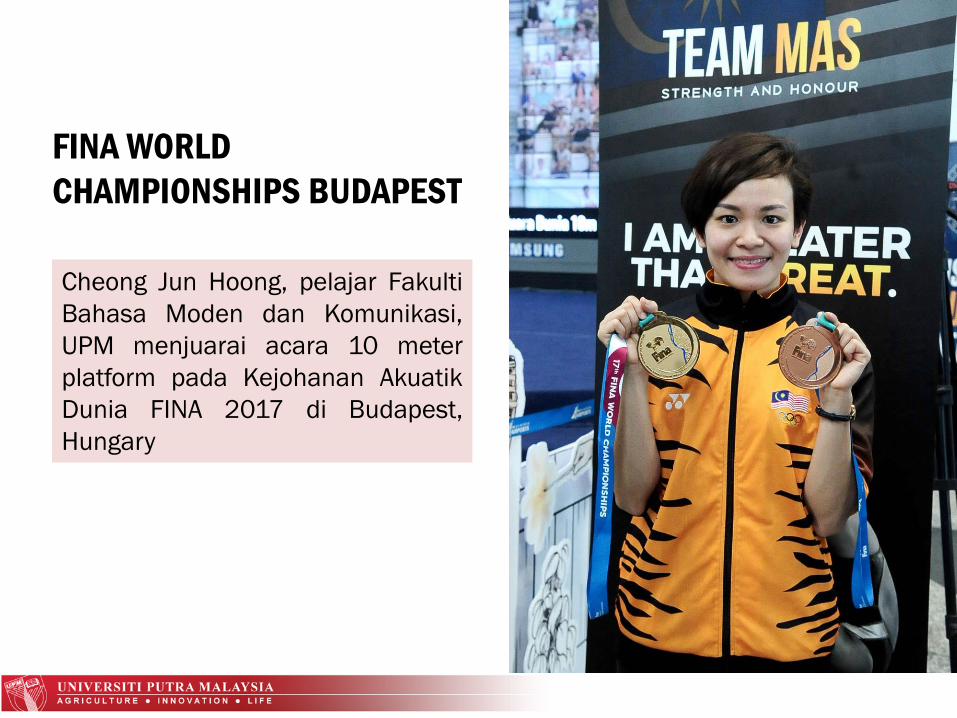
Cheong Jun Hoong, pelajar Fakulti
Bahasa Moden dan Komunikasi,
UPM menjuarai acara 10 meter
platform pada Kejohanan Akuatik
Dunia FINA 2017 di Budapest,
Hungary
FINA WORLD
CHAMPIONSHIPS BUDAPEST
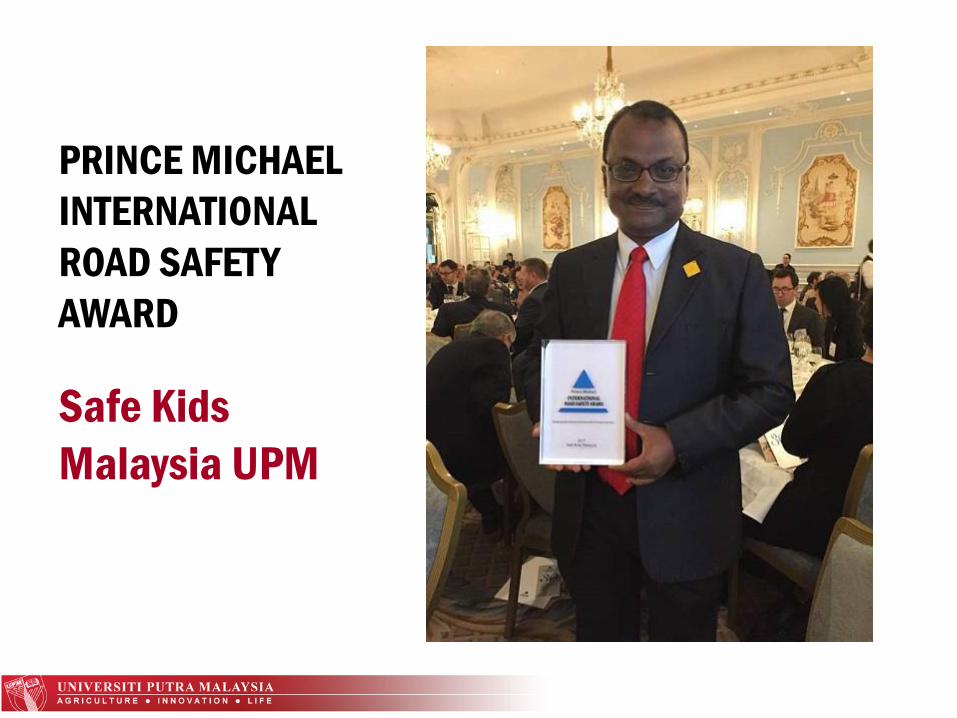
PRINCE MICHAEL
INTERNATIONAL
ROAD SAFETY
AWARD
Safe Kids
Malaysia UPM
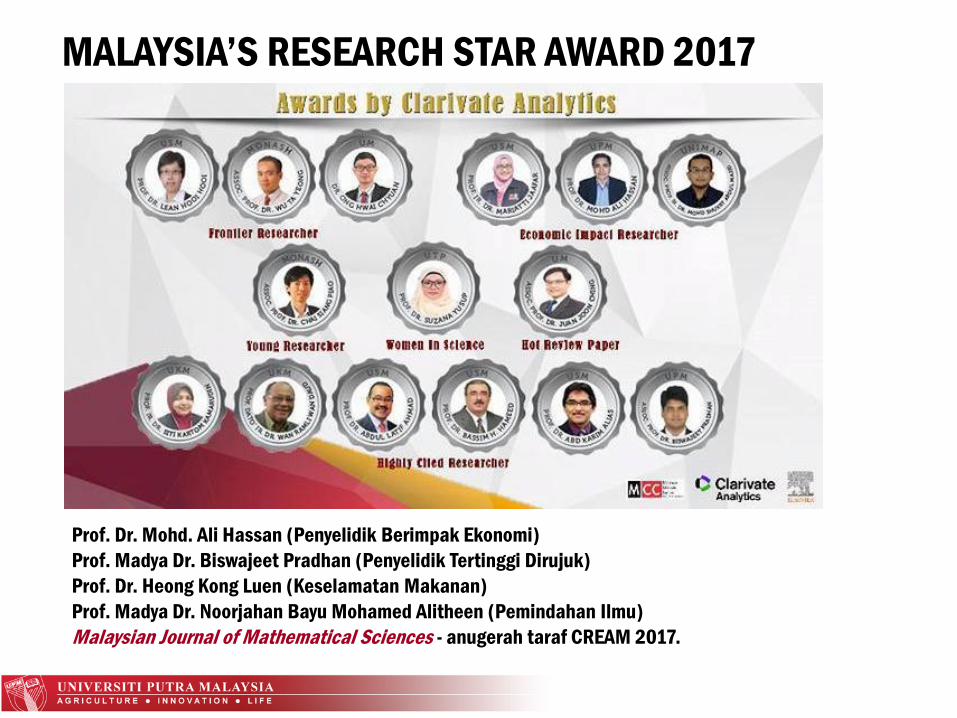
Prof. Dr. Mohd. Ali Hassan (Penyelidik Berimpak Ekonomi)
Prof. Madya Dr. Biswajeet Pradhan (Penyelidik Tertinggi Dirujuk)
Prof. Dr. Heong Kong Luen (Keselamatan Makanan)
Prof. Madya Dr. Noorjahan Bayu Mohamed Alitheen (Pemindahan Ilmu)
Malaysian Journal of Mathematical Sciences - anugerah taraf CREAM 2017.
MALAYSIA’S RESEARCH STAR AWARD 2017
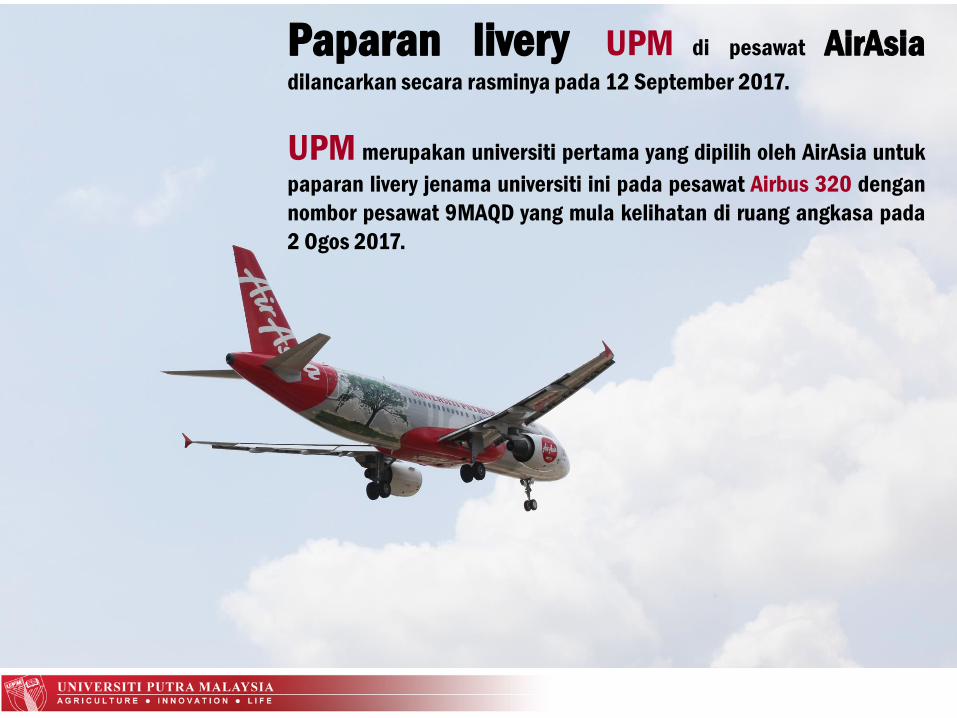
Paparan livery UPM di pesawat AirAsiadilancarkan secara rasminya pada 12 September 2017.
UPM merupakan universiti pertama yang dipilih oleh AirAsia untuk
paparan livery jenama universiti ini pada pesawat Airbus 320 dengan
nombor pesawat 9MAQD yang mula kelihatan di ruang angkasa pada
2 Ogos 2017.
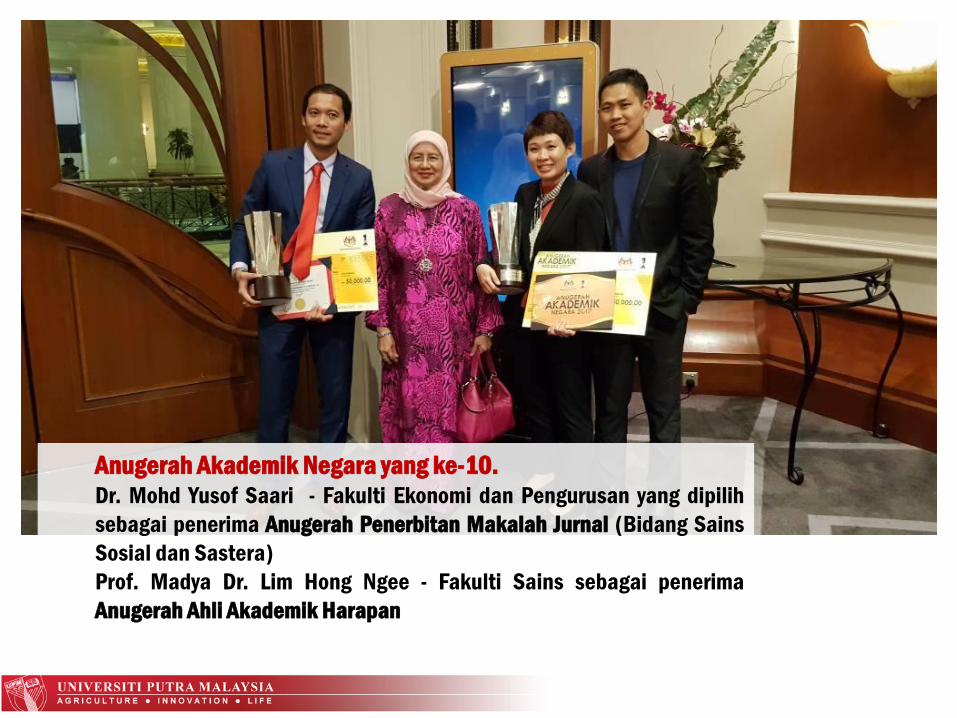
Anugerah Akademik Negara yang ke-10.Dr. Mohd Yusof Saari - Fakulti Ekonomi dan Pengurusan yang dipilih
sebagai penerima Anugerah Penerbitan Makalah Jurnal (Bidang Sains
Sosial dan Sastera)
Prof. Madya Dr. Lim Hong Ngee - Fakulti Sains sebagai penerima
Anugerah Ahli Akademik Harapan
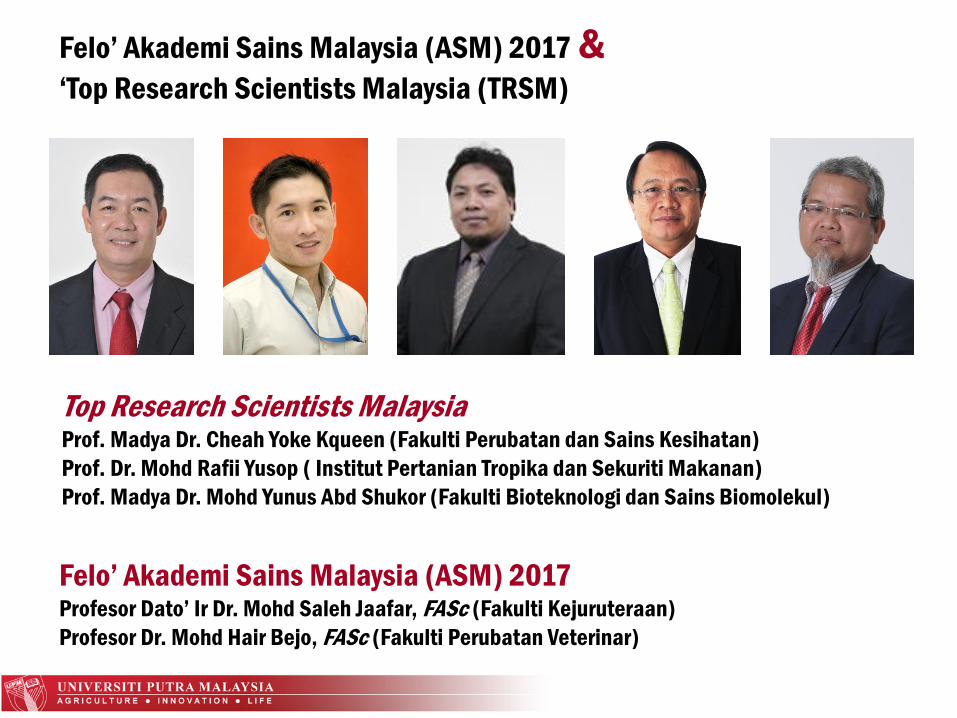
Felo’ Akademi Sains Malaysia (ASM) 2017Profesor Dato’ Ir Dr. Mohd Saleh Jaafar, FASc (Fakulti Kejuruteraan)
Profesor Dr. Mohd Hair Bejo, FASc (Fakulti Perubatan Veterinar)
Top Research Scientists MalaysiaProf. Madya Dr. Cheah Yoke Kqueen (Fakulti Perubatan dan Sains Kesihatan)
Prof. Dr. Mohd Rafii Yusop ( Institut Pertanian Tropika dan Sekuriti Makanan)
Prof. Madya Dr. Mohd Yunus Abd Shukor (Fakulti Bioteknologi dan Sains Biomolekul)
Felo’ Akademi Sains Malaysia (ASM) 2017 &‘Top Research Scientists Malaysia (TRSM)
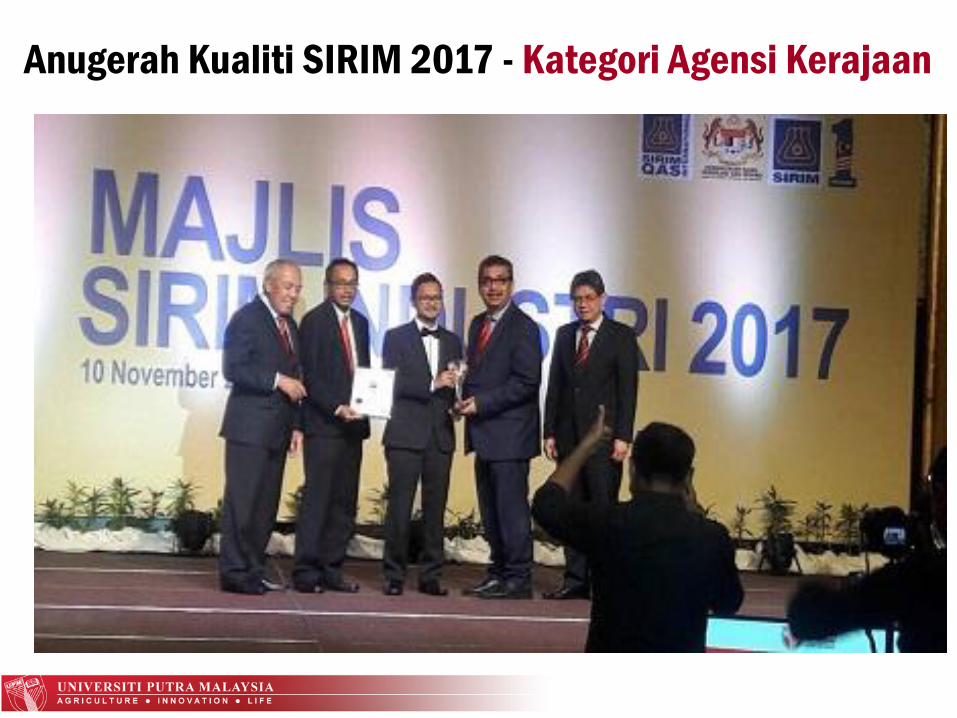
Anugerah Kualiti SIRIM 2017 - Kategori Agensi Kerajaan
HALA TUJU UPM
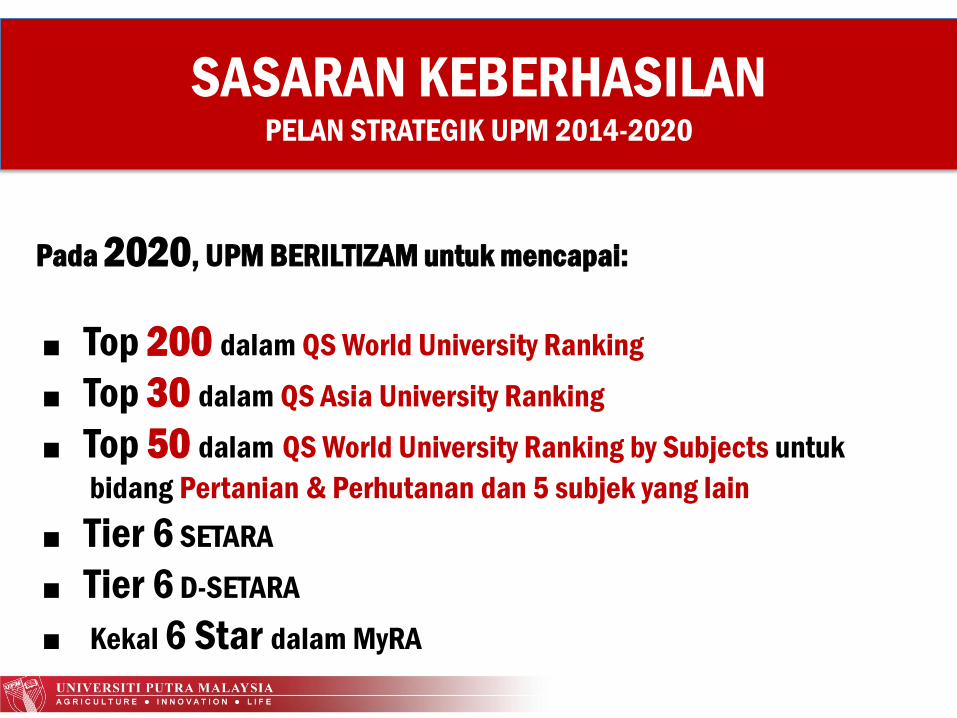
Pada 2020, UPM BERILTIZAM untuk mencapai:
■ Top 200 dalam QS World University Ranking
■ Top 30 dalam QS Asia University Ranking
■ Top 50 dalam QS World University Ranking by Subjects untuk
bidang Pertanian & Perhutanan dan 5 subjek yang lain
■ Tier 6 SETARA
■ Tier 6 D-SETARA
■ Kekal 6 Star dalam MyRA
SASARAN KEBERHASILANPELAN STRATEGIK UPM 2014-2020
VISI, MISI & NILAI
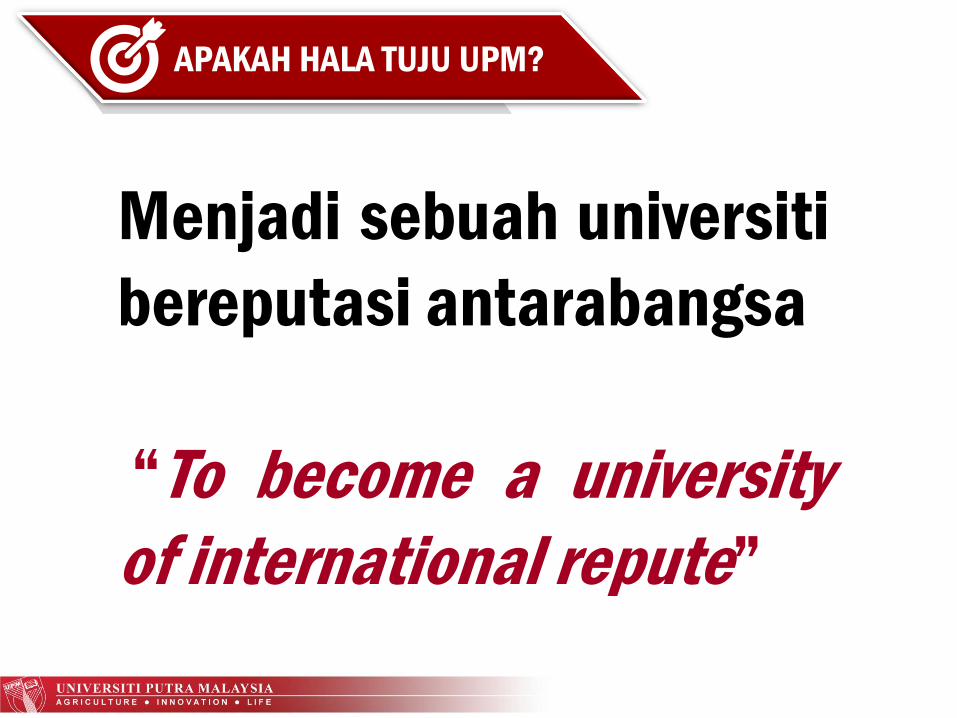
Menjadi sebuah universiti
bereputasi antarabangsa
“To become a university
of international repute”
APAKAH HALA TUJU UPM?
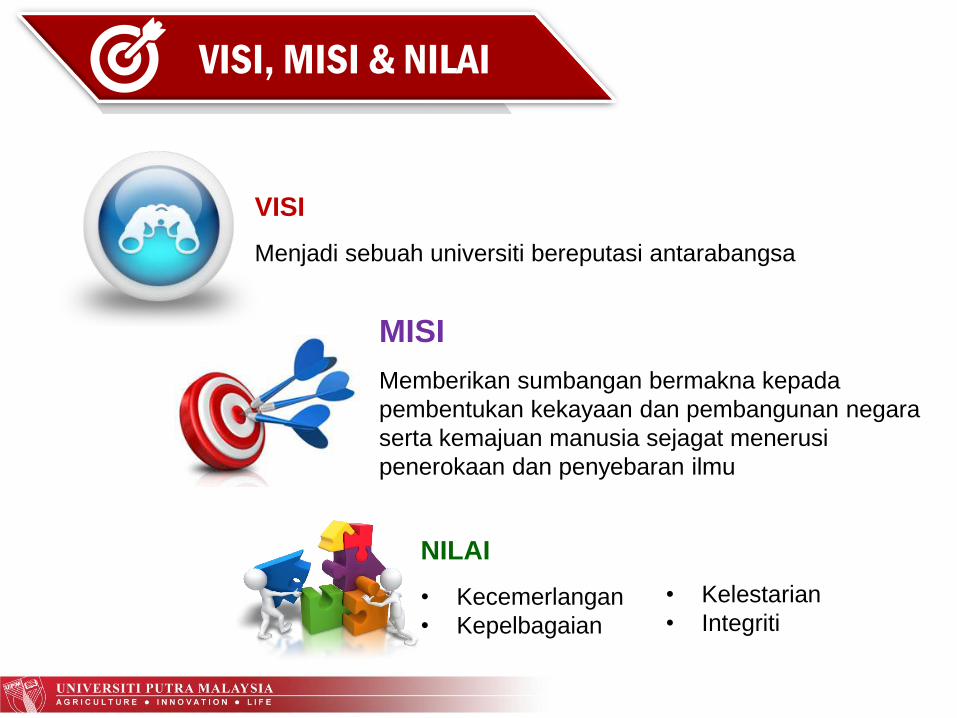
VISI, MISI & NILAI
VISI
Menjadi sebuah universiti bereputasi antarabangsa
NILAI
• Kecemerlangan
• Kepelbagaian
MISI
Memberikan sumbangan bermakna kepada
pembentukan kekayaan dan pembangunan negara
serta kemajuan manusia sejagat menerusi
penerokaan dan penyebaran ilmu
VISI, MISI & NILAI
• Kelestarian
• Integriti
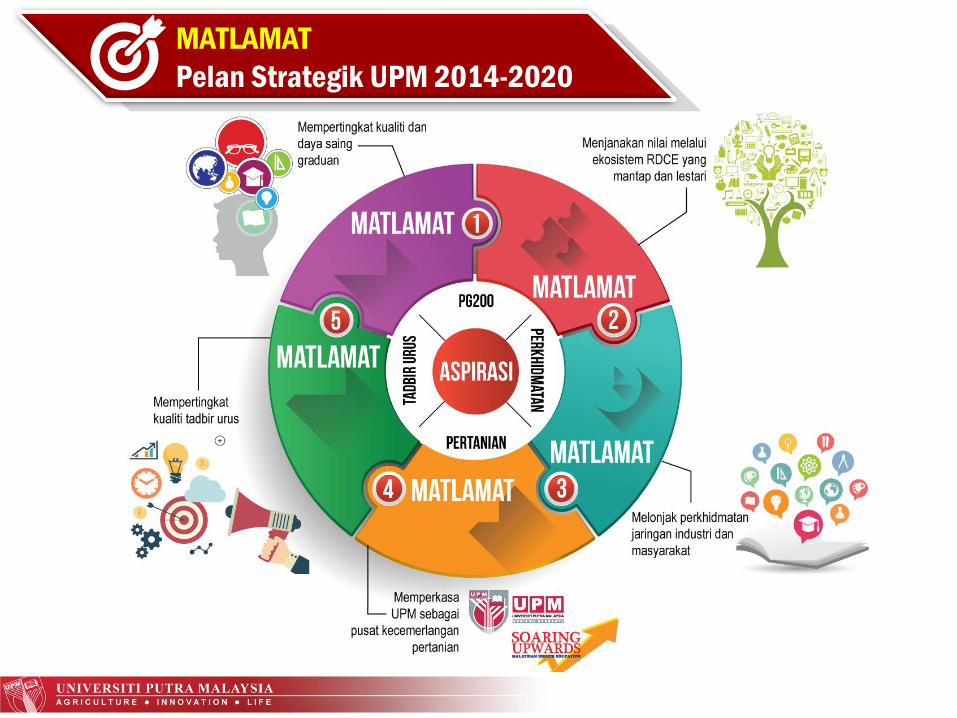
VISI, MISI & NILAIMATLAMAT
Pelan Strategik UPM 2014-2020
O
U
T
P
U
T
P
R
O
C
E
S
S
I
N
P
U
T
S
T
A
K
E
H
O
L
D
E
R
S
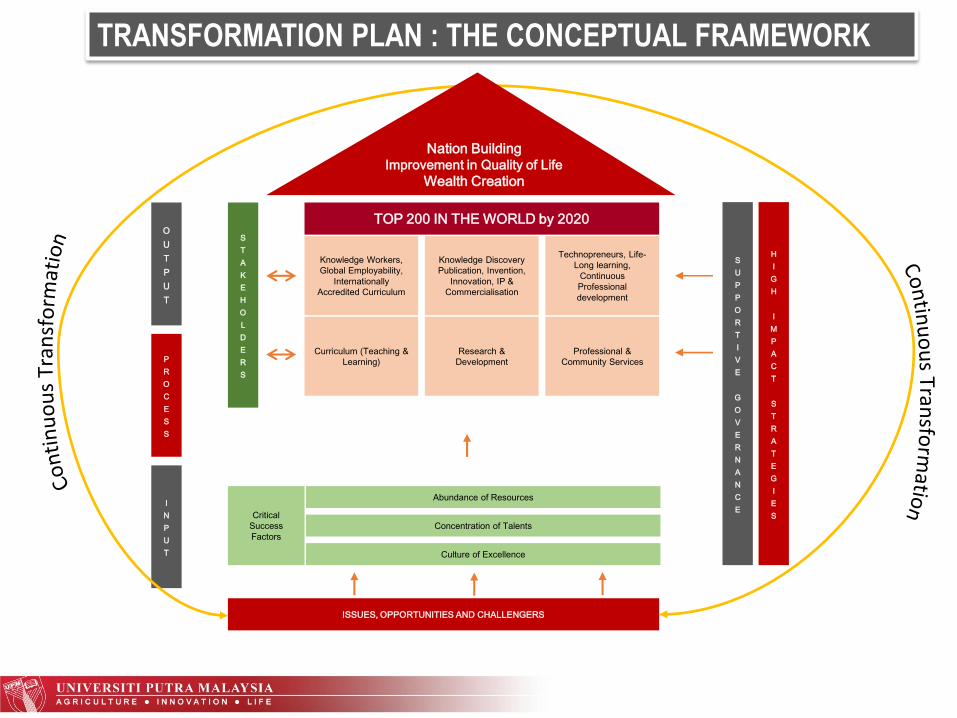
Knowledge Workers,
Global Employability,
Internationally
Accredited Curriculum
Curriculum (Teaching &
Learning)
TOP 200 IN THE WORLD by 2020
Knowledge Discovery
Publication, Invention,
Innovation, IP &
Commercialisation
Research &
Development
Technopreneurs, Life-
Long learning,
Continuous
Professional
development
Professional &
Community Services
Critical
Success
Factors
Abundance of Resources
Concentration of Talents
Culture of Excellence
S
U
P
P
O
R
T
I
V
E
G
O
V
E
R
N
A
N
C
E
H
I
G
H
I
M
P
A
C
T
S
T
R
A
T
E
G
I
E
S
ISSUES, OPPORTUNITIES AND CHALLENGERS
Nation Building Improvement in Quality of Life
Wealth Creation
TRANSFORMATION PLAN : THE CONCEPTUAL FRAMEWORK
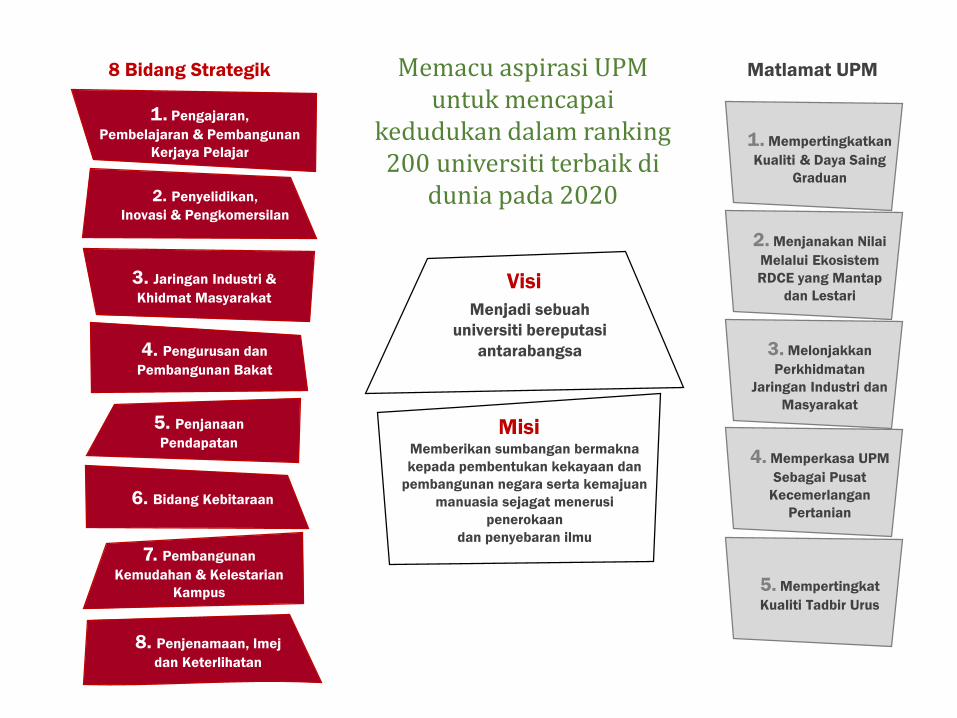
Visi
Menjadi sebuah
universiti bereputasi
antarabangsa
MisiMemberikan sumbangan bermakna
kepada pembentukan kekayaan dan
pembangunan negara serta kemajuan
manuasia sejagat menerusi
penerokaan
dan penyebaran ilmu
1. Pengajaran,
Pembelajaran & Pembangunan
Kerjaya Pelajar
8 Bidang Strategik
2. Penyelidikan,
Inovasi & Pengkomersilan
3. Jaringan Industri &
Khidmat Masyarakat
5. Penjanaan
Pendapatan
6. Bidang Kebitaraan
7. Pembangunan
Kemudahan & Kelestarian
Kampus
8. Penjenamaan, Imej
dan Keterlihatan
4. Pengurusan dan
Pembangunan Bakat
1. Mempertingkatkan
Kualiti & Daya Saing
Graduan
2. Menjanakan Nilai
Melalui Ekosistem
RDCE yang Mantap
dan Lestari
3. Melonjakkan
Perkhidmatan
Jaringan Industri dan
Masyarakat
4. Memperkasa UPM
Sebagai Pusat
Kecemerlangan
Pertanian
5. Mempertingkat
Kualiti Tadbir Urus
Matlamat UPMMemacu aspirasi UPM untuk mencapai
kedudukan dalam ranking 200 universiti terbaik di
dunia pada 2020
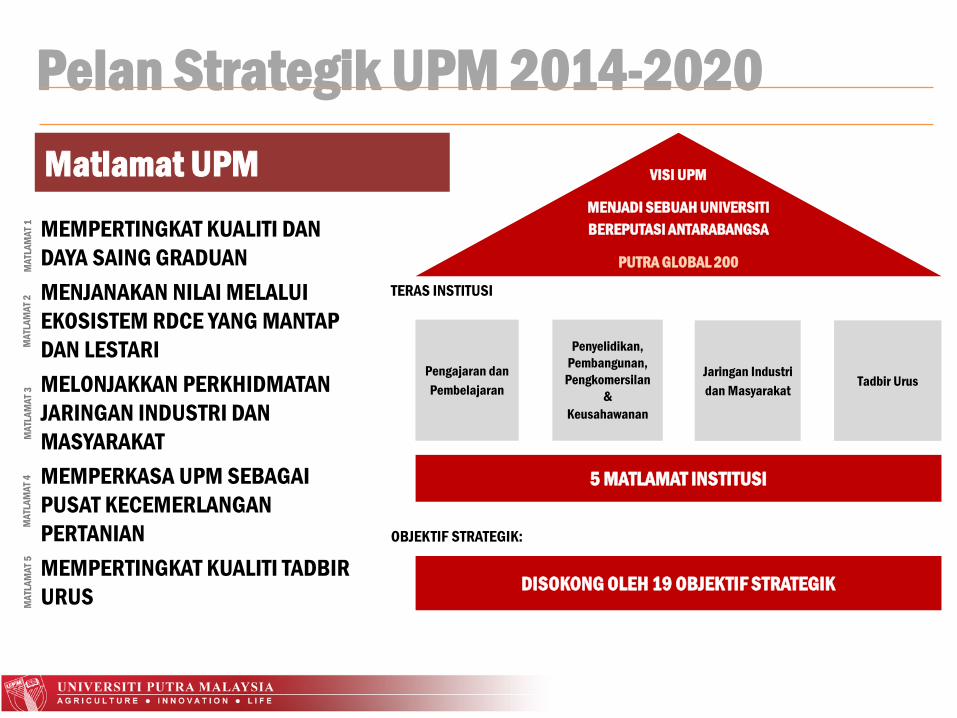
TERAS INSTITUSI
OBJEKTIF STRATEGIK:
DISOKONG OLEH 19 OBJEKTIF STRATEGIK
5 MATLAMAT INSTITUSI
Pengajaran dan
Pembelajaran
Penyelidikan,
Pembangunan,
Pengkomersilan
&
Keusahawanan
Jaringan Industri
dan MasyarakatTadbir Urus
VISI UPM
MENJADI SEBUAH UNIVERSITI
BEREPUTASI ANTARABANGSA
PUTRA GLOBAL 200
Pelan Strategik UPM 2014-2020
MEMPERTINGKAT KUALITI DAN
DAYA SAING GRADUAN
MENJANAKAN NILAI MELALUI
EKOSISTEM RDCE YANG MANTAP
DAN LESTARI
MELONJAKKAN PERKHIDMATAN
JARINGAN INDUSTRI DAN
MASYARAKAT
MEMPERKASA UPM SEBAGAI
PUSAT KECEMERLANGAN
PERTANIAN
MEMPERTINGKAT KUALITI TADBIR
URUS
Matlamat UPM
MA
TLA
MA
T 1
MA
TLA
MA
T 2
MA
TLA
MA
T 3
MA
TLA
MA
T 4
MA
TLA
MA
T 5
M1
M3
M4
M2
M3
M4
M5
M1
M4
M4
M2
M3
M5
M5
M2
M4
M1
M4
M5
M1
M4
M5
M5
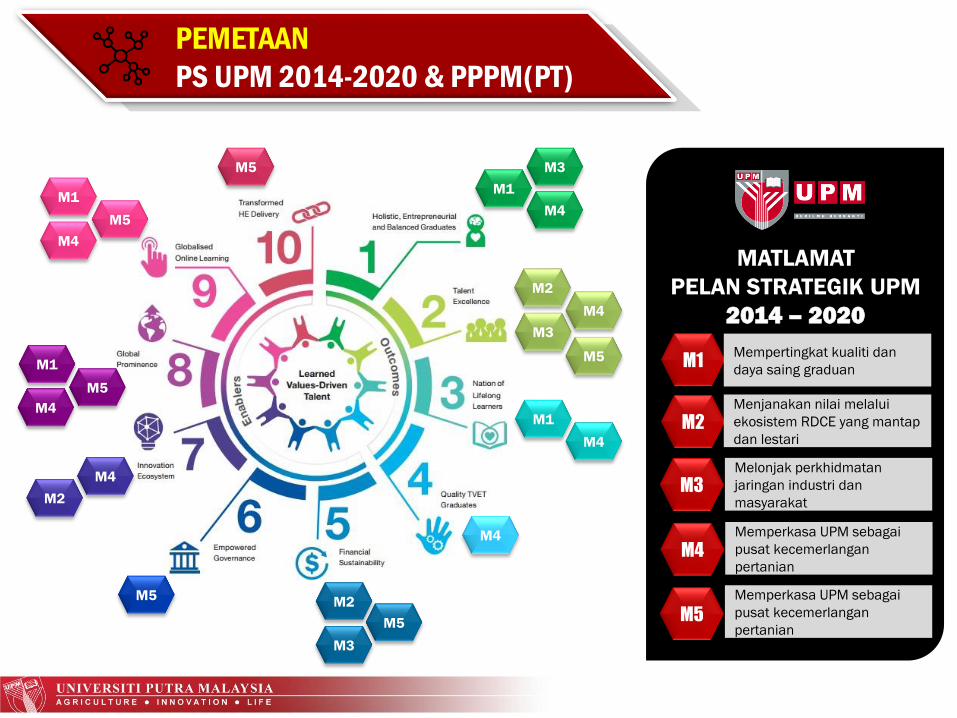
MAPPING OF
MATLAMAT
PELAN STRATEGIK UPM
2014 – 2020
VISI, MISI & NILAIPEMETAAN
PS UPM 2014-2020 & PPPM(PT)
M1
M2
M3
M4
M5
Mempertingkat kualiti dan
daya saing graduan
Menjanakan nilai melalui
ekosistem RDCE yang mantap
dan lestari
Melonjak perkhidmatan
jaringan industri dan
masyarakat
Memperkasa UPM sebagai
pusat kecemerlangan
pertanian
Memperkasa UPM sebagai
pusat kecemerlangan
pertanian
PUTRA GLOBAL 200 (PG200)
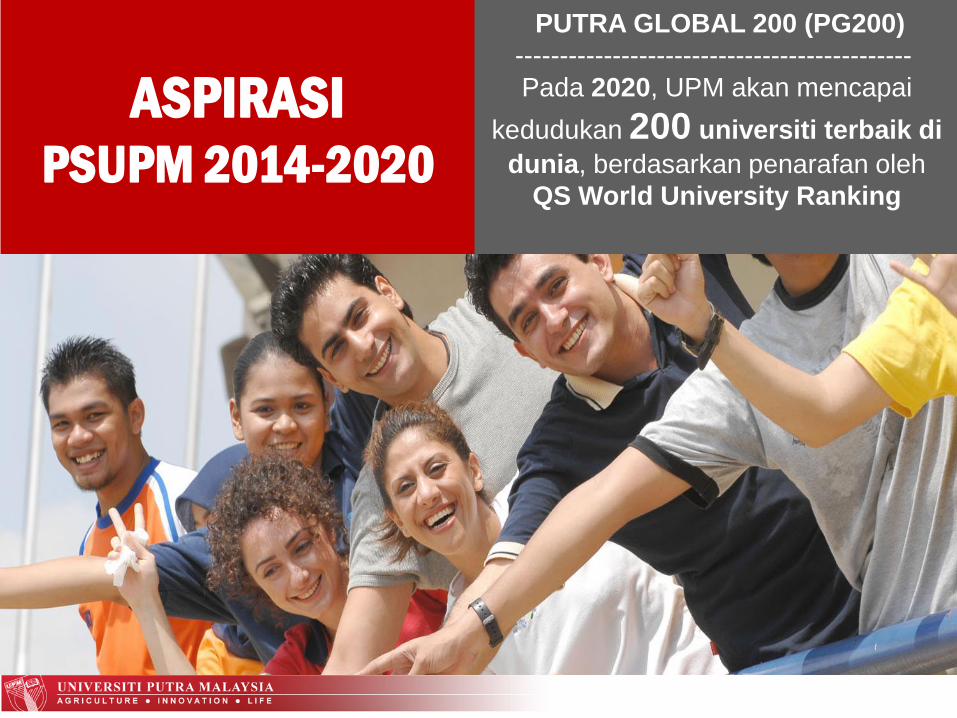
ASPIRASIPSUPM 2014-2020
PUTRA GLOBAL 200 (PG200)
---------------------------------------------
Pada 2020, UPM akan mencapai
kedudukan 200 universiti terbaik di
dunia, berdasarkan penarafan oleh
QS World University Ranking
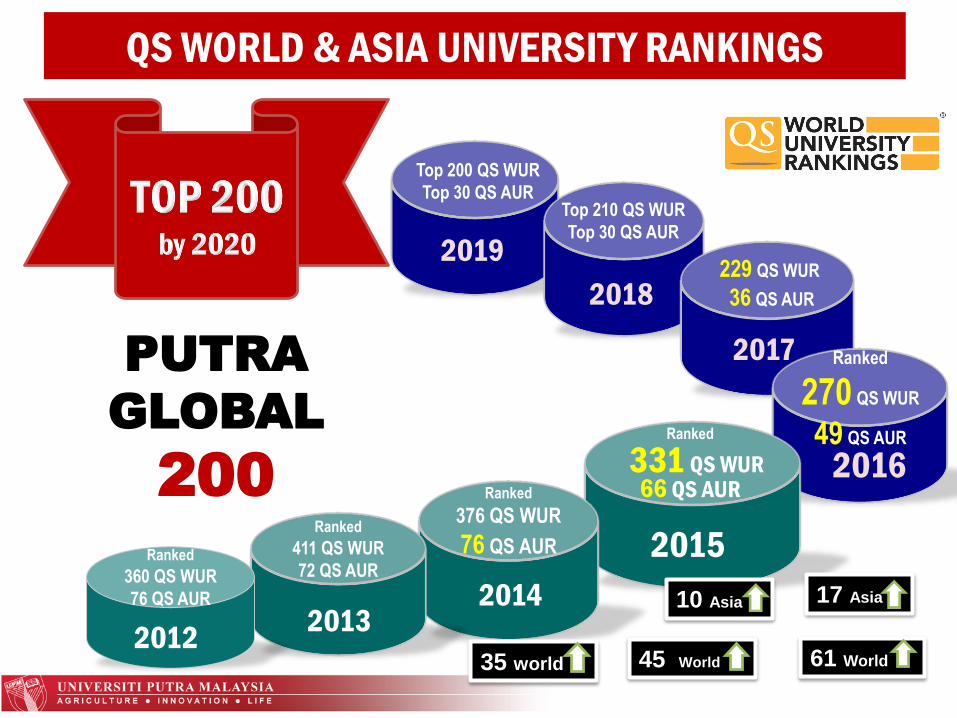
2015
2016
2014
2017
2018
2019
2013
Ranked
411 QS WUR
72 QS AUR
Ranked
376 QS WUR
76 QS AUR
Ranked
66 QS AUR
Ranked
270 QS WUR
49 QS AUR
229 QS WUR
36 QS AUR
Top 210 QS WUR
Top 30 QS AUR
Top 200 QS WUR
Top 30 QS AUR
PUTRA
GLOBAL
200
35 world 45 World
QS WORLD & ASIA UNIVERSITY RANKINGS
Ranked
360 QS WUR
76 QS AUR
2012
331 QS WUR
17 Asia
61 World
10 Asia
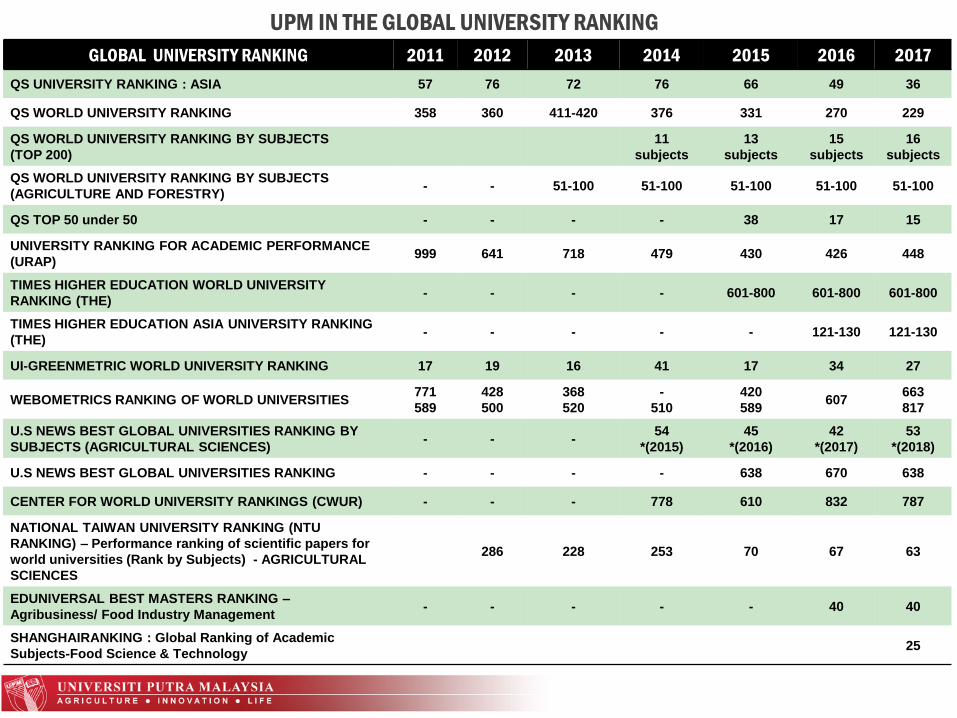
UPM IN THE GLOBAL UNIVERSITY RANKING
GLOBAL UNIVERSITY RANKING 2011 2012 2013 2014 2015 2016 2017
QS UNIVERSITY RANKING : ASIA 57 76 72 76 66 49 36
QS WORLD UNIVERSITY RANKING 358 360 411-420 376 331 270 229
QS WORLD UNIVERSITY RANKING BY SUBJECTS
(TOP 200)
11
subjects
13
subjects
15
subjects
16
subjects
QS WORLD UNIVERSITY RANKING BY SUBJECTS
(AGRICULTURE AND FORESTRY)- - 51-100 51-100 51-100 51-100 51-100
QS TOP 50 under 50 - - - - 38 17 15
UNIVERSITY RANKING FOR ACADEMIC PERFORMANCE
(URAP)999 641 718 479 430 426 448
TIMES HIGHER EDUCATION WORLD UNIVERSITY
RANKING (THE)- - - - 601-800 601-800 601-800
TIMES HIGHER EDUCATION ASIA UNIVERSITY RANKING
(THE)- - - - - 121-130 121-130
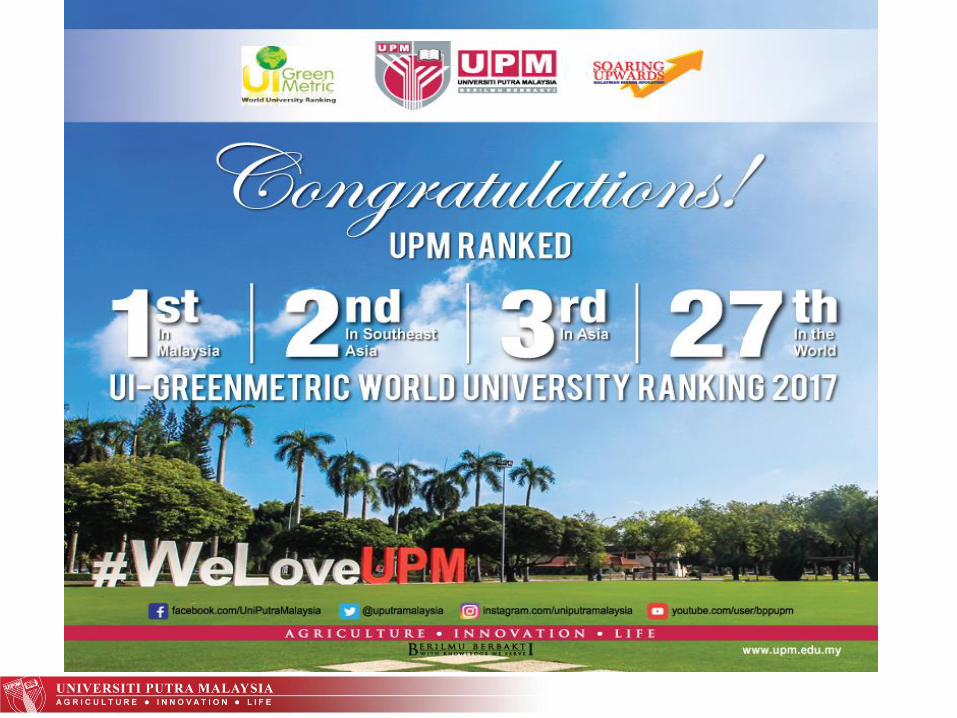
UI-GREENMETRIC WORLD UNIVERSITY RANKING 17 19 16 41 17 34 27
WEBOMETRICS RANKING OF WORLD UNIVERSITIES771
589
428
500
368
520
-
510
420
589 607
663
817
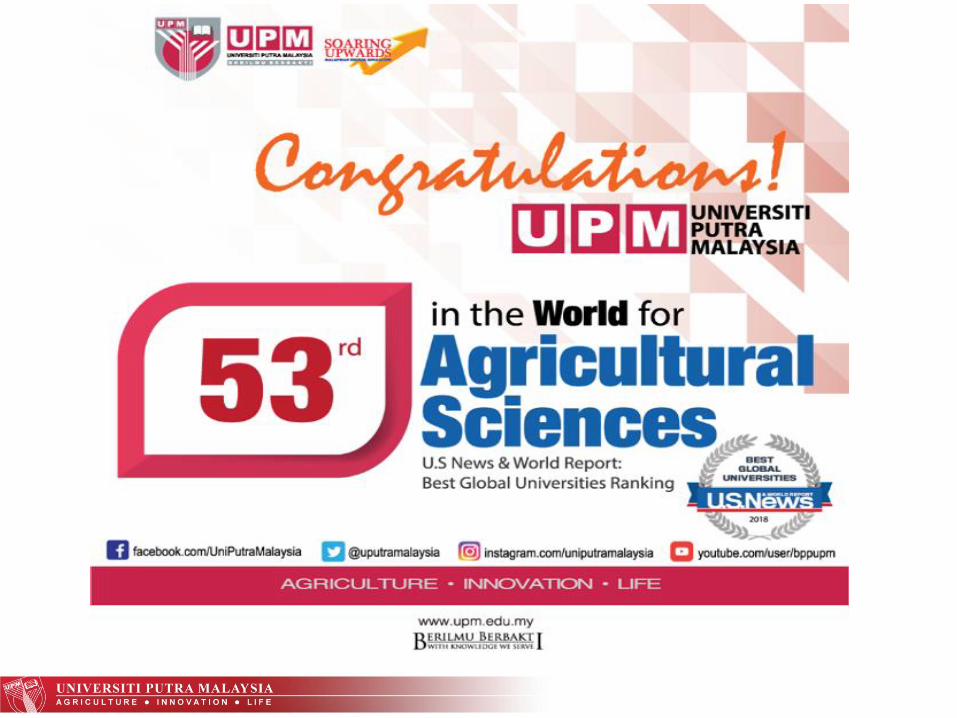
U.S NEWS BEST GLOBAL UNIVERSITIES RANKING BY
SUBJECTS (AGRICULTURAL SCIENCES)- - -
54
*(2015)
45
*(2016)
42
*(2017)
53
*(2018)
U.S NEWS BEST GLOBAL UNIVERSITIES RANKING - - - - 638 670 638
CENTER FOR WORLD UNIVERSITY RANKINGS (CWUR) - - - 778 610 832 787
NATIONAL TAIWAN UNIVERSITY RANKING (NTU
RANKING) – Performance ranking of scientific papers for
world universities (Rank by Subjects) - AGRICULTURAL
SCIENCES
286 228 253 70 67 63
EDUNIVERSAL BEST MASTERS RANKING –
Agribusiness/ Food Industry Management- - - - - 40 40
SHANGHAIRANKING : Global Ranking of Academic
Subjects-Food Science & Technology25
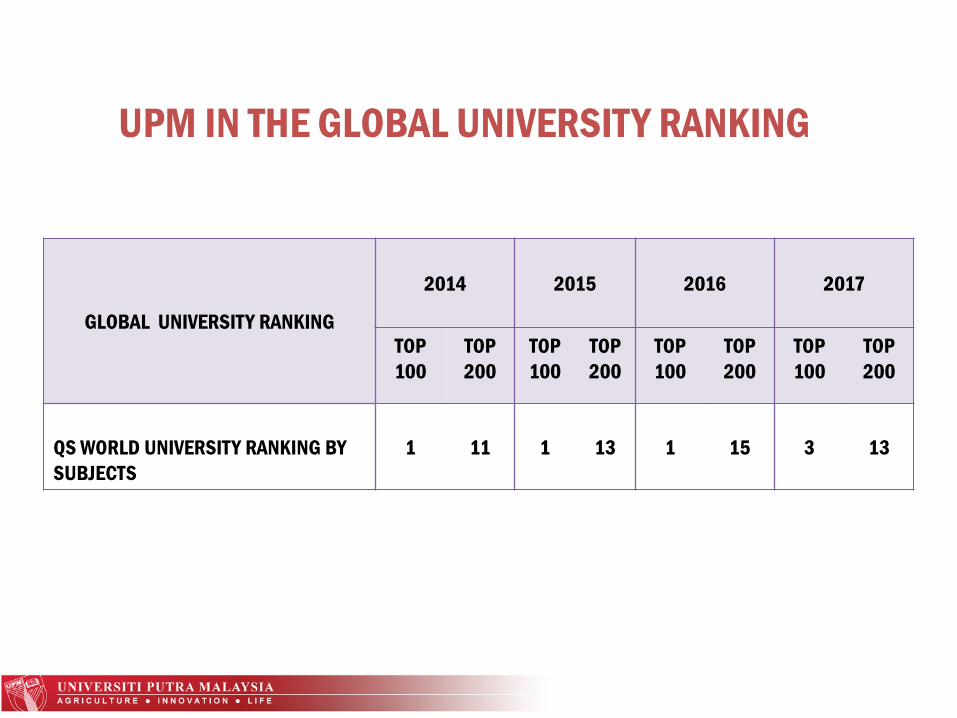
UPM IN THE GLOBAL UNIVERSITY RANKING
GLOBAL UNIVERSITY RANKING
2014 2015 2016 2017
TOP
100
TOP
200
TOP
100
TOP
200
TOP
100
TOP
200
TOP
100
TOP
200
QS WORLD UNIVERSITY RANKING BY
SUBJECTS
1 11 1 13 1 15 3 13
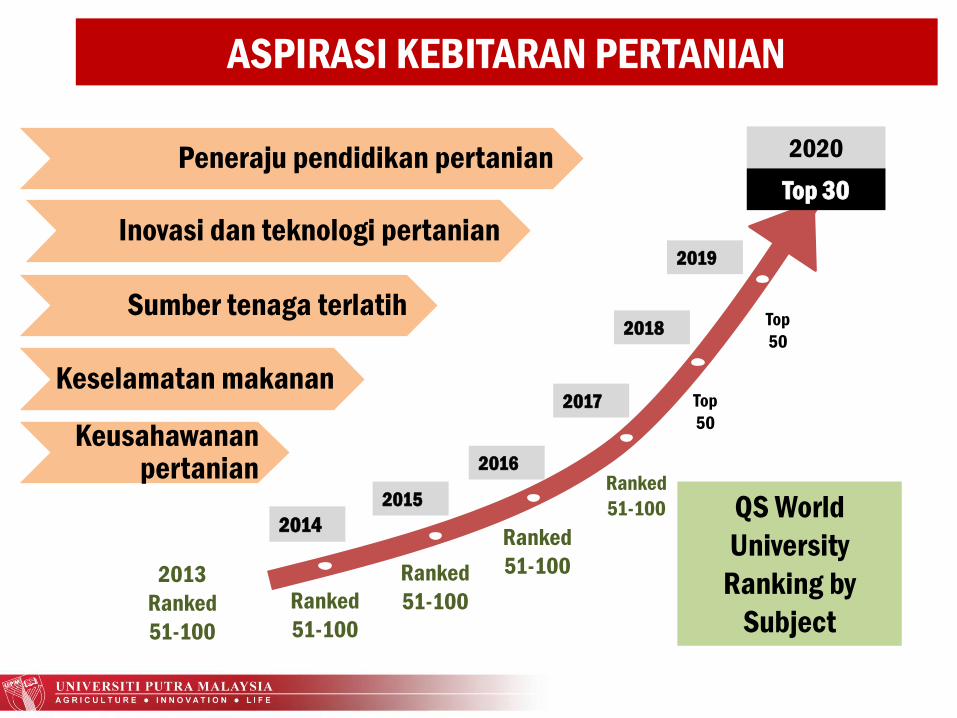
2013
Ranked
51-100
2014
2015
2016
2017
2018
2019
Ranked
51-100
Ranked
51-100
Ranked
51-100
Ranked
51-100
Top
50
Top
50
2020
Top 30
Peneraju pendidikan pertanian
Inovasi dan teknologi pertanian
Sumber tenaga terlatih
Keselamatan makanan
Keusahawananpertanian
QS World
University
Ranking by
Subject
ASPIRASI KEBITARAN PERTANIAN
41
PENCAPAIAN KPI UPM
SUKU KETIGA 2017
42
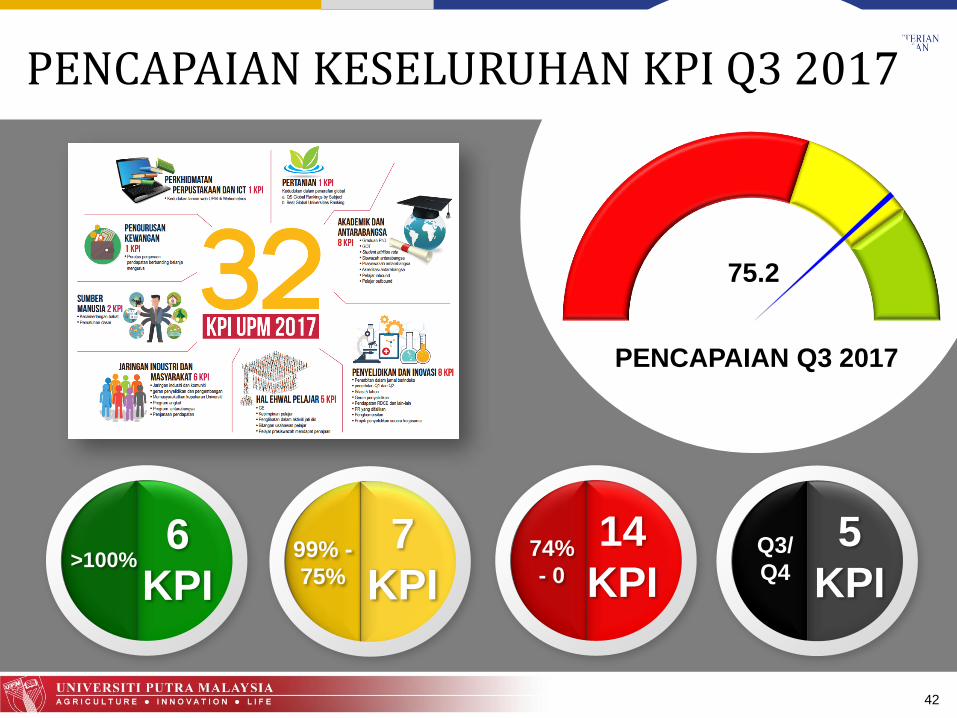
PENCAPAIAN KESELURUHAN KPI Q3 2017
>100%6
KPI99% -
75%
7
KPI74%
- 0
14
KPIQ3/
Q4
5
KPI
PENCAPAIAN Q3 2017
75.2
43
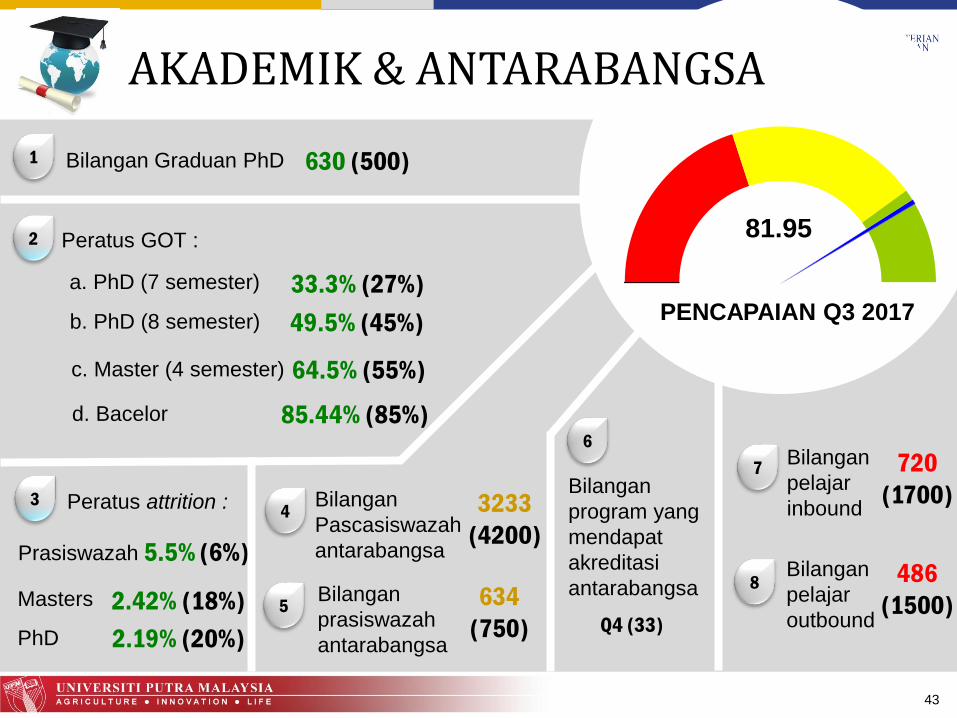
Bilangan Graduan PhD 630 (500)
b. PhD (8 semester)
Peratus GOT :
33.3% (27%)
49.5% (45%)
c. Master (4 semester)
d. Bacelor
64.5% (55%)
85.44% (85%)
Bilangan
Pascasiswazah
antarabangsa
Bilangan
prasiswazah
antarabangsa
634
(750)
AKADEMIK & ANTARABANGSA
Peratus attrition :
Prasiswazah
Masters
PhD
5.5% (6%)
2.42% (18%)
2.19% (20%)
Bilangan
program yang
mendapat
akreditasi
antarabangsa
Q4 (33)
3233
(4200)
Bilangan
pelajar
inbound
Bilangan
pelajar
outbound
720
(1700)
486
(1500)
1
2
34
5
6
7
8
a. PhD (7 semester)
PENCAPAIAN Q3 2017
81.95

45
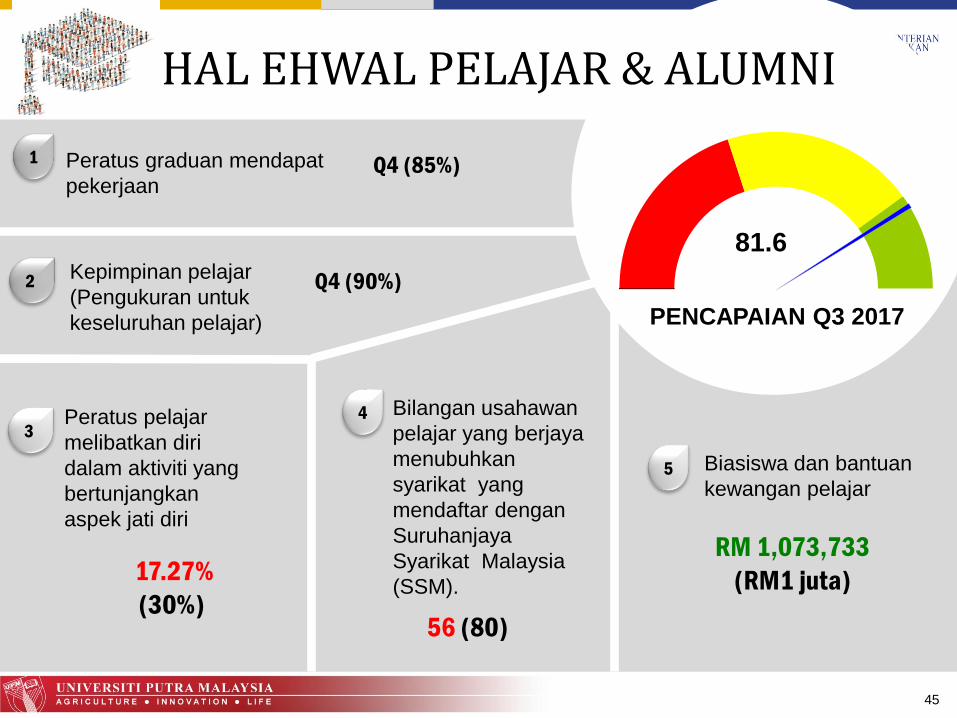
Peratus graduan mendapat
pekerjaanQ4 (85%)
Kepimpinan pelajar
(Pengukuran untuk
keseluruhan pelajar)
Q4 (90%)
Peratus pelajar
melibatkan diri
dalam aktiviti yang
bertunjangkan
aspek jati diri
HAL EHWAL PELAJAR & ALUMNI
Bilangan usahawan
pelajar yang berjaya
menubuhkan
syarikat yang
mendaftar dengan
Suruhanjaya
Syarikat Malaysia
(SSM).
56 (80)
17.27%
(30%)
Biasiswa dan bantuan
kewangan pelajar
RM 1,073,733
(RM1 juta)
1
34
5
2
PENCAPAIAN Q3 2017
81.6
46
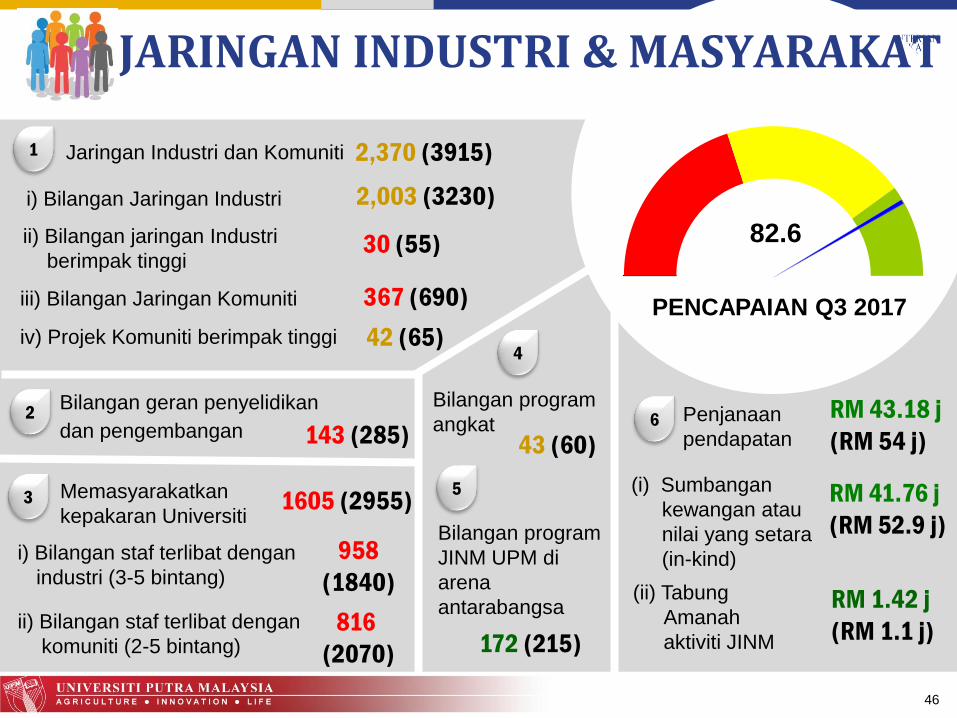
Jaringan Industri dan Komuniti 2,370 (3915)
i) Bilangan Jaringan Industri 2,003 (3230)
ii) Bilangan jaringan Industri
berimpak tinggi30 (55)
1605 (2955)
143 (285)
1
2
JARINGAN INDUSTRI & MASYARAKAT
Bilangan program
angkat43 (60)
Bilangan program
JINM UPM di
arena
antarabangsa
4
5
172 (215)
iii) Bilangan Jaringan Komuniti
iv) Projek Komuniti berimpak tinggi
367 (690)
42 (65)
Bilangan geran penyelidikan
dan pengembangan
i) Bilangan staf terlibat dengan
industri (3-5 bintang)
3 Memasyarakatkan
kepakaran Universiti
ii) Bilangan staf terlibat dengan
komuniti (2-5 bintang)
Penjanaan
pendapatan
(i) Sumbangan
kewangan atau
nilai yang setara
(in-kind)
(ii) Tabung
Amanah
aktiviti JINM
958
(1840)
816
(2070)
RM 41.76 j
(RM 52.9 j)
RM 1.42 j
(RM 1.1 j)
6
PENCAPAIAN Q3 2017
82.6
RM 43.18 j
(RM 54 j)
47
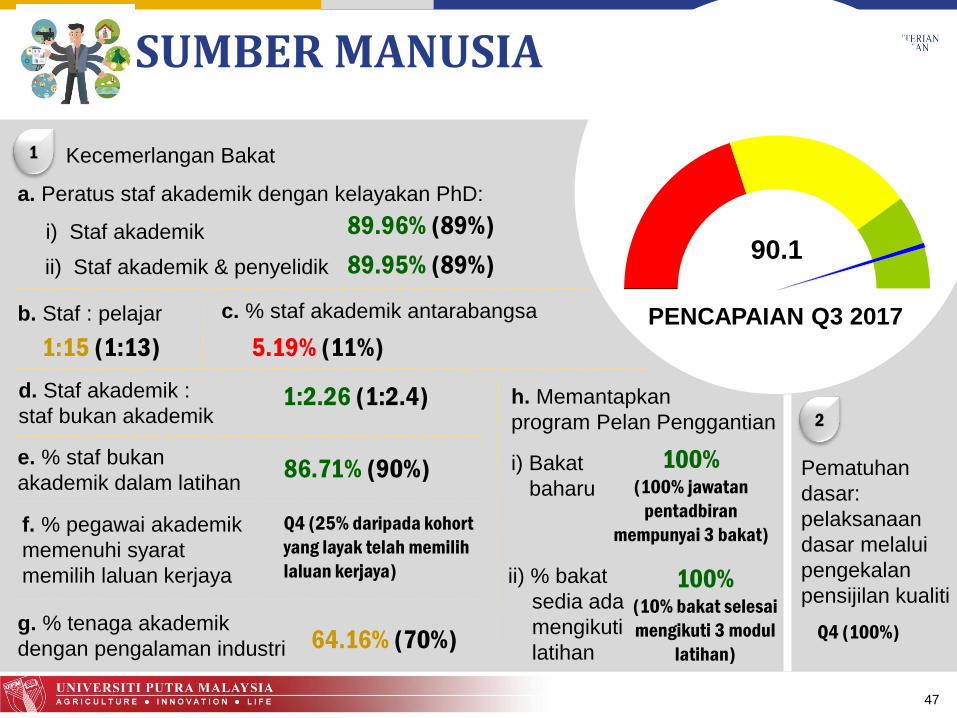
Kecemerlangan Bakat
a. Peratus staf akademik dengan kelayakan PhD:
Q4 (100%)
1
SUMBER MANUSIA
Pematuhan
dasar:
pelaksanaan
dasar melalui
pengekalan
pensijilan kualiti
i) Staf akademik
ii) Staf akademik & penyelidik
89.96% (89%)
89.95% (89%)
b. Staf : pelajar c. % staf akademik antarabangsa
d. Staf akademik :
staf bukan akademik
e. % staf bukan
akademik dalam latihan
1:15 (1:13) 5.19% (11%)
1:2.26 (1:2.4)
86.71% (90%)
f. % pegawai akademik
memenuhi syarat
memilih laluan kerjaya
g. % tenaga akademik
dengan pengalaman industri
h. Memantapkan
program Pelan Penggantian
i) Bakat
baharu
ii) % bakat
sedia ada
mengikuti
latihan
100% (100% jawatan
pentadbiran
mempunyai 3 bakat)
100% (10% bakat selesai
mengikuti 3 modul
latihan)64.16% (70%)
Q4 (25% daripada kohort
yang layak telah memilih
laluan kerjaya)
2
PENCAPAIAN Q3 2017
90.1
48
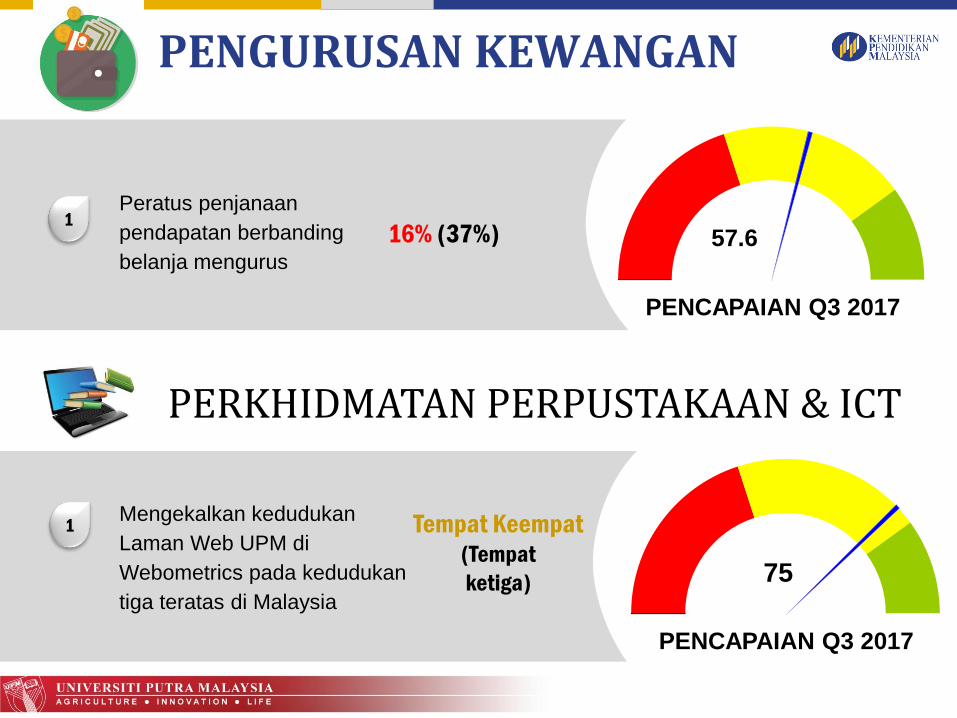
Peratus penjanaan
pendapatan berbanding
belanja mengurus
16% (37%)1
PENGURUSAN KEWANGAN
PERKHIDMATAN PERPUSTAKAAN & ICT
Mengekalkan kedudukan
Laman Web UPM di
Webometrics pada kedudukan
tiga teratas di Malaysia
Tempat Keempat(Tempat
ketiga)
1
PENCAPAIAN Q3 2017
PENCAPAIAN Q3 2017
57.6
75
49
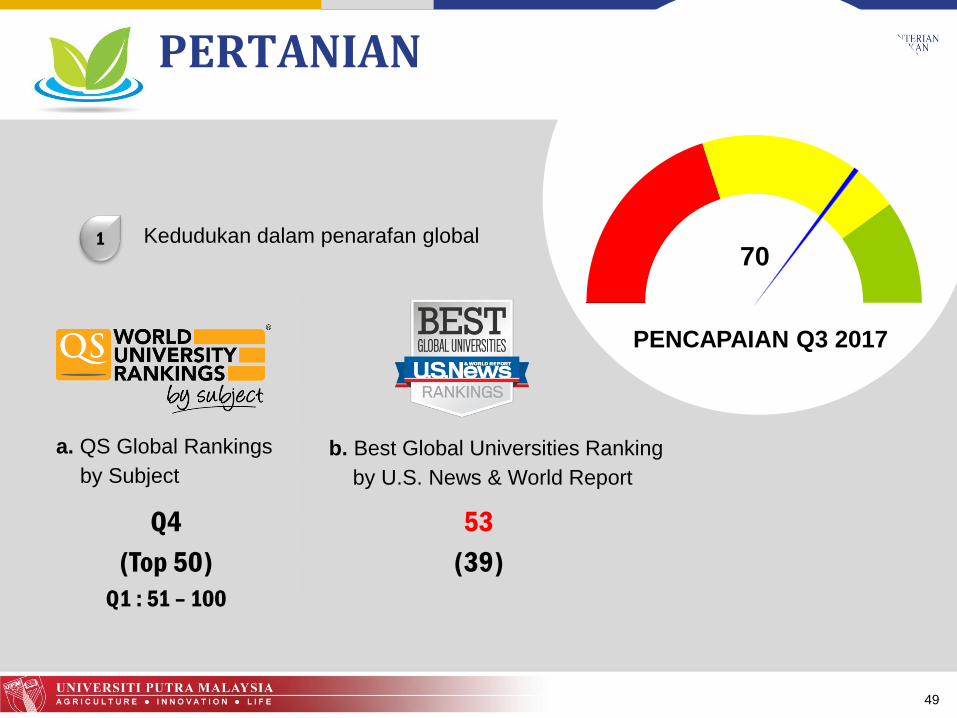
1
PERTANIAN
Kedudukan dalam penarafan global
Q4
(Top 50)
Q1 : 51 – 100
53
(39)
a. QS Global Rankings
by Subject
b. Best Global Universities Ranking
by U.S. News & World Report
PENCAPAIAN Q3 2017
70
LAPORAN PENCAPAIAN UPM
QS UNIVERSITY RANKING : ASIA 2017/2018
QS WORLD UNIVERSITY RANKINGS 2014 : RU
Aca
dem
ic R
eput
atio
n
Em
ploy
er R
eput
atio
n
Fac
ulty
Stu
dent
Rat
io
Sta
ff w
ith P
hD
Cita
tions
Out
boun
d E
xcha
nge
Stu
dent
s
Inte
rnat
iona
l Stu
dent
s
Inte
rnat
iona
l Fac
ulty
Pap
ers
per
Fac
ulty
Inbo
und
Exc
hang
e S
tude
nts
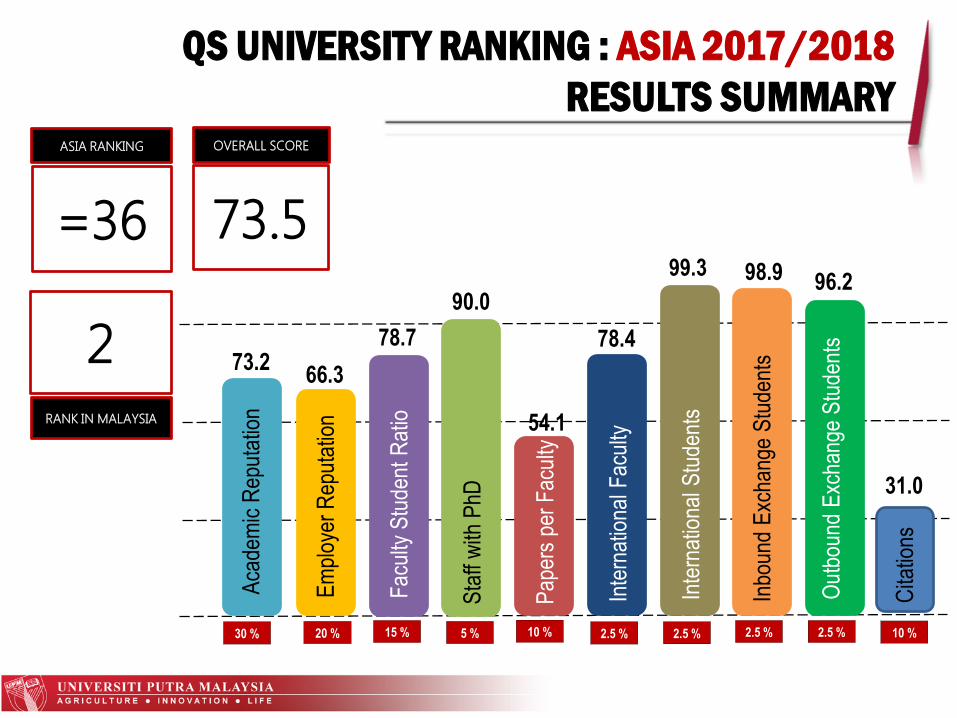
QS UNIVERSITY RANKING : ASIA 2017/2018
RESULTS SUMMARY
73.266.3
78.7
90.0
54.1
78.4
99.3 98.9 96.2
31.0
ASIA RANKING
=36 73.5
OVERALL SCORE
2RANK IN MALAYSIA
30 % 20 % 15 % 5 % 10 % 10 %2.5 % 2.5 % 2.5 % 2.5 %
0
50
100Academic Reputation
Employer Reputation
Faculty Student
Paper per Faculty
Citation per Paper
International Faculty
International Students
Inbound Exchange
Outbound Exchange
Staff with Phd
UPM
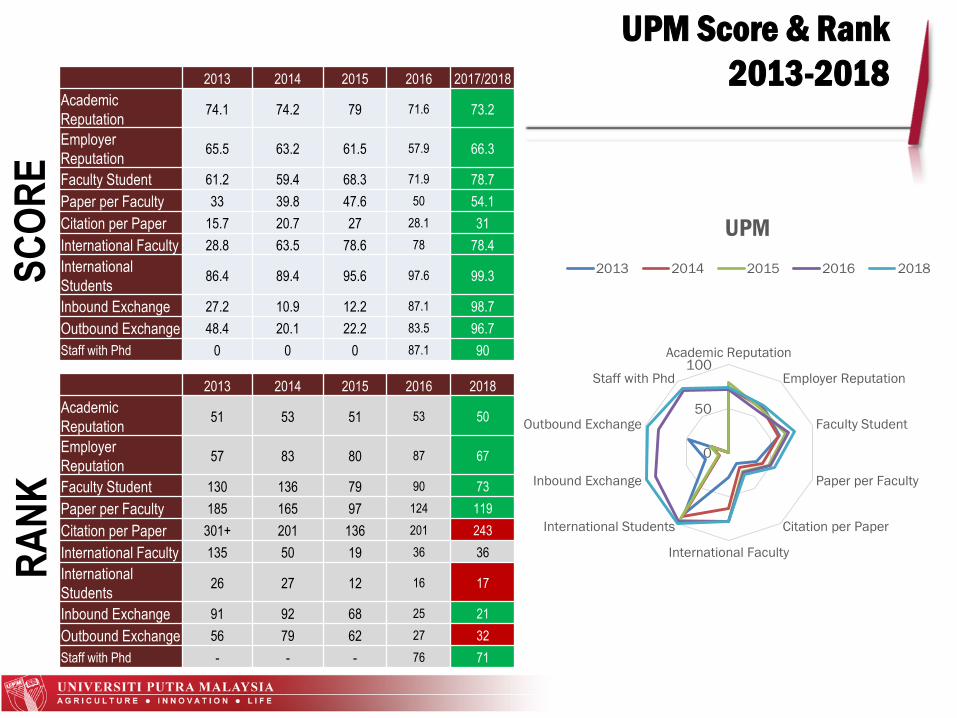
2013 2014 2015 2016 2018
2013 2014 2015 2016 2017/2018
Academic
Reputation74.1 74.2 79 71.6 73.2
Employer
Reputation65.5 63.2 61.5 57.9 66.3
Faculty Student 61.2 59.4 68.3 71.9 78.7
Paper per Faculty 33 39.8 47.6 50 54.1
Citation per Paper 15.7 20.7 27 28.1 31
International Faculty 28.8 63.5 78.6 78 78.4
International
Students86.4 89.4 95.6 97.6 99.3
Inbound Exchange 27.2 10.9 12.2 87.1 98.7
Outbound Exchange 48.4 20.1 22.2 83.5 96.7
Staff with Phd 0 0 0 87.1 90
UPM Score & Rank
2013-2018
2013 2014 2015 2016 2018
Academic
Reputation51 53 51 53 50
Employer
Reputation57 83 80 87 67
Faculty Student 130 136 79 90 73
Paper per Faculty 185 165 97 124 119
Citation per Paper 301+ 201 136 201 243
International Faculty 135 50 19 36 36
International
Students26 27 12 16 17
Inbound Exchange 91 92 68 25 21
Outbound Exchange 56 79 62 27 32
Staff with Phd - - - 76 71
SC
OR
ER
AN
K
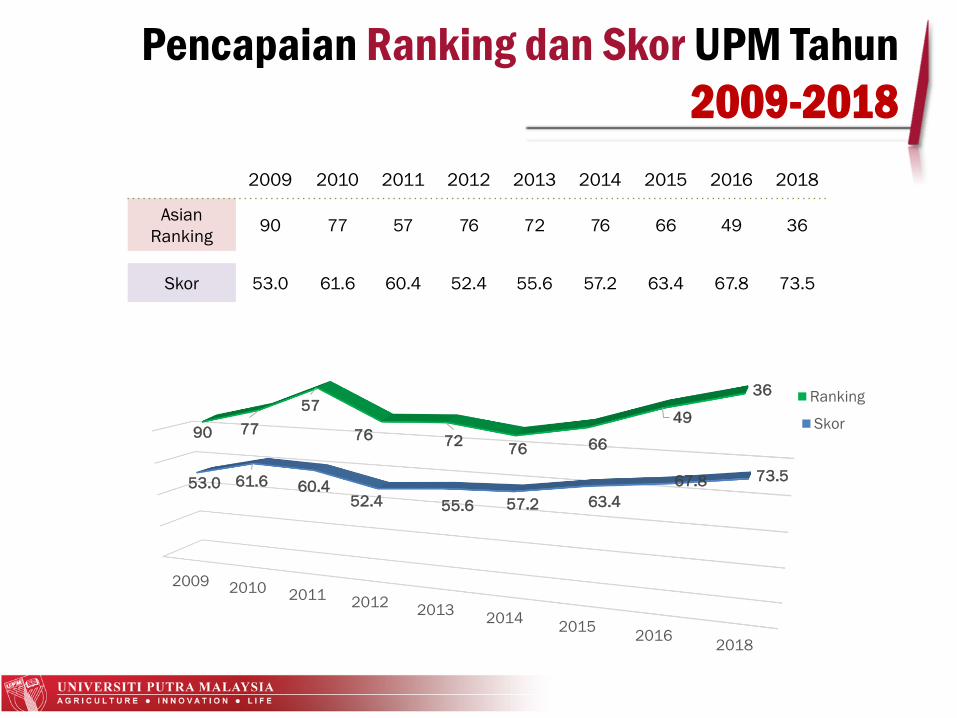
2009 2010 2011 2012 2013 2014 2015 2016 2018
Asian
Ranking90 77 57 76 72 76 66 49 36
Skor 53.0 61.6 60.4 52.4 55.6 57.2 63.4 67.8 73.5
2009 2010 20112012
20132014
20152016
2018
53.0 61.6 60.452.4 55.6 57.2 63.4
67.8 73.5
Skor90 77
57
76 7276 66
49
36 Ranking
Pencapaian Ranking dan Skor UPM Tahun
2009-2018
RU
Aca
de
mic
Re
pu
tati
on
Em
plo
yer
Re
pu
tati
on
Fa
cu
lty
Stu
de
nt
Sta
ff w
ith
Ph
D
Cit
ati
on
s p
er
Pa
pe
r
Inte
rna
tio
na
l Fa
cu
lty
Inte
rna
tio
na
l S
tud
en
ts
Pa
pe
rs p
er
Fa
cu
lty
Inb
ou
nd
Exc
ha
nge
Ou
tbo
un
d E
xch
an
ge
Ove
rall
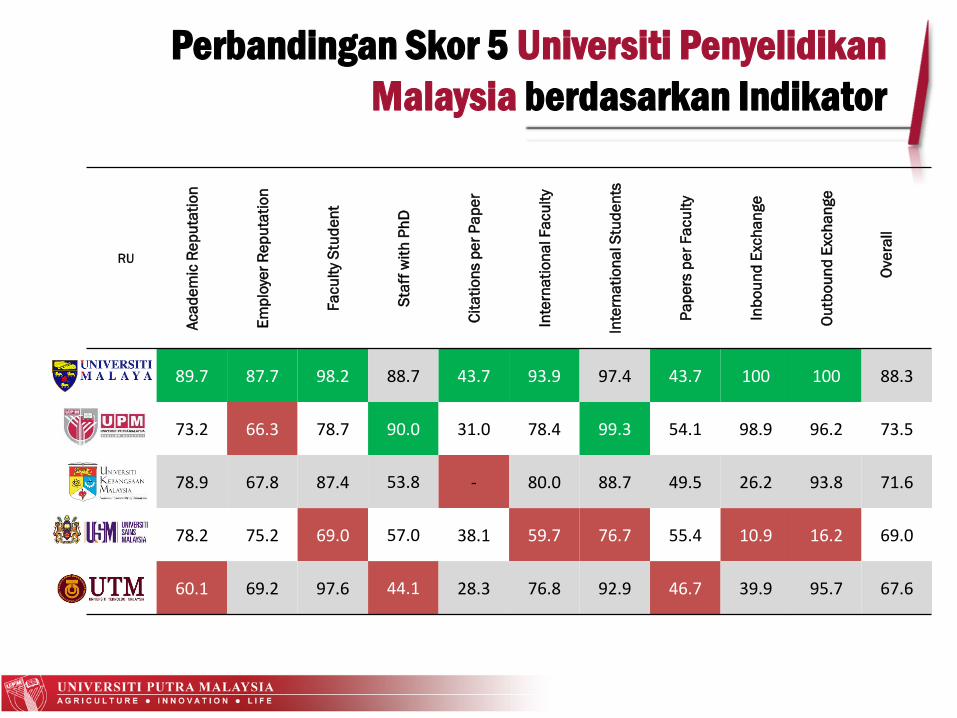
UM 89.7 87.7 98.2 88.7 43.7 93.9 97.4 43.7 100 100 88.3
UPM 73.2 66.3 78.7 90.0 31.0 78.4 99.3 54.1 98.9 96.2 73.5
USM 78.9 67.8 87.4 53.8 - 80.0 88.7 49.5 26.2 93.8 71.6
UKM 78.2 75.2 69.0 57.0 38.1 59.7 76.7 55.4 10.9 16.2 69.0
UTM 60.1 69.2 97.6 44.1 28.3 76.8 92.9 46.7 39.9 95.7 67.6
Perbandingan Skor 5 Universiti Penyelidikan
Malaysia berdasarkan Indikator
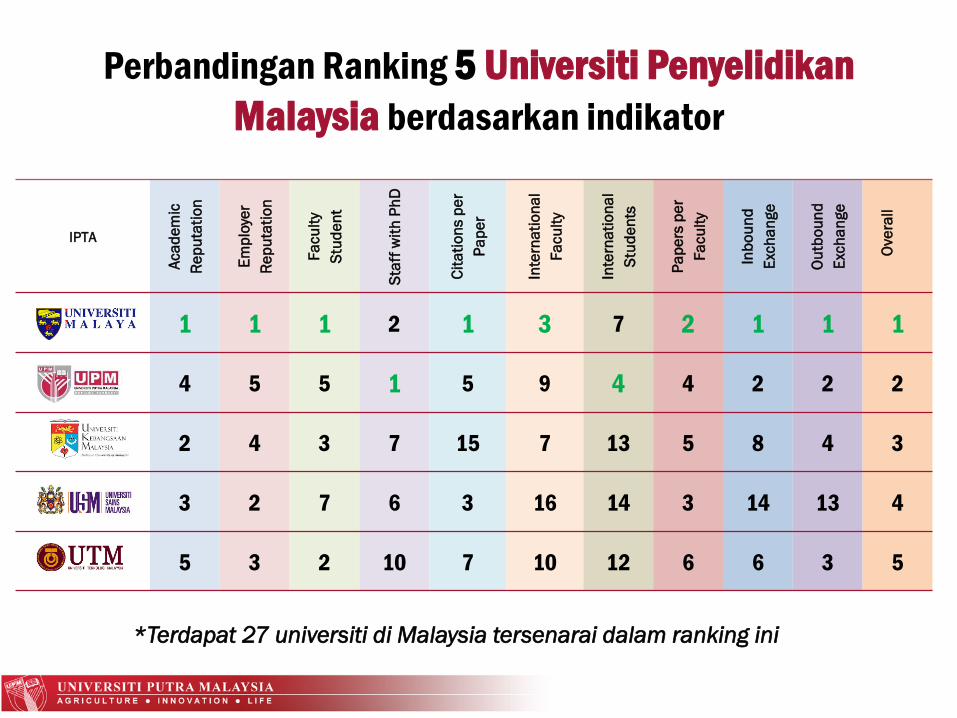
Perbandingan Ranking 5 Universiti Penyelidikan
Malaysia berdasarkan indikator
IPTA
Aca
de
mic
Re
pu
tati
on
Em
plo
yer
Re
pu
tati
on
Fa
cu
lty
Stu
de
nt
Sta
ff w
ith
Ph
D
Cit
ati
on
s p
er
Pa
pe
r
Inte
rna
tio
na
l
Fa
cu
lty
Inte
rna
tio
na
l
Stu
de
nts
Pa
pe
rs p
er
Fa
cu
lty
Inb
ou
nd
Exc
ha
nge
Ou
tbo
un
d
Exc
ha
nge
Ove
rall
1 1 1 2 1 3 7 2 1 1 1
4 5 5 1 5 9 4 4 2 2 2
2 4 3 7 15 7 13 5 8 4 3
3 2 7 6 3 16 14 3 14 13 4
5 3 2 10 7 10 12 6 6 3 5
*Terdapat 27 universiti di Malaysia tersenarai dalam ranking ini
PERBANDINGAN EMPAT UNIVERSITI PENYELIDIKAN
0
20
40
60
80
100
Academic
Reputatio
nEmployer
Reputatio
n
Faculty
Student
Paper per
Faculty
Internatio
nal Faculty
Internatio
nal
Students
Inbound
Exchange
Outbound
Exchange
Citation
per Paper
Staff with
PhD
UM
2014 2015 2016 2018
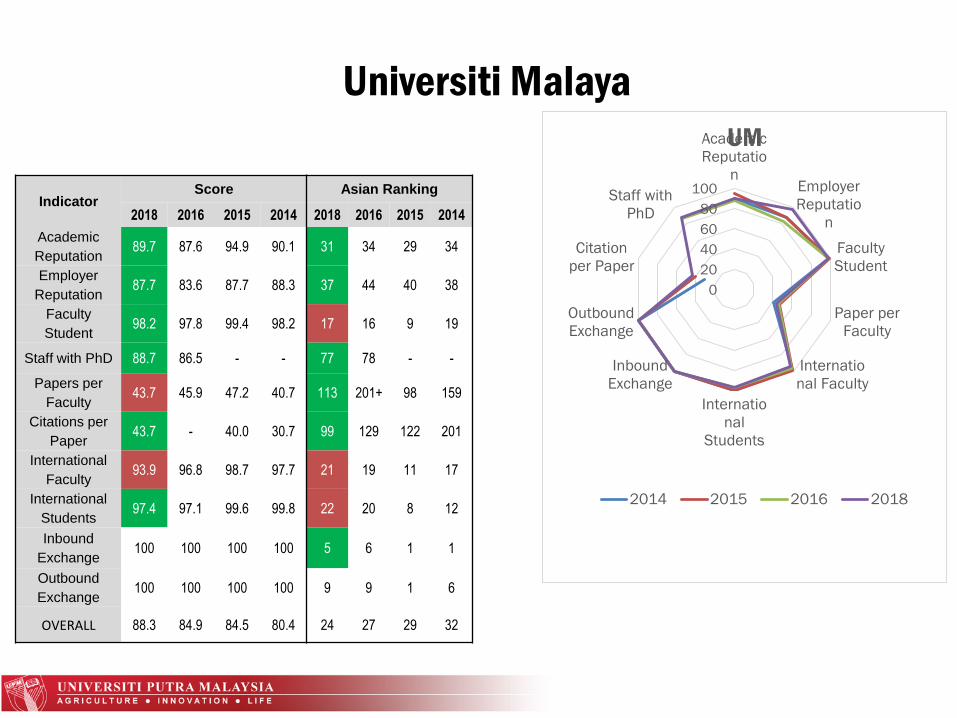
Universiti Malaya
IndicatorScore Asian Ranking
2018 2016 2015 2014 2018 2016 2015 2014
Academic
Reputation89.7 87.6 94.9 90.1 31 34 29 34
Employer
Reputation87.7 83.6 87.7 88.3 37 44 40 38
Faculty
Student98.2 97.8 99.4 98.2 17 16 9 19
Staff with PhD 88.7 86.5 - - 77 78 - -
Papers per
Faculty43.7 45.9 47.2 40.7 113 201+ 98 159
Citations per
Paper43.7 - 40.0 30.7 99 129 122 201
International
Faculty93.9 96.8 98.7 97.7 21 19 11 17
International
Students97.4 97.1 99.6 99.8 22 20 8 12
Inbound
Exchange100 100 100 100 5 6 1 1
Outbound
Exchange100 100 100 100 9 9 1 6
OVERALL 88.3 84.9 84.5 80.4 24 27 29 32
0
20
40
60
80
100
Academic
Reputation
Employer
Reputation
Faculty
Student
Paper per
Faculty
International
Faculty
International
Students
Inbound
Exchange
Outbound
Exchange
Citation per
Paper
Staff with
PhD
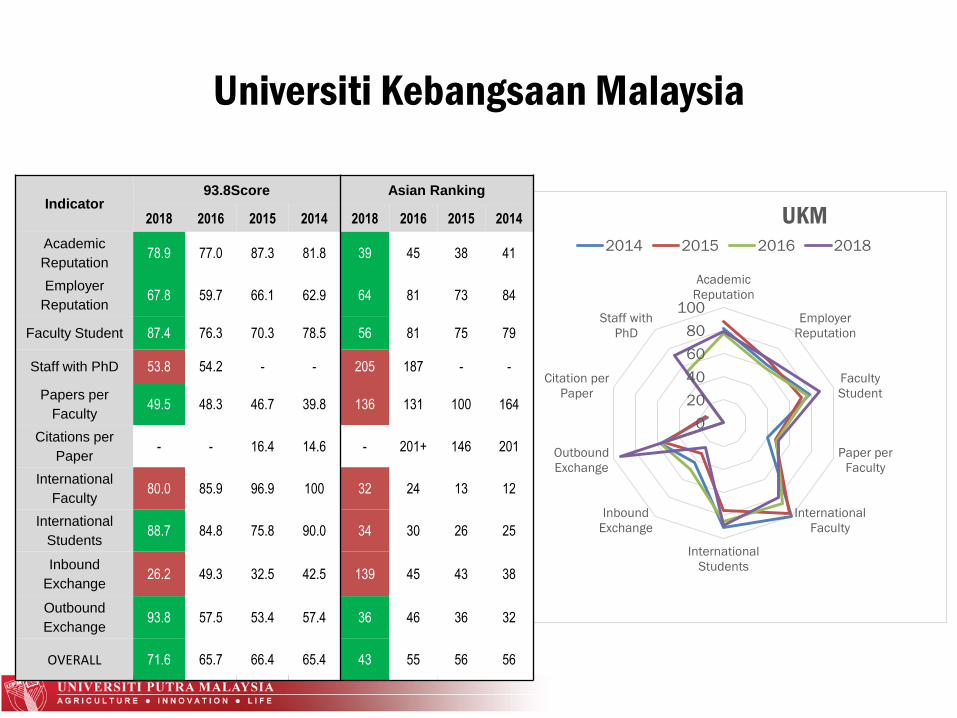
UKM2014 2015 2016 2018
Universiti Kebangsaan Malaysia
Indicator93.8Score Asian Ranking
2018 2016 2015 2014 2018 2016 2015 2014
Academic
Reputation78.9 77.0 87.3 81.8 39 45 38 41
Employer
Reputation67.8 59.7 66.1 62.9 64 81 73 84
Faculty Student 87.4 76.3 70.3 78.5 56 81 75 79
Staff with PhD 53.8 54.2 - - 205 187 - -
Papers per
Faculty49.5 48.3 46.7 39.8 136 131 100 164
Citations per
Paper- - 16.4 14.6 - 201+ 146 201
International
Faculty80.0 85.9 96.9 100 32 24 13 12
International
Students88.7 84.8 75.8 90.0 34 30 26 25
Inbound
Exchange26.2 49.3 32.5 42.5 139 45 43 38
Outbound
Exchange93.8 57.5 53.4 57.4 36 46 36 32
OVERALL 71.6 65.7 66.4 65.4 43 55 56 56
0102030405060708090
Academic
Reputation
Employer
Reputation
Faculty Student
Paper per Faculty
International
Faculty
International
Students
Inbound Exchange
Outbound
Exchange
Citation per Paper
Staff with PhD
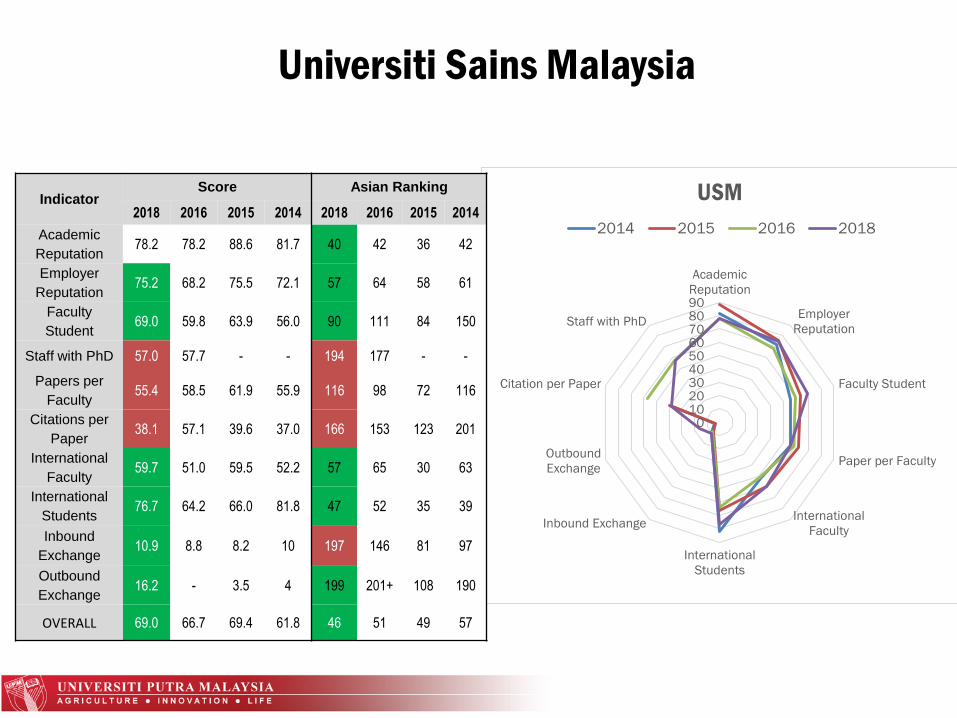
USM
2014 2015 2016 2018
Universiti Sains Malaysia
IndicatorScore Asian Ranking
2018 2016 2015 2014 2018 2016 2015 2014
Academic
Reputation78.2 78.2 88.6 81.7 40 42 36 42
Employer
Reputation75.2 68.2 75.5 72.1 57 64 58 61
Faculty
Student69.0 59.8 63.9 56.0 90 111 84 150
Staff with PhD 57.0 57.7 - - 194 177 - -
Papers per
Faculty55.4 58.5 61.9 55.9 116 98 72 116
Citations per
Paper38.1 57.1 39.6 37.0 166 153 123 201
International
Faculty59.7 51.0 59.5 52.2 57 65 30 63
International
Students76.7 64.2 66.0 81.8 47 52 35 39
Inbound
Exchange10.9 8.8 8.2 10 197 146 81 97
Outbound
Exchange16.2 - 3.5 4 199 201+ 108 190
OVERALL 69.0 66.7 69.4 61.8 46 51 49 57
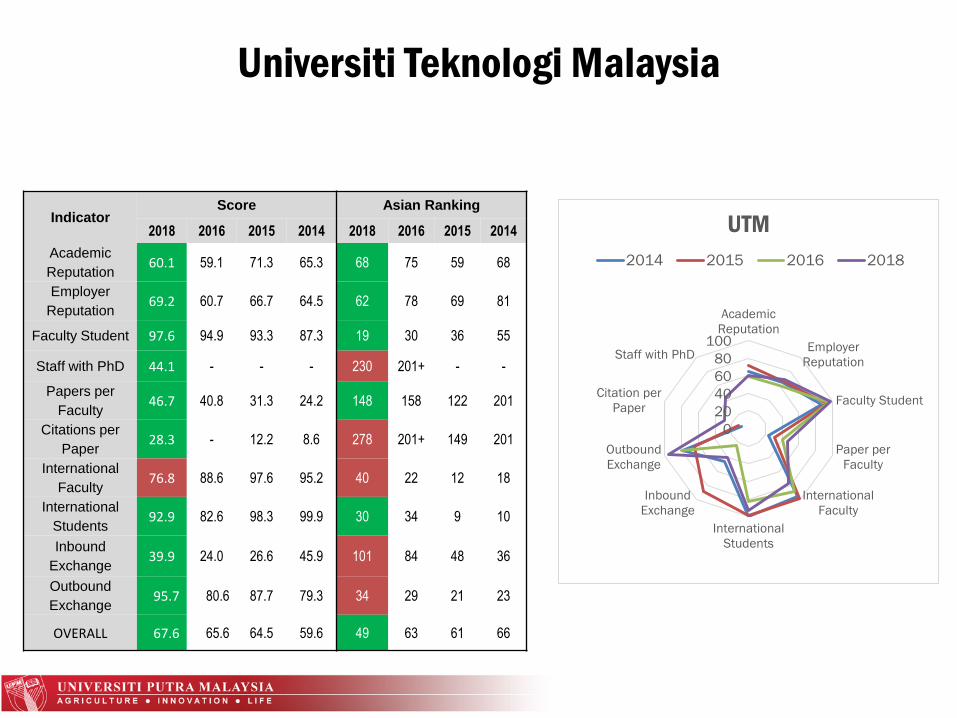
Universiti Teknologi Malaysia
IndicatorScore Asian Ranking
2018 2016 2015 2014 2018 2016 2015 2014
Academic
Reputation60.1 59.1 71.3 65.3 68 75 59 68
Employer
Reputation69.2 60.7 66.7 64.5 62 78 69 81
Faculty Student 97.6 94.9 93.3 87.3 19 30 36 55
Staff with PhD 44.1 - - - 230 201+ - -
Papers per
Faculty46.7 40.8 31.3 24.2 148 158 122 201
Citations per
Paper28.3 - 12.2 8.6 278 201+ 149 201
International
Faculty76.8 88.6 97.6 95.2 40 22 12 18
International
Students92.9 82.6 98.3 99.9 30 34 9 10
Inbound
Exchange39.9 24.0 26.6 45.9 101 84 48 36
Outbound
Exchange95.7 80.6 87.7 79.3 34 29 21 23
OVERALL 67.6 65.6 64.5 59.6 49 63 61 66
0
20
40
60
80
100
Academic
Reputation
Employer
Reputation
Faculty Student
Paper per
Faculty
International
Faculty
International
Students
Inbound
Exchange
Outbound
Exchange
Citation per
Paper
Staff with PhD
UTM
2014 2015 2016 2018
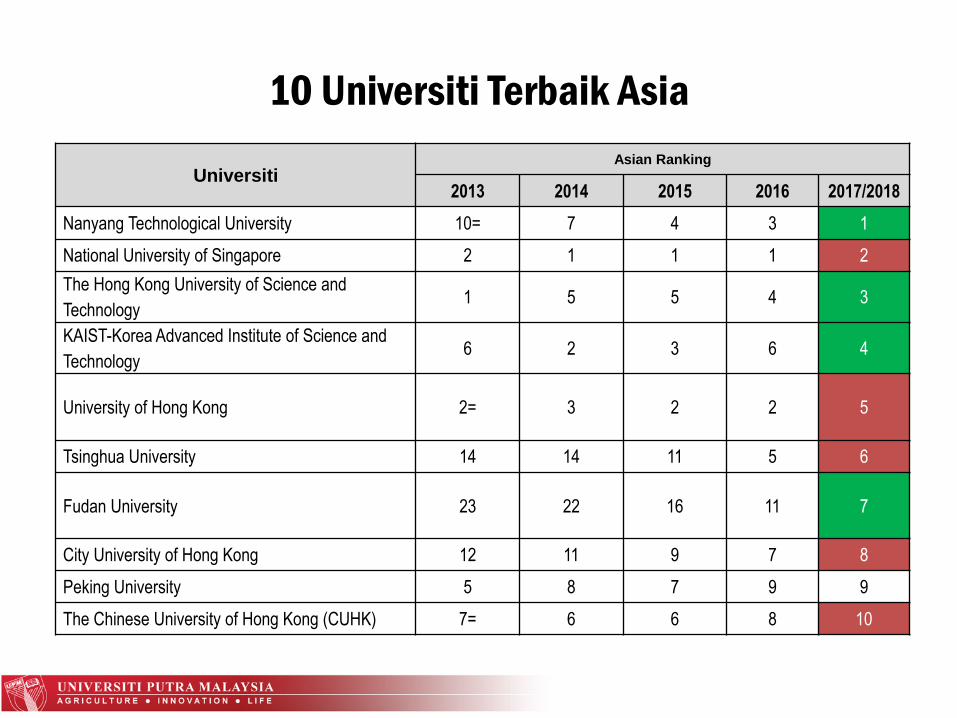
10 Universiti Terbaik Asia
UniversitiAsian Ranking
2013 2014 2015 2016 2017/2018
Nanyang Technological University 10= 7 4 3 1
National University of Singapore 2 1 1 1 2
The Hong Kong University of Science and
Technology1 5 5 4 3
KAIST-Korea Advanced Institute of Science and
Technology6 2 3 6 4
University of Hong Kong 2= 3 2 2 5
Tsinghua University 14 14 11 5 6
Fudan University 23 22 16 11 7
City University of Hong Kong 12 11 9 7 8
Peking University 5 8 7 9 9
The Chinese University of Hong Kong (CUHK) 7= 6 6 8 10
Universiti
Ranking
2013 2014 2015 20162017/201
8
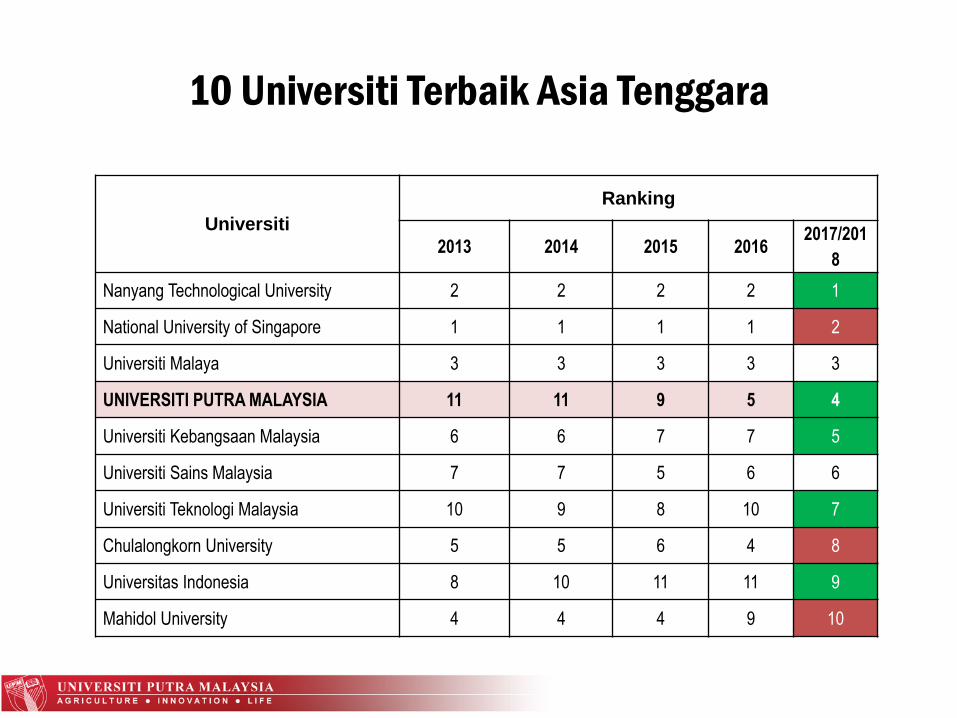
Nanyang Technological University 2 2 2 2 1
National University of Singapore 1 1 1 1 2
Universiti Malaya 3 3 3 3 3
UNIVERSITI PUTRA MALAYSIA 11 11 9 5 4
Universiti Kebangsaan Malaysia 6 6 7 7 5
Universiti Sains Malaysia 7 7 5 6 6
Universiti Teknologi Malaysia 10 9 8 10 7
Chulalongkorn University 5 5 6 4 8
Universitas Indonesia 8 10 11 11 9
Mahidol University 4 4 4 9 10
10 Universiti Terbaik Asia Tenggara
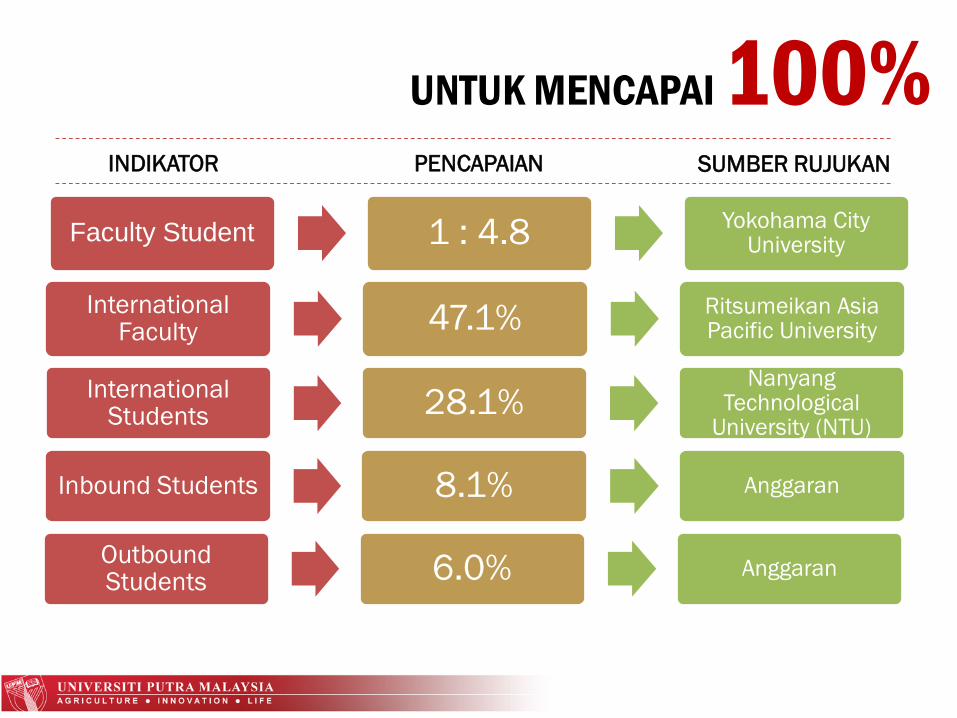
UNTUK MENCAPAI 100%
Faculty Student 1 : 4.8 Yokohama City University
International Faculty 47.1% Ritsumeikan Asia
Pacific University
International Students 28.1%
Nanyang Technological
University (NTU)
INDIKATOR PENCAPAIAN SUMBER RUJUKAN
Inbound Students 8.1% Anggaran
Outbound Students 6.0% Anggaran
LAPORAN PENCAPAIAN
QS WORLD UNIVERSITY RANKINGS 2018
Pejabat Strategi Korporat & Komunikasi
Universiti Putra Malaysia
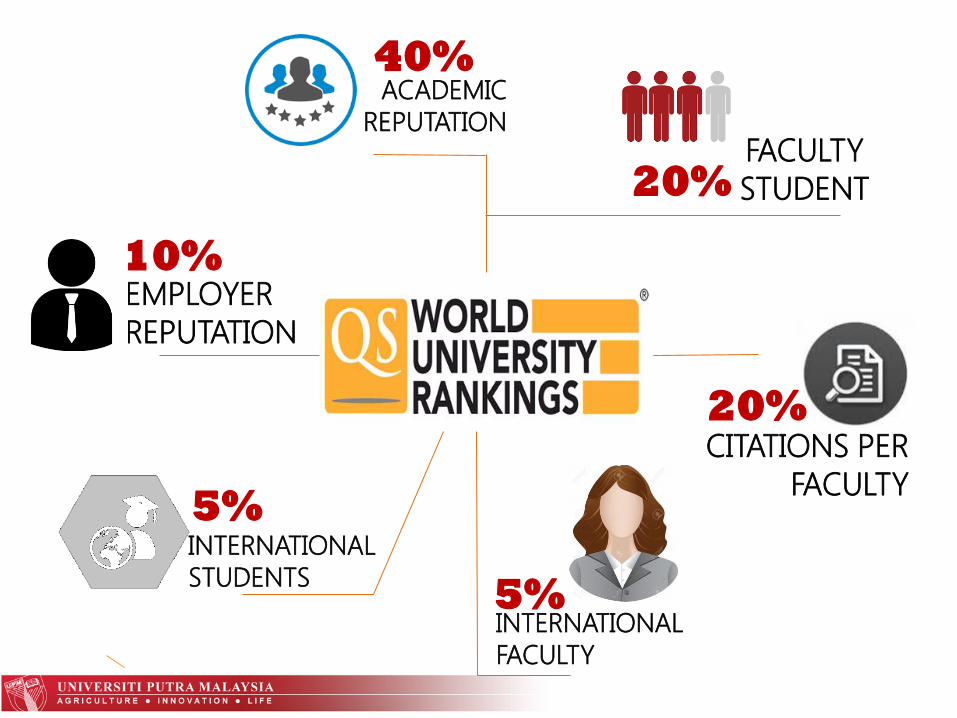
ACADEMIC
REPUTATION
40%
EMPLOYER
REPUTATION
10%
FACULTY
STUDENT
20%CITATIONS PER
FACULTY
20%
INTERNATIONAL
FACULTY
5%
INTERNATIONAL
STUDENTS
5%
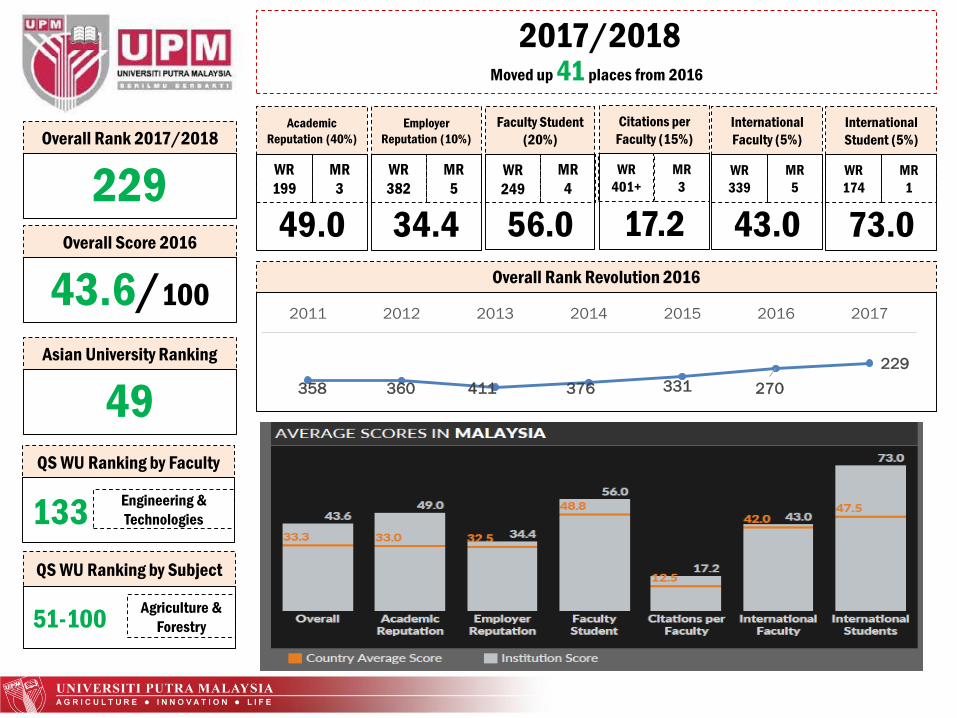
2017/2018Moved up 41 places from 2016
358 360 411 376 331 270
229
2011 2012 2013 2014 2015 2016 2017
Overall Rank Revolution 2016
Overall Score 2016
43.6/100
Overall Rank 2017/2018
229
QS WU Ranking by Subject
51-100Agriculture &
Forestry
QS WU Ranking by Faculty
133Engineering &
Technologies
Asian University Ranking
49
Academic
Reputation (40%)
49.0
MR
3
WR
199
Employer
Reputation (10%)
34.4
MR
5
WR
382
MR
4
Faculty Student
(20%)
56.0
WR
249
Citations per
Faculty (15%)
17.2
MR
3
WR
401+
International
Faculty (5%)
43.0
MR
5
WR
339
International
Student (5%)
73.0
MR
1
WR
174
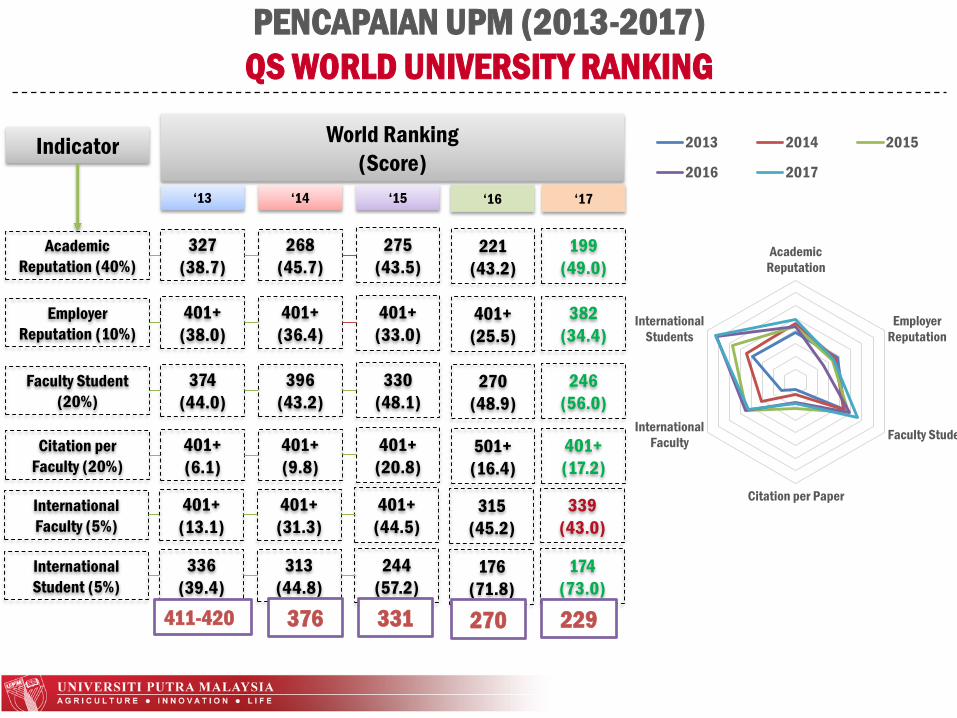
PENCAPAIAN UPM (2013-2017)
QS WORLD UNIVERSITY RANKING
Academic
Reputation
Employer
Reputation
Faculty Student
Citation per Paper
International
Faculty
International
Students
2013 2014 2015
2016 2017
Indicator
Academic
Reputation (40%)
Employer
Reputation (10%)
Faculty Student
(20%)
Citation per
Faculty (20%)
International
Faculty (5%)
International
Student (5%)
World Ranking
(Score)
‘13 ‘14 ‘15
327
(38.7)
268
(45.7)
275
(43.5)
401+
(38.0)
401+
(36.4)
401+
(33.0)
374
(44.0)
396
(43.2)
330
(48.1)
401+
(6.1)
401+
(9.8)
401+
(20.8)
401+
(13.1)
401+
(31.3)
401+
(44.5)
336
(39.4)
313
(44.8)
244
(57.2)
411-420 376 331
221
(43.2)
401+
(25.5)
270
(48.9)
501+
(16.4)
315
(45.2)
176
(71.8)
270
199
(49.0)
382
(34.4)
246
(56.0)
401+
(17.2)
339
(43.0)
174
(73.0)
229
‘16 ‘17
Indicator
Score World Ranking Rank in Malaysia
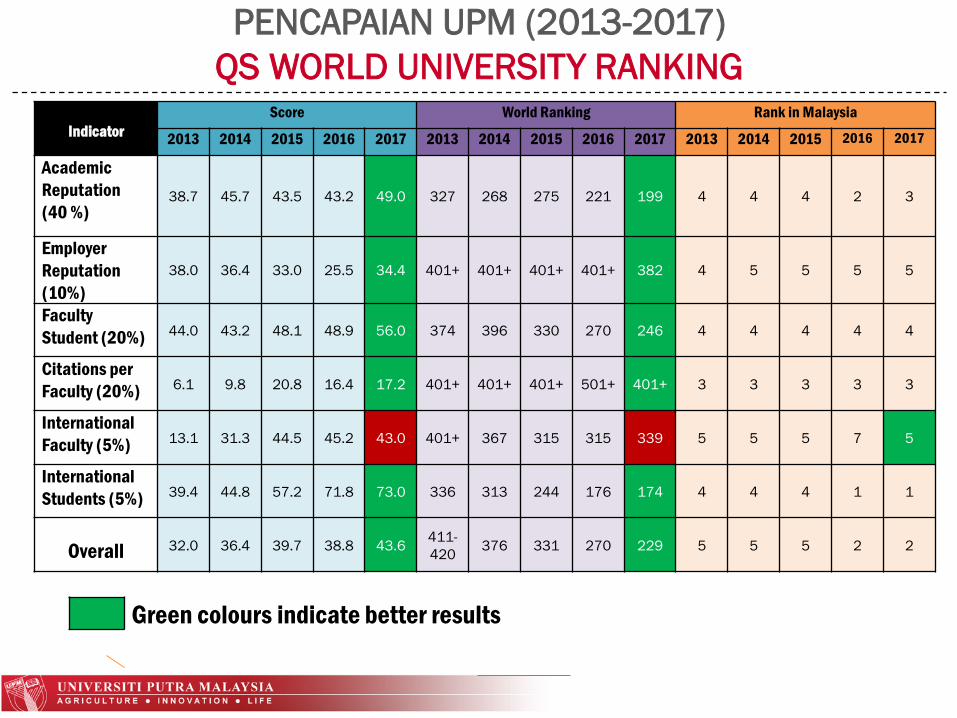
2013 2014 2015 2016 2017 2013 2014 2015 2016 2017 2013 2014 2015 2016 2017
Academic
Reputation
(40 %)38.7 45.7 43.5 43.2 49.0 327 268 275 221 199 4 4 4 2 3
Employer
Reputation
(10%)
38.0 36.4 33.0 25.5 34.4 401+ 401+ 401+ 401+ 382 4 5 5 5 5
Faculty
Student (20%) 44.0 43.2 48.1 48.9 56.0 374 396 330 270 246 4 4 4 4 4
Citations per
Faculty (20%) 6.1 9.8 20.8 16.4 17.2 401+ 401+ 401+ 501+ 401+ 3 3 3 3 3
International
Faculty (5%) 13.1 31.3 44.5 45.2 43.0 401+ 367 315 315 339 5 5 5 7 5
International
Students (5%) 39.4 44.8 57.2 71.8 73.0 336 313 244 176 174 4 4 4 1 1
Overall 32.0 36.4 39.7 38.8 43.6411-
420376 331 270 229 5 5 5 2 2
Green colours indicate better results
PENCAPAIAN UPM (2013-2017)
QS WORLD UNIVERSITY RANKING
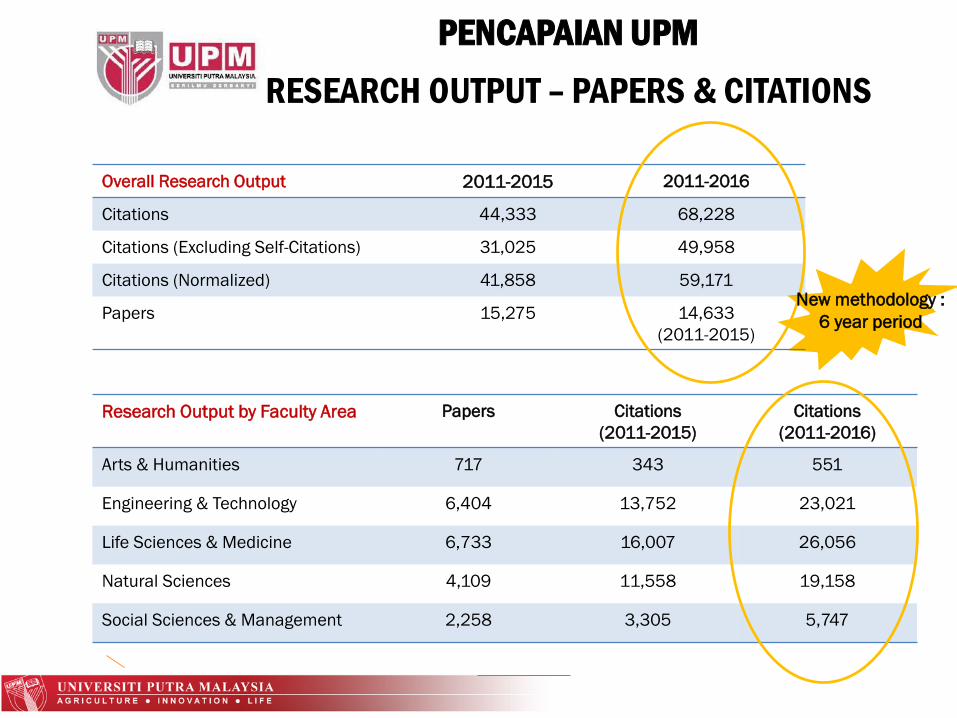
PENCAPAIAN UPM
RESEARCH OUTPUT – PAPERS & CITATIONS
Overall Research Output 2011-2015 2011-2016
Citations 44,333 68,228
Citations (Excluding Self-Citations) 31,025 49,958
Citations (Normalized) 41,858 59,171
Papers 15,275 14,633
(2011-2015)
Research Output by Faculty Area Papers Citations
(2011-2015)
Citations
(2011-2016)
Arts & Humanities 717 343 551
Engineering & Technology 6,404 13,752 23,021
Life Sciences & Medicine 6,733 16,007 26,056
Natural Sciences 4,109 11,558 19,158
Social Sciences & Management 2,258 3,305 5,747
New methodology :
6 year period
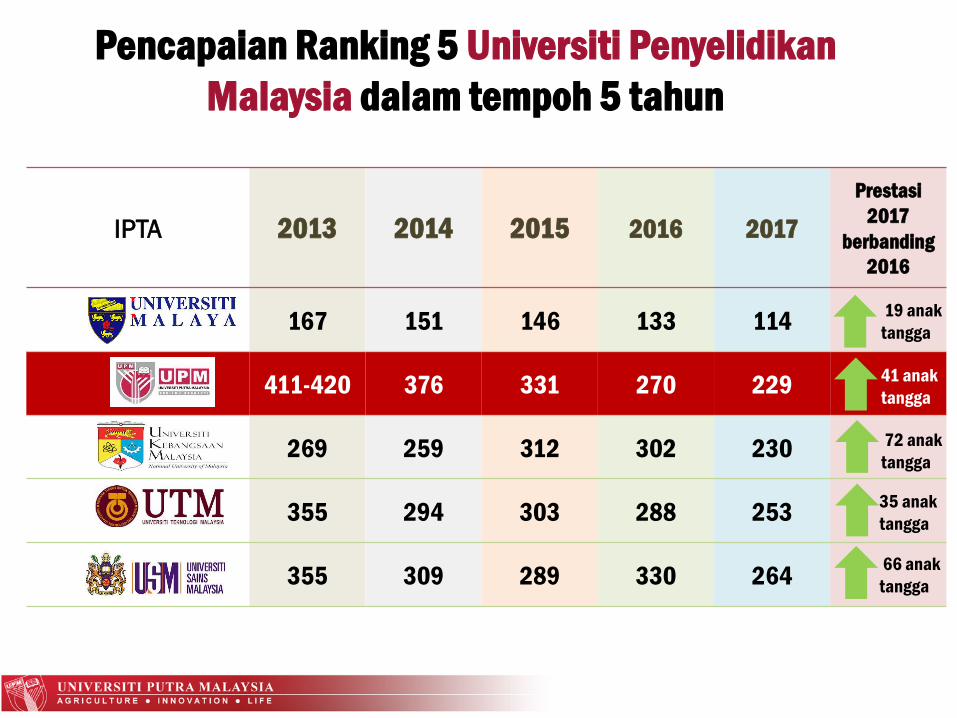
IPTA 2013 2014 2015 2016 2017
Prestasi
2017
berbanding
2016
167 151 146 133 114
411-420 376 331 270 229
269 259 312 302 230
355 294 303 288 253
355 309 289 330 264
19 anak
tangga
41 anak
tangga
66 anak
tangga
72 anak
tangga
35 anak
tangga
Pencapaian Ranking 5 Universiti Penyelidikan
Malaysia dalam tempoh 5 tahun
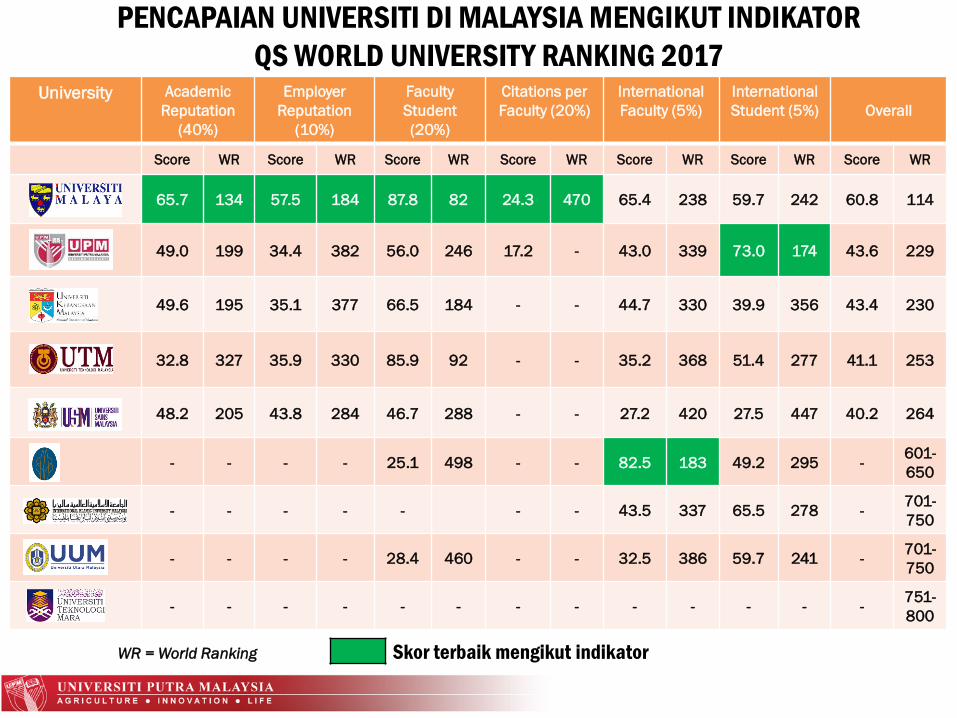
University Academic
Reputation
(40%)
Employer
Reputation
(10%)
Faculty
Student
(20%)
Citations per
Faculty (20%)
International
Faculty (5%)
International
Student (5%) Overall
Score WR Score WR Score WR Score WR Score WR Score WR Score WR
65.7 134 57.5 184 87.8 82 24.3 470 65.4 238 59.7 242 60.8 114
49.0 199 34.4 382 56.0 246 17.2 - 43.0 339 73.0 174 43.6 229
49.6 195 35.1 377 66.5 184 - - 44.7 330 39.9 356 43.4 230
32.8 327 35.9 330 85.9 92 - - 35.2 368 51.4 277 41.1 253
48.2 205 43.8 284 46.7 288 - - 27.2 420 27.5 447 40.2 264
- - - - 25.1 498 - - 82.5 183 49.2 295 -601-
650
- - - - - - - 43.5 337 65.5 278 -701-
750
- - - - 28.4 460 - - 32.5 386 59.7 241 -701-
750
- - - - - - - - - - - - -751-
800
PENCAPAIAN UNIVERSITI DI MALAYSIA MENGIKUT INDIKATOR
QS WORLD UNIVERSITY RANKING 2017
WR = World Ranking Skor terbaik mengikut indikator
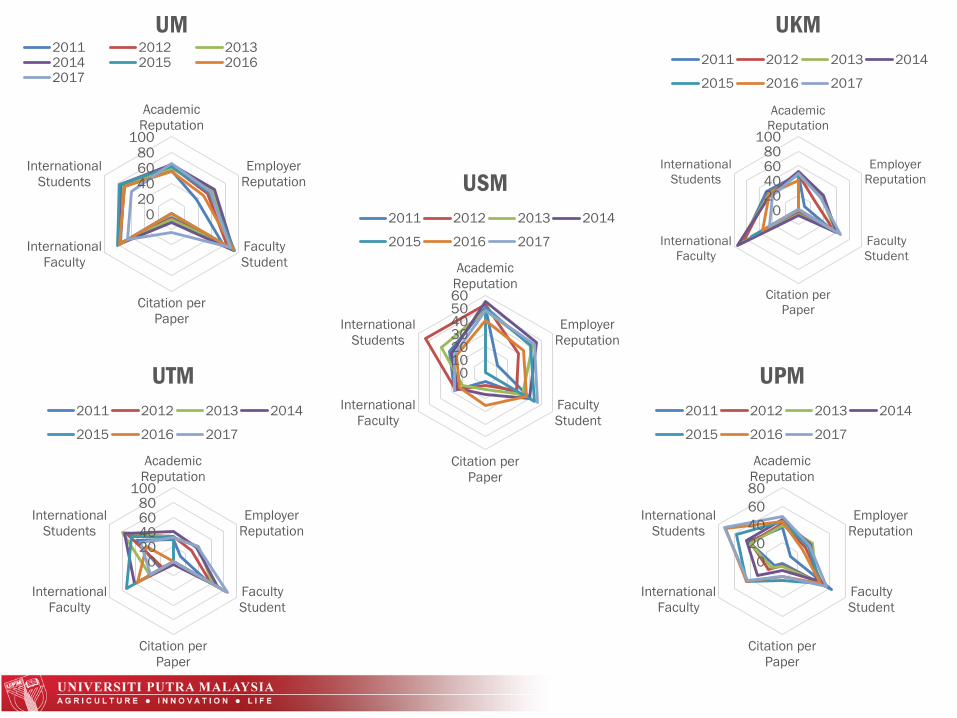
020406080
100
Academic
Reputation
Employer
Reputation
Faculty
Student
Citation per
Paper
International
Faculty
International
Students
UM2011 2012 20132014 2015 20162017
0102030405060
Academic
Reputation
Employer
Reputation
Faculty
Student
Citation per
Paper
International
Faculty
International
Students
USM
2011 2012 2013 2014
2015 2016 2017
020406080
100
Academic
Reputation
Employer
Reputation
Faculty
Student
Citation per
Paper
International
Faculty
International
Students
UTM
2011 2012 2013 2014
2015 2016 2017
020406080
100
Academic
Reputation
Employer
Reputation
Faculty
Student
Citation per
Paper
International
Faculty
International
Students
UKM
2011 2012 2013 2014
2015 2016 2017
0
20
40
60
80
Academic
Reputation
Employer
Reputation
Faculty
Student
Citation per
Paper
International
Faculty
International
Students
UPM
2011 2012 2013 2014
2015 2016 2017
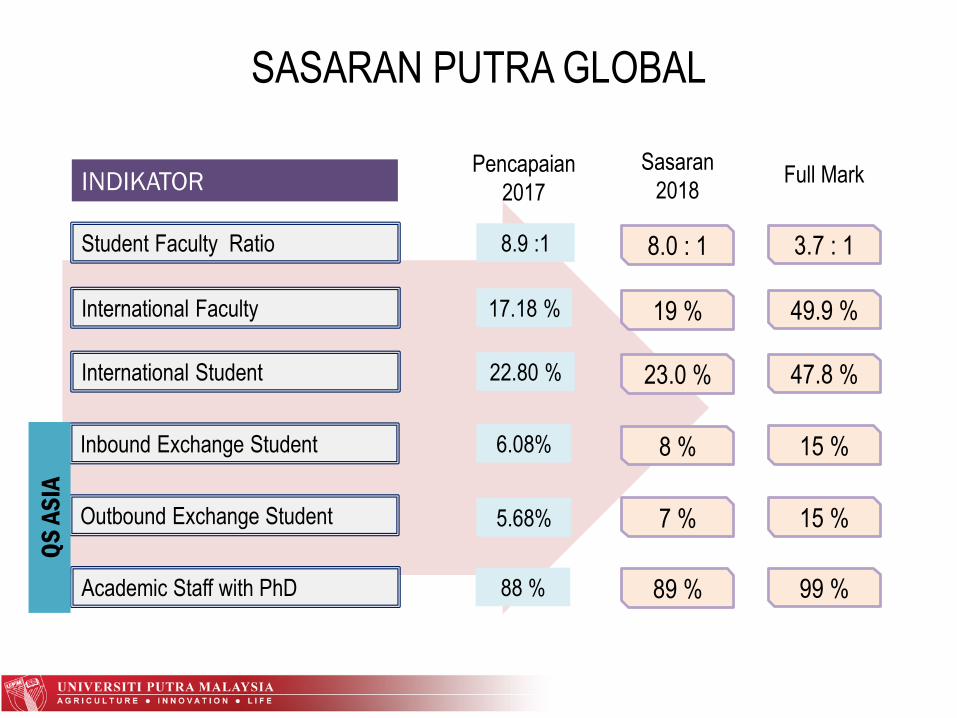
SASARAN PUTRA GLOBAL
International Student
Student Faculty Ratio
International Faculty
Inbound Exchange Student
Outbound Exchange Student
22.80 %
8.9 :1
17.18 %
6.08%
5.68%
8.0 : 1
19 %
23.0 %
8 %
7 %
Academic Staff with PhD 88 % 89 %
INDIKATORPencapaian
2017
Sasaran
2018
3.7 : 1
49.9 %
47.8 %
15 %
15 %
99 %
Full Mark
QS
AS
IA
UPM ACHIEVEMENT OF
QS WORLD UNIVERSITY RANKING BY
SUBJECTS, 2017
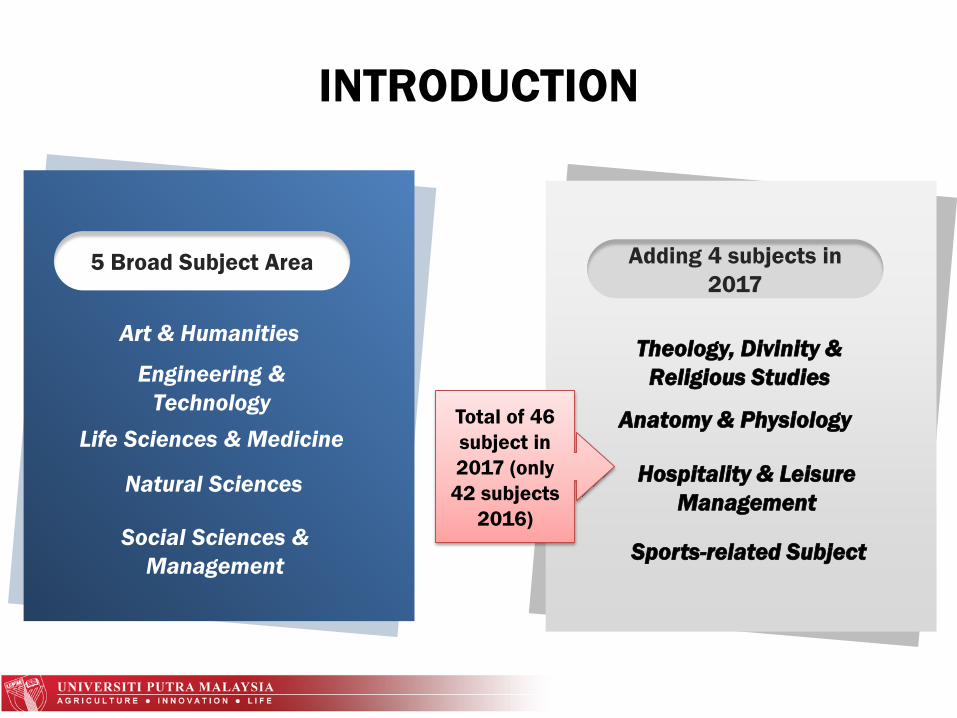
INTRODUCTION
Art & Humanities
5 Broad Subject Area
Engineering &
Technology
Life Sciences & Medicine
Natural Sciences
Social Sciences &
Management
Adding 4 subjects in
2017
Theology, Divinity &
Religious Studies
Anatomy & Physiology
Hospitality & Leisure
Management
Sports-related Subject
Total of 46
subject in
2017 (only
42 subjects
2016)
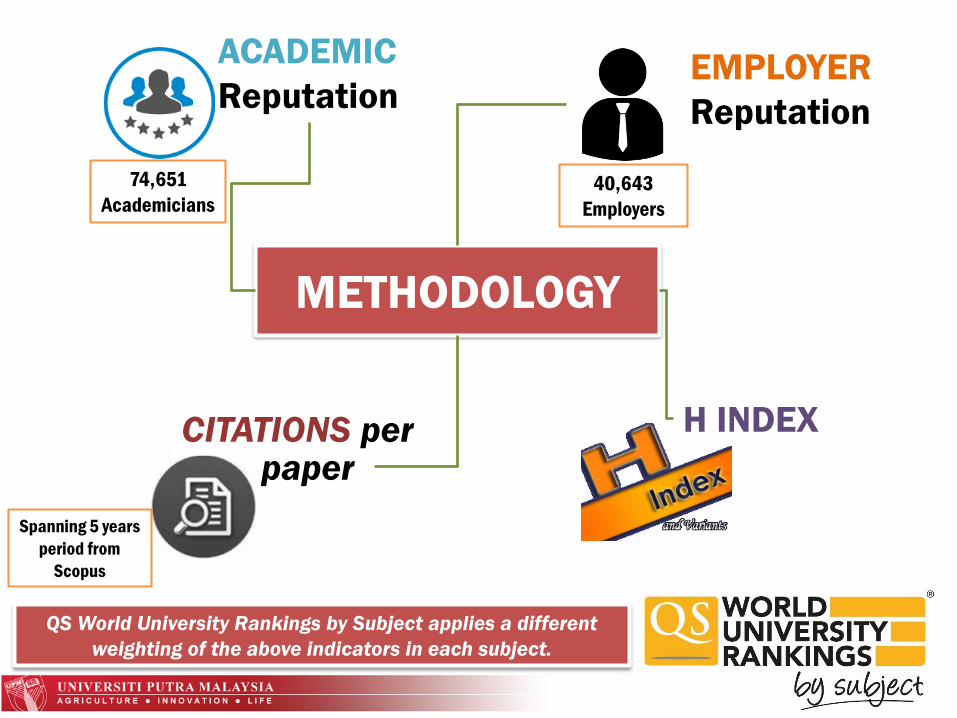
METHODOLOGY
ACADEMIC
ReputationEMPLOYER
Reputation
CITATIONS per H INDEX
paper
QS World University Rankings by Subject applies a different
weighting of the above indicators in each subject.
74,651
Academicians40,643
Employers
Spanning 5 years
period from
Scopus
UPM ACHIEVEMENT
TOP 400 subjects in the World
2017
TO
P 1
00 Agriculture & Forestry
Engineering – Chemical
Engineering – Mechanical, Aeronautical & Manufacturing
English Language and LiteratureArchitecture / Built Environment
Engineering – Electrical & Electronics
Computer Science & Information System
Engineering – Civil & Structural Education
Environmental Sciences Pharmacy & Pharmacology
Modern LanguagesMaterials Science
Accounting & Finance Business & Management Studies
Chemistry
IMPROVE
DROP
Index:
REMAIN
13
3
7
DETAILS OF SUBJECTS RANKING 2017
23has been Rank
Only
46 Subjects
TO
P 1
50
TO
P 2
00
TO
P 2
50
Linguistic
Mathematics
TO
P 3
00
TO
P 4
00Biological Sciences
Medicine
Economics & Econometrics
Sociology
Physics & Astranomy
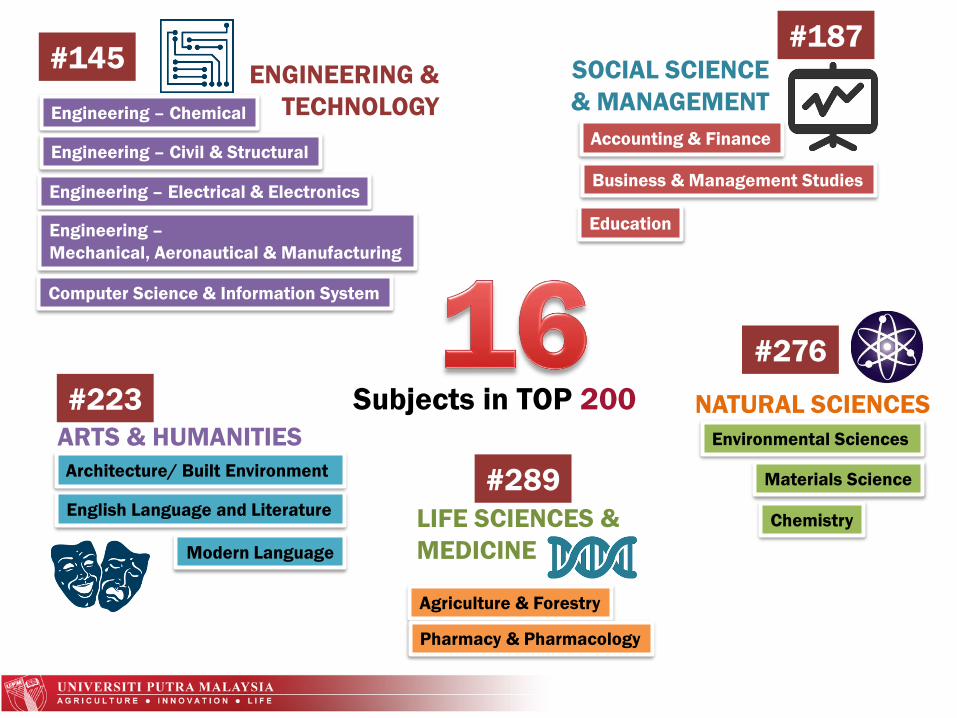
Subjects in TOP 200
ARTS & HUMANITIES
English Language and Literature
Modern Language
ENGINEERING &
TECHNOLOGYEngineering – Chemical
Engineering – Electrical & Electronics
Engineering –
Mechanical, Aeronautical & Manufacturing
Engineering – Civil & Structural
SOCIAL SCIENCE
& MANAGEMENT
Accounting & Finance
Education
Business & Management Studies
NATURAL SCIENCES
Environmental Sciences
Materials Science
LIFE SCIENCES &
MEDICINE
Agriculture & Forestry
Pharmacy & Pharmacology
Architecture/ Built Environment
Computer Science & Information System
Chemistry
#145
#223
#187
#276
#289
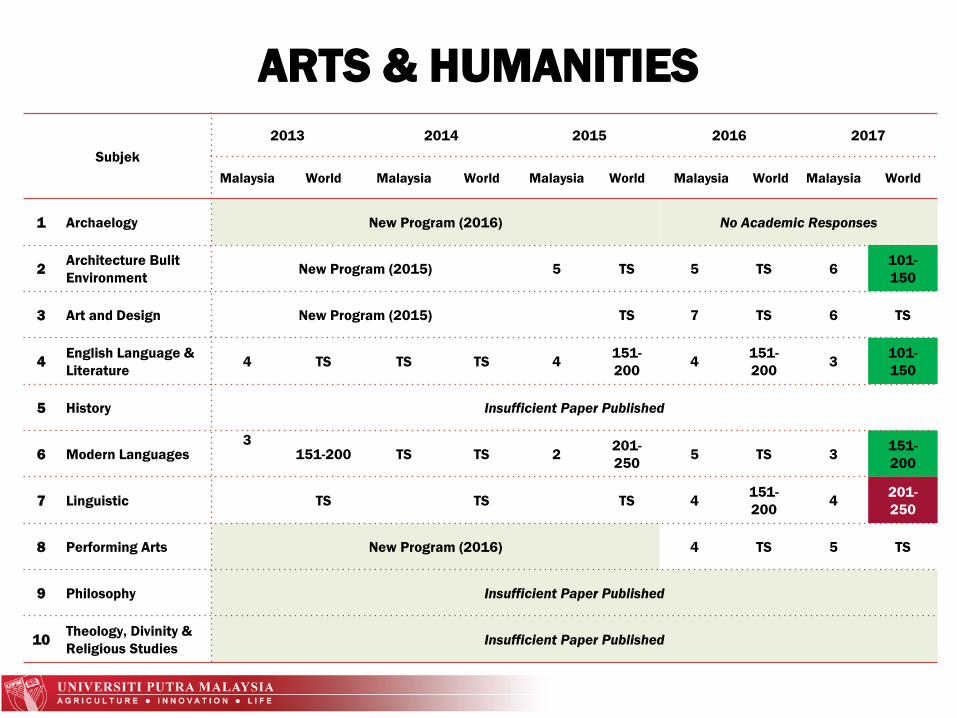
ARTS & HUMANITIES
Subjek
2013 2014 2015 2016 2017
Malaysia World Malaysia World Malaysia World Malaysia World Malaysia World
1 Archaelogy New Program (2016) No Academic Responses
2Architecture Bulit
EnvironmentNew Program (2015) 5 TS 5 TS 6
101-
150
3 Art and Design New Program (2015) TS 7 TS 6 TS
4English Language &
Literature4 TS TS TS 4
151-
2004
151-
2003
101-
150
5 History Insufficient Paper Published
6 Modern Languages3
151-200 TS TS 2201-
2505 TS 3
151-
200
7 Linguistic TS TS TS 4151-
2004
201-
250
8 Performing Arts New Program (2016) 4 TS 5 TS
9 Philosophy Insufficient Paper Published
10Theology, Divinity &
Religious StudiesInsufficient Paper Published
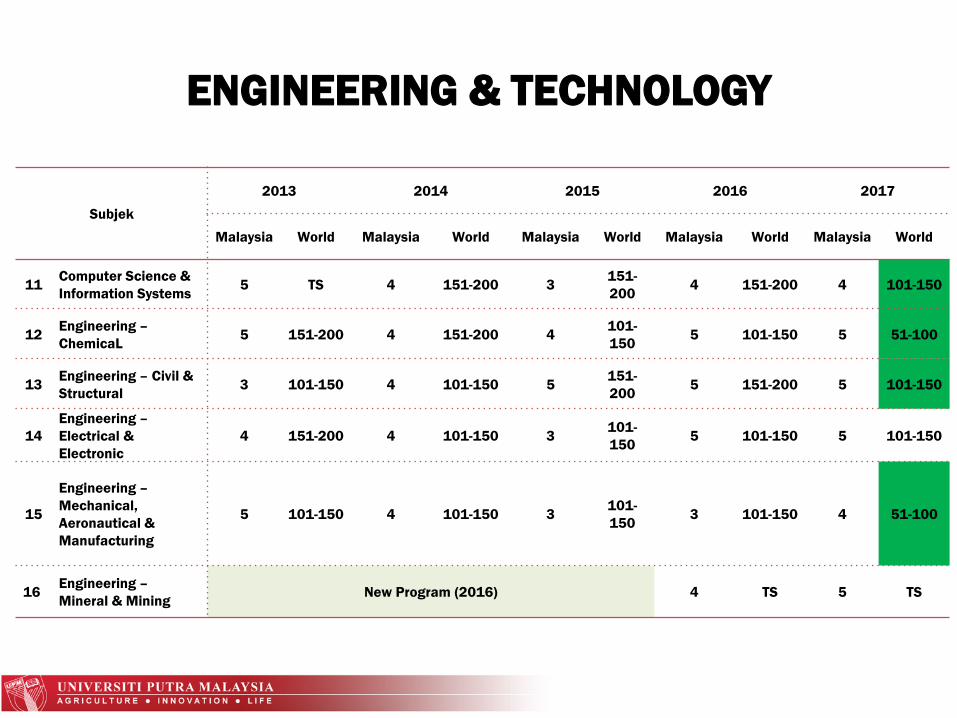
ENGINEERING & TECHNOLOGY
Subjek
2013 2014 2015 2016 2017
Malaysia World Malaysia World Malaysia World Malaysia World Malaysia World
11Computer Science &
Information Systems5 TS 4 151-200 3
151-
2004 151-200 4 101-150
12Engineering –
ChemicaL5 151-200 4 151-200 4
101-
1505 101-150 5 51-100
13Engineering – Civil &
Structural3 101-150 4 101-150 5
151-
2005 151-200 5 101-150
14
Engineering –
Electrical &
Electronic
4 151-200 4 101-150 3101-
1505 101-150 5 101-150
15
Engineering –
Mechanical,
Aeronautical &
Manufacturing
5 101-150 4 101-150 3101-
1503 101-150 4 51-100
16Engineering –
Mineral & MiningNew Program (2016) 4 TS 5 TS
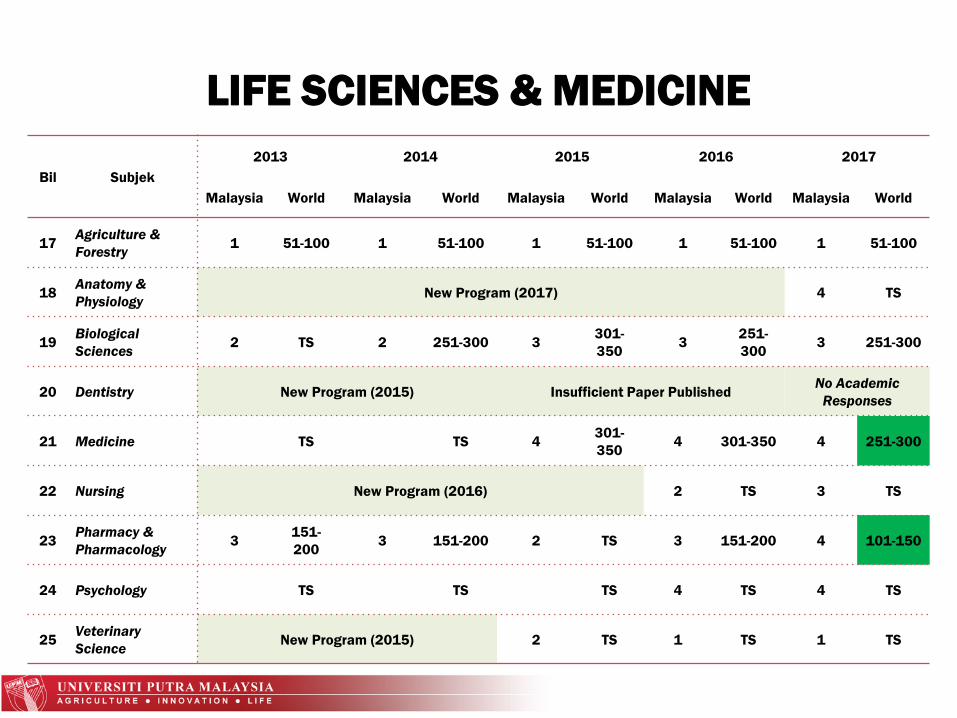
LIFE SCIENCES & MEDICINE
Bil Subjek
2013 2014 2015 2016 2017
Malaysia World Malaysia World Malaysia World Malaysia World Malaysia World
17Agriculture &
Forestry1 51-100 1 51-100 1 51-100 1 51-100 1 51-100
18Anatomy &
PhysiologyNew Program (2017) 4 TS
19Biological
Sciences2 TS 2 251-300 3
301-
3503
251-
3003 251-300
20 Dentistry New Program (2015) Insufficient Paper PublishedNo Academic
Responses
21 Medicine TS TS 4301-
3504 301-350 4 251-300
22 Nursing New Program (2016) 2 TS 3 TS
23Pharmacy &
Pharmacology3
151-
2003 151-200 2 TS 3 151-200 4 101-150
24 Psychology TS TS TS 4 TS 4 TS
25Veterinary
ScienceNew Program (2015) 2 TS 1 TS 1 TS
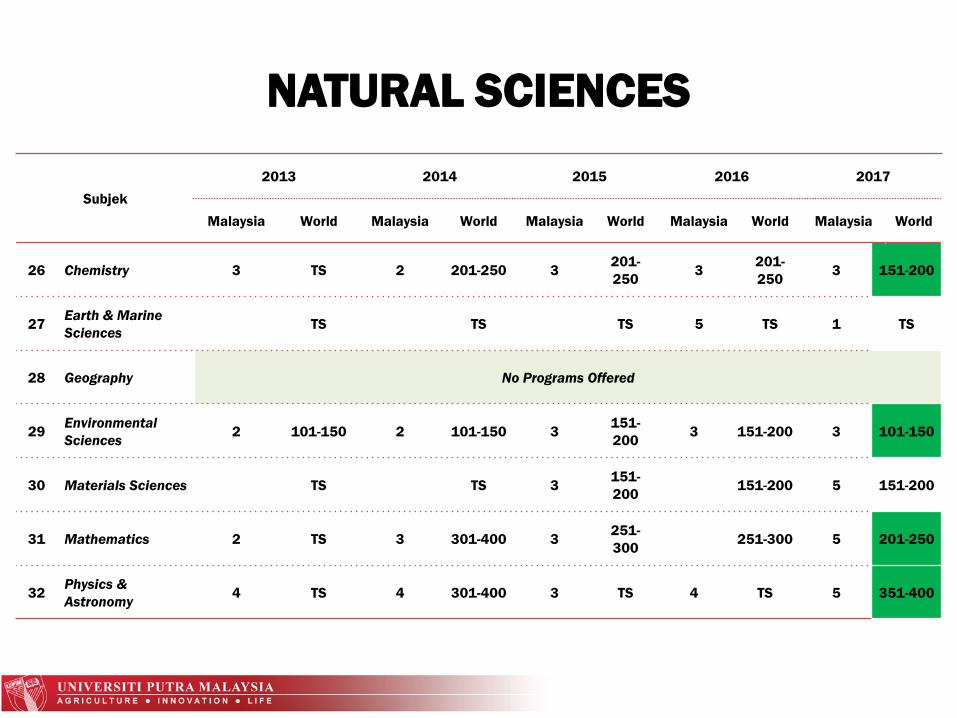
NATURAL SCIENCES
Subjek
2013 2014 2015 2016 2017
Malaysia World Malaysia World Malaysia World Malaysia World Malaysia World
26 Chemistry 3 TS 2 201-250 3201-
2503
201-
2503 151-200
27Earth & Marine
SciencesTS TS TS 5 TS 1 TS
28 Geography No Programs Offered
29Environmental
Sciences2 101-150 2 101-150 3
151-
2003 151-200 3 101-150
30 Materials Sciences TS TS 3151-
2004 151-200 5 151-200
31 Mathematics 2 TS 3 301-400 3251-
3004 251-300 5 201-250
32Physics &
Astronomy4 TS 4 301-400 3 TS 4 TS 5 351-400
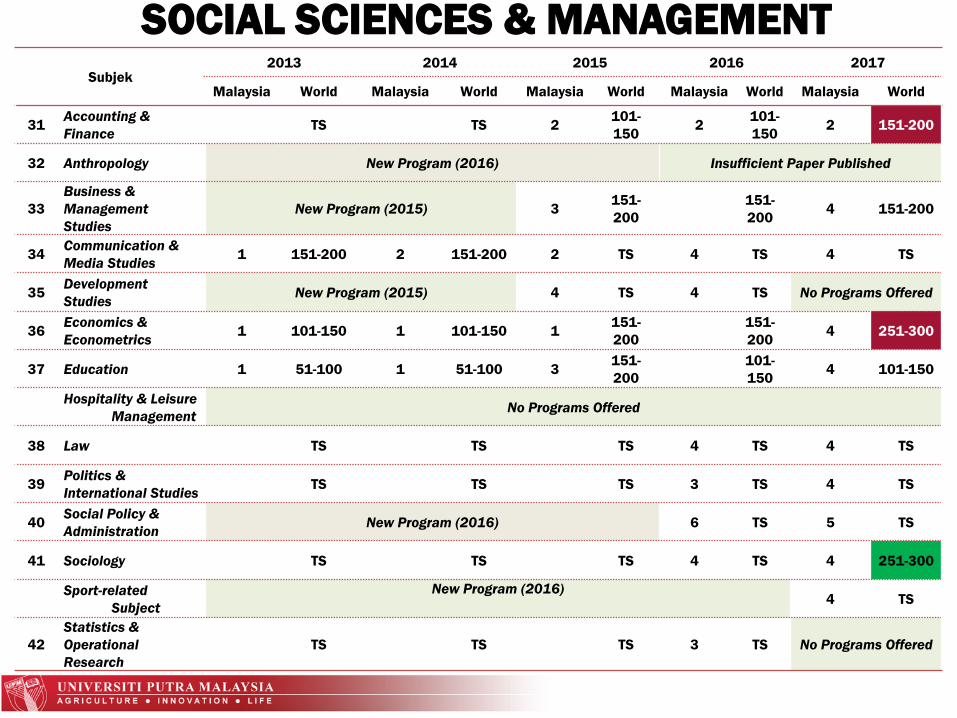
Subjek2013 2014 2015 2016 2017
Malaysia World Malaysia World Malaysia World Malaysia World Malaysia World
31Accounting &
FinanceTS TS 2
101-
1502
101-
1502 151-200
32 Anthropology New Program (2016) Insufficient Paper Published
33
Business &
Management
Studies
New Program (2015) 3151-
2004
151-
2004 151-200
34Communication &
Media Studies1 151-200 2 151-200 2 TS 4 TS 4 TS
35Development
StudiesNew Program (2015) 4 TS 4 TS No Programs Offered
36Economics &
Econometrics1 101-150 1 101-150 1
151-
2004
151-
2004 251-300
37 Education 1 51-100 1 51-100 3151-
2004
101-
1504 101-150
Hospitality & Leisure
ManagementNo Programs Offered
38 Law TS TS TS 4 TS 4 TS
39Politics &
International StudiesTS TS TS 3 TS 4 TS
40Social Policy &
AdministrationNew Program (2016) 6 TS 5 TS
41 Sociology TS TS TS 4 TS 4 251-300
Sport-related
Subject
New Program (2016)4 TS
42
Statistics &
Operational
Research
TS TS TS 3 TS No Programs Offered
SOCIAL SCIENCES & MANAGEMENT
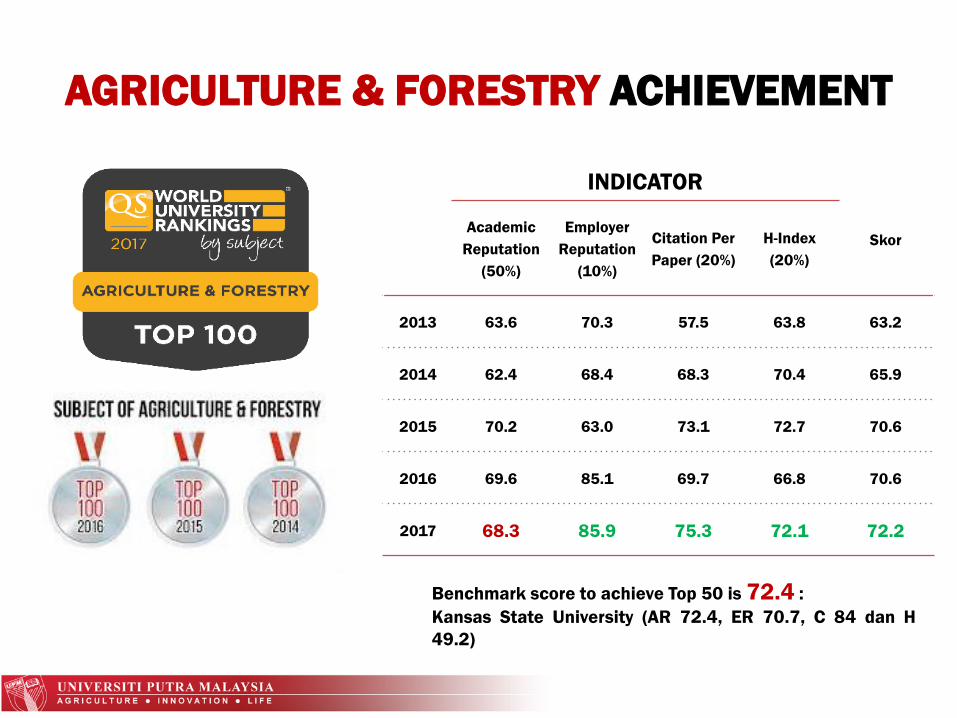
AGRICULTURE & FORESTRY ACHIEVEMENT
INDICATOR
SkorAcademic
Reputation
(50%)
Employer
Reputation
(10%)
Citation Per
Paper (20%)
H-Index
(20%)
2013 63.6 70.3 57.5 63.8 63.2
2014 62.4 68.4 68.3 70.4 65.9
2015 70.2 63.0 73.1 72.7 70.6
2016 69.6 85.1 69.7 66.8 70.6
2017 68.3 85.9 75.3 72.1 72.2
Benchmark score to achieve Top 50 is 72.4 :
Kansas State University (AR 72.4, ER 70.7, C 84 dan H
49.2)
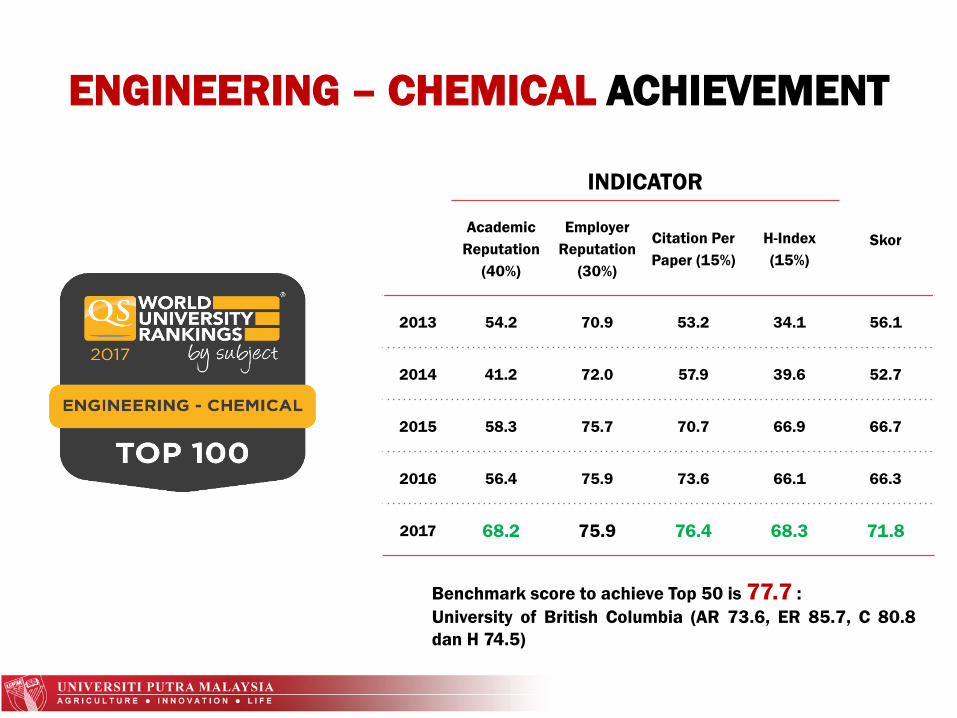
ENGINEERING – CHEMICAL ACHIEVEMENT
INDICATOR
SkorAcademic
Reputation
(40%)
Employer
Reputation
(30%)
Citation Per
Paper (15%)
H-Index
(15%)
2013 54.2 70.9 53.2 34.1 56.1
2014 41.2 72.0 57.9 39.6 52.7
2015 58.3 75.7 70.7 66.9 66.7
2016 56.4 75.9 73.6 66.1 66.3
2017 68.2 75.9 76.4 68.3 71.8
Benchmark score to achieve Top 50 is 77.7 :
University of British Columbia (AR 73.6, ER 85.7, C 80.8
dan H 74.5)
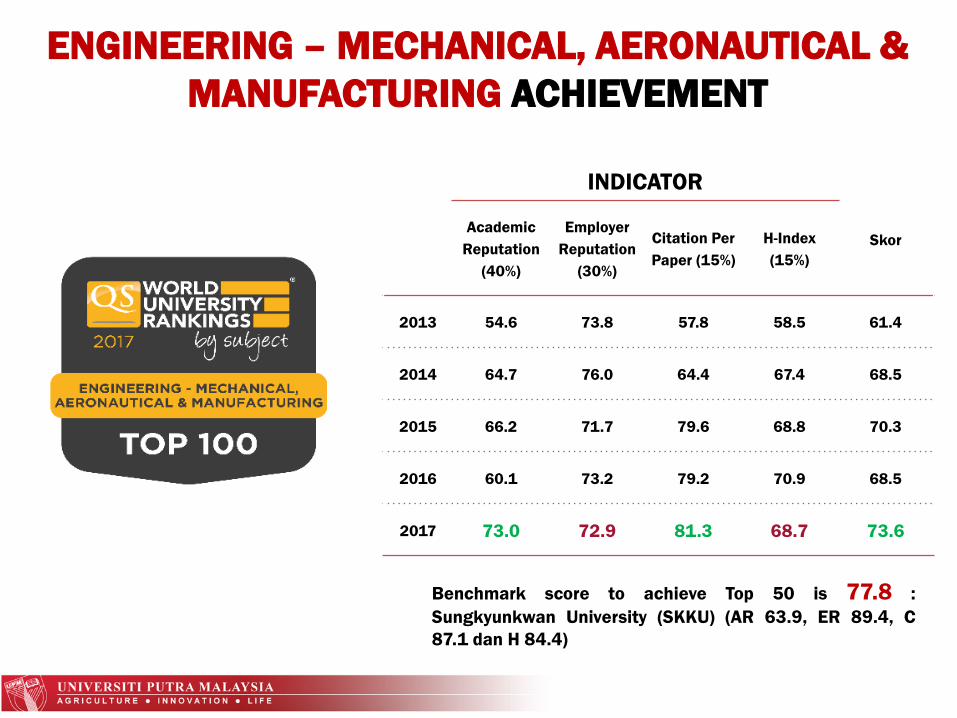
ENGINEERING – MECHANICAL, AERONAUTICAL &
MANUFACTURING ACHIEVEMENT
INDICATOR
SkorAcademic
Reputation
(40%)
Employer
Reputation
(30%)
Citation Per
Paper (15%)
H-Index
(15%)
2013 54.6 73.8 57.8 58.5 61.4
2014 64.7 76.0 64.4 67.4 68.5
2015 66.2 71.7 79.6 68.8 70.3
2016 60.1 73.2 79.2 70.9 68.5
2017 73.0 72.9 81.3 68.7 73.6
Benchmark score to achieve Top 50 is 77.8 :
Sungkyunkwan University (SKKU) (AR 63.9, ER 89.4, C
87.1 dan H 84.4)
Comparison of RU Achievement
Top 200 Subject Ranking
2017
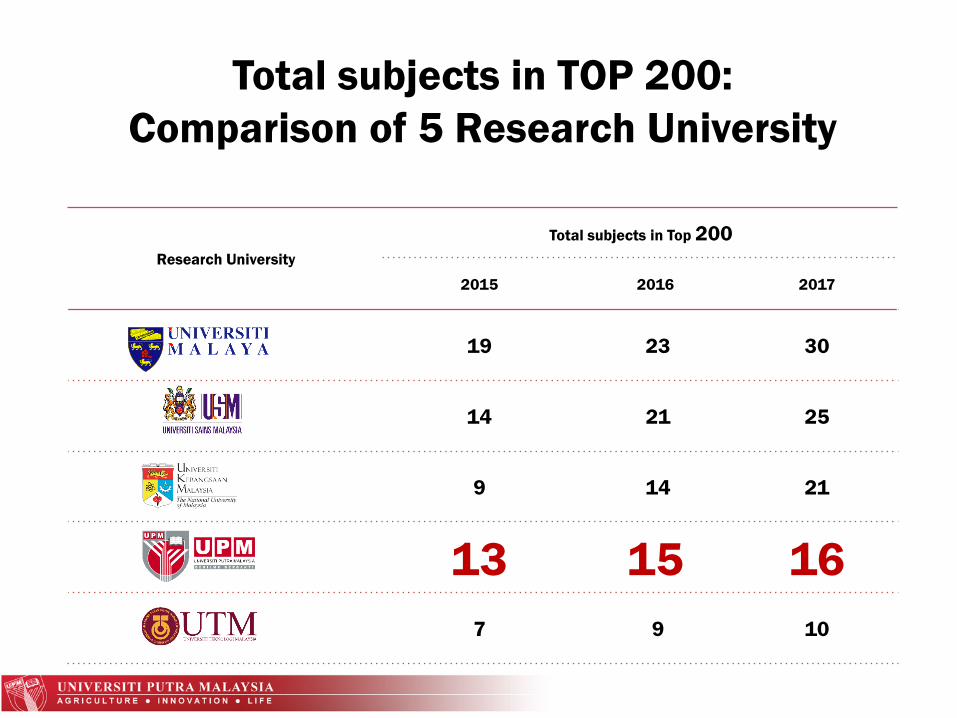
Total subjects in TOP 200:
Comparison of 5 Research University
Research University
Total subjects in Top 200
2015 2016 2017
19 23 30
14 21 25
9 14 21
13 15 16
7 9 10
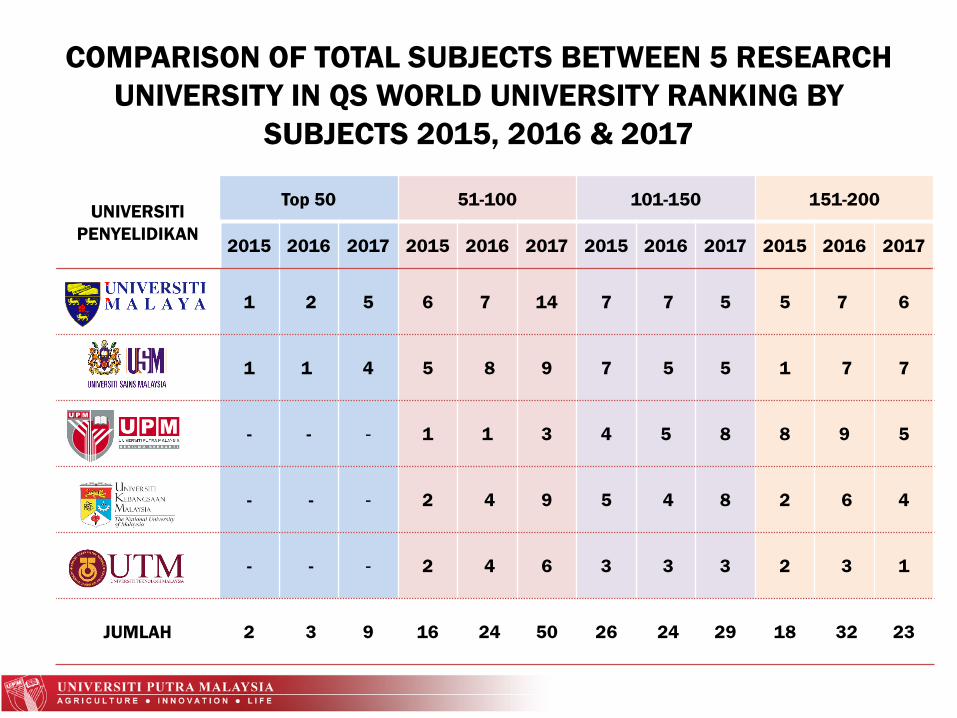
COMPARISON OF TOTAL SUBJECTS BETWEEN 5 RESEARCH
UNIVERSITY IN QS WORLD UNIVERSITY RANKING BY
SUBJECTS 2015, 2016 & 2017
UNIVERSITI
PENYELIDIKAN
Top 50 51-100 101-150 151-200
2015 2016 2017 2015 2016 2017 2015 2016 2017 2015 2016 2017
1 2 5 6 7 14 7 7 5 5 7 6
1 1 4 5 8 9 7 5 5 1 7 7
- - - 1 1 3 4 5 8 8 9 5
- - - 2 4 9 5 4 8 2 6 4
- - - 2 4 6 3 3 3 2 3 1
JUMLAH 2 3 9 16 24 50 26 24 29 18 32 23
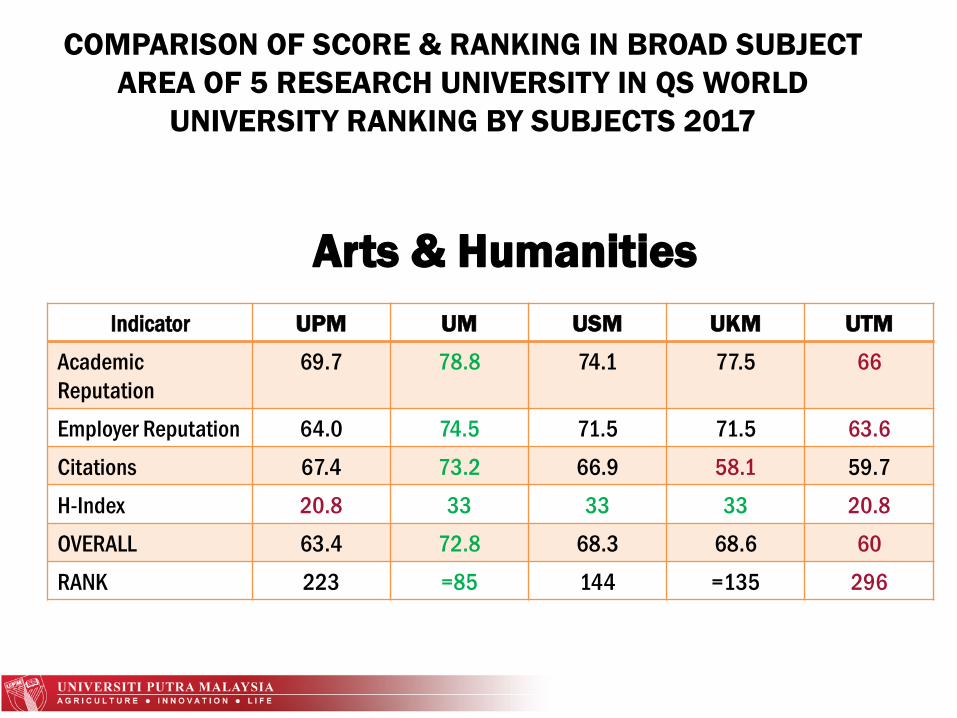
Indicator UPM UM USM UKM UTM
Academic
Reputation
69.7 78.8 74.1 77.5 66
Employer Reputation 64.0 74.5 71.5 71.5 63.6
Citations 67.4 73.2 66.9 58.1 59.7
H-Index 20.8 33 33 33 20.8
OVERALL 63.4 72.8 68.3 68.6 60
RANK 223 =85 144 =135 296
Arts & Humanities
COMPARISON OF SCORE & RANKING IN BROAD SUBJECT
AREA OF 5 RESEARCH UNIVERSITY IN QS WORLD
UNIVERSITY RANKING BY SUBJECTS 2017
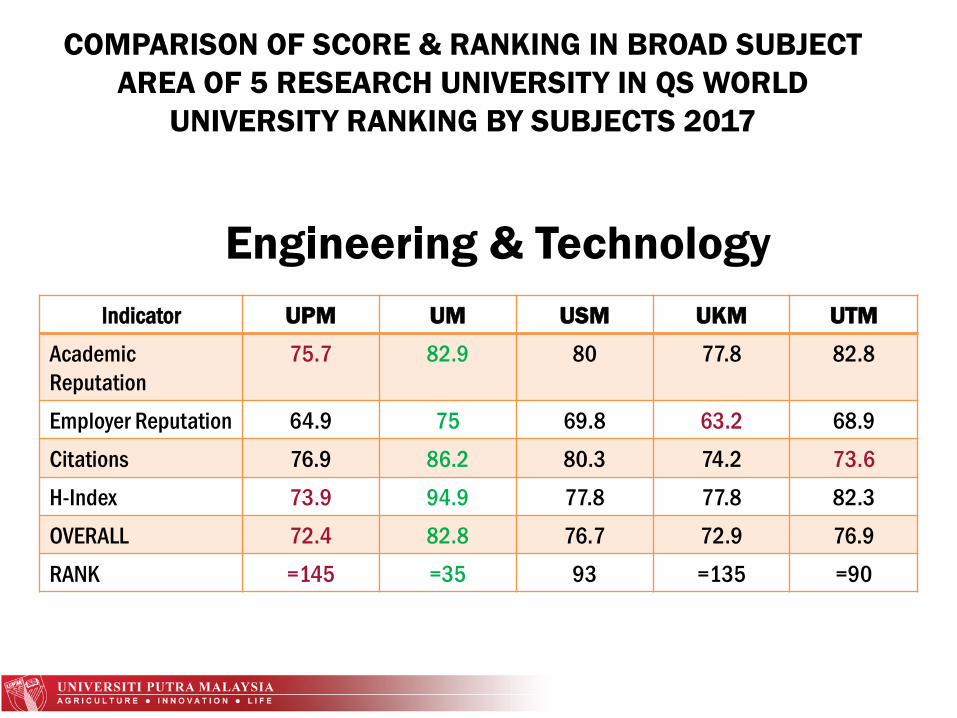
Indicator UPM UM USM UKM UTM
Academic
Reputation
75.7 82.9 80 77.8 82.8
Employer Reputation 64.9 75 69.8 63.2 68.9
Citations 76.9 86.2 80.3 74.2 73.6
H-Index 73.9 94.9 77.8 77.8 82.3
OVERALL 72.4 82.8 76.7 72.9 76.9
RANK =145 =35 93 =135 =90
Engineering & Technology
COMPARISON OF SCORE & RANKING IN BROAD SUBJECT
AREA OF 5 RESEARCH UNIVERSITY IN QS WORLD
UNIVERSITY RANKING BY SUBJECTS 2017
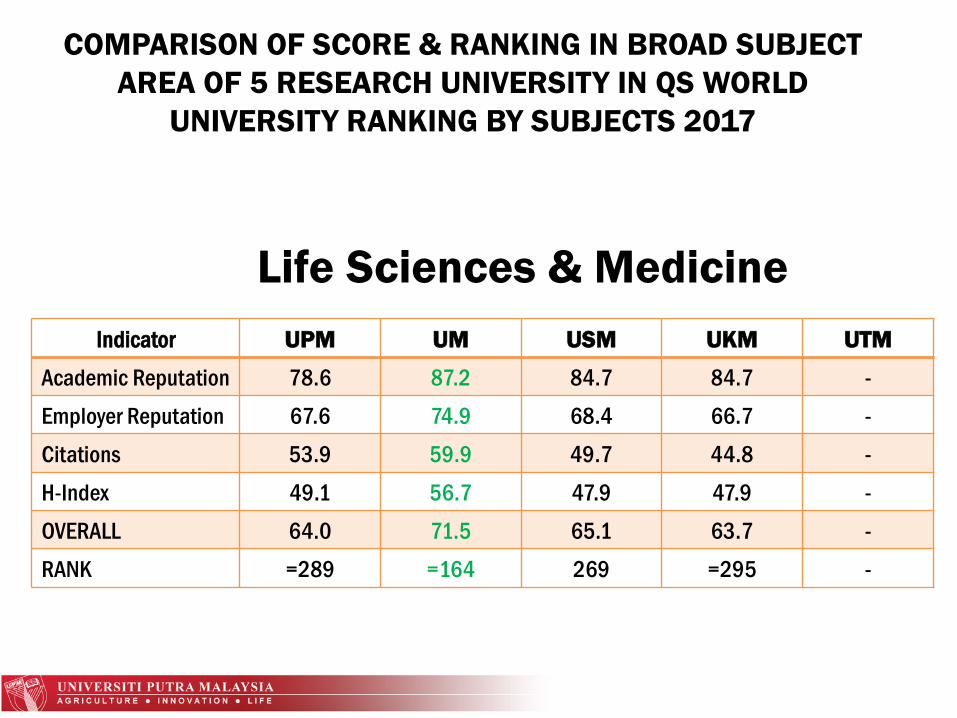
Indicator UPM UM USM UKM UTM
Academic Reputation 78.6 87.2 84.7 84.7 -
Employer Reputation 67.6 74.9 68.4 66.7 -
Citations 53.9 59.9 49.7 44.8 -
H-Index 49.1 56.7 47.9 47.9 -
OVERALL 64.0 71.5 65.1 63.7 -
RANK =289 =164 269 =295 -
Life Sciences & Medicine
COMPARISON OF SCORE & RANKING IN BROAD SUBJECT
AREA OF 5 RESEARCH UNIVERSITY IN QS WORLD
UNIVERSITY RANKING BY SUBJECTS 2017
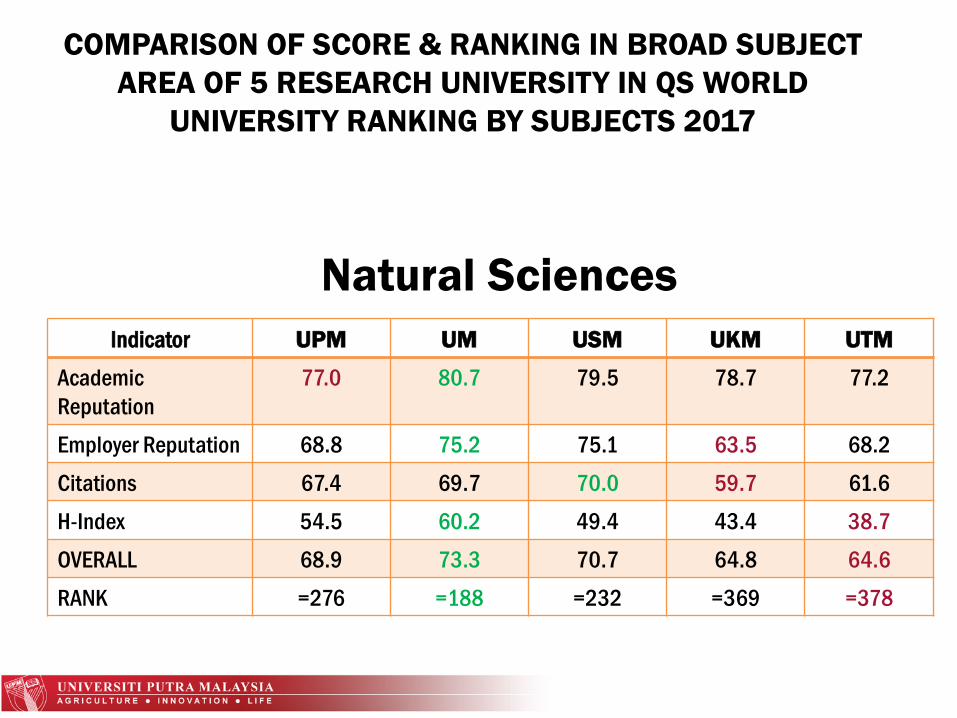
Indicator UPM UM USM UKM UTM
Academic
Reputation
77.0 80.7 79.5 78.7 77.2
Employer Reputation 68.8 75.2 75.1 63.5 68.2
Citations 67.4 69.7 70.0 59.7 61.6
H-Index 54.5 60.2 49.4 43.4 38.7
OVERALL 68.9 73.3 70.7 64.8 64.6
RANK =276 =188 =232 =369 =378
Natural Sciences
COMPARISON OF SCORE & RANKING IN BROAD SUBJECT
AREA OF 5 RESEARCH UNIVERSITY IN QS WORLD
UNIVERSITY RANKING BY SUBJECTS 2017
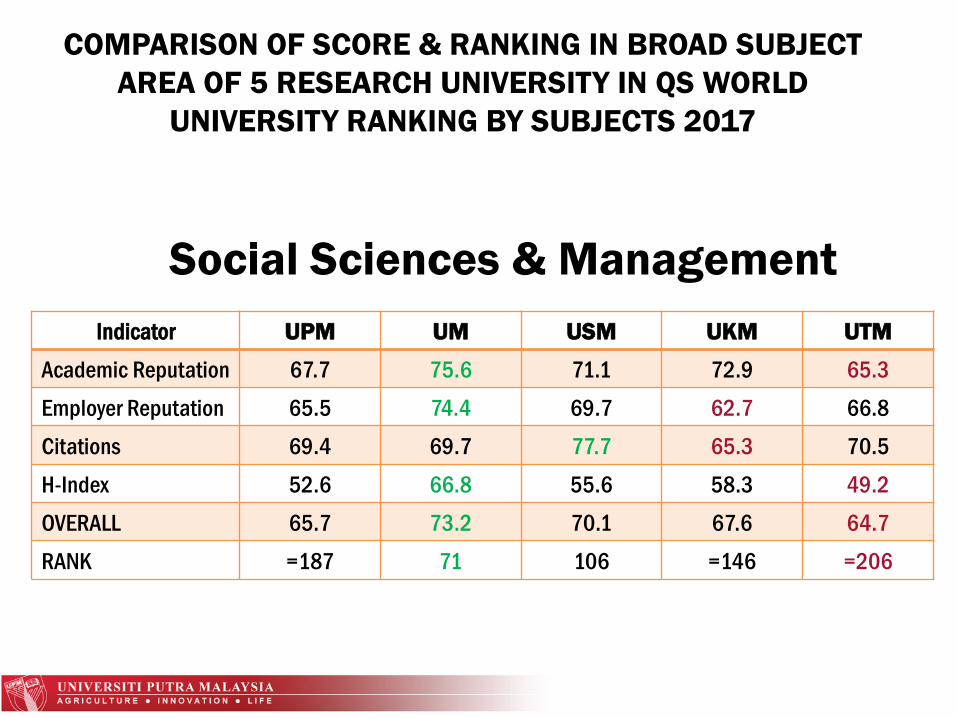
Indicator UPM UM USM UKM UTM
Academic Reputation 67.7 75.6 71.1 72.9 65.3
Employer Reputation 65.5 74.4 69.7 62.7 66.8
Citations 69.4 69.7 77.7 65.3 70.5
H-Index 52.6 66.8 55.6 58.3 49.2
OVERALL 65.7 73.2 70.1 67.6 64.7
RANK =187 71 106 =146 =206
Social Sciences & Management
COMPARISON OF SCORE & RANKING IN BROAD SUBJECT
AREA OF 5 RESEARCH UNIVERSITY IN QS WORLD
UNIVERSITY RANKING BY SUBJECTS 2017
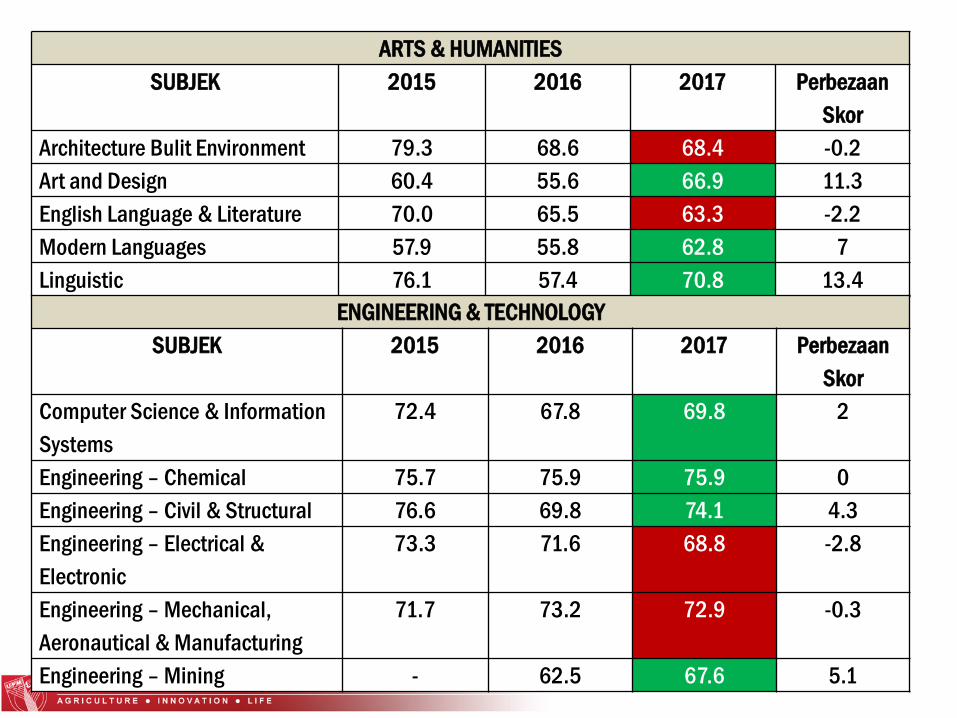
SCORE ANALYSIS BASED ON INDICATOR
ACADEMIC REPUTATION
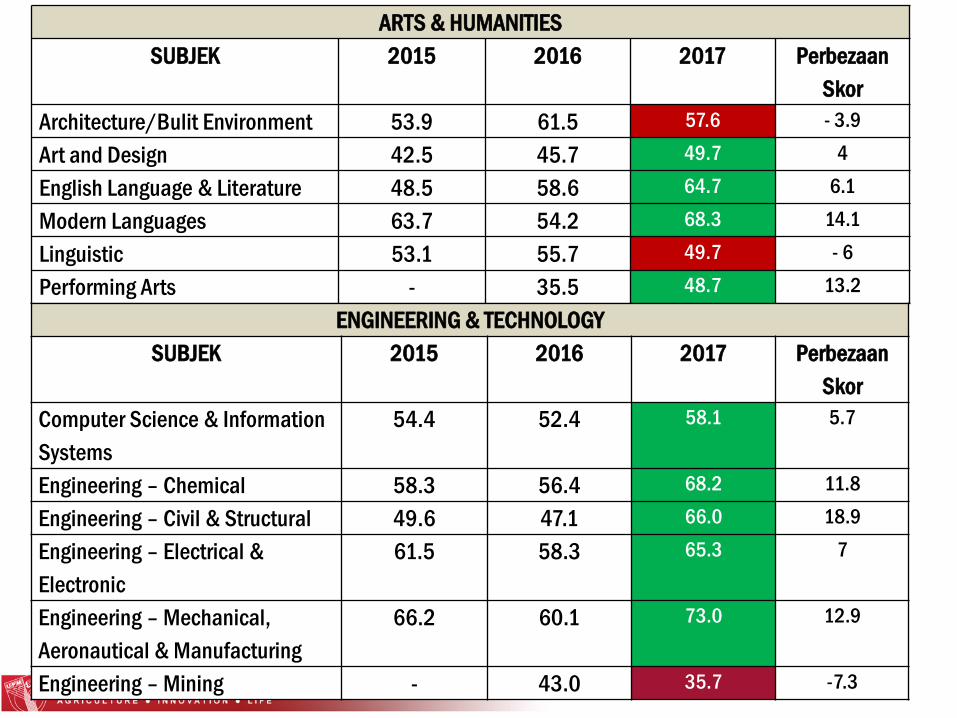
ARTS & HUMANITIES
SUBJEK 2015 2016 2017 Perbezaan
Skor
Architecture/Bulit Environment 53.9 61.5 57.6 - 3.9
Art and Design 42.5 45.7 49.7 4
English Language & Literature 48.5 58.6 64.7 6.1
Modern Languages 63.7 54.2 68.3 14.1
Linguistic 53.1 55.7 49.7 - 6
Performing Arts - 35.5 48.7 13.2
ENGINEERING & TECHNOLOGY
SUBJEK 2015 2016 2017 Perbezaan
Skor
Computer Science & Information
Systems
54.4 52.4 58.1 5.7
Engineering – Chemical 58.3 56.4 68.2 11.8
Engineering – Civil & Structural 49.6 47.1 66.0 18.9
Engineering – Electrical &
Electronic
61.5 58.3 65.3 7
Engineering – Mechanical,
Aeronautical & Manufacturing
66.2 60.1 73.0 12.9
Engineering – Mining - 43.0 35.7 -7.3
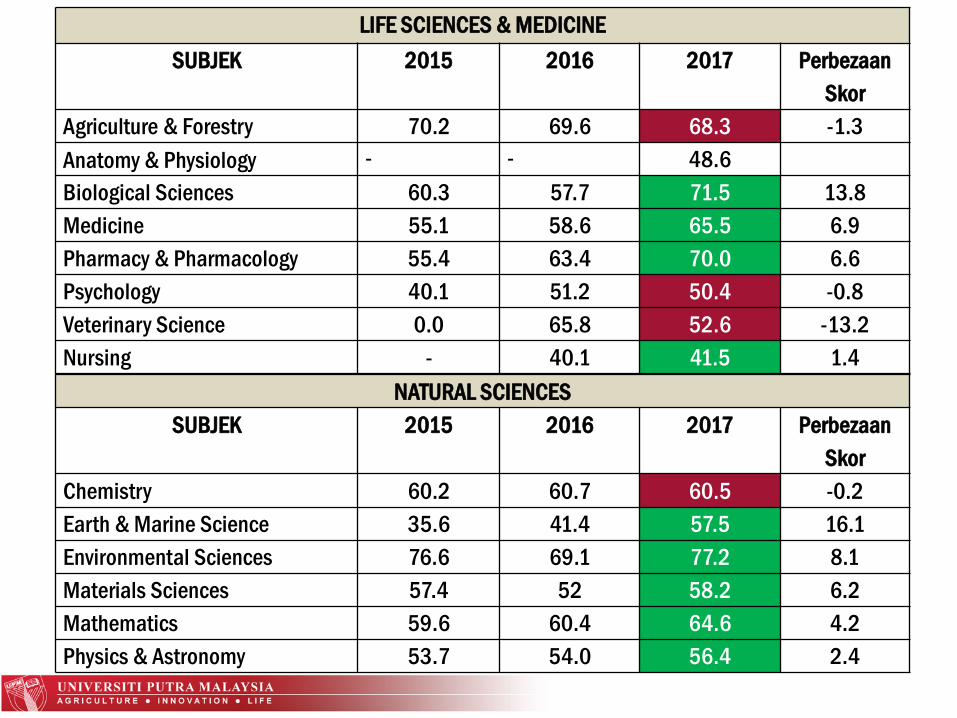
LIFE SCIENCES & MEDICINE
SUBJEK 2015 2016 2017 Perbezaan
Skor
Agriculture & Forestry 70.2 69.6 68.3 -1.3
Anatomy & Physiology - - 48.6
Biological Sciences 60.3 57.7 71.5 13.8
Medicine 55.1 58.6 65.5 6.9
Pharmacy & Pharmacology 55.4 63.4 70.0 6.6
Psychology 40.1 51.2 50.4 -0.8
Veterinary Science 0.0 65.8 52.6 -13.2
Nursing - 40.1 41.5 1.4
NATURAL SCIENCES
SUBJEK 2015 2016 2017 Perbezaan
Skor
Chemistry 60.2 60.7 60.5 -0.2
Earth & Marine Science 35.6 41.4 57.5 16.1
Environmental Sciences 76.6 69.1 77.2 8.1
Materials Sciences 57.4 52 58.2 6.2
Mathematics 59.6 60.4 64.6 4.2
Physics & Astronomy 53.7 54.0 56.4 2.4
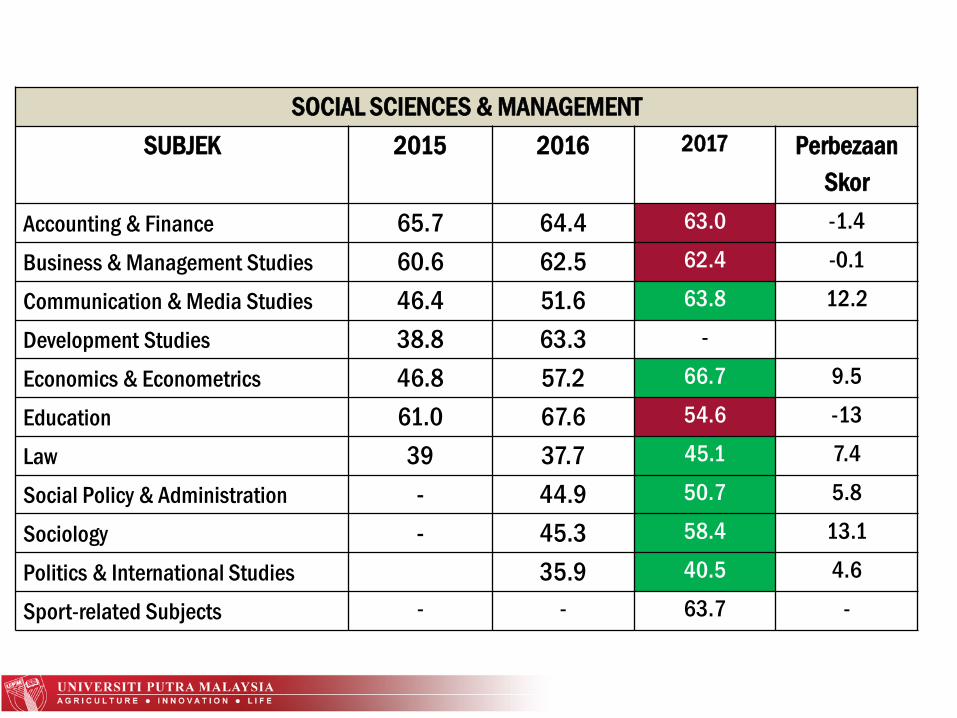
SOCIAL SCIENCES & MANAGEMENT
SUBJEK 2015 2016 2017 Perbezaan
Skor
Accounting & Finance 65.7 64.4 63.0 -1.4
Business & Management Studies 60.6 62.5 62.4 -0.1
Communication & Media Studies 46.4 51.6 63.8 12.2
Development Studies 38.8 63.3 -
Economics & Econometrics 46.8 57.2 66.7 9.5
Education 61.0 67.6 54.6 -13
Law 39 37.7 45.1 7.4
Social Policy & Administration - 44.9 50.7 5.8
Sociology - 45.3 58.4 13.1
Politics & International Studies 35.9 40.5 4.6
Sport-related Subjects - - 63.7 -
SCORE ANALYSIS BASED ON INDICATOR
EMPLOYER REPUTATION
ARTS & HUMANITIES
SUBJEK 2015 2016 2017 Perbezaan
Skor
Architecture Bulit Environment 79.3 68.6 68.4 -0.2
Art and Design 60.4 55.6 66.9 11.3
English Language & Literature 70.0 65.5 63.3 -2.2
Modern Languages 57.9 55.8 62.8 7
Linguistic 76.1 57.4 70.8 13.4
ENGINEERING & TECHNOLOGY
SUBJEK 2015 2016 2017 Perbezaan
Skor
Computer Science & Information
Systems
72.4 67.8 69.8 2
Engineering – Chemical 75.7 75.9 75.9 0
Engineering – Civil & Structural 76.6 69.8 74.1 4.3
Engineering – Electrical &
Electronic
73.3 71.6 68.8 -2.8
Engineering – Mechanical,
Aeronautical & Manufacturing
71.7 73.2 72.9 -0.3
Engineering – Mining - 62.5 67.6 5.1
LIFE SCIENCES & MEDICINE
SUBJEK 2015 2016 2017 Perbezaan
Skor
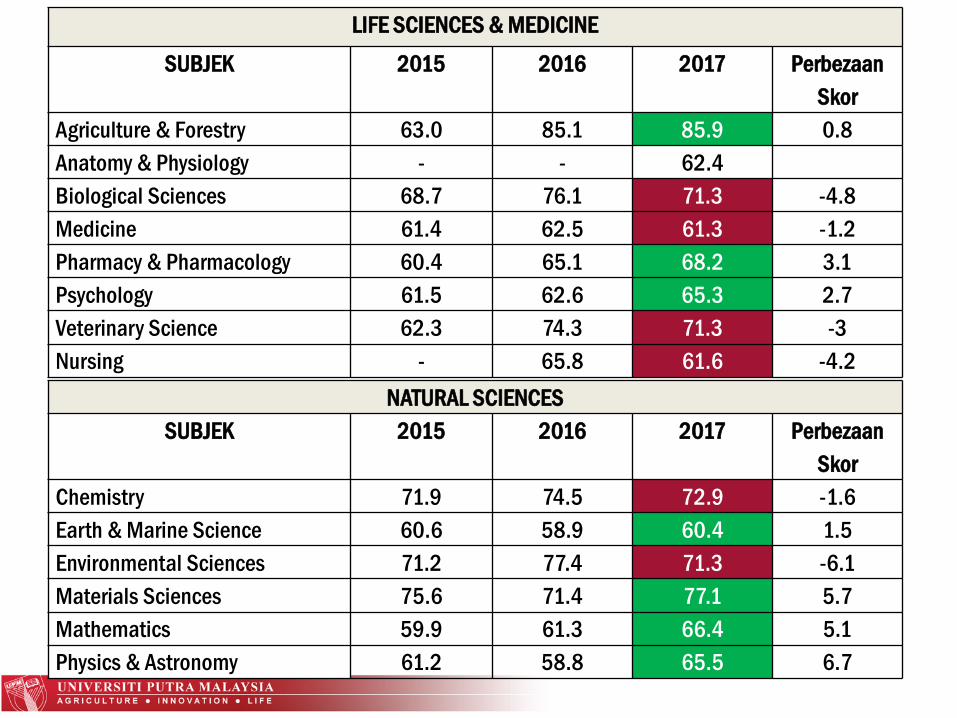
Agriculture & Forestry 63.0 85.1 85.9 0.8
Anatomy & Physiology - - 62.4
Biological Sciences 68.7 76.1 71.3 -4.8
Medicine 61.4 62.5 61.3 -1.2
Pharmacy & Pharmacology 60.4 65.1 68.2 3.1
Psychology 61.5 62.6 65.3 2.7
Veterinary Science 62.3 74.3 71.3 -3
Nursing - 65.8 61.6 -4.2
NATURAL SCIENCES
SUBJEK 2015 2016 2017 Perbezaan
Skor
Chemistry 71.9 74.5 72.9 -1.6
Earth & Marine Science 60.6 58.9 60.4 1.5
Environmental Sciences 71.2 77.4 71.3 -6.1
Materials Sciences 75.6 71.4 77.1 5.7
Mathematics 59.9 61.3 66.4 5.1
Physics & Astronomy 61.2 58.8 65.5 6.7
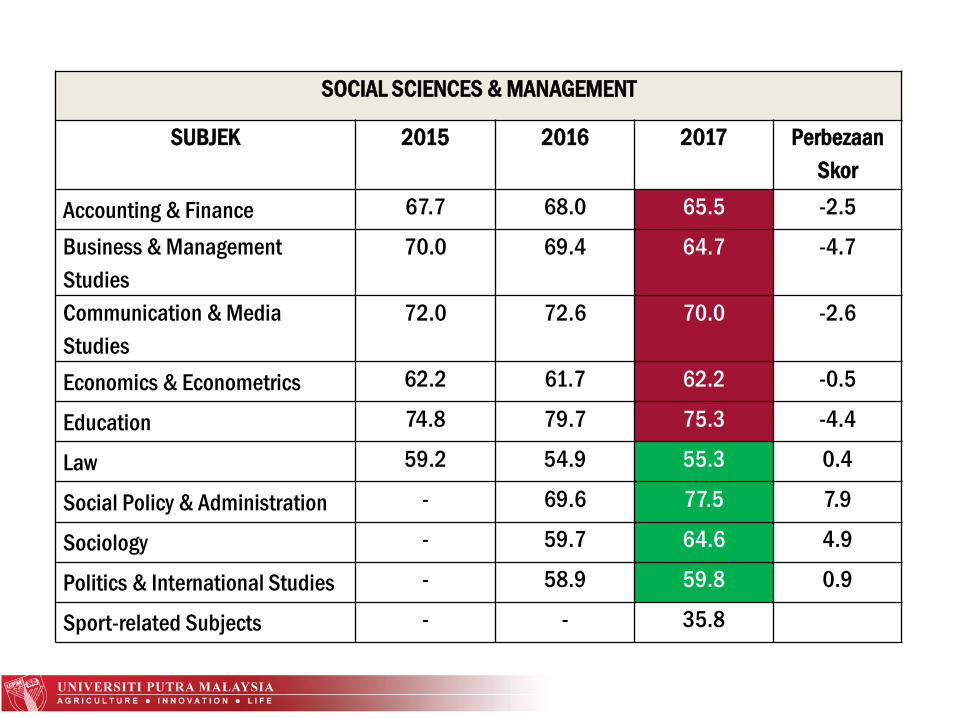
SOCIAL SCIENCES & MANAGEMENT
SUBJEK 2015 2016 2017 Perbezaan
Skor
Accounting & Finance 67.7 68.0 65.5 -2.5
Business & Management
Studies
70.0 69.4 64.7 -4.7
Communication & Media
Studies
72.0 72.6 70.0 -2.6
Economics & Econometrics 62.2 61.7 62.2 -0.5
Education 74.8 79.7 75.3 -4.4
Law 59.2 54.9 55.3 0.4
Social Policy & Administration - 69.6 77.5 7.9
Sociology - 59.7 64.6 4.9
Politics & International Studies - 58.9 59.8 0.9
Sport-related Subjects - - 35.8
SCORE ANALYSIS BASED ON INDICATOR
H-INDEXS
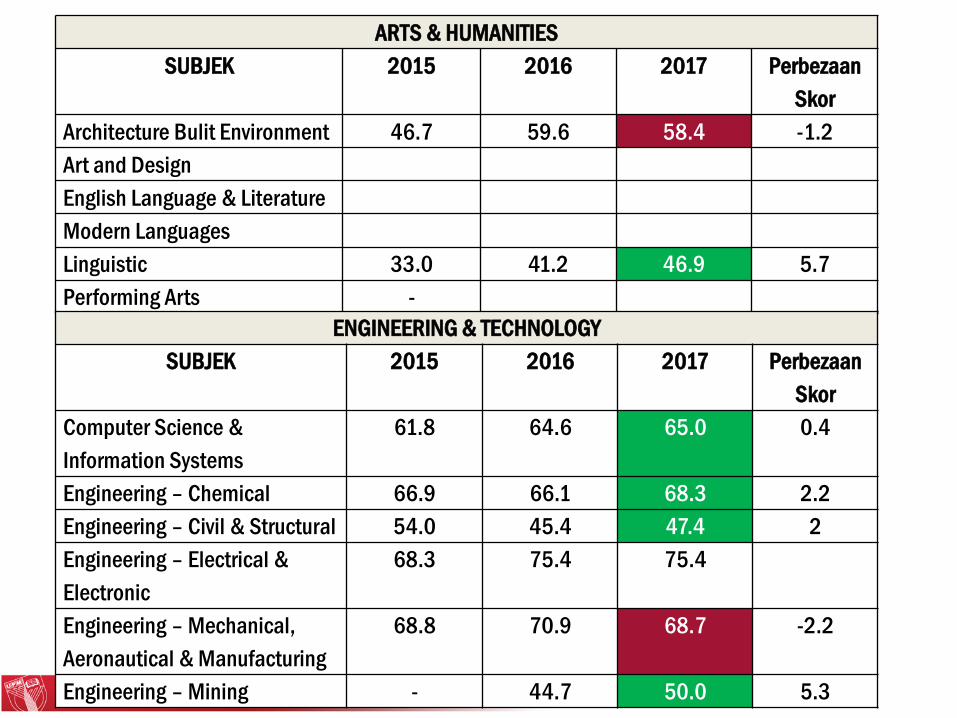
ARTS & HUMANITIES
SUBJEK 2015 2016 2017 Perbezaan
Skor
Architecture Bulit Environment 46.7 59.6 58.4 -1.2
Art and Design
English Language & Literature
Modern Languages
Linguistic 33.0 41.2 46.9 5.7
Performing Arts -
ENGINEERING & TECHNOLOGY
SUBJEK 2015 2016 2017 Perbezaan
Skor
Computer Science &
Information Systems
61.8 64.6 65.0 0.4
Engineering – Chemical 66.9 66.1 68.3 2.2
Engineering – Civil & Structural 54.0 45.4 47.4 2
Engineering – Electrical &
Electronic
68.3 75.4 75.4
Engineering – Mechanical,
Aeronautical & Manufacturing
68.8 70.9 68.7 -2.2
Engineering – Mining - 44.7 50.0 5.3
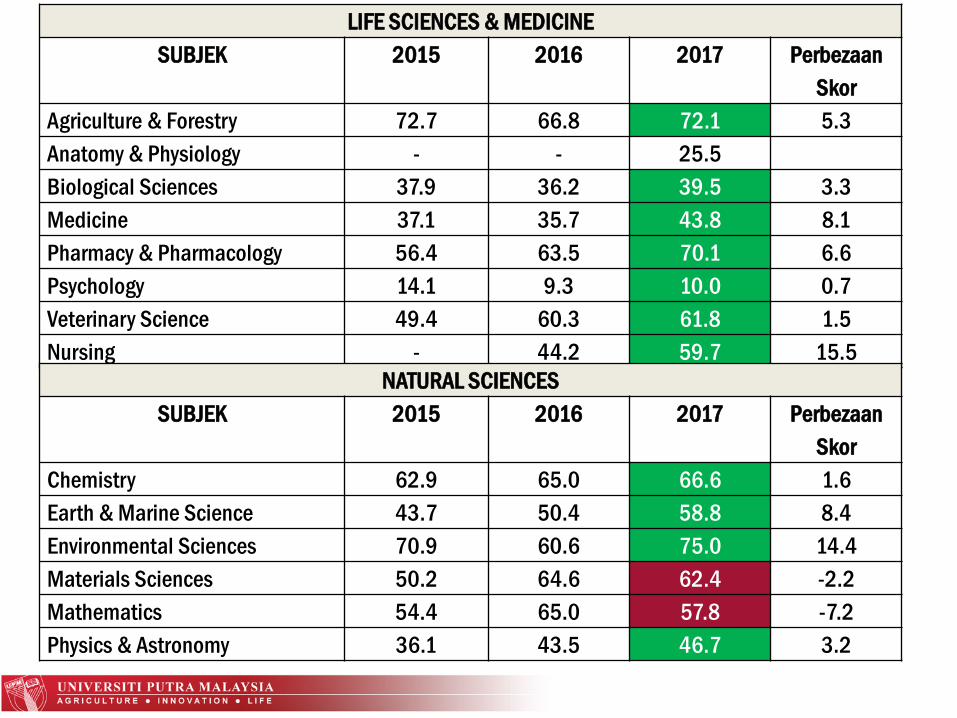
LIFE SCIENCES & MEDICINE
SUBJEK 2015 2016 2017 Perbezaan
Skor
Agriculture & Forestry 72.7 66.8 72.1 5.3
Anatomy & Physiology - - 25.5
Biological Sciences 37.9 36.2 39.5 3.3
Medicine 37.1 35.7 43.8 8.1
Pharmacy & Pharmacology 56.4 63.5 70.1 6.6
Psychology 14.1 9.3 10.0 0.7
Veterinary Science 49.4 60.3 61.8 1.5
Nursing - 44.2 59.7 15.5
NATURAL SCIENCES
SUBJEK 2015 2016 2017 Perbezaan
Skor
Chemistry 62.9 65.0 66.6 1.6
Earth & Marine Science 43.7 50.4 58.8 8.4
Environmental Sciences 70.9 60.6 75.0 14.4
Materials Sciences 50.2 64.6 62.4 -2.2
Mathematics 54.4 65.0 57.8 -7.2
Physics & Astronomy 36.1 43.5 46.7 3.2
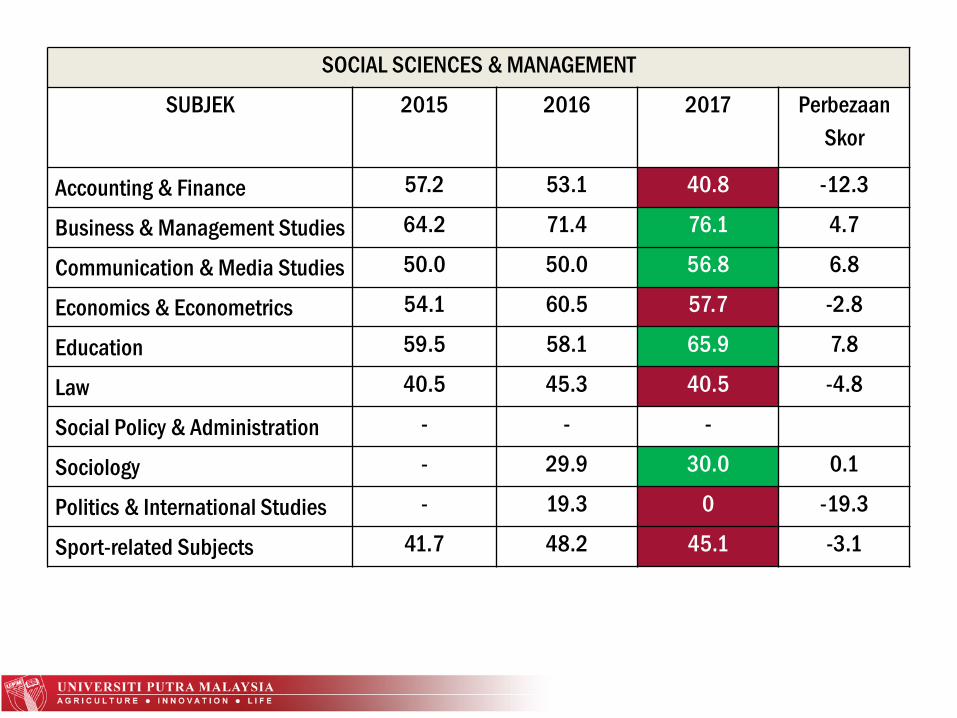
SOCIAL SCIENCES & MANAGEMENT
SUBJEK 2015 2016 2017 Perbezaan
Skor
Accounting & Finance 57.2 53.1 40.8 -12.3
Business & Management Studies 64.2 71.4 76.1 4.7
Communication & Media Studies 50.0 50.0 56.8 6.8
Economics & Econometrics 54.1 60.5 57.7 -2.8
Education 59.5 58.1 65.9 7.8
Law 40.5 45.3 40.5 -4.8
Social Policy & Administration - - -
Sociology - 29.9 30.0 0.1
Politics & International Studies - 19.3 0 -19.3
Sport-related Subjects 41.7 48.2 45.1 -3.1
SCORE ANALYSIS BASED ON INDICATOR
CITATIONS
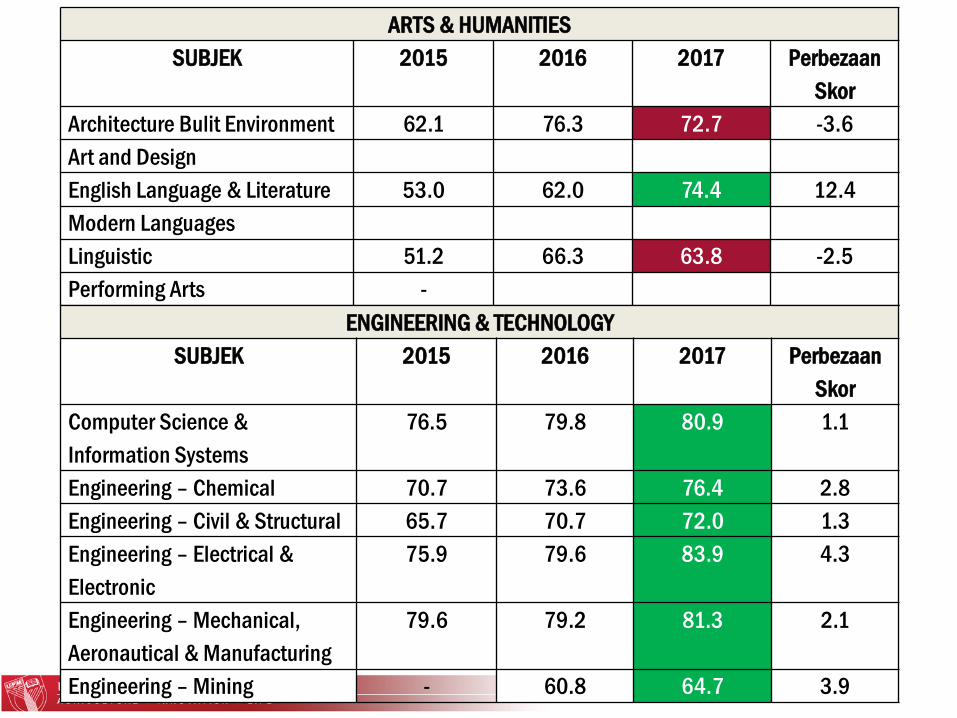
ARTS & HUMANITIES
SUBJEK 2015 2016 2017 Perbezaan
Skor
Architecture Bulit Environment 62.1 76.3 72.7 -3.6
Art and Design
English Language & Literature 53.0 62.0 74.4 12.4
Modern Languages
Linguistic 51.2 66.3 63.8 -2.5
Performing Arts -
ENGINEERING & TECHNOLOGY
SUBJEK 2015 2016 2017 Perbezaan
Skor
Computer Science &
Information Systems
76.5 79.8 80.9 1.1
Engineering – Chemical 70.7 73.6 76.4 2.8
Engineering – Civil & Structural 65.7 70.7 72.0 1.3
Engineering – Electrical &
Electronic
75.9 79.6 83.9 4.3
Engineering – Mechanical,
Aeronautical & Manufacturing
79.6 79.2 81.3 2.1
Engineering – Mining - 60.8 64.7 3.9
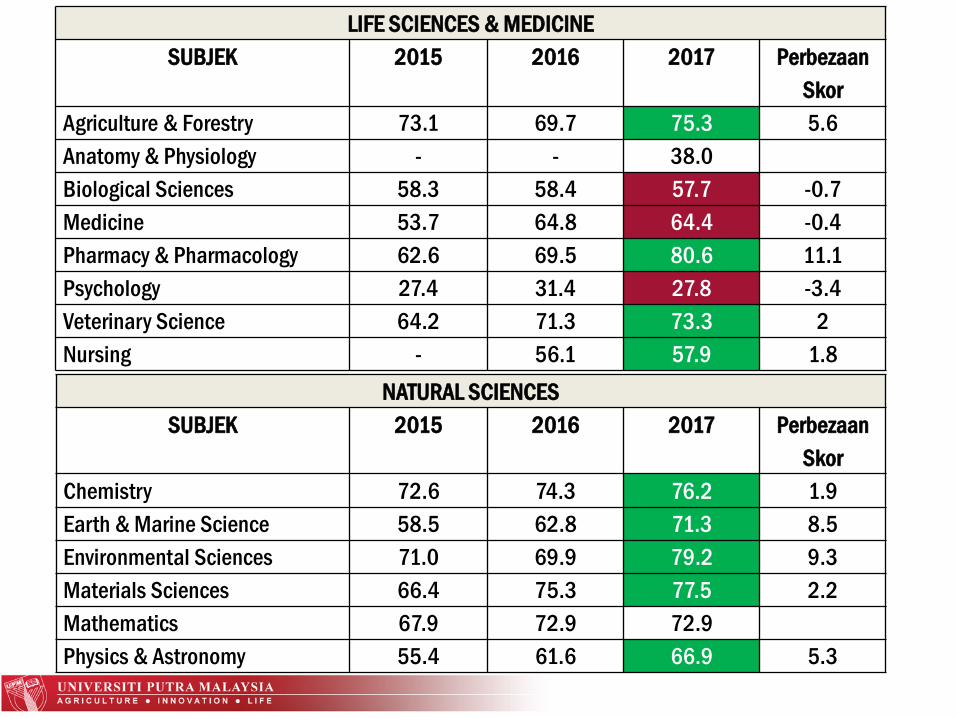
LIFE SCIENCES & MEDICINE
SUBJEK 2015 2016 2017 Perbezaan
Skor
Agriculture & Forestry 73.1 69.7 75.3 5.6
Anatomy & Physiology - - 38.0
Biological Sciences 58.3 58.4 57.7 -0.7
Medicine 53.7 64.8 64.4 -0.4
Pharmacy & Pharmacology 62.6 69.5 80.6 11.1
Psychology 27.4 31.4 27.8 -3.4
Veterinary Science 64.2 71.3 73.3 2
Nursing - 56.1 57.9 1.8
NATURAL SCIENCES
SUBJEK 2015 2016 2017 Perbezaan
Skor
Chemistry 72.6 74.3 76.2 1.9
Earth & Marine Science 58.5 62.8 71.3 8.5
Environmental Sciences 71.0 69.9 79.2 9.3
Materials Sciences 66.4 75.3 77.5 2.2
Mathematics 67.9 72.9 72.9
Physics & Astronomy 55.4 61.6 66.9 5.3
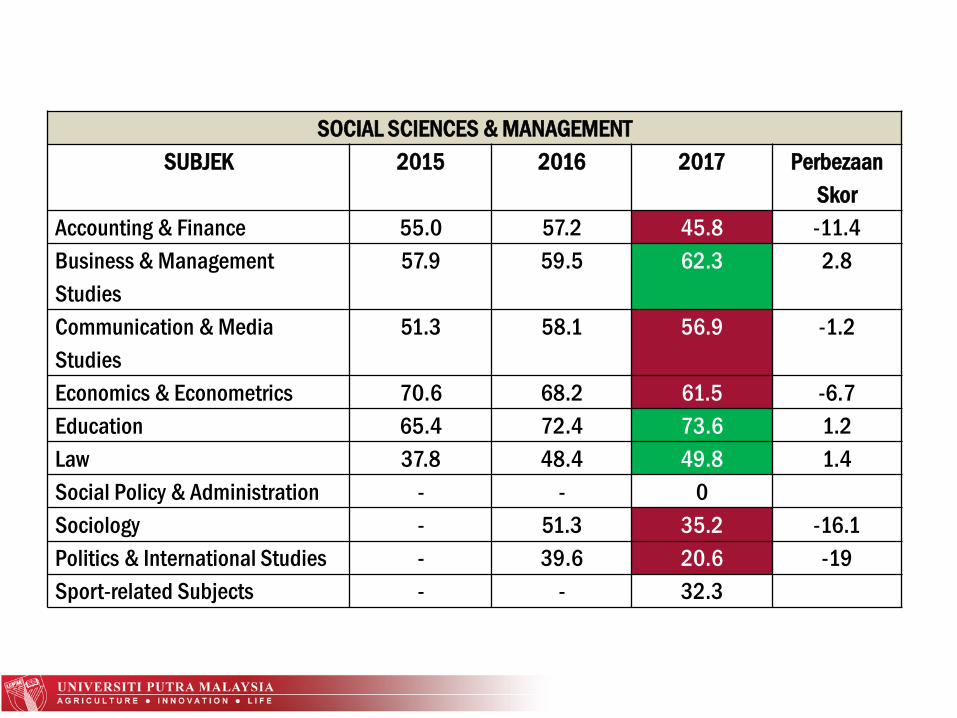
SOCIAL SCIENCES & MANAGEMENT
SUBJEK 2015 2016 2017 Perbezaan
Skor
Accounting & Finance 55.0 57.2 45.8 -11.4
Business & Management
Studies
57.9 59.5 62.3 2.8
Communication & Media
Studies
51.3 58.1 56.9 -1.2
Economics & Econometrics 70.6 68.2 61.5 -6.7
Education 65.4 72.4 73.6 1.2
Law 37.8 48.4 49.8 1.4
Social Policy & Administration - - 0
Sociology - 51.3 35.2 -16.1
Politics & International Studies - 39.6 20.6 -19
Sport-related Subjects - - 32.3
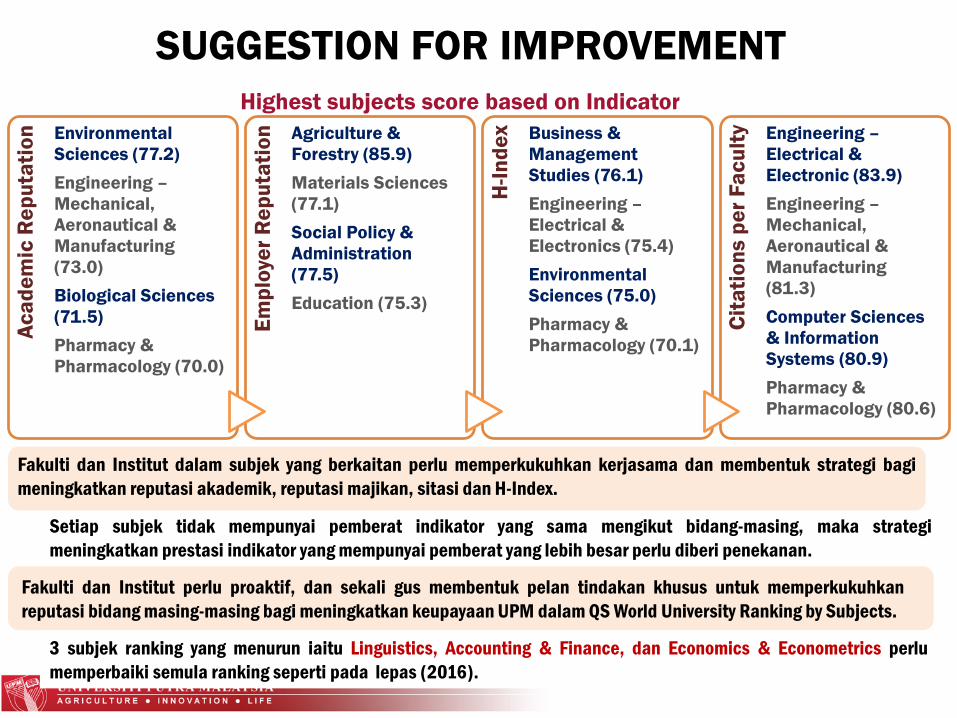
SUGGESTION FOR IMPROVEMENTA
ca
de
mic
Re
pu
tati
on Environmental
Sciences (77.2)
Engineering –
Mechanical,
Aeronautical &
Manufacturing
(73.0)
Biological Sciences
(71.5)
Pharmacy &
Pharmacology (70.0)
Em
plo
yer
Re
pu
tati
on Agriculture &
Forestry (85.9)
Materials Sciences
(77.1)
Social Policy &
Administration
(77.5)
Education (75.3)
H-I
nd
ex Business &
Management
Studies (76.1)
Engineering –
Electrical &
Electronics (75.4)
Environmental
Sciences (75.0)
Pharmacy &
Pharmacology (70.1)
Cit
ati
on
s p
er
Fa
cu
lty Engineering –
Electrical &
Electronic (83.9)
Engineering –
Mechanical,
Aeronautical &
Manufacturing
(81.3)
Computer Sciences
& Information
Systems (80.9)
Pharmacy &
Pharmacology (80.6)
Setiap subjek tidak mempunyai pemberat indikator yang sama mengikut bidang-masing, maka strategi
meningkatkan prestasi indikator yang mempunyai pemberat yang lebih besar perlu diberi penekanan.
Fakulti dan Institut perlu proaktif, dan sekali gus membentuk pelan tindakan khusus untuk memperkukuhkan
reputasi bidang masing-masing bagi meningkatkan keupayaan UPM dalam QS World University Ranking by Subjects.
Fakulti dan Institut dalam subjek yang berkaitan perlu memperkukuhkan kerjasama dan membentuk strategi bagi
meningkatkan reputasi akademik, reputasi majikan, sitasi dan H-Index.
Highest subjects score based on Indicator
3 subjek ranking yang menurun iaitu Linguistics, Accounting & Finance, dan Economics & Econometrics perlu
memperbaiki semula ranking seperti pada lepas (2016).
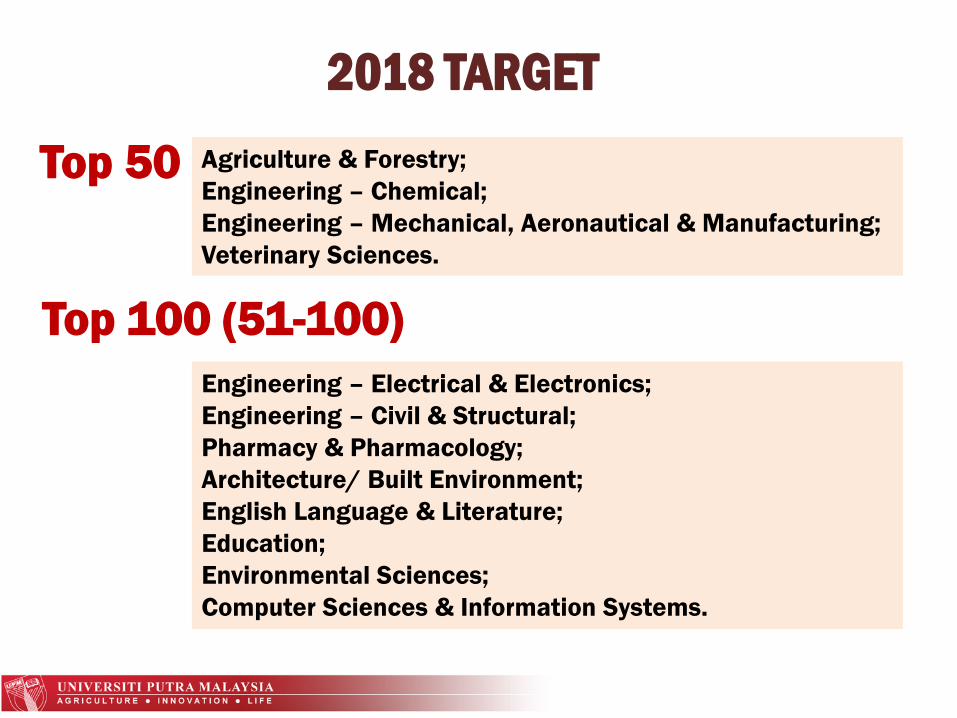
2018 TARGET
Agriculture & Forestry;
Engineering – Chemical;
Engineering – Mechanical, Aeronautical & Manufacturing;
Veterinary Sciences.
Engineering – Electrical & Electronics;
Engineering – Civil & Structural;
Pharmacy & Pharmacology;
Architecture/ Built Environment;
English Language & Literature;
Education;
Environmental Sciences;
Computer Sciences & Information Systems.
Top 50
Top 100 (51-100)