jurnal teknologi full paper · 50 maybelle liang et al / jurnal teknologi (sciences &...
TRANSCRIPT
72:3 (2015) 49–58 | www.jurnalteknologi.utm.my | eISSN 2180–3722 |
Full paper Jurnal
Teknologi
Estimating Uniaxial Compressive Strength of Tropically Weathered Sedimentary Rock Using Indirect Tests Maybelle Liang,* Edy Tonnizam Mohamad, Ma Chau Khun, Mohd Nur Asmawisham Alel
Faculty of Civil Engineering, Universiti Teknologi Malaysia, 81310 UTM Johor Bahru, Johor Malaysia
*Corresponding author: [email protected]
Article history
Received: 17 August 2014
Received in revised form: 17 November 2014
Accepted: 24 December 2014
Graphical abstract
Abstract
Uniaxial compressive strength (UCS) of intact rock is particularly important in rock mechanic studies,
especially for those involving civil and mining projects. However, the determination of UCS using direct test is generally expensive, time consuming and almost impossible in preparation of samples for highly
weathered sedimentary rocks. In view of this, indirect tests are comparatively cheap, simpler, faster and
more convenient to perform either in laboratory or at site. This paper aims to develop an estimation procedure in determining the UCS values of such weak weathered rocks. Among the indirect tests
present herein are point load index, Schmidt Rebound hammer, Brazilian tensile test and slake durability
test. Unfortunately, it was found that the accuracy of each single test varies with weathering states. Hence, a recommended procedure using combined indirect tests in determining UCS of weak sedimentary rocks
is presented herein.
Keywords: Sedimentary rock, Point load index, Schmidt Rebound hammer, Brazilian test, Slake
durability, weathering
Abstrak
Kekuatan mampatan sepaksi (KMS) bahan batuan adalah amat penting dalam kajian mekanik batuan, terutamanya yang melibatkan projek-projek awam dan perlombongan. Namun demikan, penentuan KMS
melalui ujian secara langsung adalah agak berkos tinggi, memakan masa dan proses penyediaan sampel
batuan sedimen terluluhawa adalah amat sukar untuk dilakukan. Memandangkan situasi-situasi yang dinyatakan, ujian-ujian kekuatan tidak langsung adalah lebih murah, ringkas, cepat dan mudah untuk
dilaksanakan sama ada di dalam makmal atau di tapak kajian. Kertas ini bertujuan untuk membangunkan
satu prosedur anggaran untuk menentukan nilai KMS batuan-batuan terluluhawa. Antara ujian kekuatan tidak langsung yang diambilkira ialah ujian beban titik, tukul pantulan Schmidt, ujian ketegangan
Brazilian, dan ujian pemeroian. Adalah didapati bahawa ketepatan setiap ujian tersebut adalah tidak tentu
bagi setiap keadaan luluhawa batu yang berlainan. Maka, satu prosedur cadangan yang menggabungkan ujian-ujian tidak langsung tersebut dalam menentukan KMS batuan sedimen lemah akan dibentangkan di
bawah.
Kata kunci: Batuan sedimen, kajian mampatan sepaksi, tukul pantulan Schmidt, ujian ketegangan
Brazilian, ujian pemeroian, keluluhawaan
© 2015 Penerbit UTM Press. All rights reserved.
1.0 INTRODUCTION
Intact rock strength is particularly important in rock mechanics
engineering. The strength of rock is the most important input
parameter used in the engineering projects such as excavation,
mining and slope stability. Uniaxial Compressive Strength (UCS)
test is inevitably the most
reliable means to determine the rock strength. However, it is almost
impossible to prepare the UCS samples for weathered weak
sedimentary rock.1,2,3 Besides, it is also the most expensive and time-
consuming practice since it involves the transportation of the samples
to laboratory and its testing is based on strict laboratory procedures.
50 Maybelle Liang et al / Jurnal Teknologi (Sciences & Engineering) 72:3 (2015) 49–58
Hence, it is particularly important and necessary to conduct indirect
tests to estimate the UCS value of such rocks.
In this paper, the results of various indirect tests performed to
determine their suitability in estimating the intact rock strength are
presented. The indirect tests used in this study are Point load test,
Schmidt Rebound hammer test, Brazilian test and slake durability
test. As a matter of fact, many researchers have studied the
relationship between indirect tests and UCS values. For point load
test (PLT), the relationship between point load index and UCS for
hard rock has long been introduced. The most frequently cited
correlations between Point load index (Is) and UCS are UCS = 24Is
,4 UCS = 22.7 Is ,5 and UCS = 20-25Is.6,7 Unfortunately, the above
mentioned empirical equations were dedicated for hard rocks and
correlations for weathered sedimentary rock which is weak in nature
are yet to establish.
On the other hand, past researchers also proposed empirical
equations for evaluating the rock strength based on Rebound
hammer value (R). The philosophy behind is the Schmidt hardness
and the UCS are closely related. Miller suggested a correlation tables
which reflects the relationships between unit weight,8 UCS and
rebound values. This table was enhanced by Deere and Miller
incorporated the rock density,9 Young’s modulus and rebound
values. Kindybinski proposed an empirical formula,10 making use of
R values for estimating the rock strength. Ghose and Chakrabarti
have suggested an empirical relationship between Schmidt rebound
values and UCS for Indian coals.11 Sachpazis developed a formula
relating the UCS and young’s modulus.12 Aggistalis et al. compared
the point load index, R values and E of gabbros and basalts, and an
empirical formula was proposed for these rocks.13 Katz et al.
compared R with the UCS, E and rock density of different types of
rocks.14 Kilic and Teymen proposed an empirical formula between
Schmidt harness and UCS for igneous rock.15 It was established that
the Schmidt Rebound value, R can be correlated with the rock
strength based on these extensive literature review. However, the
correlations for weathered sedimentary rocks have not yet been
established and the direct application for these existing empirical
formulas is being questioned due to large varieties of rock properties
in weathered sedimentary rock. Table 1 shows the proposed
correlation between the Schmidt hammer values and UCS.
Studies have also shown that compressive strength can be
related to tensile strength of rock samples. The accuracy of the
correlation is highly dependent on the ratio between compressive
strength and tensile strength of the rock material.16,17 Kahraman et
al. conducted a research on UCS and Indirect Tensile Strength (ITS)
of different type of rocks.18 Based on their studies, a linear
correlation was proposed. Farah showed in her study that the
correlation of UCS with ITS is better compared to Is.19 Altindag and
Guney found strong correlation between UCS and ITS for wide
range of rock typses.20 Din and Rafigh found this correlation can
also be extended to limestone in Pakistan.21 Table 2 shows the
correlations between UCS and ITS.
Comparatively, there are only few studies relating the UCS with
durability of rock. Eigenbrod found in his study that UCS reduction
correlated well with decreased durability.22 Unfortunately, no
correlations were developed for UCS and slake durability strength
(SDS). Bonelly,23 and Cargill and Shakoor,24 tried to develop the
correlation between UCS and SDS. Bonelli concentrated on
sandstones,23 whereas Cargill and Shakoor focused on carbonate and
granitic rocks.24 They concluded that SDS would be useful when a
wide range of values could be obtained particularly for weak or
highly weathered rocks.
Table 1 Correlation between R and UCS
Researcher Equations R2 Rock type
Deere and
miller (1966) UCS = 10(0.00014ϒ𝑅+31.6) 0.94 Three based rock
types
Kidybinski (1980)
UCS = 0.447exp [
0.045(R + 3.5) + ϒ]
0.72 Rock coal
Ghose and
Chakraborti (1986)
UCS = 0.88R – 12.11 0.77 Coal
Sachpazis
(1990)
R = 0.2329UCS +
15.7244
0.81 33 Lithological
units
Aggitalis (1996)
UCS = 1.31R – 2.52 0.55 Gabbro and basalt
Kilic and
Teymen (2008)
UCS = 0.0137 𝑅2.2721 0.97 19 different rock
types
R2: regression coefficient, R: Schmidt values, UCS: Uniaxial
compressive strength (MPa), ϒ: density of rock (g/c𝑚3)
Table 2 Correlation between ITS and UCS
Researcher Equations R Rock type
Kahraman et
al. (2012) UCS = 10.61 × 𝐼𝑇𝑆 0.5 Varies
Farah (2011) UCS = 5.11 × ITS – 133.86
0.68 Limestone
Altindag and
Guney (2010)
UCS = 12.38× 𝐼𝑇𝑆1.0725 0.89 Varies rock type
R: regression coefficient, ITS: Indirect Tensile STrength, UCS:
Uniaxial compressive strength (MPa)
2.0 GEOLOGY OF STUDIED AREA
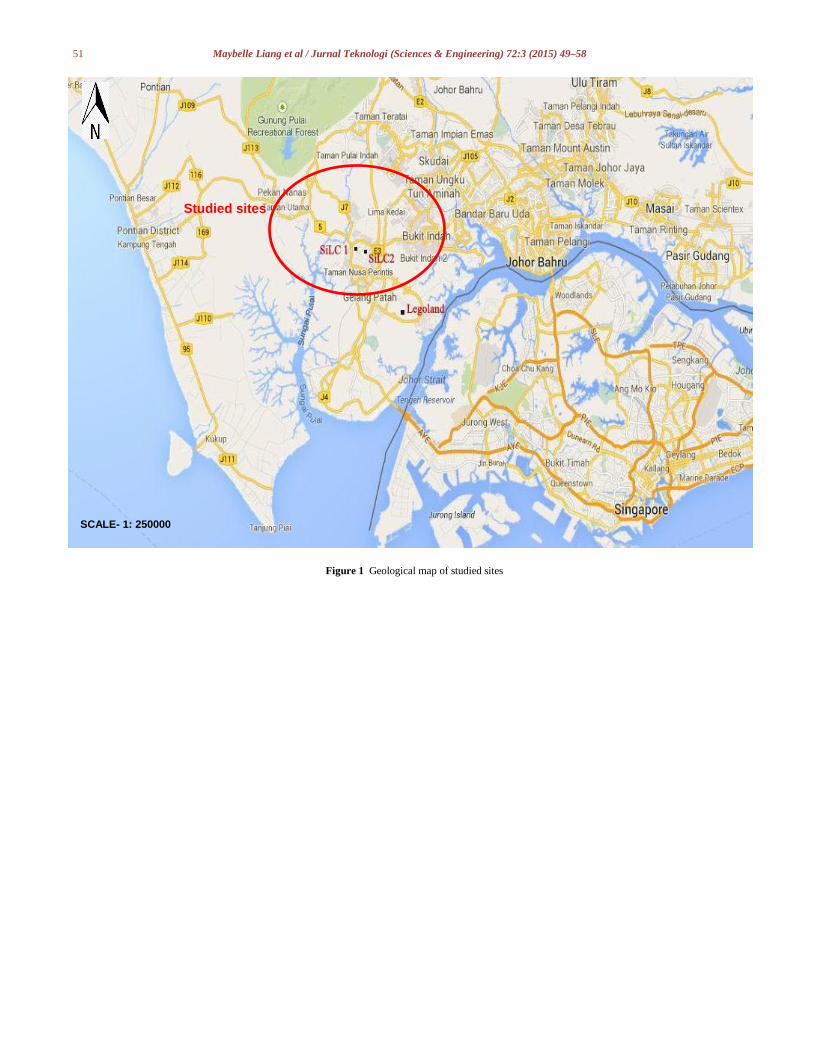
This study aims to investigate the properties of tropically weathered
sedimentary rock in Nusajaya, Jurong Formation. The samples were
collected from three separate sites namely SiLC 1, SiLC 2 and
Legoland. The rock mass in these sites were mainly composed of
shale and immature sandstone, with very little siltstone, conglomerate
and volcanic layers. In accord with the regional strike, this feature
swings from north-northwest direction in the north to west-northwest
in the south. The ridge is composed mainly of argillaceous rocks and
has been subjected to considerable dissection.
51 Maybelle Liang et al / Jurnal Teknologi (Sciences & Engineering) 72:3 (2015) 49–58
Figure 1 Geological map of studied sites
Studied sites
SCALE- 1: 250000
52 Maybelle Liang et al / Jurnal Teknologi (Sciences & Engineering) 72:3 (2015) 49–58
2.1 Properties of Weathered Sandstone and Shale
Tropic country has sunny flux all the year (22-32ᵒC), high moisture
content in air and underground, high quantity of rain (> 1200 mm)
and underground water of 28 ᵒC.25
With these characteristics, climate has great influence to exegetic
process especially to chemical weathering where high intensity of
rain and high temperature will accelerate the weathering process.
Several studies have been done to further understand the
geotechnical properties of weathered sedimentary rock in Peninsular
Malaysia.26,27 The results show that material properties of rock
deteriorate from the fresher material as more intense weathering took
place. The weathered rock has lesser strength due to the presence of
micro fractures and the loosening of the bonding between grains.28
The weathering effect can take place up to 100 m down from the
ground surface in tropical areas.
Generally, sedimentary rock mass consists of more than a type
of rock and always forms alternate laminated because of natural
forming process and also exposed to tectonic effect and pressure.
3.0 LABORATORY TEST PROCEDURE
Rock strength test is used to verify the resistance of rock against
loading. The rock strength test can be classified as direct or indirect
based on comparison between the outputs of the test with the desired
testing properties. For instance, the output of point load test is point-
load index but ‘indirectly’ used to estimate UCS value. UCS test is
direct test as its output can be read as UCS value ‘directly.’ The
summary of each test carried out is shown in Table 3.
3.1 Uniaxial Compressive Strength Test
UCT is used for estimating the compressive strength of rock
specimens under uniaxial loading. The compressive strength of rock
sample is obtained through loading rock specimens under either
load-controlled condition or strain-
Is50 = 𝑃
𝐷𝑒2 (1
Controlled condition depends on the accuracy requirement in stress-
strain curve. Generally, both of them can produce accurate UCS
values but the latter is more accurate in determining complete stress-
strain curve. The testing of UCS sample is illustrated in Figure 2(a).
In this study, a total of 29 and 9 UCS samples were prepared for
sandstone and shale respectively.
Table 3 Summary of tests performed
Type of test Standard No. of Samples
sandstone Shale
UCT ISRM (1985) 29 9
PLT ISRM (1985) 190 100
Schmidt Hammer Test
ASTM (2005) 290 170
ITS ISRM (1981) 34 12
Slake Durability
Test
ISRM (1981) 320 100
3.2 Point Load Index Test
The point load test has been used in geotechnical analysis of over
thirty years. The test involves the compressing of a rock sample
between conical steel platens until failure occurs. The apparatus for
this test consists of a rigid frame, two point load platens, a
hydraulically activated ram with pressure gauge to measure the
applied load. The point load test is illustrated in Figure 2(b).
The ISRM established the basic procedures for testing and
calculation of the Is.29 The point load allows the determination of the
uncorrected point load strength which is Is and to be corrected to the
standard equivalent diameter (De) of 50 mm. if the core being tested
is around 50 mm in diameter, correction is not needed. The procedure
for size correction can be obtained graphically or mathematically as
outlined by ISRM.29 The value for corrected point load index, Is50 is
determined by the following equation:
σt = 0.636𝑃
𝐷𝑡 (2)
where P is the failure load. As pointed out by Hoek,30 the mechanics
of PLT has tendency to cause the rock to fail in tension. He found
that the accuracy of PLT in predicting UCS has mainly depends on
the ratio between the UCS and tensile strength. For most brittle
rocks, this ratio is approximately 10 but for weak rocks, the ratio
drops drastically to approximately 5. This implies that the Is might
be not accurate for weak sedimentary rock. In this study, a total of
290 samples were tested, with 190 sandstone samples and the
remaining are shale samples.
3.2 Schmidt Rebound Hammer Test
In this study, the L-type Schmidt hammer was used to measure
Rebound value, R. The tests included conducting rebound hammer
test in-situ of each panel on the abovementioned sites. At each point
about 20 cm x 20 cm surface of the rock was prepared by peeling off
using hammer and performing about 10 tests on each panel. Among
the numbers obtained, 7 closest values were selected and the average
value was considered as Schmidt number for that particular point.
where P is the load at failure, D is the diameter of the test specimen
and t is the thickness of specimen.
3.3 Slake Durability Test
The slake durability test was originally developed by Franklin and
Chandra,33 recommended by ISRM.32 It measures the percentage of
dry weight of material retained in a steel mesh drum after rotation in a
trough of water. Gamble encouraged the adoption of a second cycle
after drying.34 The slake test was originally developed to provide an
indication of material behaviour during the stresses of alternate
wetting and drying, which to some degree simulates the effects of
weathering.
In using this method, 10-rock lumps were chosen with a mass-
40-60 g to give a total sample mass of 450- 550g. The maximum
grain size did not exceed 3 mm. The lumps are roughly spherical in
shape and rounded corners during preparation. The lump is placed in
a clean drum and is dried to constant mass at a temperature of 105ᵒC
53 Maybelle Liang et al / Jurnal Teknologi (Sciences & Engineering) 72:3 (2015) 49–58
The procedure was following ASTM standards.31
3.4 Brazilian Test
There are many difficulties in performing a direct uniaxial tensile
test on rock. Thus, Indirect Tensile test (ITS) or Brazilian test, has
been proposed. The test involves of loading a rock cylinder
diametrically between two platens. The diametric loading of a small
rock disc is performed by Universal Testing Machine (UTM), which
complies to ISRM requirements for the indirect testing of tensile
strength.32 The test method consists of loading the disc until failure
occurs along its diametric axis. The disc is prepared from 48 mm
diameter core samples with a thickness to diameter ratio of 1:2. In
order to ensure uniaxial failure and hence the validity of the test, the
failure of the disc should initiate at the center of the specimen. Due
to the induction of high shear stresses at the point of contact, it is
recommended that this test is only done on specimens with high
shear to tensile stress ratio. The measurement of the tensile strength
by the ITS give reproducible results. This is due to the smaller the
size of specimen required for the test, a smaller initial sample is
required. However, the necessity for machining and grinding make
the preparation time is particularly inconvenient. The tensile strength
of the specimen can be calculated using the following expression:
and requires 2 to 6 hours in an oven. The mass A of the drum plus
sample is recorded. The sample is then tested after cooling.
The lid was replaced, the drum mounted in the trough and
coupled to the motor. The trough was filled with slaking fluid, usually
tap water at 20ᵒC, to a level 10 mm below the drum axis, and the
drum rotated for 200 revolutions during a period of 10 minutes to an
accuracy of 0.5 minutes. The drum was then removed from the
trough, the lid removed from the drum, and the drum plus retained
portion of the sample dried to a constant mass at 105ᵒC. The mass B
of the drum plus retained portion of the sample is recorded after
cooling. The steps were repeated and the mass C of the drum plus
retained portion of the sample was recorded. The drum is cleaned and
its mass, D was recorded. The slake durability index (second cycle)
was calculated as the percentage ratio of final to initial dry mass
samples masses as follows:
𝐼𝑑2 = 𝐶−𝐷
𝐴−𝐷 × 100 (3)
The second cycle slake durability index, calculated in Equation 3 is
used in this paper. However, the samples with second cycle indexes
ranging from 0 to 10 percent are further characterized by their first
cycle slake durability indexes as follow:
𝐼𝑑1 = 𝐵−𝐷
𝐴−𝐷 × 100 (4)
where Id1 and Id2 are slake durability index for first cycle and second
cycle respectively.
54 Maybelle Liang et al / Jurnal Teknologi (Sciences & Engineering) 72:3 (2015) 49–58
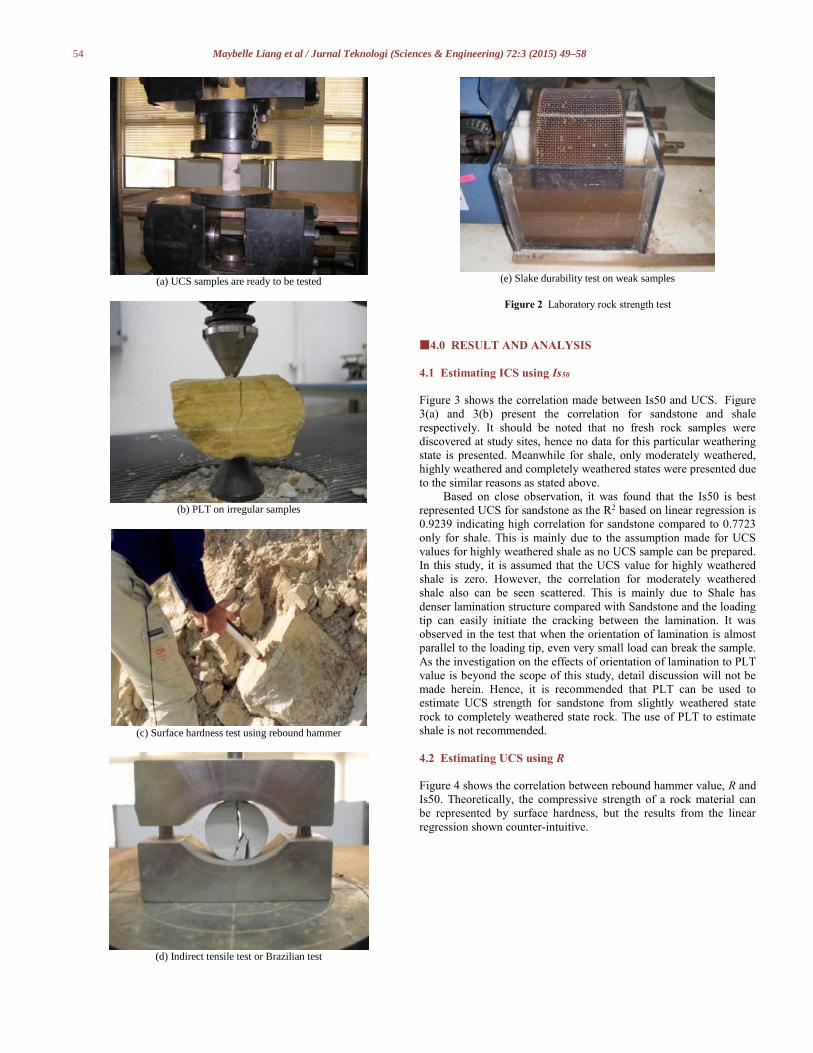
(a) UCS samples are ready to be tested
(b) PLT on irregular samples
(c) Surface hardness test using rebound hammer
(d) Indirect tensile test or Brazilian test
(e) Slake durability test on weak samples
Figure 2 Laboratory rock strength test
4.0 RESULT AND ANALYSIS
4.1 Estimating ICS using Is50
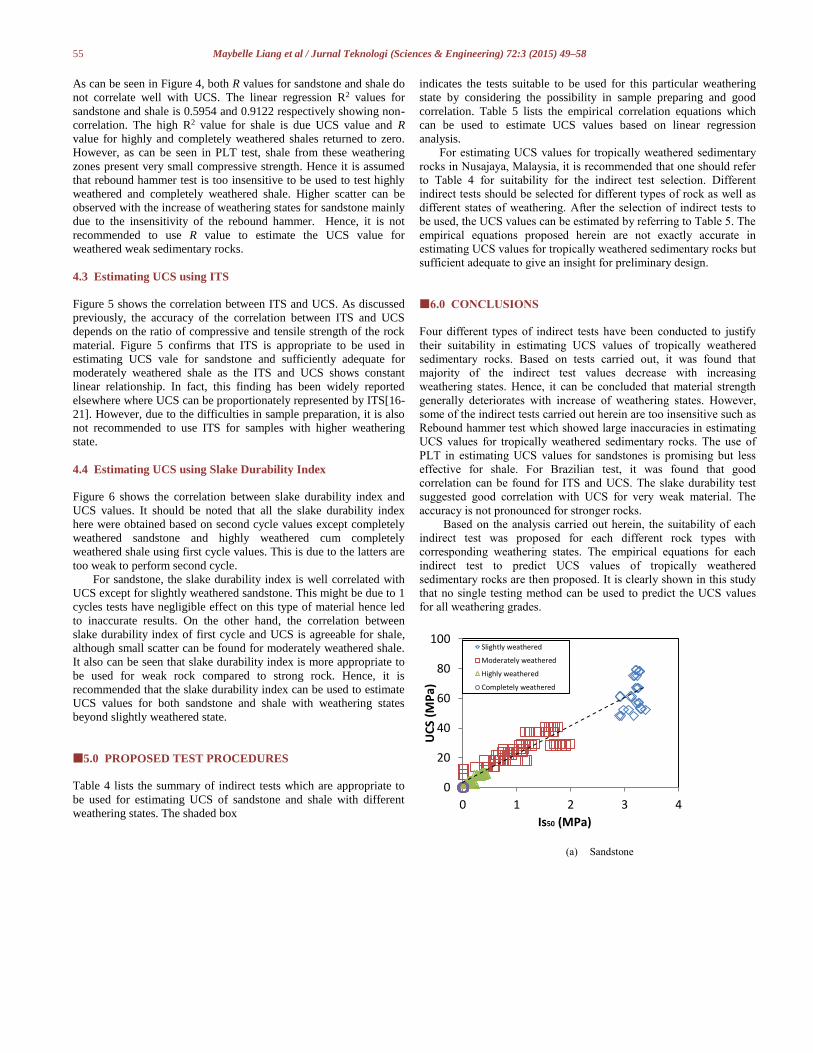
Figure 3 shows the correlation made between Is50 and UCS. Figure
3(a) and 3(b) present the correlation for sandstone and shale
respectively. It should be noted that no fresh rock samples were
discovered at study sites, hence no data for this particular weathering
state is presented. Meanwhile for shale, only moderately weathered,
highly weathered and completely weathered states were presented due
to the similar reasons as stated above.
Based on close observation, it was found that the Is50 is best
represented UCS for sandstone as the R2 based on linear regression is
0.9239 indicating high correlation for sandstone compared to 0.7723
only for shale. This is mainly due to the assumption made for UCS
values for highly weathered shale as no UCS sample can be prepared.
In this study, it is assumed that the UCS value for highly weathered
shale is zero. However, the correlation for moderately weathered
shale also can be seen scattered. This is mainly due to Shale has
denser lamination structure compared with Sandstone and the loading
tip can easily initiate the cracking between the lamination. It was
observed in the test that when the orientation of lamination is almost
parallel to the loading tip, even very small load can break the sample.
As the investigation on the effects of orientation of lamination to PLT
value is beyond the scope of this study, detail discussion will not be
made herein. Hence, it is recommended that PLT can be used to
estimate UCS strength for sandstone from slightly weathered state
rock to completely weathered state rock. The use of PLT to estimate
shale is not recommended.
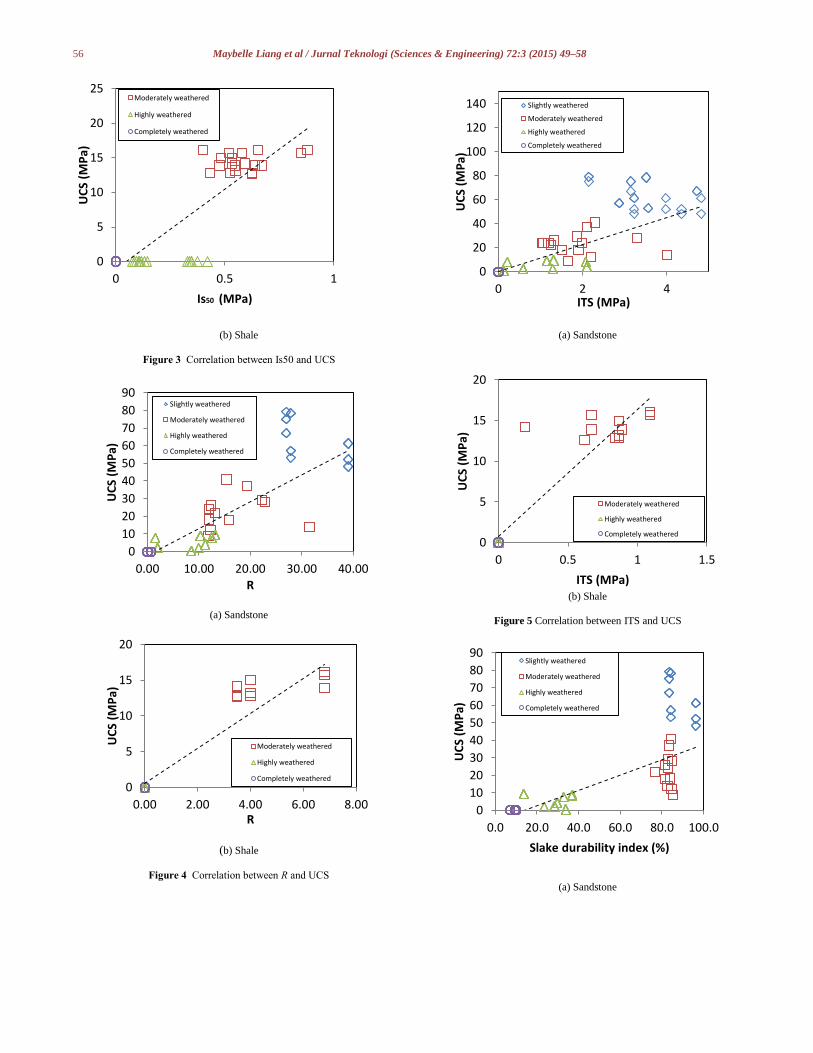
4.2 Estimating UCS using R
Figure 4 shows the correlation between rebound hammer value, R and
Is50. Theoretically, the compressive strength of a rock material can
be represented by surface hardness, but the results from the linear
regression shown counter-intuitive.
55 Maybelle Liang et al / Jurnal Teknologi (Sciences & Engineering) 72:3 (2015) 49–58
As can be seen in Figure 4, both R values for sandstone and shale do
not correlate well with UCS. The linear regression R2 values for
sandstone and shale is 0.5954 and 0.9122 respectively showing non-
correlation. The high R2 value for shale is due UCS value and R
value for highly and completely weathered shales returned to zero.
However, as can be seen in PLT test, shale from these weathering
zones present very small compressive strength. Hence it is assumed
that rebound hammer test is too insensitive to be used to test highly
weathered and completely weathered shale. Higher scatter can be
observed with the increase of weathering states for sandstone mainly
due to the insensitivity of the rebound hammer. Hence, it is not
recommended to use R value to estimate the UCS value for
weathered weak sedimentary rocks.
4.3 Estimating UCS using ITS
Figure 5 shows the correlation between ITS and UCS. As discussed
previously, the accuracy of the correlation between ITS and UCS
depends on the ratio of compressive and tensile strength of the rock
material. Figure 5 confirms that ITS is appropriate to be used in
estimating UCS vale for sandstone and sufficiently adequate for
moderately weathered shale as the ITS and UCS shows constant
linear relationship. In fact, this finding has been widely reported
elsewhere where UCS can be proportionately represented by ITS[16-
21]. However, due to the difficulties in sample preparation, it is also
not recommended to use ITS for samples with higher weathering
state.
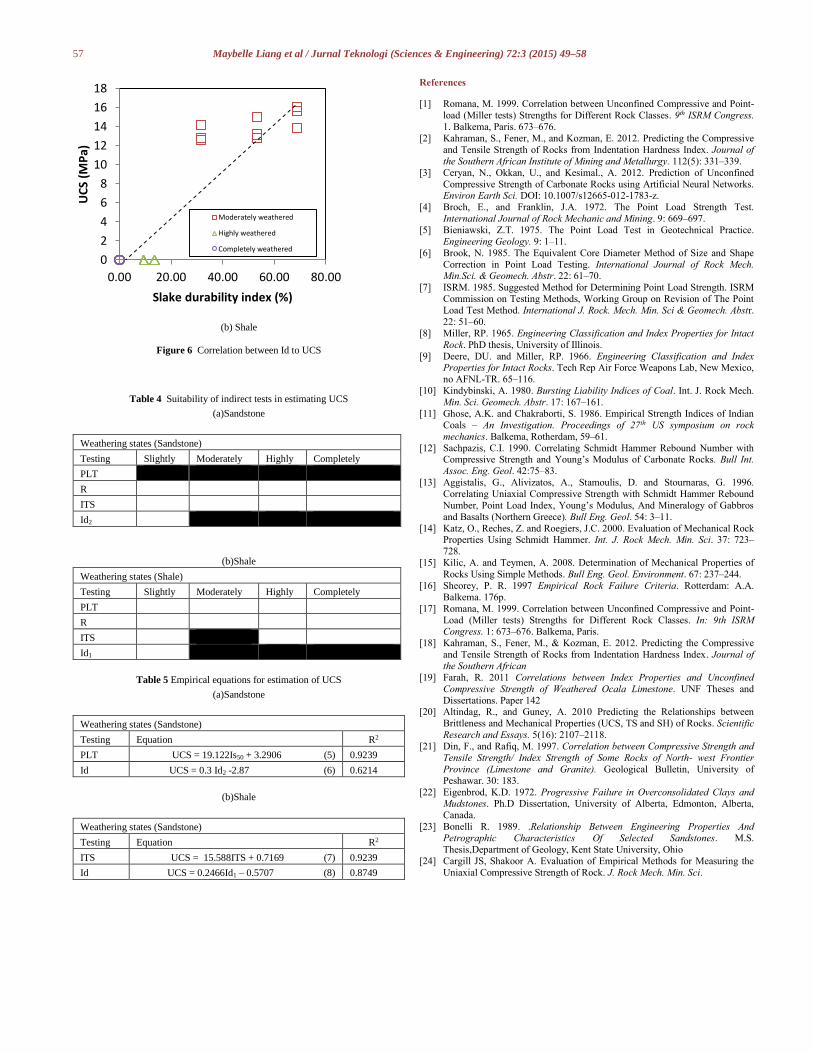
4.4 Estimating UCS using Slake Durability Index
Figure 6 shows the correlation between slake durability index and
UCS values. It should be noted that all the slake durability index
here were obtained based on second cycle values except completely
weathered sandstone and highly weathered cum completely
weathered shale using first cycle values. This is due to the latters are
too weak to perform second cycle.
For sandstone, the slake durability index is well correlated with
UCS except for slightly weathered sandstone. This might be due to 1
cycles tests have negligible effect on this type of material hence led
to inaccurate results. On the other hand, the correlation between
slake durability index of first cycle and UCS is agreeable for shale,
although small scatter can be found for moderately weathered shale.
It also can be seen that slake durability index is more appropriate to
be used for weak rock compared to strong rock. Hence, it is
recommended that the slake durability index can be used to estimate
UCS values for both sandstone and shale with weathering states
beyond slightly weathered state.
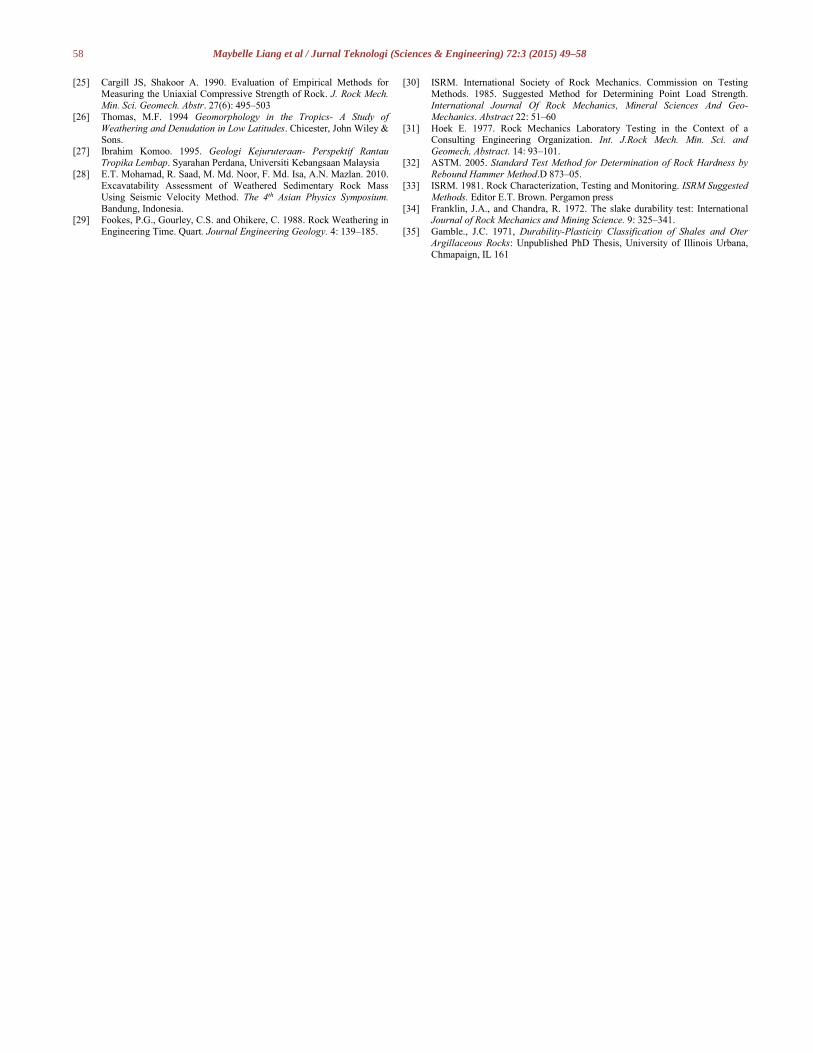
5.0 PROPOSED TEST PROCEDURES
Table 4 lists the summary of indirect tests which are appropriate to
be used for estimating UCS of sandstone and shale with different
weathering states. The shaded box
indicates the tests suitable to be used for this particular weathering
state by considering the possibility in sample preparing and good
correlation. Table 5 lists the empirical correlation equations which
can be used to estimate UCS values based on linear regression
analysis.
For estimating UCS values for tropically weathered sedimentary
rocks in Nusajaya, Malaysia, it is recommended that one should refer
to Table 4 for suitability for the indirect test selection. Different
indirect tests should be selected for different types of rock as well as
different states of weathering. After the selection of indirect tests to
be used, the UCS values can be estimated by referring to Table 5. The
empirical equations proposed herein are not exactly accurate in
estimating UCS values for tropically weathered sedimentary rocks but
sufficient adequate to give an insight for preliminary design.
6.0 CONCLUSIONS
Four different types of indirect tests have been conducted to justify
their suitability in estimating UCS values of tropically weathered
sedimentary rocks. Based on tests carried out, it was found that
majority of the indirect test values decrease with increasing
weathering states. Hence, it can be concluded that material strength
generally deteriorates with increase of weathering states. However,
some of the indirect tests carried out herein are too insensitive such as
Rebound hammer test which showed large inaccuracies in estimating
UCS values for tropically weathered sedimentary rocks. The use of
PLT in estimating UCS values for sandstones is promising but less
effective for shale. For Brazilian test, it was found that good
correlation can be found for ITS and UCS. The slake durability test
suggested good correlation with UCS for very weak material. The
accuracy is not pronounced for stronger rocks.
Based on the analysis carried out herein, the suitability of each
indirect test was proposed for each different rock types with
corresponding weathering states. The empirical equations for each
indirect test to predict UCS values of tropically weathered
sedimentary rocks are then proposed. It is clearly shown in this study
that no single testing method can be used to predict the UCS values
for all weathering grades.
(a) Sandstone
0
20
40
60
80
100
0 1 2 3 4
UC
S (M
Pa)
Is50 (MPa)
Slightly weathered
Moderately weathered
Highly weathered
Completely weathered
56 Maybelle Liang et al / Jurnal Teknologi (Sciences & Engineering) 72:3 (2015) 49–58
(b) Shale
Figure 3 Correlation between Is50 and UCS
(a) Sandstone
(b) Shale
Figure 4 Correlation between R and UCS
(a) Sandstone
(b) Shale
Figure 5 Correlation between ITS and UCS
(a) Sandstone
0
5
10
15
20
25
0 0.5 1
UC
S (M
Pa)
Is50 (MPa)
Moderately weathered
Highly weathered
Completely weathered
0
10
20
30
40
50
60
70
80
90
0.00 10.00 20.00 30.00 40.00
UC
S (M
Pa)
R
Slightly weathered
Moderately weathered
Highly weathered
Completely weathered
0
5
10
15
20
0.00 2.00 4.00 6.00 8.00
UC
S (M
Pa)
R
Moderately weathered
Highly weathered
Completely weathered
0
20
40
60
80
100
120
140
0 2 4
UC
S (M
Pa)
ITS (MPa)
Slightly weathered
Moderately weathered
Highly weathered
Completely weathered
0
5
10
15
20
0 0.5 1 1.5
UC
S (M
Pa)
ITS (MPa)
Moderately weathered
Highly weathered
Completely weathered
0
10
20
30
40
50
60
70
80
90
0.0 20.0 40.0 60.0 80.0 100.0
UC
S (M
Pa)
Slake durability index (%)
Slightly weathered
Moderately weathered
Highly weathered
Completely weathered
57 Maybelle Liang et al / Jurnal Teknologi (Sciences & Engineering) 72:3 (2015) 49–58
(b) Shale
Figure 6 Correlation between Id to UCS
Table 4 Suitability of indirect tests in estimating UCS
(a)Sandstone
Weathering states (Sandstone)
Testing Slightly Moderately Highly Completely
PLT
R
ITS
Id2
(b)Shale
Weathering states (Shale)
Testing Slightly Moderately Highly Completely
PLT
R
ITS
Id1
Table 5 Empirical equations for estimation of UCS
(a)Sandstone
Weathering states (Sandstone)
Testing Equation R2
PLT UCS = 19.122Is50 + 3.2906 (5) 0.9239
Id UCS = 0.3 Id2 -2.87 (6) 0.6214
(b)Shale
Weathering states (Sandstone)
Testing Equation R2
ITS UCS = 15.588ITS + 0.7169 (7) 0.9239
Id UCS = 0.2466Id1 – 0.5707 (8) 0.8749
References [1] Romana, M. 1999. Correlation between Unconfined Compressive and Point-
load (Miller tests) Strengths for Different Rock Classes. 9th ISRM Congress.
1. Balkema, Paris. 673–676.
[2] Kahraman, S., Fener, M., and Kozman, E. 2012. Predicting the Compressive
and Tensile Strength of Rocks from Indentation Hardness Index. Journal of
the Southern African Institute of Mining and Metallurgy. 112(5): 331–339.
[3] Ceryan, N., Okkan, U., and Kesimal., A. 2012. Prediction of Unconfined
Compressive Strength of Carbonate Rocks using Artificial Neural Networks. Environ Earth Sci. DOI: 10.1007/s12665-012-1783-z.
[4] Broch, E., and Franklin, J.A. 1972. The Point Load Strength Test.
International Journal of Rock Mechanic and Mining. 9: 669–697.
[5] Bieniawski, Z.T. 1975. The Point Load Test in Geotechnical Practice.
Engineering Geology. 9: 1–11.
[6] Brook, N. 1985. The Equivalent Core Diameter Method of Size and Shape
Correction in Point Load Testing. International Journal of Rock Mech. Min.Sci. & Geomech. Abstr. 22: 61–70.
[7] ISRM. 1985. Suggested Method for Determining Point Load Strength. ISRM
Commission on Testing Methods, Working Group on Revision of The Point
Load Test Method. International J. Rock. Mech. Min. Sci & Geomech. Abstr.
22: 51–60.
[8] Miller, RP. 1965. Engineering Classification and Index Properties for Intact
Rock. PhD thesis, University of Illinois.
[9] Deere, DU. and Miller, RP. 1966. Engineering Classification and Index Properties for Intact Rocks. Tech Rep Air Force Weapons Lab, New Mexico,
no AFNL-TR. 65–116.
[10] Kindybinski, A. 1980. Bursting Liability Indices of Coal. Int. J. Rock Mech.
Min. Sci. Geomech. Abstr. 17: 167–161.
[11] Ghose, A.K. and Chakraborti, S. 1986. Empirical Strength Indices of Indian
Coals – An Investigation. Proceedings of 27th US symposium on rock
mechanics. Balkema, Rotherdam, 59–61.
[12] Sachpazis, C.I. 1990. Correlating Schmidt Hammer Rebound Number with Compressive Strength and Young’s Modulus of Carbonate Rocks. Bull Int.
Assoc. Eng. Geol. 42:75–83.
[13] Aggistalis, G., Alivizatos, A., Stamoulis, D. and Stournaras, G. 1996.
Correlating Uniaxial Compressive Strength with Schmidt Hammer Rebound
Number, Point Load Index, Young’s Modulus, And Mineralogy of Gabbros
and Basalts (Northern Greece). Bull Eng. Geol. 54: 3–11.
[14] Katz, O., Reches, Z. and Roegiers, J.C. 2000. Evaluation of Mechanical Rock Properties Using Schmidt Hammer. Int. J. Rock Mech. Min. Sci. 37: 723–
728.
[15] Kilic, A. and Teymen, A. 2008. Determination of Mechanical Properties of
Rocks Using Simple Methods. Bull Eng. Geol. Environment. 67: 237–244.
[16] Sheorey, P. R. 1997 Empirical Rock Failure Criteria. Rotterdam: A.A.
Balkema. 176p.
[17] Romana, M. 1999. Correlation between Unconfined Compressive and Point-
Load (Miller tests) Strengths for Different Rock Classes. In: 9th ISRM Congress. 1: 673–676. Balkema, Paris.
[18] Kahraman, S., Fener, M., & Kozman, E. 2012. Predicting the Compressive
and Tensile Strength of Rocks from Indentation Hardness Index. Journal of
the Southern African
[19] Farah, R. 2011 Correlations between Index Properties and Unconfined
Compressive Strength of Weathered Ocala Limestone. UNF Theses and
Dissertations. Paper 142 [20] Altindag, R., and Guney, A. 2010 Predicting the Relationships between
Brittleness and Mechanical Properties (UCS, TS and SH) of Rocks. Scientific
Research and Essays. 5(16): 2107–2118.
[21] Din, F., and Rafiq, M. 1997. Correlation between Compressive Strength and
Tensile Strength/ Index Strength of Some Rocks of North- west Frontier
Province (Limestone and Granite). Geological Bulletin, University of
Peshawar. 30: 183.
[22] Eigenbrod, K.D. 1972. Progressive Failure in Overconsolidated Clays and Mudstones. Ph.D Dissertation, University of Alberta, Edmonton, Alberta,
Canada.
[23] Bonelli R. 1989. .Relationship Between Engineering Properties And
Petrographic Characteristics Of Selected Sandstones. M.S.
Thesis,Department of Geology, Kent State University, Ohio
[24] Cargill JS, Shakoor A. Evaluation of Empirical Methods for Measuring the
Uniaxial Compressive Strength of Rock. J. Rock Mech. Min. Sci.
0
2
4
6
8
10
12
14
16
18
0.00 20.00 40.00 60.00 80.00
UC
S (M
Pa)
Slake durability index (%)
Moderately weathered
Highly weathered
Completely weathered
58 Maybelle Liang et al / Jurnal Teknologi (Sciences & Engineering) 72:3 (2015) 49–58
[25] Cargill JS, Shakoor A. 1990. Evaluation of Empirical Methods for
Measuring the Uniaxial Compressive Strength of Rock. J. Rock Mech.
Min. Sci. Geomech. Abstr. 27(6): 495–503
[26] Thomas, M.F. 1994 Geomorphology in the Tropics- A Study of
Weathering and Denudation in Low Latitudes. Chicester, John Wiley & Sons.
[27] Ibrahim Komoo. 1995. Geologi Kejuruteraan- Perspektif Rantau
Tropika Lembap. Syarahan Perdana, Universiti Kebangsaan Malaysia
[28] E.T. Mohamad, R. Saad, M. Md. Noor, F. Md. Isa, A.N. Mazlan. 2010.
Excavatability Assessment of Weathered Sedimentary Rock Mass
Using Seismic Velocity Method. The 4th Asian Physics Symposium.
Bandung, Indonesia. [29] Fookes, P.G., Gourley, C.S. and Ohikere, C. 1988. Rock Weathering in
Engineering Time. Quart. Journal Engineering Geology. 4: 139–185.
[30] ISRM. International Society of Rock Mechanics. Commission on Testing
Methods. 1985. Suggested Method for Determining Point Load Strength.
International Journal Of Rock Mechanics, Mineral Sciences And Geo-
Mechanics. Abstract 22: 51–60
[31] Hoek E. 1977. Rock Mechanics Laboratory Testing in the Context of a Consulting Engineering Organization. Int. J.Rock Mech. Min. Sci. and
Geomech, Abstract. 14: 93–101.
[32] ASTM. 2005. Standard Test Method for Determination of Rock Hardness by
Rebound Hammer Method.D 873–05.
[33] ISRM. 1981. Rock Characterization, Testing and Monitoring. ISRM Suggested
Methods. Editor E.T. Brown. Pergamon press
[34] Franklin, J.A., and Chandra, R. 1972. The slake durability test: International Journal of Rock Mechanics and Mining Science. 9: 325–341.
[35] Gamble., J.C. 1971, Durability-Plasticity Classification of Shales and Oter
Argillaceous Rocks: Unpublished PhD Thesis, University of Illinois Urbana,
Chmapaign, IL 161