jab kimia fakulti sains - official web portal of … kimia analisis 1 lokasi 2 makmal kimia tak...
TRANSCRIPT
KUMPULAN KIK
JAB KIMIA FAKULTI SAINS
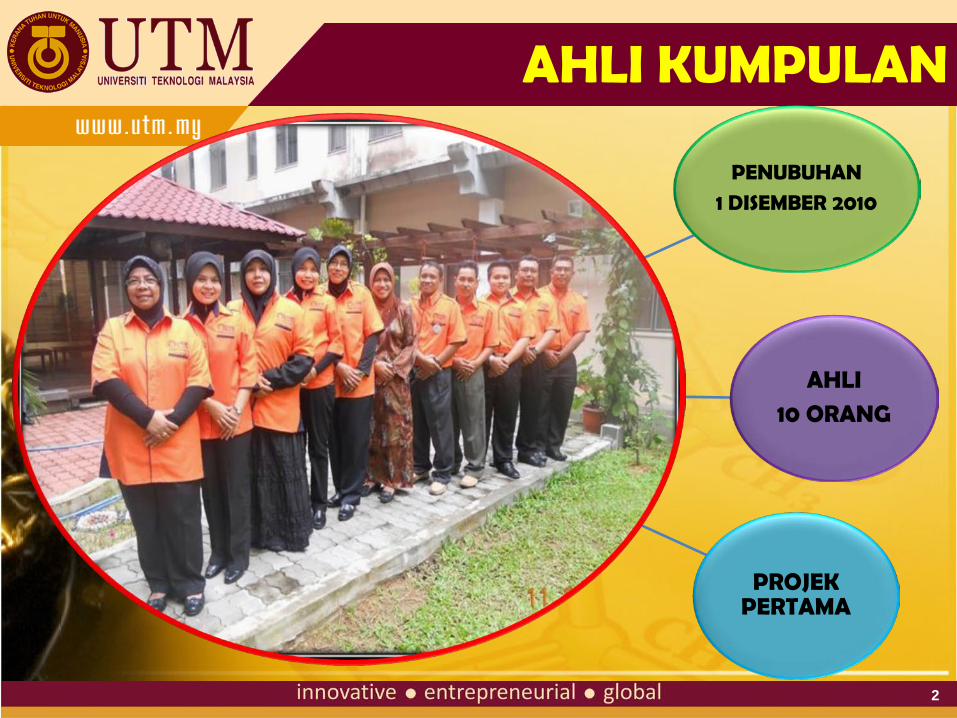
AHLI KUMPULAN
2
PENUBUHAN
1 DISEMBER 2010
AHLI
10 ORANG
PROJEK PERTAMA
TAJUK PROJEK
3
PEMBAZIRAN AIR SEMASA
PROSES PENYULINGAN
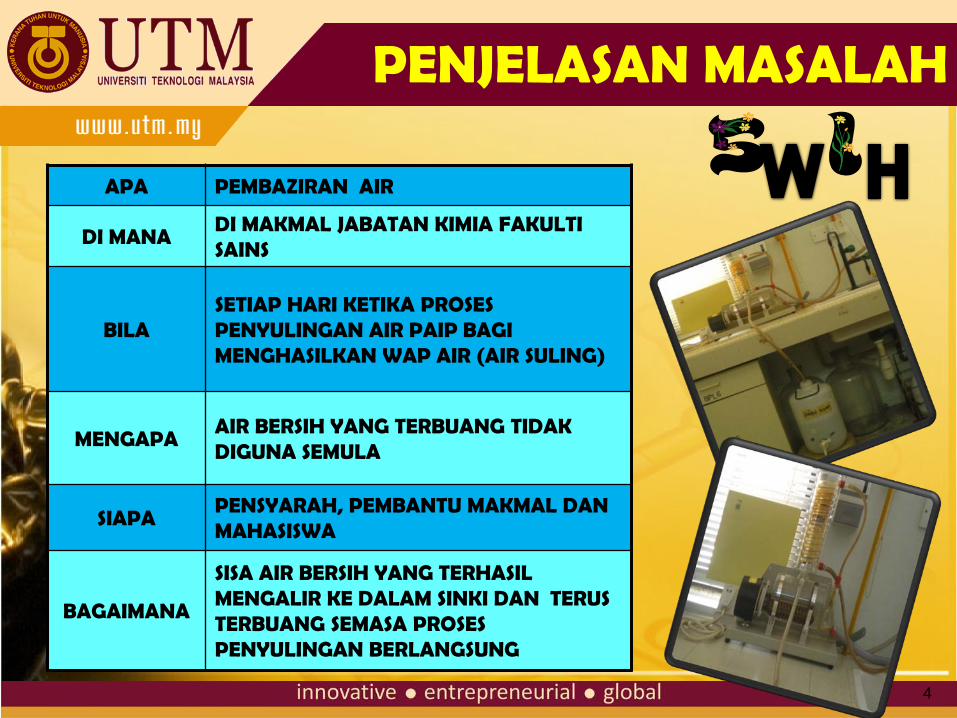
APA PEMBAZIRAN AIR
DI MANA DI MAKMAL JABATAN KIMIA FAKULTI SAINS
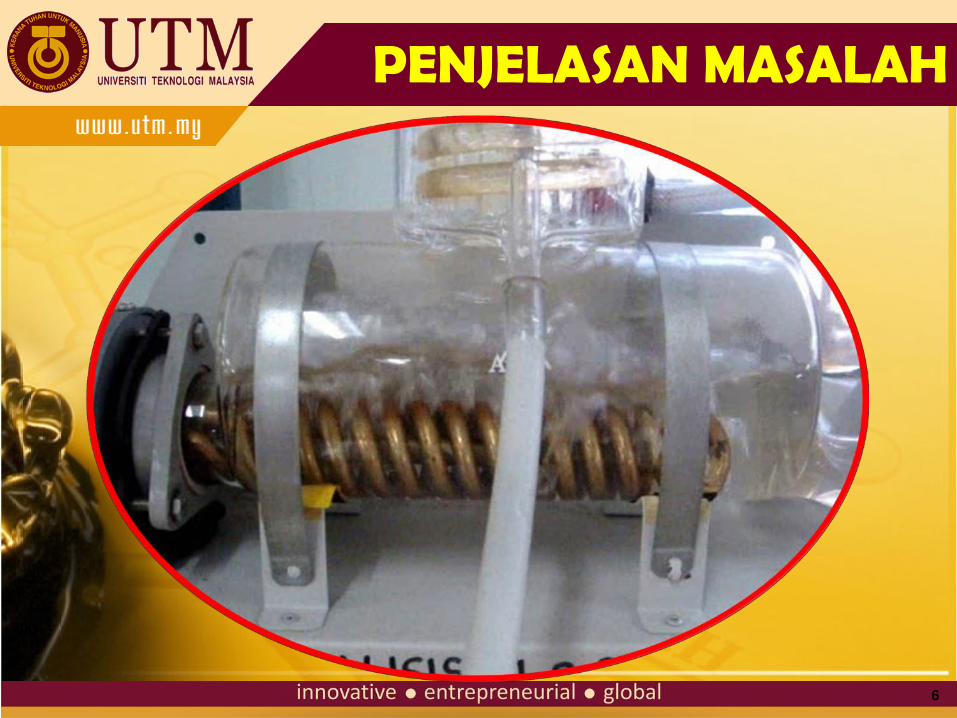
BILA SETIAP HARI KETIKA PROSES PENYULINGAN AIR PAIP BAGI MENGHASILKAN WAP AIR (AIR SULING)
MENGAPA AIR BERSIH YANG TERBUANG TIDAK DIGUNA SEMULA
SIAPA PENSYARAH, PEMBANTU MAKMAL DAN MAHASISWA
BAGAIMANA
SISA AIR BERSIH YANG TERHASIL MENGALIR KE DALAM SINKI DAN TERUS TERBUANG SEMASA PROSES PENYULINGAN BERLANGSUNG
4
PENJELASAN MASALAH
5
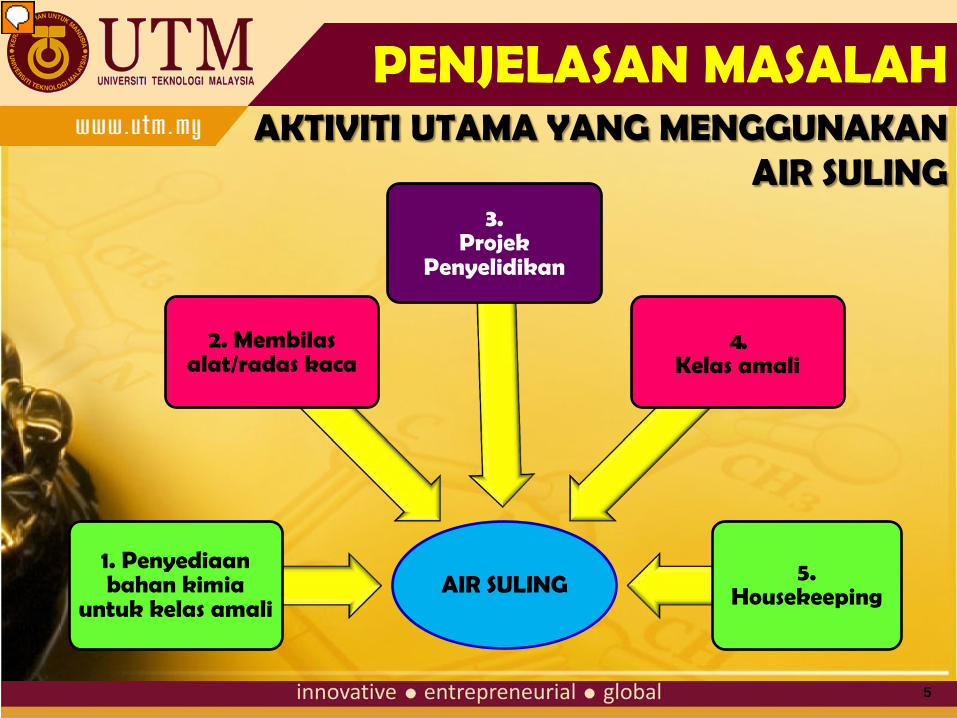
AKTIVITI UTAMA YANG MENGGUNAKAN AIR SULING
AIR SULING 1. Penyediaan bahan kimia
untuk kelas amali
2. Membilas alat/radas kaca
3. Projek
Penyelidikan
4. Kelas amali
5. Housekeeping
PENJELASAN MASALAH
6
PENJELASAN MASALAH
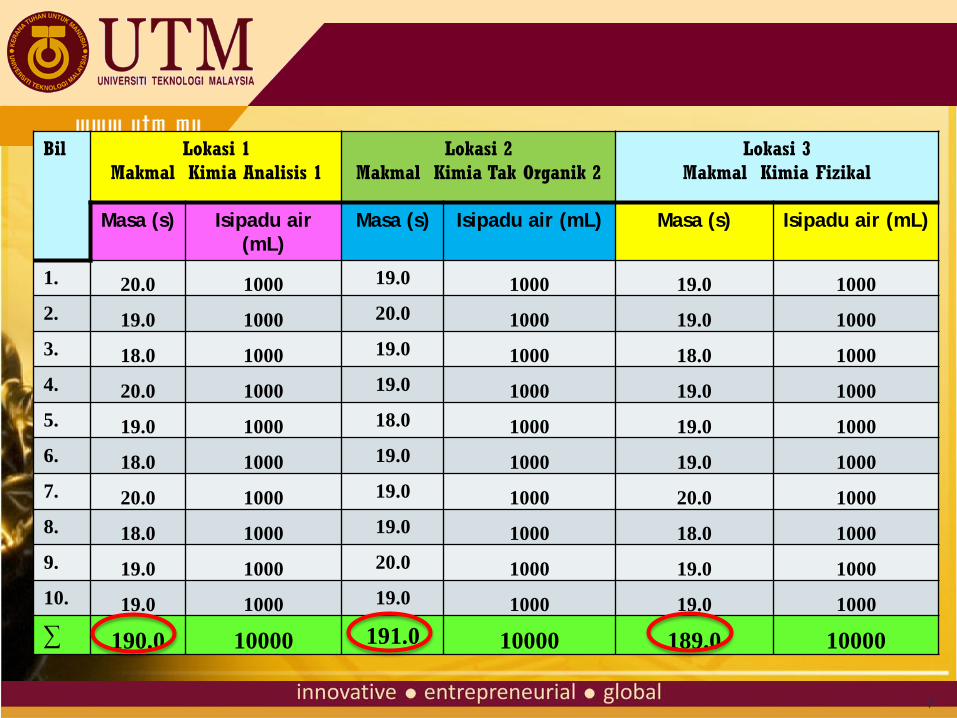
Bil Lokasi 1 Makmal Kimia Analisis 1
Lokasi 2 Makmal Kimia Tak Organik 2
Lokasi 3 Makmal Kimia Fizikal
Masa (s) Isipadu air (mL)
Masa (s) Isipadu air (mL) Masa (s) Isipadu air (mL)
1. 20.0 1000 19.0 1000 19.0 1000 2. 19.0 1000 20.0 1000 19.0 1000 3. 18.0 1000 19.0 1000 18.0 1000 4. 20.0 1000 19.0 1000 19.0 1000 5. 19.0 1000 18.0 1000 19.0 1000 6. 18.0 1000 19.0 1000 19.0 1000 7. 20.0 1000 19.0 1000 20.0 1000 8. 18.0 1000 19.0 1000 18.0 1000 9. 19.0 1000 20.0 1000 19.0 1000 10. 19.0 1000 19.0 1000 19.0 1000 ∑ 190.0 10000 191.0 10000 189.0 10000
7
8
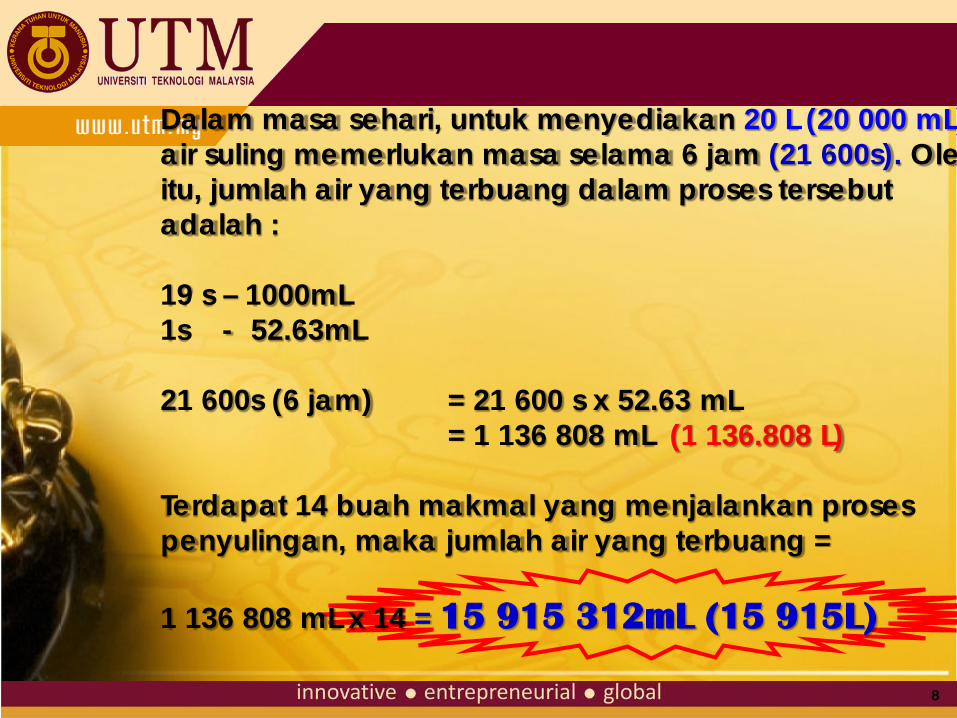
Dalam masa sehari, untuk menyediakan 20 L (20 000 mL) air suling memerlukan masa selama 6 jam (21 600s). Ole itu, jumlah air yang terbuang dalam proses tersebut adalah : 19 s – 1000mL 1s - 52.63mL 21 600s (6 jam) = 21 600 s x 52.63 mL = 1 136 808 mL (1 136.808 L) Terdapat 14 buah makmal yang menjalankan proses penyulingan, maka jumlah air yang terbuang = 1 136 808 mL x 14 = 15 915 312mL (15 915L)
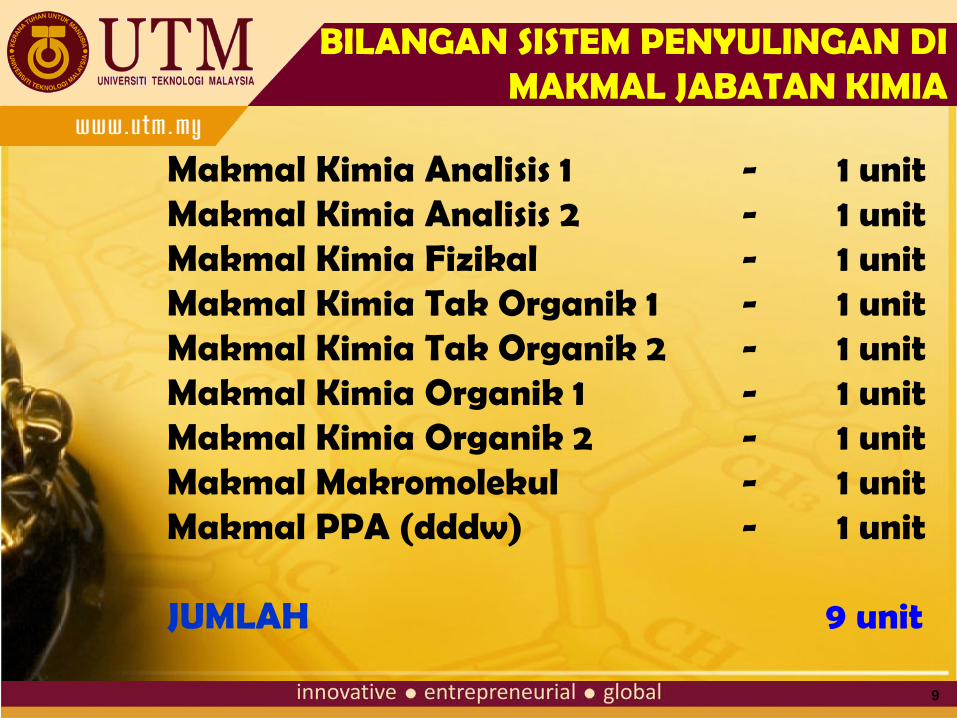
Makmal Kimia Analisis 1 - 1 unit Makmal Kimia Analisis 2 - 1 unit Makmal Kimia Fizikal - 1 unit Makmal Kimia Tak Organik 1 - 1 unit Makmal Kimia Tak Organik 2 - 1 unit Makmal Kimia Organik 1 - 1 unit Makmal Kimia Organik 2 - 1 unit Makmal Makromolekul - 1 unit Makmal PPA (dddw) - 1 unit JUMLAH 9 unit
9
BILANGAN SISTEM PENYULINGAN DI MAKMAL JABATAN KIMIA
10
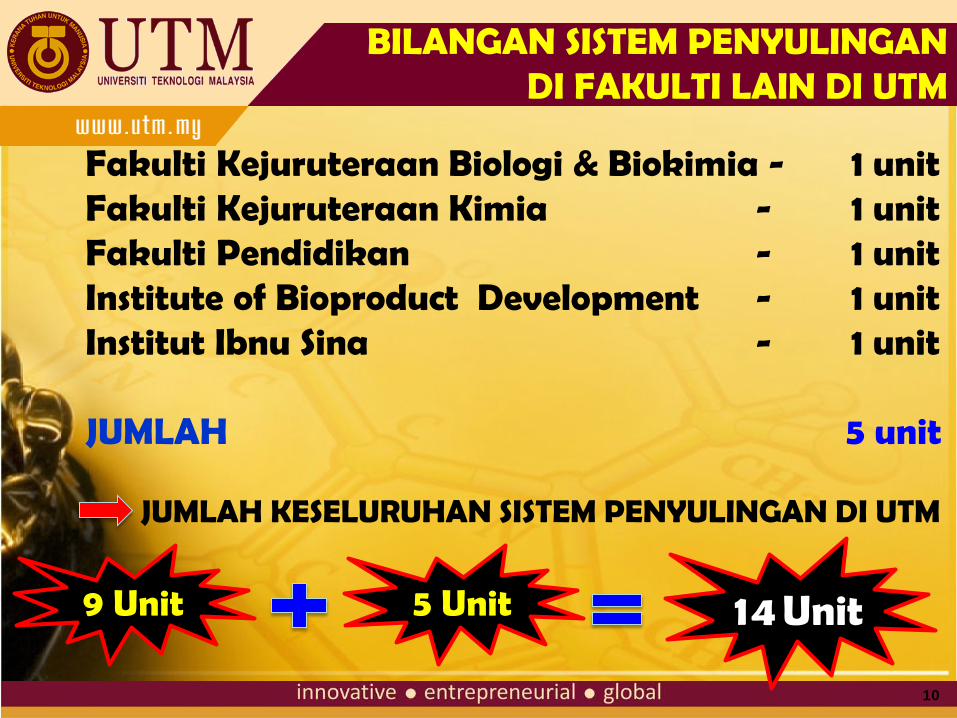
Fakulti Kejuruteraan Biologi & Biokimia - 1 unit Fakulti Kejuruteraan Kimia - 1 unit Fakulti Pendidikan - 1 unit Institute of Bioproduct Development - 1 unit Institut Ibnu Sina - 1 unit JUMLAH 5 unit
JUMLAH KESELURUHAN SISTEM PENYULINGAN DI UTM
9 Unit 5 Unit 14 Unit
BILANGAN SISTEM PENYULINGAN DI FAKULTI LAIN DI UTM
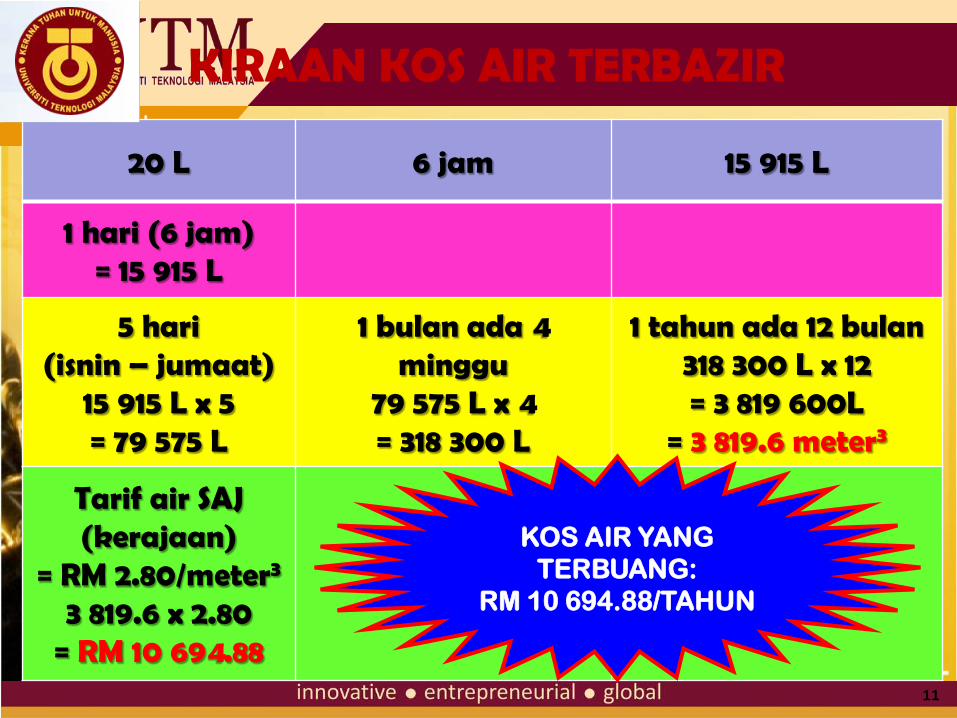
20 L 6 jam 15 915 L
1 hari (6 jam) = 15 915 L
5 hari (isnin – jumaat)
15 915 L x 5 = 79 575 L
1 bulan ada 4 minggu
79 575 L x 4 = 318 300 L
1 tahun ada 12 bulan 318 300 L x 12 = 3 819 600L
= 3 819.6 meter3
Tarif air SAJ (kerajaan)
= RM 2.80/meter3
3 819.6 x 2.80 = RM 10 694.88
KOS AIR YANG
TERBUANG: RM 10 694.88/TAHUN
11
KIRAAN KOS AIR TERBAZIR
12
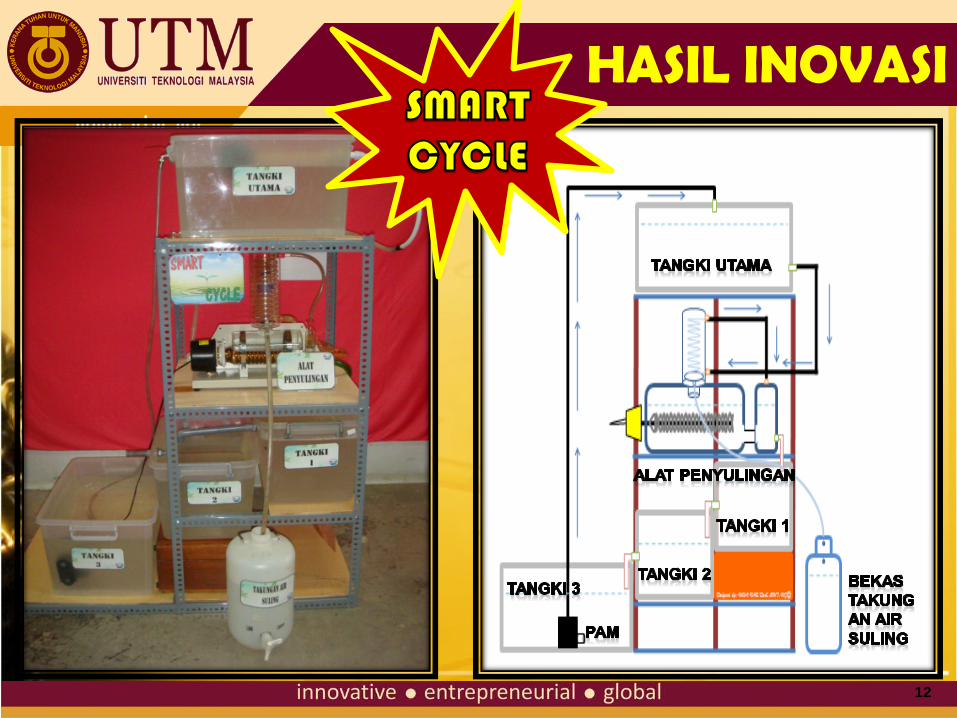
HASIL INOVASI
13
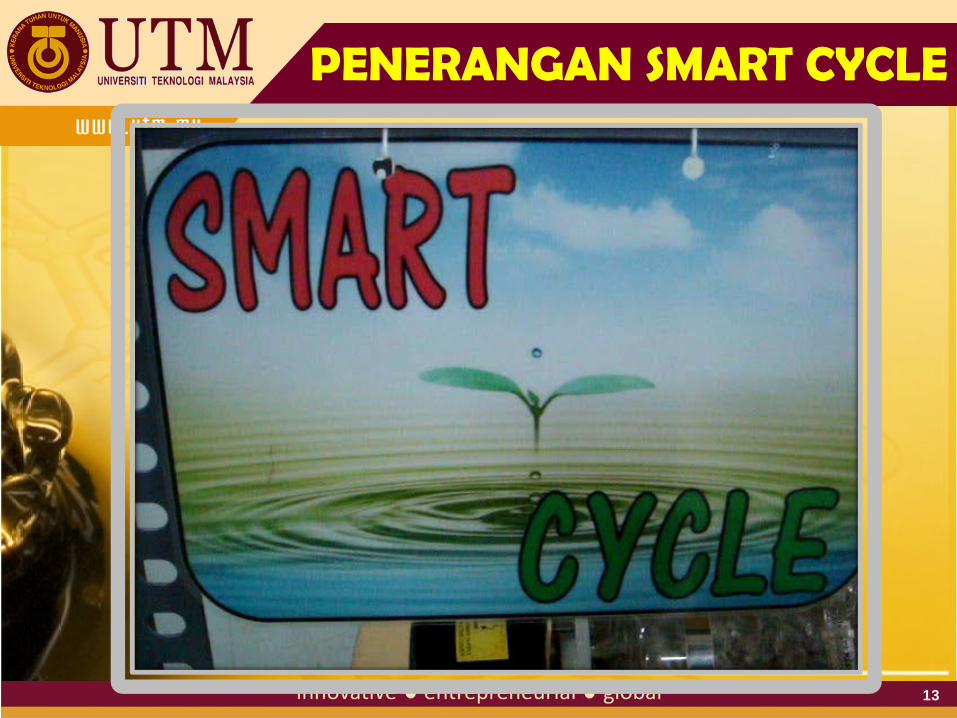
PENERANGAN SMART CYCLE
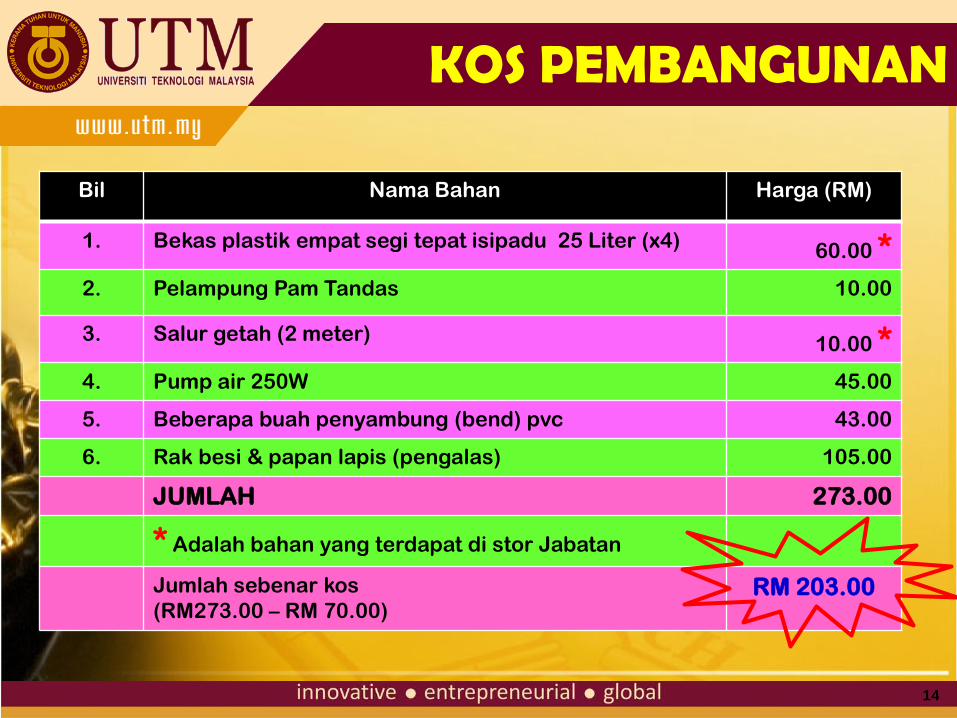
Bil Nama Bahan Harga (RM)
1. Bekas plastik empat segi tepat isipadu 25 Liter (x4) 60.00 * 2. Pelampung Pam Tandas 10.00
3. Salur getah (2 meter) 10.00 * 4. Pump air 250W 45.00
5. Beberapa buah penyambung (bend) pvc 43.00
6. Rak besi & papan lapis (pengalas) 105.00
JUMLAH 273.00
* Adalah bahan yang terdapat di stor Jabatan
Jumlah sebenar kos (RM273.00 – RM 70.00)
RM 203.00
14
KOS PEMBANGUNAN
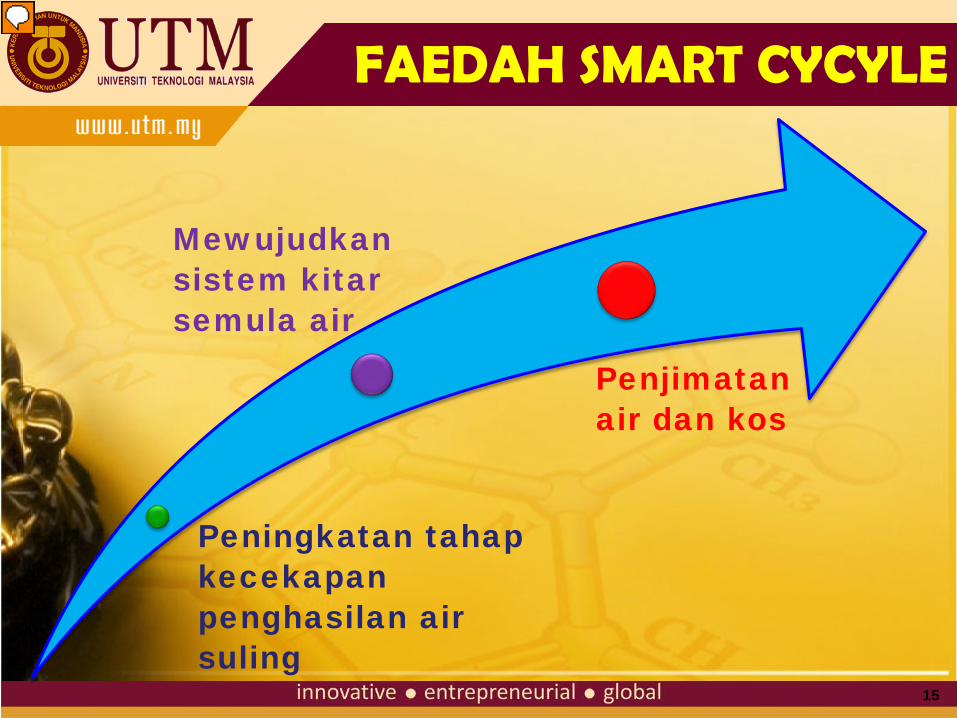
Peningkatan tahap kecekapan penghasilan air suling
Mewujudkan sistem kitar semula air
Penjimatan air dan kos
15
FAEDAH SMART CYCYLE
16 16
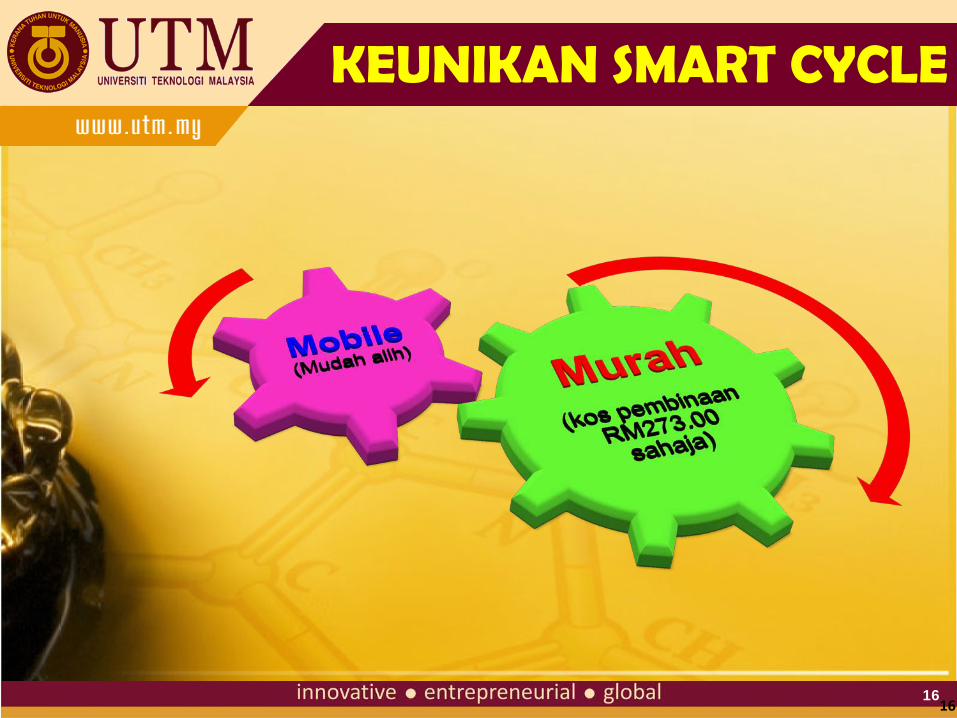
KEUNIKAN SMART CYCLE
17
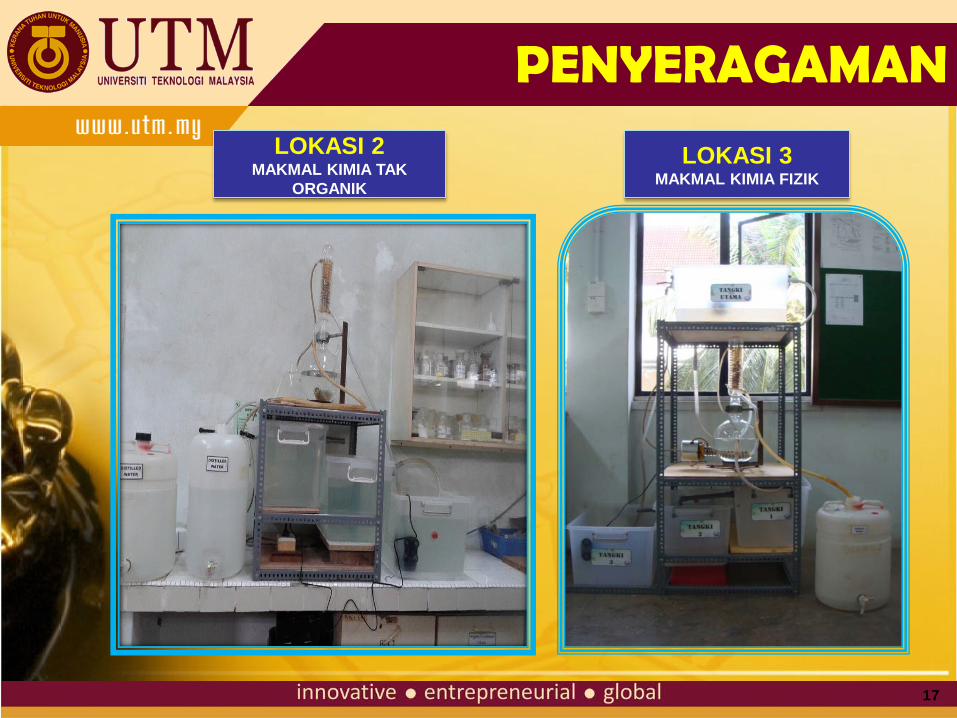
LOKASI 2 MAKMAL KIMIA TAK
ORGANIK
LOKASI 3 MAKMAL KIMIA FIZIK
PENYERAGAMAN
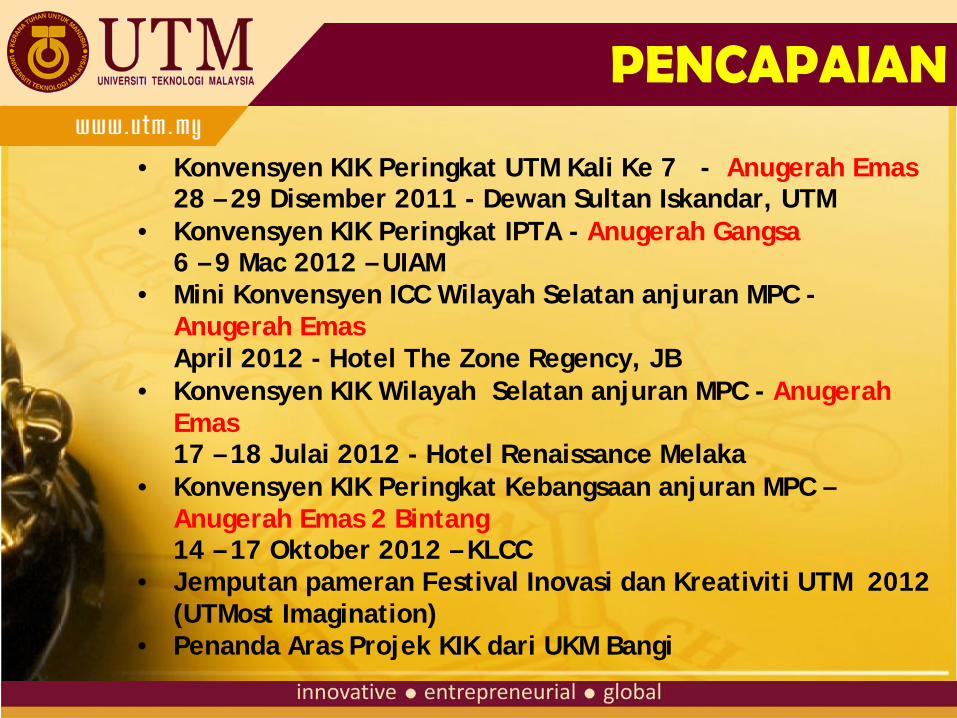
• Konvensyen KIK Peringkat UTM Kali Ke 7 - Anugerah Emas 28 – 29 Disember 2011 - Dewan Sultan Iskandar, UTM • Konvensyen KIK Peringkat IPTA - Anugerah Gangsa 6 – 9 Mac 2012 – UIAM • Mini Konvensyen ICC Wilayah Selatan anjuran MPC -
Anugerah Emas April 2012 - Hotel The Zone Regency, JB • Konvensyen KIK Wilayah Selatan anjuran MPC - Anugerah
Emas 17 – 18 Julai 2012 - Hotel Renaissance Melaka • Konvensyen KIK Peringkat Kebangsaan anjuran MPC –
Anugerah Emas 2 Bintang 14 – 17 Oktober 2012 – KLCC • Jemputan pameran Festival Inovasi dan Kreativiti UTM 2012
(UTMost Imagination) • Penanda Aras Projek KIK dari UKM Bangi
PENCAPAIAN
19
SEKIAN TERIMA KASIH