investigation of poverty indicators for designing case...
TRANSCRIPT
Int. J. Advance Soft Compu. Appl, Vol. 9, No. 2, July 2017
ISSN 2074-8523
Investigation of Poverty Indicators
for Designing Case Representation to
Determine Urban Poverty
Nurliyana Abd Manap, Zalmiyah Zakaria and Rohayanti Hassan
Faculty of Computing,
Universiti Teknologi Malaysia,
81310 Johor Bahru, Johor, Malaysia
e-mail: [email protected], [email protected],
Abstract
Poverty in Malaysia is a controversial economic issue. Although poverty alleviation strategies in Malaysia have been acclaimed success by United Nation Development Programme (UNDP, 2013), new form of poverty emerged in urban area as a result of rapid economic growth and development. Poverty is a multifaceted phenomenon and different societies have different perceptions of poverty. These will led to uncertainty in determining of poverty. Most of welfare institutions in Malaysia measure poverty from the monetary perspective using monthly income or expenditure. In practice, conventional institutions such as Jabatan Kebajikan Masyarakat Malaysia (JKMM) use monetary approach in determining poverty through the Poverty Line Income (PLI). While, Islamic institutions adopt the monetary approach in determining poverty using Had Al-Kifayah (HAK). The objective of this paper is to explain the concept and analyze the uncertainty factors that have contributed to the incidence of poverty in urban area using PLI and HAK method. This study would highlight the similarities and differences of both the methods. A survey aided by a structured questionnaire was carried out on 300 selected households in the state of Kuala Lumpur and 150 household datasets are obtained from Department of Zakat, Islamic Center, UTM, Johor. This empirical study will able to use in designing case representation for case-based reasoning that will be implemented in future work.
Keywords: Urban Poverty, Multidimensional, Uncertainty, Conventional Measure, Islamic Measure, Poverty Line Income, Had Al-Kifayah.
91 Investigation of Poverty Indicators
1 Introduction
The poverty issue of the general population has remained a big challenge since
human civilization. Poverty is still a continuous issue in Asia and is on the rise in
some countries which in turn is further worsening the access of the poor to the
economic opportunities through which they could build up their assets and
enhance income in order to come out of the poverty cycle [1]. The rapid growing
countries like Malaysia have made remarkable progress in the field of economics
and have resolved the issue of inequality, gender disparity and financial exclusion
on a wider scale. The incidence of poverty has alleviated at large but rapid
growth, rural urban migration and urban expansion has posed new challenges of
urban poverty on rapid growing economics [2].
Poverty is a multifaceted phenomenon and different societies have different
perceptions of poverty. Basically, poverty is often considered as lacking or
deficiency of economic resources. For many years this situation is explained
through income perspective. However, poverty is no longer objectively defined
but exists in a multidimensional condition [3]. In Malaysia, poverty is commonly
determined by using poverty line based on monetary approach which assesses on
minimum consumption levels for survival. A household is considered poor if its
income falls below that line. However, monetary often lacks on providing
deprivations in other dimensions. On the other hand, the multidimensional poverty
measure considers deprivations experiences of poor people such as poor health,
income deficiency, insufficient living standard and inadequate education and how
they interrelate.
This study sees Malaysia has adopted two guidelines in determining the poverty
whereby classification of poor is determined through conventional and Islamic
perspectives and poverty classification is drawn into three classes namely:
i. Needy or hard-core poor – one who has neither material possessions, one
who are suffers and has no means to sustain his or her daily needs.
ii. Poor – one who has insufficient to meet his or her basic needs.
iii. Non-poor – one who has sufficient to meet his or her basic needs.
In poverty determination, there has a complexity to understand the dimensions
experienced by poor households which it is often changed and uncertainty.
Therefore, this paper will examine and analyze the present poverty measurement
practiced by conventional and Islamic institutions in Malaysia and propose non-
monetary factors that relate to multidimensional phenomena of urban poverty
based on household data collection. This paper is organized as follows. The next
section outlines the concept of two difference poverty measurement methods
whereas the methodology undertaken in this study is explained in section 3.
Section 4 presents the empirical results of the study. Finally, the conclusion of the
study is highlighted in section 5.
Nurliyana et al. 92
2 Poverty from Different Perspectives
The elimination of widespread poverty is at the core of all development problems
and in fact, for many people define the principal objective of development policy.
Poverty needs to be measured more precisely to provide a meaningful
understanding of how much progress has already been made, how much more
remains to be achieved, and how to set incentives for government officials to
focus on the most pressing needs. Malaysia, like most of the developing countries
define poverty in one-dimensional way, which is aggregates all household
achievement into a single variable of income or consumption level. In the past,
most welfare institutions in Malaysia uses the concept of the monetary approach
to measure poverty through the conventional poverty line income (PLI) method
and recently, Islamic organizations such as zakat institutions use had al-kifayah
(HAK) method using total necessities of a household from an Islamic perspective.
The similarities and differences between conventional and Islamic approach are
described in details as below.
2.1 Conventional perspective
Poverty in Malaysia is commonly conceptualized and operationalized from the
monetary approach perspective. The data presented by EPU is based on the
definition and measurement of poverty from the perspective of income using the
concept of poverty line income (PLI). The PLI or commonly known as the
poverty threshold in Malaysia is determined by the EPU, Prime Minister’s
Department. Individuals or households are under the poverty line will categorized
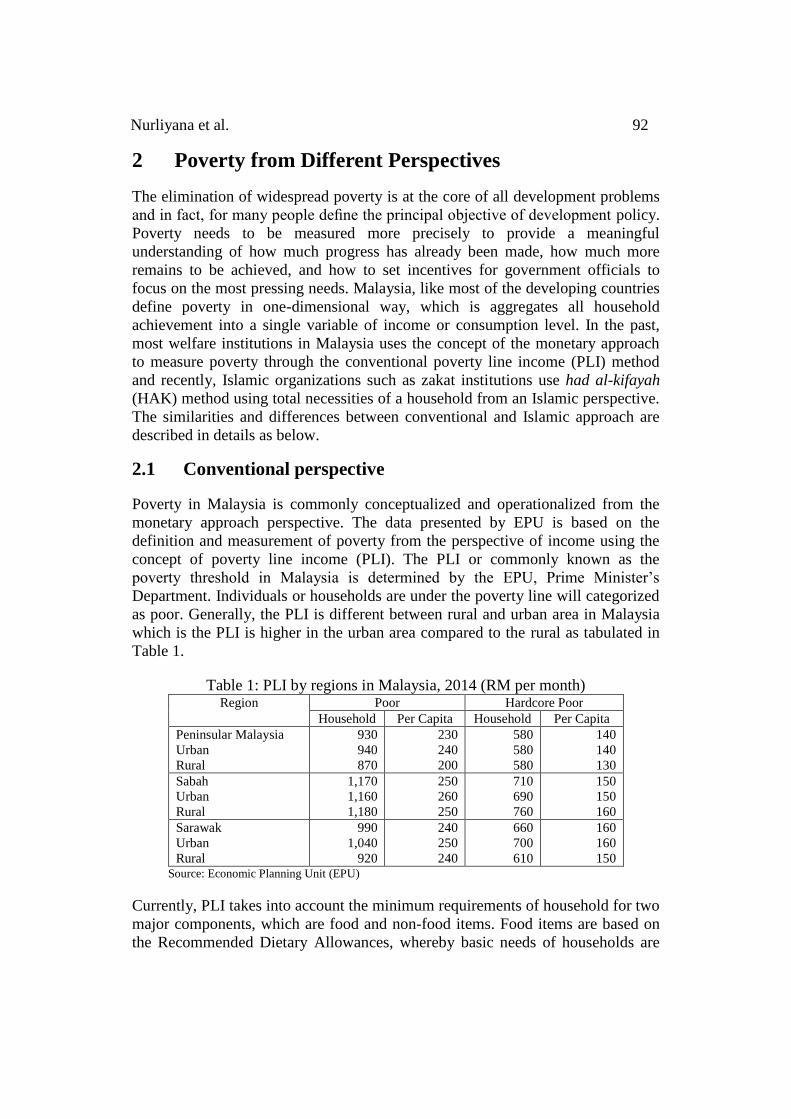
as poor. Generally, the PLI is different between rural and urban area in Malaysia
which is the PLI is higher in the urban area compared to the rural as tabulated in
Table 1.
Table 1: PLI by regions in Malaysia, 2014 (RM per month) Region Poor Hardcore Poor
Household Per Capita Household Per Capita
Peninsular Malaysia
Urban
Rural
930
940
870
230
240
200
580
580
580
140
140
130
Sabah
Urban
Rural
1,170
1,160
1,180
250
260
250
710
690
760
150
150
160
Sarawak
Urban
Rural
990
1,040
920
240
250
240
660
700
610
160
160
150 Source: Economic Planning Unit (EPU)
Currently, PLI takes into account the minimum requirements of household for two
major components, which are food and non-food items. Food items are based on
the Recommended Dietary Allowances, whereby basic needs of households are
93 Investigation of Poverty Indicators
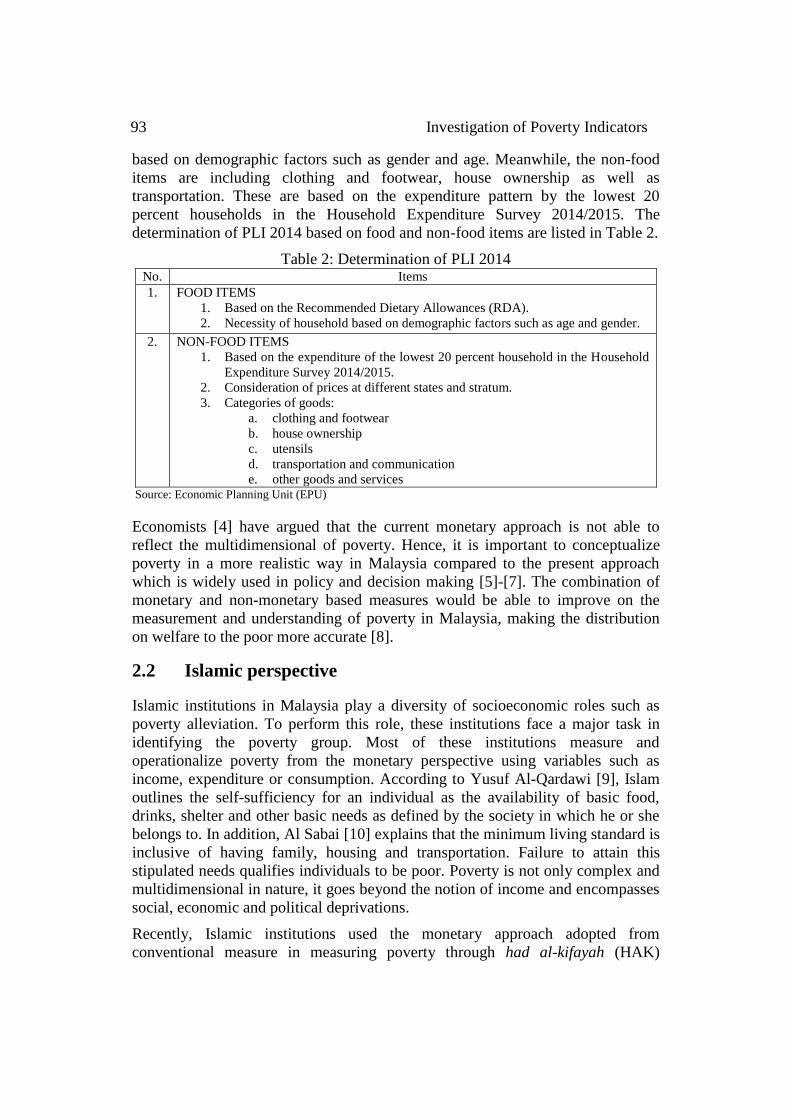
based on demographic factors such as gender and age. Meanwhile, the non-food
items are including clothing and footwear, house ownership as well as
transportation. These are based on the expenditure pattern by the lowest 20
percent households in the Household Expenditure Survey 2014/2015. The
determination of PLI 2014 based on food and non-food items are listed in Table 2.
Table 2: Determination of PLI 2014 No. Items
1. FOOD ITEMS
1. Based on the Recommended Dietary Allowances (RDA).
2. Necessity of household based on demographic factors such as age and gender.
2. NON-FOOD ITEMS
1. Based on the expenditure of the lowest 20 percent household in the Household
Expenditure Survey 2014/2015.
2. Consideration of prices at different states and stratum.
3. Categories of goods:
a. clothing and footwear
b. house ownership
c. utensils
d. transportation and communication
e. other goods and services Source: Economic Planning Unit (EPU)
Economists [4] have argued that the current monetary approach is not able to
reflect the multidimensional of poverty. Hence, it is important to conceptualize
poverty in a more realistic way in Malaysia compared to the present approach
which is widely used in policy and decision making [5]-[7]. The combination of
monetary and non-monetary based measures would be able to improve on the
measurement and understanding of poverty in Malaysia, making the distribution
on welfare to the poor more accurate [8].
2.2 Islamic perspective
Islamic institutions in Malaysia play a diversity of socioeconomic roles such as
poverty alleviation. To perform this role, these institutions face a major task in
identifying the poverty group. Most of these institutions measure and
operationalize poverty from the monetary perspective using variables such as
income, expenditure or consumption. According to Yusuf Al-Qardawi [9], Islam
outlines the self-sufficiency for an individual as the availability of basic food,
drinks, shelter and other basic needs as defined by the society in which he or she
belongs to. In addition, Al Sabai [10] explains that the minimum living standard is
inclusive of having family, housing and transportation. Failure to attain this
stipulated needs qualifies individuals to be poor. Poverty is not only complex and
multidimensional in nature, it goes beyond the notion of income and encompasses
social, economic and political deprivations.
Recently, Islamic institutions used the monetary approach adopted from
conventional measure in measuring poverty through had al-kifayah (HAK)
Nurliyana et al. 94
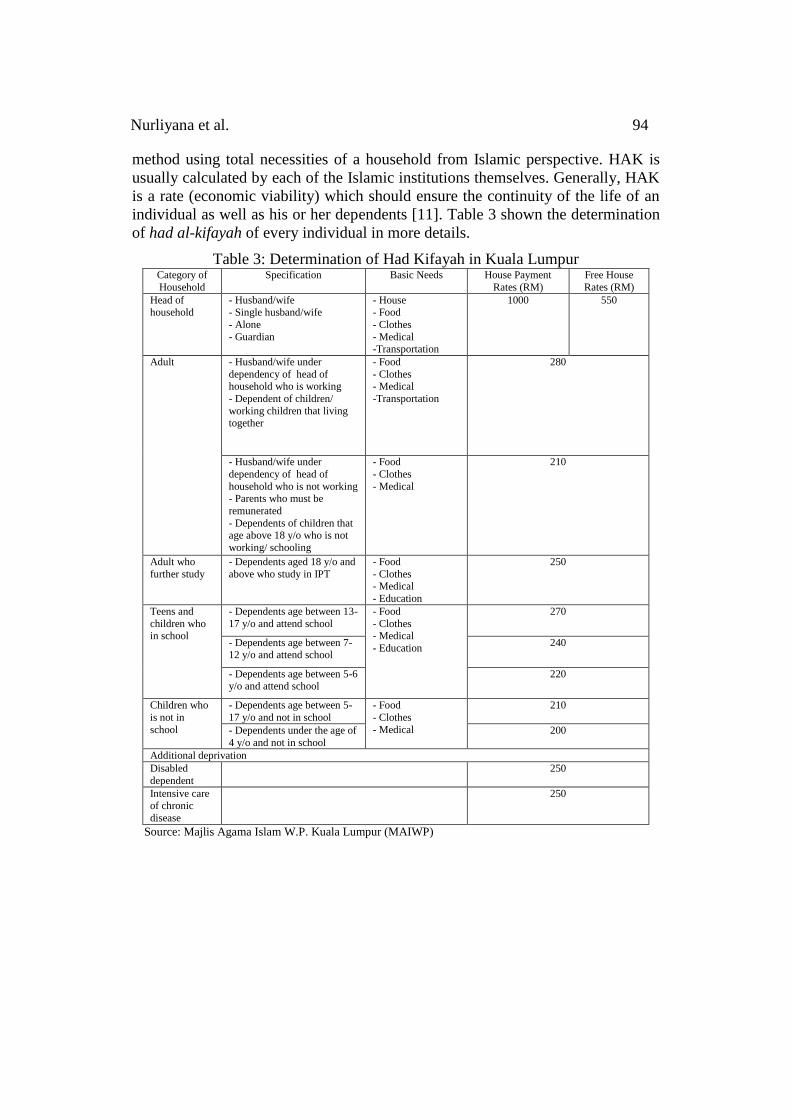
method using total necessities of a household from Islamic perspective. HAK is
usually calculated by each of the Islamic institutions themselves. Generally, HAK
is a rate (economic viability) which should ensure the continuity of the life of an
individual as well as his or her dependents [11]. Table 3 shown the determination
of had al-kifayah of every individual in more details.
Table 3: Determination of Had Kifayah in Kuala Lumpur Category of
Household
Specification Basic Needs House Payment
Rates (RM)
Free House
Rates (RM)
Head of
household
- Husband/wife
- Single husband/wife
- Alone
- Guardian
- House
- Food
- Clothes
- Medical -Transportation
1000 550
Adult - Husband/wife under
dependency of head of household who is working
- Dependent of children/
working children that living together
- Food
- Clothes - Medical
-Transportation
280
- Husband/wife under
dependency of head of
household who is not working - Parents who must be
remunerated
- Dependents of children that age above 18 y/o who is not
working/ schooling
- Food
- Clothes
- Medical
210
Adult who
further study
- Dependents aged 18 y/o and
above who study in IPT
- Food
- Clothes - Medical
- Education
250
Teens and
children who in school
- Dependents age between 13-
17 y/o and attend school
- Food
- Clothes - Medical
- Education
270
- Dependents age between 7-12 y/o and attend school
240
- Dependents age between 5-6 y/o and attend school
220
Children who
is not in
school
- Dependents age between 5-
17 y/o and not in school
- Food
- Clothes
- Medical
210
- Dependents under the age of
4 y/o and not in school
200
Additional deprivation
Disabled
dependent
250
Intensive care of chronic
disease
250
Source: Majlis Agama Islam W.P. Kuala Lumpur (MAIWP)
95 Investigation of Poverty Indicators
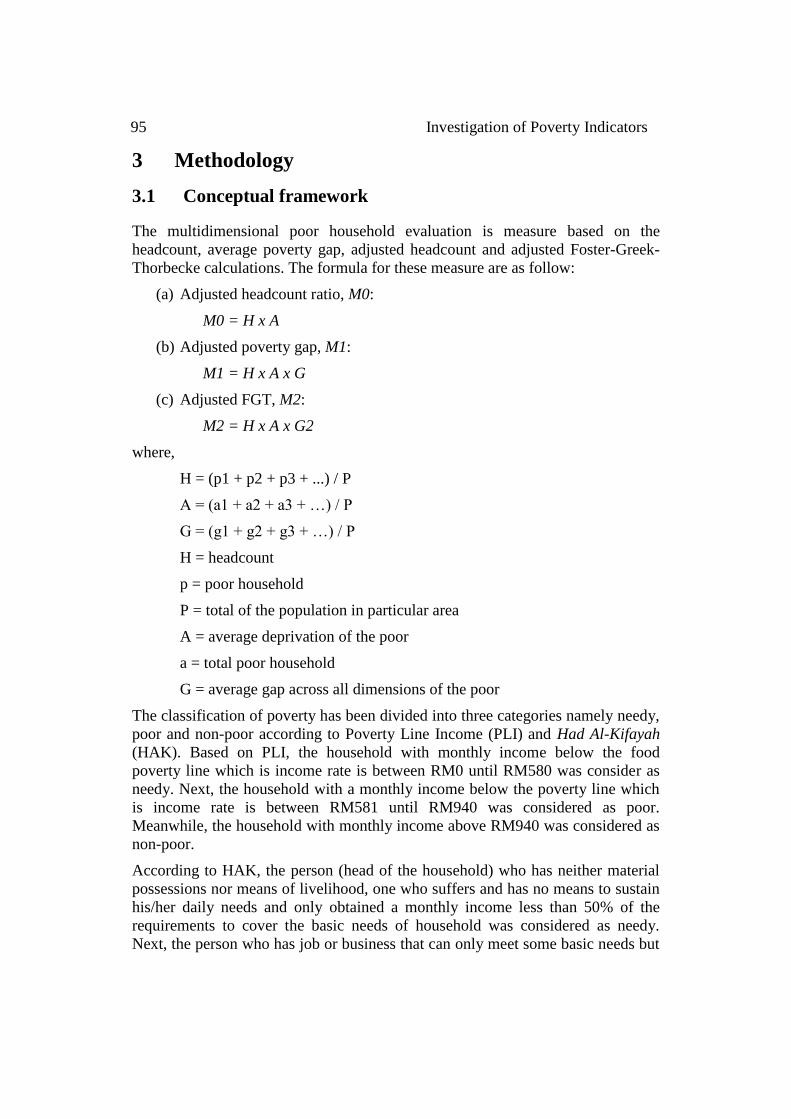
3 Methodology
3.1 Conceptual framework
The multidimensional poor household evaluation is measure based on the
headcount, average poverty gap, adjusted headcount and adjusted Foster-Greek-
Thorbecke calculations. The formula for these measure are as follow:
(a) Adjusted headcount ratio, M0:
M0 = H x A
(b) Adjusted poverty gap, M1:
M1 = H x A x G
(c) Adjusted FGT, M2:
M2 = H x A x G2
where,
H = (p1 + p2 + p3 + ...) / P
A = (a1 + a2 + a3 + …) / P
G = (g1 + g2 + g3 + …) / P
H = headcount
p = poor household
P = total of the population in particular area
A = average deprivation of the poor
a = total poor household
G = average gap across all dimensions of the poor
The classification of poverty has been divided into three categories namely needy,
poor and non-poor according to Poverty Line Income (PLI) and Had Al-Kifayah
(HAK). Based on PLI, the household with monthly income below the food
poverty line which is income rate is between RM0 until RM580 was consider as
needy. Next, the household with a monthly income below the poverty line which
is income rate is between RM581 until RM940 was considered as poor.
Meanwhile, the household with monthly income above RM940 was considered as
non-poor.
According to HAK, the person (head of the household) who has neither material
possessions nor means of livelihood, one who suffers and has no means to sustain
his/her daily needs and only obtained a monthly income less than 50% of the
requirements to cover the basic needs of household was considered as needy.
Next, the person who has job or business that can only meet some basic needs but
Nurliyana et al. 96
not enough for him/her and those under his/her charge and obtained 50% of
monthly income or more but not to meet real basic needs of household was
considered as poor. Finally, the person who has obtained 50% of monthly income
or more and meet real basic needs of household was considered as non-poor.
3.2 Data collection
The households data obtained from data collection are carried out in January and
February 2016. The targeted area is an urban region called Bandar Tasik Selatan,
situated in Kuala Lumpur and Johor Bahru, Johor. Kuala Lumpur is an urban area
form the most developed and economically fastest growing region in Malaysia
followed by Johor Bahru. A total of 300 questionnaires were distributed to the
targeted households around Bandar Tasik Selatan. The open and close-ended
questionnaire is designed with the specific aim to collect data that allows a better
specification and empirical testing of vulnerability to multidimensional poverty.
Respondents were asked to provide personal information such as their gender, age
and educational attainment, job status and households size. Specific questions
pertaining to social and economic indicators such as income, type of employment
and non-income wealth were also obtained. Then, data were run through
Microsoft Excel for analyzing survey questionnaire. While in Johor Bahru, a total
of 150 household datasets obtained from Department of Zakat, Islamic Center,
Universiti Teknologi Malaysia. In details, the data taken from the zakat
department is consists of student’s household data which has received financial
aid from the religious authorities in Johor. 200 datasets from both data source
were selected from the sampling unit comprising of past and present recipients of
aid by the religious authorities in Kuala Lumpur and Johor.
4 Empirical Results
This quantitative study use data derived from a targeted survey of households in
Kuala Lumpur and datasets obtained from Johor Bahru. The population in this
study is Muslim poor and destitute households. The data comprised on a variety of
household well-being issues gathered through structured questionnaire and
recorded data with head of household or other knowledgeable members. It delves
on household’s economic, social and demographic data using simple random
sampling technique. A representative’s sample was selected using proportionate
stratified random sampling technique with the household heads as respondents.
200 respondents were selected from the sampling unit comprising of past and
present recipients of aid by the religious authorities in Kuala Lumpur and Johor.
Next section provides descriptive analysis for the variables involved in this study.
All of the variables considered have quantitative value.
97 Investigation of Poverty Indicators
4.1 Descriptive statistics
In the initial stage of analysis data for data collection, this study used 100 samples
of households data derived from datasets in Kuala Lumpur specifically
household’s data in Bandar Tasik Selatan. This sample was selected using random
sampling technique. In this study, there are two guidelines used in determining
urban poor classification namely conventional and Islamic approach. Therefore,
this study compared the classification of poverty from conventional and Islamic
expert domain evaluation. Before interpreting the results from both approaches,
this section provides descriptive analysis for the variables involved in this study.
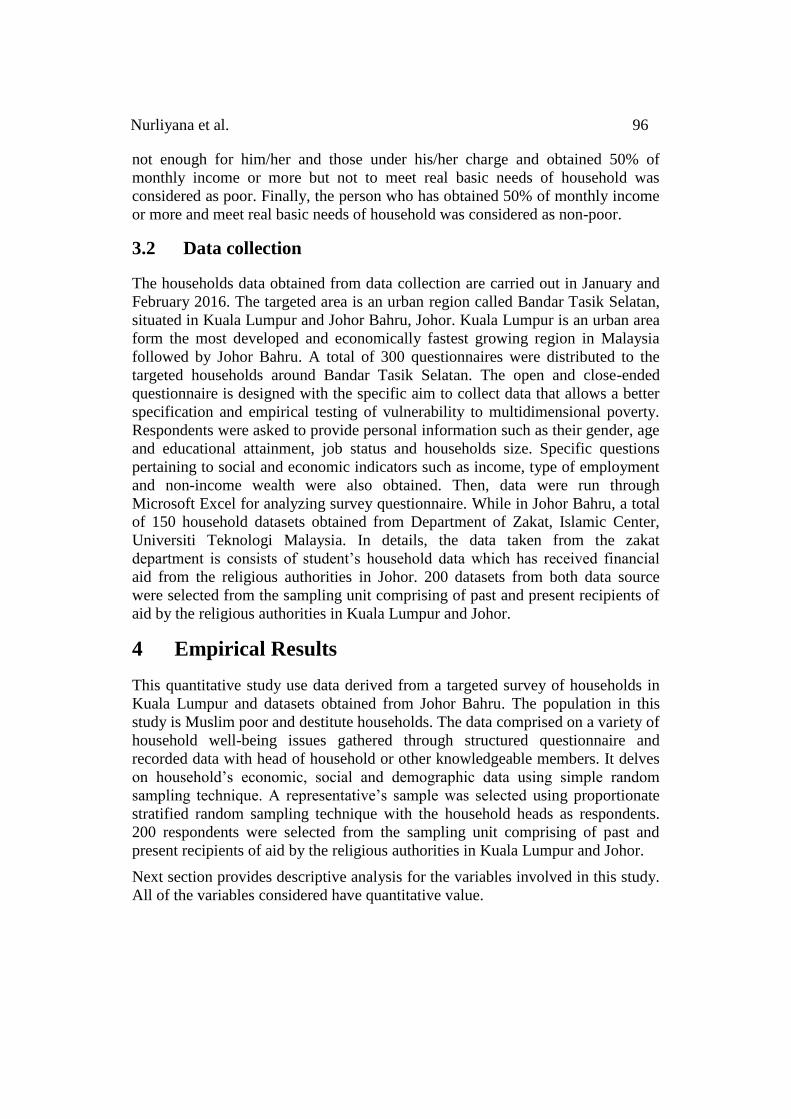
All of the variables considered have quantitative value. Table 4 shows the
descriptive analysis of 100 household’s data collection in Kuala Lumpur in
general.
Table 4: Descriptive analysis of household data collection Variable Mean Min Max Std. Dev
Monthly income 1627.40 750 4192 677.64
Education years 15.65 0 21 2.29
No. of income earner (s) 1.03 0 2 0.26
Dependent expenditure 1538.46 714 4587 700.65
Household population 6.19 3 13 1.76
Disabled dependent 0.15 0 3 0.46
Extensive care dependent 0.15 0 2 0.48
From the table above, the data on the monthly income variable shows the majority
of the families had an average monthly income of RM1627.40. The average years
of education of the heads of household were rightly skewed at an average of 16
years of education. This means that most of the heads of households finished their
high school studies before starting a family or earning money. Most of the
families had one breadwinner to support the family. The dependent expenditure
for most of the families was RM1538.46 per month, catering for three persons to a
maximum of thirteen persons per household. A minority of household had
disabled dependents and/or extensive care dependent (s), which would add to the
household’s monthly expenditure.
The standard deviation is a measure of variability; it is not a measure of central
tendency. Datasets that are highly clustered around the mean have lower standard
deviations than datasets that are spread out. The large standard deviation value for
the monthly income variable was RM677.64 and the dependent expenditure
variable was RM700.65 show that the distribution of income for each household
was varied. On the other hand, the number of income earner variable, disabled
dependent variable and the extensive care dependent variable showed a highly
clustered dataset whereby the number or persons involved was limited from one to
Nurliyana et al. 98
two persons only. Meanwhile, the standard deviation for the education years
variable and the household population variable were intermediate values at 2.29
years and two persons respectively.
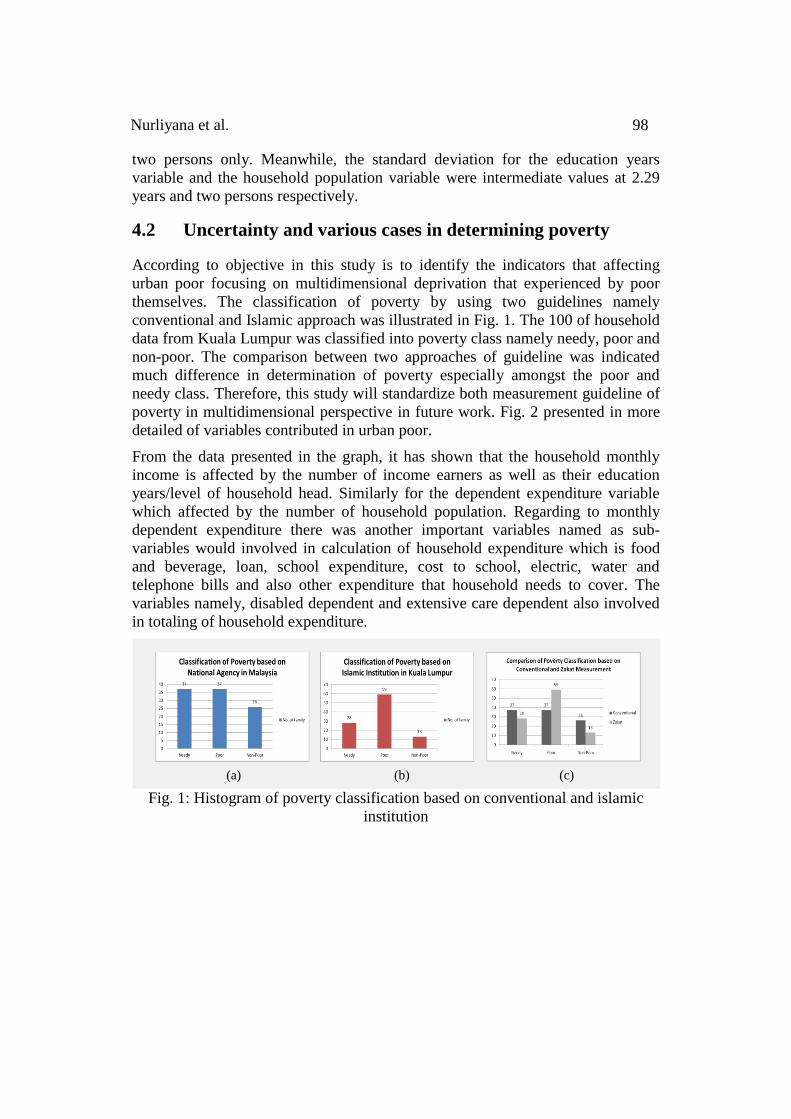
4.2 Uncertainty and various cases in determining poverty
According to objective in this study is to identify the indicators that affecting
urban poor focusing on multidimensional deprivation that experienced by poor
themselves. The classification of poverty by using two guidelines namely
conventional and Islamic approach was illustrated in Fig. 1. The 100 of household
data from Kuala Lumpur was classified into poverty class namely needy, poor and
non-poor. The comparison between two approaches of guideline was indicated
much difference in determination of poverty especially amongst the poor and
needy class. Therefore, this study will standardize both measurement guideline of
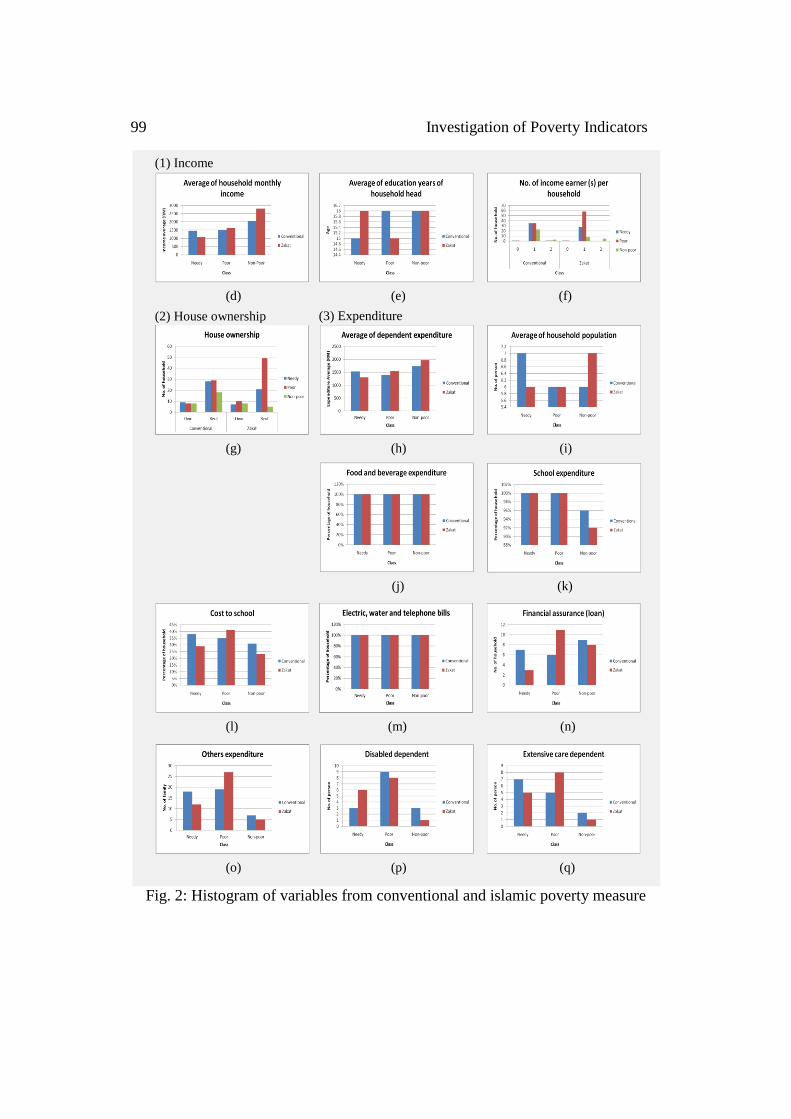
poverty in multidimensional perspective in future work. Fig. 2 presented in more
detailed of variables contributed in urban poor.
From the data presented in the graph, it has shown that the household monthly
income is affected by the number of income earners as well as their education
years/level of household head. Similarly for the dependent expenditure variable
which affected by the number of household population. Regarding to monthly
dependent expenditure there was another important variables named as sub-
variables would involved in calculation of household expenditure which is food
and beverage, loan, school expenditure, cost to school, electric, water and
telephone bills and also other expenditure that household needs to cover. The
variables namely, disabled dependent and extensive care dependent also involved
in totaling of household expenditure.
Fig. 1: Histogram of poverty classification based on conventional and islamic
institution
(a) (b) (c)
99 Investigation of Poverty Indicators
Fig. 2: Histogram of variables from conventional and islamic poverty measure
(1) Income
(2) House ownership (3) Expenditure
(d) (e) (f)
(j) (k)
(l) (m) (n)
(o) (p) (q)
(g) (h) (i)
Nurliyana et al. 100
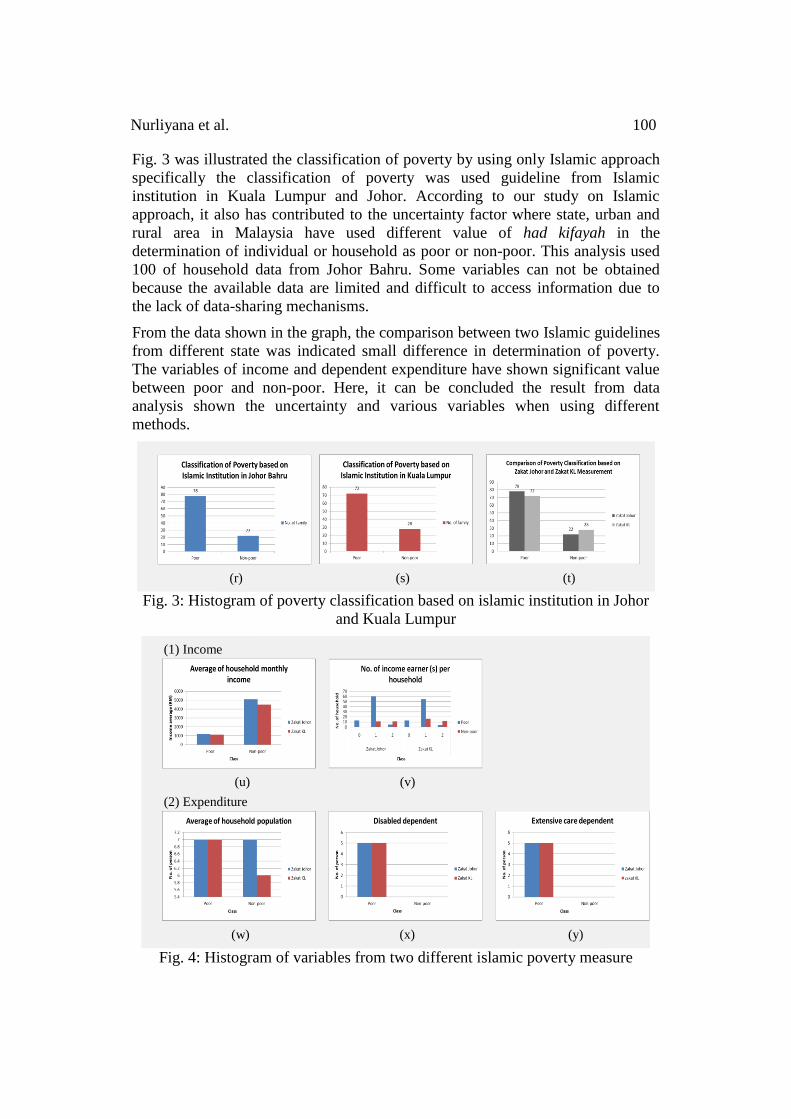
Fig. 3 was illustrated the classification of poverty by using only Islamic approach
specifically the classification of poverty was used guideline from Islamic
institution in Kuala Lumpur and Johor. According to our study on Islamic
approach, it also has contributed to the uncertainty factor where state, urban and
rural area in Malaysia have used different value of had kifayah in the
determination of individual or household as poor or non-poor. This analysis used
100 of household data from Johor Bahru. Some variables can not be obtained
because the available data are limited and difficult to access information due to
the lack of data-sharing mechanisms.
From the data shown in the graph, the comparison between two Islamic guidelines
from different state was indicated small difference in determination of poverty.
The variables of income and dependent expenditure have shown significant value
between poor and non-poor. Here, it can be concluded the result from data
analysis shown the uncertainty and various variables when using different
methods.
Fig. 3: Histogram of poverty classification based on islamic institution in Johor
and Kuala Lumpur
Fig. 4: Histogram of variables from two different islamic poverty measure
(1) Income
(2) Expenditure
(u) (v)
(w) (x) (y)
(a) (r) (s) (t)
101 Investigation of Poverty Indicators
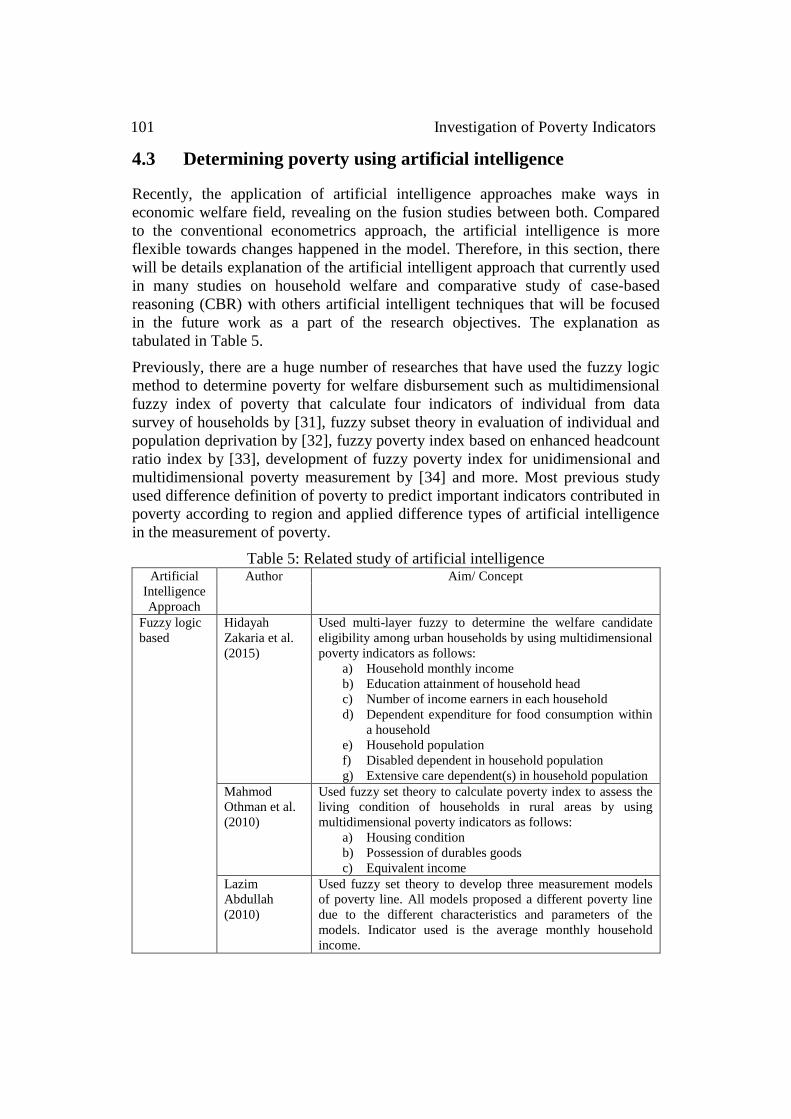
4.3 Determining poverty using artificial intelligence
Recently, the application of artificial intelligence approaches make ways in
economic welfare field, revealing on the fusion studies between both. Compared
to the conventional econometrics approach, the artificial intelligence is more
flexible towards changes happened in the model. Therefore, in this section, there
will be details explanation of the artificial intelligent approach that currently used
in many studies on household welfare and comparative study of case-based
reasoning (CBR) with others artificial intelligent techniques that will be focused
in the future work as a part of the research objectives. The explanation as
tabulated in Table 5.
Previously, there are a huge number of researches that have used the fuzzy logic
method to determine poverty for welfare disbursement such as multidimensional
fuzzy index of poverty that calculate four indicators of individual from data
survey of households by [31], fuzzy subset theory in evaluation of individual and
population deprivation by [32], fuzzy poverty index based on enhanced headcount
ratio index by [33], development of fuzzy poverty index for unidimensional and
multidimensional poverty measurement by [34] and more. Most previous study
used difference definition of poverty to predict important indicators contributed in
poverty according to region and applied difference types of artificial intelligence
in the measurement of poverty.
Table 5: Related study of artificial intelligence Artificial
Intelligence
Approach
Author Aim/ Concept
Fuzzy logic
based
Hidayah
Zakaria et al.
(2015)
Used multi-layer fuzzy to determine the welfare candidate
eligibility among urban households by using multidimensional
poverty indicators as follows:
a) Household monthly income
b) Education attainment of household head
c) Number of income earners in each household
d) Dependent expenditure for food consumption within
a household
e) Household population
f) Disabled dependent in household population
g) Extensive care dependent(s) in household population
Mahmod
Othman et al.
(2010)
Used fuzzy set theory to calculate poverty index to assess the
living condition of households in rural areas by using
multidimensional poverty indicators as follows:
a) Housing condition
b) Possession of durables goods
c) Equivalent income
Lazim
Abdullah
(2010)
Used fuzzy set theory to develop three measurement models
of poverty line. All models proposed a different poverty line
due to the different characteristics and parameters of the
models. Indicator used is the average monthly household
income.
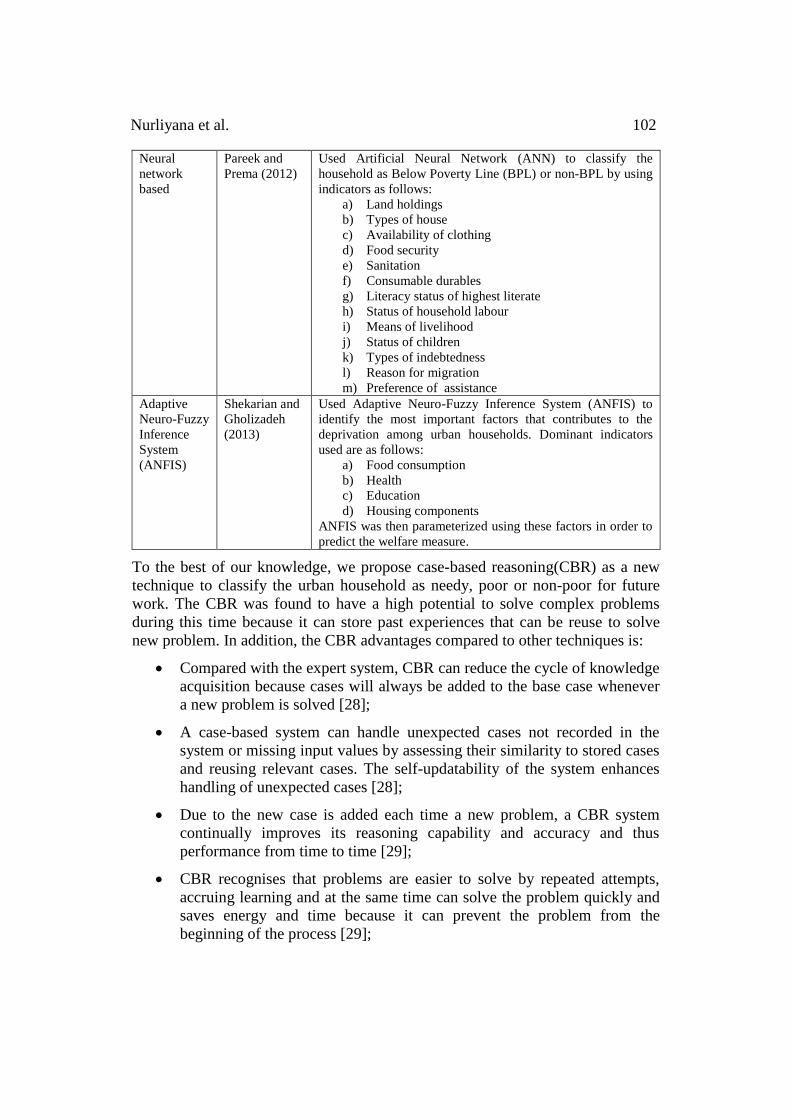
Nurliyana et al. 102
Neural
network
based
Pareek and
Prema (2012)
Used Artificial Neural Network (ANN) to classify the
household as Below Poverty Line (BPL) or non-BPL by using
indicators as follows:
a) Land holdings
b) Types of house
c) Availability of clothing
d) Food security
e) Sanitation
f) Consumable durables
g) Literacy status of highest literate
h) Status of household labour
i) Means of livelihood
j) Status of children
k) Types of indebtedness
l) Reason for migration
m) Preference of assistance
Adaptive
Neuro-Fuzzy
Inference
System
(ANFIS)
Shekarian and
Gholizadeh
(2013)
Used Adaptive Neuro-Fuzzy Inference System (ANFIS) to
identify the most important factors that contributes to the
deprivation among urban households. Dominant indicators
used are as follows:
a) Food consumption
b) Health
c) Education
d) Housing components
ANFIS was then parameterized using these factors in order to
predict the welfare measure.
To the best of our knowledge, we propose case-based reasoning(CBR) as a new
technique to classify the urban household as needy, poor or non-poor for future
work. The CBR was found to have a high potential to solve complex problems
during this time because it can store past experiences that can be reuse to solve
new problem. In addition, the CBR advantages compared to other techniques is:
Compared with the expert system, CBR can reduce the cycle of knowledge
acquisition because cases will always be added to the base case whenever
a new problem is solved [28];
A case-based system can handle unexpected cases not recorded in the
system or missing input values by assessing their similarity to stored cases
and reusing relevant cases. The self-updatability of the system enhances
handling of unexpected cases [28];
Due to the new case is added each time a new problem, a CBR system
continually improves its reasoning capability and accuracy and thus
performance from time to time [29];
CBR recognises that problems are easier to solve by repeated attempts,
accruing learning and at the same time can solve the problem quickly and
saves energy and time because it can prevent the problem from the
beginning of the process [29];
103 Investigation of Poverty Indicators
CBR can improve the efficiency of the implementation of problem solving
methods reuse (reuse of past experience) [30].
5 Conclusion
The study expected to enhance the understanding of poverty measurement in
Malaysia which is used two difference methods to determine poverty class by
using Poverty Line Income (PLI), applied by conventional institutions and Had
Al-Kifayah (HAK), applied by Islamic institutions. According to the analysis of
household data, the paper have described others several factors that are associated
in the process of identifying poverty class. The identification of poverty class and
others related deprivation of urban poor would enable the policy makers and
researchers to draw more appropriate and effective poverty alleviation
programmes that would be able to reduce the incidence of poverty in the country.
The combination of monetary and non-monetary based measures would be able to
improve on the measurement and understanding of poverty in Malaysia, making
the distributions on welfare to the poor more accurate [9]. Based on the findings
in this study, there are many others factors which have contributed in determining
poverty class. These factors have led to uncertainty in determining the poverty
class using two methods. Thus, this study will standardize the factors or indicators
involved in the determination of poverty by using Java programming in COLIBRI
for case-based reasoning. Every case of urban poor will be used as a case
representation for future work.
ACKNOWLEDGEMENTS This research was supported by Ministry of Higher Education under Vot No.
06528 and Universiti Teknologi Malaysia. We are thankful to Majlis Agama
Islam Wilayah Persekutuan Kuala Lumpur (MAIWP) and Pusat Zakat Universiti
Teknologi Malaysia, Skudai, Johor who provided expertise that greatly assisted
the research.
References
[1] Naseem, S. M. (2003). Rethinking the East Asian Miracle. Journal of
Economic Studies. Vol. 30, 636 – 644.
[2] Baker, J. and Schuler, N. (2004). Analyzing Urban Poverty: A Summary of
Methods and Approaches. World Bank Policy Research Working Paper No.
3399.
[3] Narayanan, D., Patel, R. (2000). Voices of the Poor: Can Anyone Hear Us?.
Oxford: Oxford University Press.
[4] United Nations Development Programme Malaysia. (2010). Tenth Malaysia
Plan 2011-2015. Economic Planning Unit. Prime Minister’s Department.
Putrajaya.
Nurliyana et al. 104
[5] Rasool, M. S. A., Harun, M. F. M., Salleh, A. M., Idris, N. (2011). Poverty
Measurement in Malaysia: A Survey of the Literature. Akademika 81(1).
[6] Lazim, A. (2010). Poverty Lines Based on Fuzzy Sets Theory and its
Application to Malaysian Data. Social Indicators Research. 104, 117-127.
[7] Othman, M., Hamzah, S. H. A., Yahaya, M. F. (2010). Fuzzy Index Poverty
(FIP): Measuring Poverty in Rural Area of Terengganu. International
Conference on User Science Engineering (i-USEr). Shah Alam, Selangor,
Malaysia.
[8] Nolan, B. and Whelan, C. T. (2010). Using Non-Monetary Deprivation
Indicators to Analyse Poverty and Social Exclusion in Rich Countries:
Lessons from Europe?. Journal of Policy Analysis and Management Spring.
[9] Yusuf Al-Qardawi. (1980). Fiqh Al-Zakah. Translated by Monzer Kah.
Scientific Publishing Centre. King Abdul Aziz University, Jeddah.
[10]Monzer, K. (1982). Fiscal and Monetary Policies in an Islamic Economy. In
Monetary and Fiscal Economics of Islam, ed. M. Ariff. Jeddah: Islamic
Research and Training Institute, Islamic Development Bank.
[11]Rasool, M. S. A., Harun, M. F. M., Salleh, A. M., Idris, N. (2011). Poverty
Measurement in Malaysia Zakat Institutions: A Theoretical Survey. Jurnal
Ekonomi Malaysia. 45, 123-129.
[12]Lazim, M. A., Osman, M. T. A. (2009). A New Malaysian Quality of Life
Index Based on Fuzzy Sets and Hierarchical Needs. Social Indicators
Research. 94, 499-508.
[13]Rasool, M. S. A., Salleh, A. M. (2012). Statistical Data for Appropriate
Poverty Measurement and Policy for Eradication: A Malaysian Case. MyStats
2012 Proceedings.
[14]Rasool, M. S. A., Salleh, A. M., Harun, M. F. M. (2012). Poverty
Measurement by Islamic Institutions. International Scholarly and Scientific
Research & Innovation. 6 (5).
[15]Rasool, M. S. A. and Salleh, A. M. (2014). Non-Monetary Poverty
Measurement in Malaysia: A Maqasid al-Shariah Approach. Islamic
Economic Studies. 22 (2), 33-46.
[16]Ibrahim, M. F., Ali, A. F. M., Ali, M. N. (2000). Pengiraan Had Kifayah bagi
Kemiskinan di Malaysia: Kajian Kes di Negeri Selangor.
[17]Sulaiman, M., Ahmad, H., Hisham, A. I. I., Nordin, N. M., Ramli, S. (2014).
Had Al-Kifayah di Kalangan Masyarakat Islam: Merungkai Keperluan
Kaedah Penentuan Garis Miskin dan Kaya Berasaskan Sunnah di Malaysia.
105 Investigation of Poverty Indicators
[18]Sulaiman, J., Azman, A., Khan, Z. (2014). Re-modeling Urban Poverty: A
Multidimensional Approach. International Journal of Social Work and Human
Services Practice. Pp 64-72.
[19]Harun, M. F., Abdullah, M. F. (2007). Kemiskinan Mengikut Teori
Konvensional dan Perspektif Islam. UPENA.
[20]Laderchi, C. R. (2000). The Monetary Approach to Poverty: A Survey of
Concepts and Methods. QEH Series Paper 58.
[21]Yusof, A. M. (2012). Unbundling Urban Poor and Its Link to Housing.
International Real Estate Reasearch Symposium. Selangor, Malaysia.
[22]Ramli, R. and Ibrahim, P. (2010). Kesan Agihan Zakat dalam Membasmi
Kemiskinan dan Ketidakseimbangan Agihan Pendapatan di Negeri Sembilan.
PERKEM V. Negeri Sembilan, Malaysia.
[23]Sulaiman, M., Ahmad, H. Hisham, A. I. I., Nordin, N. M. and Ramli, S.
(2011). Had Al-Kifayah di Kalangan Masyarakat Islam: Merungkai Keperluan
Kaedah Penentuan garis Kemiskinan dan Kaya Berasaskan Sunnah di
Malaysia.
[24]Jamil, N. and Mat, S. H. C. (2014). Realiti Kemiskinan: Satu Kajian
Teoritikal. Jurnal Ekonomi Malaysia. 48 (1), 167-177.
[25]Shekarian, E., Gholizadeh, A. A. (2013). Application of Adaptive Network
Based Fuzzy Inference System Method in Economic Welfare. Knowledge-
Based Systems. 39, 151-158.
[26]Zakaria, H., Hassan, R., Othman, R. M. And Hasmuni, H. (2015). Multi layer
Fuzzy Logic for Welfare Disbursement. Third International Conference on
Artificial Intelligence. Modeling and Simulation.
[27]Pareek, P. and Dr. Prema, K. V. (2012). Classifying the Population as BPL or
Non-BPL using Multilayer Neural Network. International Journal of Scientific
and Research Publications. Vol. 2, Issue 12.
[28]Prentzas, J. and Hatzilygeroudis, I.. Categorizing Approaches Combining
Rule-Based and Case-Based Reasoning.
[29]Chen, S. H., Jakeman, A. J. And Norton, J. P. (2008). Artificial Intelligence
techniques: An introduction to their use for modelling environmental systems.
Mathematics and Computers in Simulation 78, 379–400.
[30]Kolodner, J. L. (1993). Case-Based Reasoning. San Mateo, CA: Morgan
Kaufmann Publishers.
[31]Basaran, A., Gunay, A., Yereli, A. B. and Basaran, A. (2005). Measuring
poverty using fuzzy set approach: Turkish case.
Nurliyana et al. 106
[32]Bantilan, M. C. S., Bantilan Jr., F. T. and de Castro, M. M. (1992). Fuzzy
Subset Theory in the Measuremnet of Poverty. Journal of Philippine
Development . No. 34, Vol. XIX, 1.
[33]Caramuta, D. M. and Contiggiani, F. (2005). A Fuzzy Set Approach to
Poverty Measurement.
[34]Belhadj, B. (2011). New Fuzzy Indices of Poverty by Distinguishing Three
Levels of Poverty. Research in Economics. 65(3), 221-231.