investigation of different degradation methods...
TRANSCRIPT
INVESTIGATION OF DIFFERENT DEGRADATION
METHODS TO PREPARE LIQUID EPOXIDIZED NATURAL
RUBBER FOR COATING APPLICATIONS
PEJVAK ROOSHENASS
FACULTY OF SCIENCE
UNIVERSITY OF MALAYA
KUALA LUMPUR
2017
INVESTIGATION OF DIFFERENT DEGRADATION METHODS
TO PREPARE LIQUID EPOXIDIZED NATURAL RUBBER FOR
COATING APPLICATIONS
PEJVAK ROOSHENASS
THESIS SUBMITTED IN FULFILLMENT OF THE
REQUIREMENTS FOR THE DEGREE OF
DOCTOR OF PHILOSOPHY
DEPARTMENT OF CHEMISTRY
FACULTY OF SCIENCE
UNIVERSITY OF MALAYA
KUALA LUMPUR
2017
ii
UNIVERSITI MALAYA
ORIGINAL LITERARY WORK DECLARATION
Name of Candidate: PEJVAK ROOSHENASS (I.C/Passport No: H95659238)
Registration /Matric No: SHC100073
Name of Degree: Doctor of Philosophy
Title of Thesis (“this Work”):
INVESTIGATION OF DIFFERENT DEGRADATION METHODS TO
PREPARE LIQUID EPOXIDIZED NATURAL RUBBER FOR COATING
APPLICATIONS
Field of Study: Polymer Chemistry
I do solemnly and sincerely declare that:
(1) I am the sole author/writer of this Work;
(2) This Work is original;
(3) Any use of any work in which copyright exists was done by way of fair dealing
and for permitted purposes and any excerpt or extract from, or reference to or
reproduction of any copyright work has been disclosed expressly and sufficiently and
the title of the Work and its authorship have been acknowledged in this Work;
(4) I do not have any actual knowledge nor do I ought reasonably to know that the
making of this work constitutes an infringement of any copyright work;
(5) I hereby assign all and every rights in the copyright to this Work to the
University of Malaya (“UM”), who henceforth shall be owner of the copyright in this
Work and that any reproduction or use in any form or by any means whatsoever is
prohibited without the written consent of UM having been first had and obtained;
(6) I am fully aware that if in the course of making this Work I have infringed any
copyright whether intentionally or otherwise, I may be subject to legal action or any
other action as may be determined by UM.
Candidate’s Signature Date:
Subscribed and solemnly declared before,
Witness’s Signature Date:
Name:
Designation:
iii
ABSTRACT
Epoxidized natural rubber (ENR) is a very significant polymer due to its
outstanding mechanical performance besides low cost and great mechanical
properties. However, ENR has high molecular weight which limits its solubility
and its processability. This study concerns the degradation of ENR to shorter
chain lengths to form liquid epoxidized natural rubber (LENR) employing 5
different methods, i.e. (i) mechanical milling, (ii) chemical degradation initiated
by potassium peroxodisulfate, (iii) photo-oxidation initiated by ultra violet (UV),
(iv) oxidative degradation by periodic acid (H5IO6) and (v) oxidative
degradation by potassium permanganate (KMnO4). The first three methods [(i),
(ii) and (iii)] break-down of ENR is via free radicals, but at different rates and
mechanisms. FTIR and NMR results showed that in these three methods ketone,
aldehyde, carboxylic acid, ester and lactone groups were observed; however
only during the UV degradation a hydrofuranic structure was formed. The
oxirane group was not affected significantly during the degradation, indicating
that the chain scissions had occurred predominantly via the double bonds.
Comparison of the NMR and FTIR spectra of degradation products showed that
UV degradation induced more carbonyl and hydroxyl groups to the backbone of
the ENR. Increasing of oxygen concentration did not enhance the efficiency in
UV degradation method. Mastication with two roll mill produced LENR with
greatest degree of unsaturation and less amounts of polar groups. The last two
methods [(iv) and (v)] degraded ENR through chemical oxidative degradation.
The products of these two methods were compared with LENR obtained from
degradation initiated by UV irradiation. Degradation of ENR by KMnO4 and UV
irradiation proceeded mostly by attack via double bond, as confirmed by NMR
iv
spectroscopy irradiation proceeded mostly by attack via double bond, as
confirmed by NMR spectroscopy whereby a decrease in the ratio peak areas of
epoxy methine proton to olefinic methine proton was observed. At concentration
of above 0.044 mol H5IO6 per hundred grams of rubber (mphr), degradation
occurred by ring opening of the oxirane group as confirmed by the NMR of the
LENR which showed an increase in the ratio peak areas of olefinic methine
proton to epoxy methine proton. The LENR obtained by H5IO6 has more ketone
groups while the LENR from degradation by KMnO4 has more ester groups.
Cyclization of isoprene unit was only observed during the degradation by H5IO6.
Among these methods, H5IO6 has achieved the fastest rate of degradation and
lowest Mn under comparable conditions. For coating application, methyl
methacrylate (MMA) was graft copolymerized onto LENR using UV radiation
and benzophenone as photo initiator. The best grafting efficiency was observed
by 0.84 parts per hundred resin (phr) of benzophenone. DSC thermograms
showed a small positive shift in Tg of LENR compared to ENR 25. LENR-graft-
PMMA showed a great increase in Tg (42ºC), because incorporation of hard
segments of PMMA onto LENR. The obtained PMMA-graft-LENR was cured
with three different amines and evaluated as coatings materials. Overall, the
best results for coating performances were observed by curing of PMMA-graft-
LENR with a cycloaliphatic amine. This type of coating demonstrated the best
hardness, adhesion, water and salt resistances.
v
ABSTRAK
Getah asli epoksida (ENR) adalah polimer yang sangat penting kerana
prestasi mekanikalnya yang cemerlang disamping kos rendah dan sifat
mekanikal yang hebat. Walau bagaimanapun, ENR mempunyai berat molekul
tinggi yang menghadkan kelarutan dan pempropesannya. Kajian ini adalah
mengenai degradasi ENR ke panjang rantai yang lebih pendek untuk membentuk
cecair getah asli epoksida (LENR) menggunakan 5 kaedah yang berbeza, iaitu
(i) pengilangan mekanikal, (ii) degradasi kimia yang dimulakan oleh kalium
peroksodisulfat, (iii) foto-pengoksidaan yang dimulakan oleh ultra ungu (UV),
(iv) degradasi pengoksidaan oleh asid periodik (H5IO6) dan (v) degradasi
pengoksidaan oleh kalium permanganat (KMnO4). Tiga kaedah yang pertama
[(i), (ii) dan (iii)] bagi pemecahan ENR adalah melalui radikal bebas tetapi pada
kadar dan mekanisme yang berlainan. Keputusan FTIR dan NMR menunjukkan
bahawa dalam ketiga-tiga kaedah ini kumpulan keton, aldehid, asid karboksilik,
ester dan lakton diperhatikan; bagaimanapun hanya semasa degradasi UV
struktur hidrofuranik telah dihasilkan. Kumpulan oksirana tidak terjejas dengan
ketara semasa degradasi, menunjukkan bahawa pemotongan rantai telah berlaku
sebahagian besarnya melalui ikatan dubel. Perbandingan spektra NMR dan FTIR
bagi hasil terdegradasi menunjukkan degradasi UV mengaruh lebih banyak
kumpulan karbonil dan hidroksil pada rangka ENR. Penambahan kepekatan
oksigen tidak meningkatkan kecekapan dalam kaedah degradasi UV.
Pengunyahan dengan “two roll mill” telah menghasilkan LENR dengan darjah
ketaktepuan terbanyak dan kurang bilangan kumpulan kutub. Dua kaedah
terakhir bagi degradasi ENR [(iv) and (v)] adalah melalui degradasi
pengoksidaan kimia. Hasil daripada kedua-dua kaedah ini dibandingkan dengan
vi
LENR yang diperolehi daripada degradasi yang dimulakan oleh sinaran UV.
Degradasi ENR oleh KMnO4 dan sinaran UV berlaku kebanyakannya oleh
serangan melalui ikatan ganda dua, seperti yang disahkan oleh spektroskopi
NMR, dimana pengurangan dalam nisbah puncak keluasan proton metin epoksi
kepada proton metin olefinik diperhatikan. Pada kepekatan H5IO6 melebihi
0.044 mol bagi setiap seratus gram getah (mphr), degradasi berlaku melalui
pembukaan gelang kumpulan oksirana seperti disahkan oleh NMR bagi LENR
yang menunjukkan peningkatan dalam nisbah keluasan puncak proton metin
olefinik kepada proton metin epoksi. LENR yang diperolehi oleh H5IO6
mempunyai lebih kumpulan keton manakala degradasi oleh KMnO4 mempunyai
lebih kumpulan ester. Pensiklikan unit isoprena hanya diperhatikan semasa
degradasi oleh H5IO6. Antara kaedah-kaedah ini, H5IO6 telah mencapai kadar
degradasi yang terpantas dan Mn terendah pada keadaan yang setanding. Bagi
aplikasi salutan, metil metakrilat (MMA) telah dikopolimer cantumkan ke
LENR menggunakan sinaran UV dan benzofenon sebagai foto pemula.
Kecekapan cantuman terbaik diperhatikan melalui 0.84 bahagian per seratus
resin (phr) benzofenon. Termogram DSC menunjukkan anjakan positif yang
kecil dalam Tg bagi LENR berbanding ENR 25. LENR-cantum-PMMA
menunjukkan peningkatan besar dalam Tg (42ºC), disebabkan kemasukan
segmen keras PMMA kepada LENR. PMMA-cantum-LENR yang diperolehi
telah dimatangkan dengan tiga amina yang berbeza dan dinilai sebagai bahan
salutan. Secara keseluruhan, hasil yang terbaik untuk prestasi salutan telah
diperhatikan dengan mematangkan PMMA-cantum-LENR dengan amina
sikloalifatik. Salutan jenis ini menunjukkan kekerasan, lekatan, serta rintangan
air dan garam yang terbaik.
vii
ACKNOWLEDGEMENTS
First and foremost, I would like to thank the Great God who gave me the
wisdom and strength to accomplish this important task in my life. I would like to
express my sincere gratitude to my main supervisor, Professor Dr. Gan Seng Neon. His
kindness and continuous optimism for this research has always been encouraging and
supporting throughout the project. Next, I would like to extend my sincere appreciation
to my co-supervisor, Professor Dr. Rosiyah Yahya for her guidance. Finally, I would
like to acknowledge the financial support from University of Malaya.
Not forgetting to thank my son Ali for his patience and also my mother and my
mother in law, Farah and Ghodsieh. They have been a source of inspiration and prayer
support, like two angels beside me.
Last but not least my wife, Nushin, I want to express my utmost gratefulness to
you, for your continuous support and care. Thank you, Nushin, for undivided love and
patience over the last several years.
This thesis is dedicated to my father, Mahdi who passed away on July 30, 2016.
viii
TABLE OF CONTENTS
1 CHAPTER 1: INTRODUCTION ................................................................... XIX
1.1 Research background................................................................................. 1
1.2 Problem statement ..................................................................................... 4
1.3 Objectives .................................................................................................. 5
2 CHAPTER 2: LITERATURE REVIEW ............................................................ 6
2.1 Natural rubber ............................................................................................ 6
2.2 Modification of Natural rubber ................................................................. 8
Physical modification ....................................................................... 8 2.2.1
Chemical modification ................................................................... 10 2.2.2
2.3 Epoxidized natural rubber ....................................................................... 15
2.4 Liquid natural rubber and liquid epoxidized natural rubber .................... 19
Synthesis ........................................................................................ 20 2.4.1
5.2 Graft polymerization ............................................................................... 35
2.6 Coating .................................................................................................... 38
General information ....................................................................... 38 2.6.1
Epoxy resin .................................................................................... 41 2.6.2
3 CHAPTER 3: MATERIALS & METHODS .................................................... 45
3.1 Materials .................................................................................................. 45
Preparation of ENR 25 solution ..................................................... 45 3.1.1
2.5 Different degradation methods to produce LENR................................... 46
Mechanical breakdown of ENR25 ................................................. 46 3.2.1
Oxidative degradation initiated by potassium peroxodisulfate. ..... 46 3.2.2
Photo-oxidation with UV radiation. ............................................... 47 3.2.3
Oxidative degradation with potassium permanganate ................... 48 3.2.4
ix
Oxidative degradation with periodic acid ...................................... 49 3.2.5
3.3 Graft polymerization ............................................................................... 50
3.4 Characterization Methods ........................................................................ 51
1H-NMR spectroscopy ................................................................... 51 3.4.1
FTIR spectroscopy ......................................................................... 51 3.4.2
Gel Permeation Chromatography (GPC) analysis ......................... 52 3.4.3
Differential scanning calorimetry (DSC) analysis ......................... 52 3.4.4
Determination of Epoxy content by direct titration method .......... 53 3.4.5
3.5 Preparation of coating based on grafted LENR ....................................... 54
Grafted LENR ................................................................................ 54 3.5.1
Curing agent ................................................................................... 55 3.5.2
Treatment of iron panel .................................................................. 56 3.5.3
Preparation of coating mixture ....................................................... 56 3.5.4
Determination of film properties.................................................... 57 3.5.5
4 CHAPTER 4: RESULTS AND DISCUSSION ................................................. 60
4.1 Study of three degradation methods to produce LENR through radical
mechanism ............................................................................................... 60
Introduction .................................................................................... 60 4.1.1
Degradation using a roll mill ......................................................... 60 4.1.2
Degradation using potassium peroxodisulfate ............................... 65 4.1.3
UV degradation method A ............................................................. 70 4.1.4
Comparison of the three methods .................................................. 78 4.1.5
4.2 Preparation of LENR by oxidative degradation methods using H5IO6 and
KMnO4 and comparing them with UV degradation ................................ 90
Introduction .................................................................................... 90 4.2.1
Degradation by periodic acid ......................................................... 90 4.2.2
Degradation using potassium permanganate .................................. 96 4.2.3
UV degradation method B ........................................................... 100 4.2.4
Comparison of the three methods ................................................ 103 4.2.5
x
4.3 Preparation of coating based on LENR ................................................. 110
5 CHAPTER 5: CONCLUSION AND FURTHER WORK ............................. 121
5.1 Conclusions ........................................................................................... 121
5.2 Suggestion for further research ............................................................. 124
6 REFERENCES .................................................................................................. 126
7 LIST OF ISI PUBLICATIONS AND PRESENTATIONS ........................... 136
xi
LIST OF FIGURES
Figure 2.1: Chlorination of NR: (1 Addition reaction. (2 Substitution reaction. ........... 14
Figure 2.2: Hydrogenation of NR using p-TSH at 135 ºC. ............................................ 15
Figure 2.3: Formation of five- membered cyclic ethers by ring opening of oxirane
group. .............................................................................................................................. 18
Figure 2.4: Incorporation of dibutyl phosphate to ENR by ring opening of epoxide. ... 19
Figure 2.5: Synthesis of LNR using phenylhydrazine and oxygen as reducing and
oxidizing agent . .............................................................................................................. 22
Figure 2.6: Scheme of abstraction of allylic hydrogen directly by oxygen molecule. .. 26
Figure 2.7: Different allyl radicals could be generated by radical attack. ..................... 26
Figure 2.8: Homolytic decompositon of hydroperoxide to generate ketone. ................. 27
Figure 2.9: Formation of alkoxy peroxide through subtitution mechanism. ................. 27
Figure 2.10: Formation of alkoxy peroxide by addition mechanism. ............................ 28
Figure 2.11: Two-step mechanism for cleavage of the doublebond by H5IO6. ............. 31
Figure 2.12: Chemical stucture of DGBA epoxy resin. ................................................. 41
Figure 2.13: Chemical structure of bisphenol A based epoxy resin. ............................. 42
Figure 3.1: Pencil hardness kit ....................................................................................... 59
Figure 4.1: (a) Changes in subtracted IR spectra in the carbonyl vibration region after 3
& 8 h mastication; (b) Changes in subtracted IR spectra in the double bond region (=C-
H 835 cm-1
). .................................................................................................................... 62
Figure 4.2: Changes in subtracted IR spectra in the region of 2962 cm-1
in different
degradation methods. (a) mastication; (b) degradation with K2S2O8; (c) degradation with
UV. .................................................................................................................................. 62
Figure 4.3: 1H- NMR of (a) ENR25; (b) LENR produced after 8 h mastication. .......... 64
Figure 4.4: Ratio of integration area of the signals at 5.1 ppm (olefinic methine proton)
and 2.7 ppm (epoxy methine proton). ............................................................................. 65
xii
Figure 4.5: (a) Changes in subtracted IR spectra in the double bond region ( =C-H 835
cm-1
) after 15 and 30 h reaction with K2S2O8; (b) Changes in subtracted IR spectra in
the 1000 -1150 cm-1
region. ............................................................................................ 66
Figure 4.6: (a) Changes in subtracted IR spectra in the carbonyl vibration region after
15 and 30 h reaction with K2S2O8; (b) Changes in subtracted IR spectra in the hydroxyl
vibration region. .............................................................................................................. 67
Figure 4.7: Ratio of integration area of the signals at 5.1ppm. (olefinic methine proton)
and 2.7 ppm (epoxy methine proton). after reaction with K2S2O8. ................................. 69
Figure 4.8: 1H-NMR of (a) epoxidized natural rubber; (b) LENR after 30 h reaction
with potassium peroxodisulfate ...................................................................................... 69
Figure 4.9: (a) Changes in subtracted IR spectra in the double bond region ( =C-H 835
cm-1
); (b) ratio of A835/A2962 of degraded ENR during UV irradiation. .......................... 71
Figure 4.10: (a) Changes in subtracted IR spectra in the 1000 – 1150 cm-1
region; (b)
ratio of absorption of different group to C-H stretching of methyl group at 2962 cm-1
. 72
Figure 4.11: (a) Changes in subtracted IR spectra in the carbonyl vibration region; (b)
ratio of absorption of different carbonyl group to C-H stretching of methyl group. ...... 72
Figure 4.12: (a) Changes in subtracted IR spectra in the hydroxyl vibration. region; (b)
the ratio of peaks at 3358 and 3438 cm-1
to C-H stretching of methyl group at 2962 cm-1
. ........................................................................................................................................ 73
Figure 4.13: (a) 1H–NMR of hydrofuranic structure; (b) degraded ENR25 and splitting
pattern of Hi (m, 1.83 ppm) and Hg (m, 3.73 ppm). ........................................................ 74
Figure 4.14: 1H-NMR spectrum of degraded epoxidized natural rubber after 8 h UV
irradiation. ....................................................................................................................... 75
Figure 4.15: Decreasing of double bond intensity during photo oxidation calculated by
comparing of integration area of the signals at 5.14 ppm (olefinic methine proton) and
2.7 ppm (epoxy methine proton). .................................................................................... 75
Figure 4.16: Changes in subtracted IR spectra during photo oxidation. Subtracted
spectra between unblown sample (a) and air blown sample (b) in double bond region
(=C-H 835 cm-1
) . .......................................................................................................... 76
xiii
Figure 4.17: Changes in subtracted IR spectra during photo oxidation. Subtracted
spectra between unblown sample (a) and air blown sample (b) in the carbonyl vibration
region............................................................................................................................... 77
Figure 4.18: Changes in subtracted IR spectra during photo oxidation. Subtracted
spectra between unblown sample (a) and air blown sample (b) in hydroxyl region. ...... 77
Figure 4.19: Changes in subtracted IR spectra in the double bond region ( =C-H 835
cm-1
). A comparison of three degradation methods ; (b) ratio of A835/A2962 of different
degradation methods. ...................................................................................................... 79
Figure 4.20: (a) Changes in subtracted IR spectra in the carbonyl vibration region. A
comparison of three degradation methods; (b) ratio of A1717/A2962 of different
degradation methods. ...................................................................................................... 80
Figure 4.21: Changes in subtracted IR spectra in the hydroxyl region. A comparison of
three degradation methods. ............................................................................................. 80
Figure 4.22: (a) Radical attack to the double bond of ENR 25. This is the main route in
UV degradation and degradation with K2S2O8; (b) Allylic hydrogen abstraction through
radical attack. .................................................................................................................. 83
Figure 4.23: Free radical attacks double bond to produce alkoxy radical which can
convert to alcohol (route 1a) or by β cleavage generate ketone (route 2a, 3a, 4a). ........ 84
Figure 4.24: Free radical abstracts allylic hydrogen to produce alkoxy radical which
can convert to alcohol (route 1b) or by β cleavages generate unsaturated ketone (route
2b, 3b, 4b) . The main routes are 1b and 4b. ................................................................... 85
Figure 4.25: The weakest bond will be ruptured by applied force.during mastication
and generate methylene radicals which ultimately produce unsaturated ketone. ........... 86
Figure 4.26: Proposed plausible mechanism to form hydrofuranic structure.from alkoxy
radicals. ........................................................................................................................... 87
Figure 4.27: Nourish Ⅰ reaction . .................................................................................. 87
Figure 4.28: Intramolecular reaction of acyl radicals generated by Nourish I reaction
with alkoxy radical adjacent to carbonyl group to produce lactone................................ 88
Figure 4.29: Intermolecular reaction of acyl radicals to form ester generated by Nourish
Ⅰ reaction with alkoxy radical of another molecule. ...................................................... 88
xiv
Figure 4.30: A plausible mechanism for aldehyde generation....................................... 89
Figure 4.31: (A) Changes in absorbance of the double bond region (=C-H wagging)
after 10 h reaction with various amounts of H5IO6: a, 0.026 mphr; b, 0.044 mphr; c,
0.075 mphr; d, 0.145 mphr; and e, degraded NR under similar conditions with 0.075
mphr H5IO6. (B) Ratio of A870/A2962 of ENR degraded at different concentrations of
H5IO6. .............................................................................................................................. 91
Figure 4.32: Changes in subtracted IR spectra in the region of 2962 cm-1
for different
degradation methods: (1) Degradation with H5IO6; a, 0.026 mphr; b, 0.044 mphr; c,
0.075 mphr; and d, 0.145 mphr. (2) Degradation with KMnO4; a, 0.026 mphr; b, 0.044
mphr; c, 0.075 mphr; and d, 0.145 mphr. (3) Degradation with UV after different
irradiation times. ............................................................................................................. 92
Figure 4.33: (A) Changes in absorbance of the carbonyl group after 10 h reaction with
various amounts of H5IO6 :a, 0.026 mphr; b, 0.044 mphr; c, 0.075 mphr; d, 0.145 mphr;
and e, degraded NR under similar conditions with 0.075 mphr H5IO6. (B) Ratio of
A1717/A2962 of the degraded ENR with different amounts of H5IO6. ............................... 93
Figure 4.34: (A) Changes in absorbance of the hydroxyl group after 10 h reaction with
various amount of H5IO6:a, 0.026 mphr; b, 0.044 mphr; c, 0.075 mphr; d, 0.145 mphr;
and e, degraded NR under similar conditions with 0.075 mphr H5IO6. (B) Ratio of
A3452/A2962 of the degraded ENR with different amounts of H5IO6. ............................... 93
Figure 4.35: 1H-NMR of (a) epoxidized natural rubber and (b) degraded ENR after
reaction with 0.075 mphr H5IO6...................................................................................... 94
Figure 4.36: The ratio of the integration area of the signal at 5.11ppm (olefinic methine
proton) and 2.7 ppm (epoxy methine proton) after degradation with different amounts of
H5IO6. .............................................................................................................................. 95
Figure 4.37: (A) Changes in absorbance of the double bond region (=C-H wagging)
after 10 h reaction with various amounts of KMnO4: a, 0.026 mphr; b, 0.044 mphr; c,
0.075 mphr; d, 0.145 mphr; and e, degraded NR under similar conditions with 0.075
mphr KMnO4. (B) Ratio of A835/A2962 of ENR degraded at different concentrations of
KMnO4. ........................................................................................................................... 97
Figure 4.38: (A) Changes in absorbance of the carboxyl groupafter 10 h reaction with
various amounts of KMnO4: a, 0.026 mphr; b, 0.044 mphr; c, 0.075 mphr; d, 0.145
mphr; and e, degraded NR under similar conditions with 0.075 mphr KMnO4. (B) Ratio
xv
of A1717/A2962 to the C-H symmetrical stretching vibration of the degraded ENR with
different amounts of KMnO4. ......................................................................................... 97
Figure 4.39: 1H-NMR of (a) epoxidized natural rubber and (b)degraded ENR after
reaction with 0.075 mphr KMnO4. .................................................................................. 98
Figure 4.40: The ratio of the integration area of the signal at 5.11 ppm (olefinic
methine proton) and 2.7 ppm (epoxy methine proton) after degradation with different
concentrations of potassium permanganate. ................................................................... 99
Figure 4.41: (A) Changes in absorbance of the double bond region(=C-H wagging )
after different UV irradiation times: a, after 3 h; b, after 5 h; c, after 8 h; d, after 18 h;
and e, degraded NR under the same condition after 10 h irradiation . (B) Ratio of
A835/A2962 in the degraded ENR during UV irradiation. ............................................... 100
Figure 4.42: (A) Changes in absorbance of the carbonyl group after different UV
irradiation times: a, after 3 h; b, after 5 h; c, after 10 h; d, after 18 h; and e, degraded NR
under the same condition after 10 h irradiation. (B) Ratio of A1717/A2962 in the degraded
ENR during UV irradiation. .......................................................................................... 101
Figure 4.43: (a) 1H-NMR of epoxidized natural rubber; (b) degraded ENR by UV
irradiation. The peaks at 1.83 ppm and 3.72 ppm could be related to hydrofuranic
structure. ........................................................................................................................ 102
Figure 4.44: The ratio of the integration area of the signal at 5.11 ppm (olefinic
methine proton) and 2.7 ppm (epoxy methine proton) after different UV irradiation
times. ............................................................................................................................. 102
Figure 4.45: (A) Changes in absorbance of the carbonyl group. A comparison of three
degradation methods: a, product of degradation by 0.026 mphr H5IO6; b, product of
degradation by 0.044 mphr KMnO4; c, degraded ENR 25 after 5 h UV irradiation. (B)
Ratio of A1717/A2962 of different degradation methods. ................................................. 104
Figure 4.46: The decrease of log Mn during reaction time: a, degraded ENR by 0.075
mphr of H5IO6; b, degraded ENR by 0.075 mphr of KMnO4; and c, degraded ENR by
UV radiation. ................................................................................................................. 104
Figure 4.47: Proposed reaction pathway of degradation of ENR by higher amount of
H5IO6. ............................................................................................................................ 108
Figure 4.48: A suggested mechanism for cyclization of ENR in present of H5IO6. .... 109
xvi
Figure 4.49: Presumed mechanism of degradation reaction of ENR in the presence of
KMnO4 . ........................................................................................................................ 109
Figure 4.50: FT-IR spectra of (A) LENR6 and (B) LENR-graft-MMA (GLENR2). . 114
Figure 4.51: 1 H-NMR spectrum of the LENR-g-PMMA (GLENR2). ....................... 116
Figure 4.52: DSC curves of (A) ENR, (B) LENR6 and (C) LENR-graft-PMMA
(GLENR2). .................................................................................................................... 116
Figure 4.53: FTIR spectra of (A) GLENR, (B) GLCO1, (C) GLCO2, (D) GLCO3. .. 120
xvii
LIST OF TABLES
Table 2.1: Dissociation energies of bonds in NR. .......................................................... 25
Table 2.2: Diffusion Data for Water through Organic Films. ........................................ 39
Table 2.3: Typical examples of resin types. ................................................................... 40
Table 2.4: The estimated world market usage for different types of curing agents. ...... 42
Table 3.1: Amount of each variable reactant added to the reaction mixtures for
degradation with KMnO4. ............................................................................................... 49
Table 3.2: Amount of each variable reactant added to the reaction mixtures for
degradation with H5IO6. .................................................................................................. 49
Table 3.3: Amount of each variable reactant added to the reaction mixtures. ............... 50
Table 3.4: Properties of grafted LENR (GLENR2). ...................................................... 55
Table 3.5: Properties of curing agents. ........................................................................... 55
Table 3.6: Classification of adhesion test results. .......................................................... 58
Table 4.1: Absorbance ratio in the double bond and carbonyl region to C-H stretching
of methyl group after mastication. .................................................................................. 62
Table 4.2: Results of average molecular weight and polydispersity index after milling.
......................................................................................................................................... 64
Table 4.3: Ratio of absorption of different functional groups to C-H stretching of
methyl group after reaction with K2S2O8. ....................................................................... 66
Table 4.4: Ratio of absorption of different carbonyl and hydroxyl groups to C-H
stretching of methyl group after reaction with K2S2O8. .................................................. 68
Table 4.5: Results of average molecular weight and polydispersity index after reaction
with K2S2O8. .................................................................................................................... 68
Table 4.6: Results of average molecular weight and polydispersity indexafter UV
irradiation. ....................................................................................................................... 78
Table 4.7: Results of epoxy equivalent weight of LENR obtained by different
degradation methods. ...................................................................................................... 80
xviii
Table 4.8: Results of average molecular weight and polydispersity during degradation
with H5IO6 after 10 h of reaction. ................................................................................... 95
Table 4.9: Results of average molecular weight during degradation with KMnO4 after
10 h of reaction................................................................................................................ 99
Table 4.10: Results of average molecular weight and polydispersity after UV
irradiation. ..................................................................................................................... 102
Table 4.11: Results of epoxy equivalent weight degraded ENR25 obtained by different
degradation methods. .................................................................................................... 105
Table 4.12: Results of epoxy equivalent weight of LENR obtained from reaction at 10 h
with H5IO6 at different concentrations. ......................................................................... 106
Table 4.13: Effect of initiator concentration on graft copolymerization...................... 113
Table 4.14: Chemical and physical properties of the coating materials. ...................... 117
xix
ABBREVIATIONS
1H-NMR Proton nuclear magnetic resonance
AIBN Azobisisobutyronitrile
ASTM American Society for Testing and Materials
DGBA Diglycidyl ether of Bisphenol A
DMF Dimethylformamide
DMSO Dimethyl sulfoxide
DPNR Deproteinized natural rubber
DRC Dry rubber content
DSC Differential Scanning Calorimetry
EA Elemental analysis
ENR Epoxidized natural rubber
ENR25 Epoxidized natural rubber with 25% mol of epoxidation
ENR50 Epoxidized natural rubber with 50% mol of epoxidation
EPI Epoxidized polyisoprene
EPM Ethylene-propylene rubber
FTIR Fourier Transform Infrared
GLENR LENR-graft-PMMA
GPC Gel-Permeation Chromatography
HTNR Hydroxyl-telechelic natural rubber
KHP Potassium hydrogen phthalate
KPS Potassium persulfate
LENR Liquid epoxidized natural rubber
LNR Liquid natural rubber
MEK 2-Butanone
MMA Methyl methacrylate
Mn Number average molecular weight
mol
mphr
Mole
Mol per hundred grams of rubber
Mw Weight average molecular weight
MWD Molecular weight distribution
NR Natural rubber
p-TSH para-toluene sulphonyl hydrazide
phr Parts per hundred resin
PI Polyisoprene
PMMA Poly(methyl methacrylate)
PVC Poly(vinyl chloride)
RRIM Rubber Research Institute Malaysia
SBR Styrene-butadiene rubber
SEM Scanning electron microscopy
SMR Standard Malaysian Rubber
Tg Glass transition temperature
TGA Thermogravimetry analysis
THF Tetrahydrofuran
UV Ultra violet
Vic Vicinal
1
1 CHAPTER 1: INTRODUCTION
1.1 Research background
The natural rubber (NR) is a biopolymer isolated from the latex of Hevea
brasiliensis tree which grows in tropical climate. The latex has a solid rubber content of
about 30 w/w%. The rubber contains more than 95% cis -1, 4-polyisoprene and 5% non-
rubbers (Mooibroek & Cornish, 2000). The natural rubber (NR) is a biopolymer isolated
from the latex of Hevea brasiliensis tree which grows in tropical climate. The latex has a
solid rubber content of about 30 w/w%. The estimated amount of energy needed to
harvest and process of NR was 16 GJ/tonne compared to 130 GJ/tonne for synthetic
SBR and 174 GJ/tonne for butyl rubber (Jones, 1994). Thus, with regards to energy
demand, NR has greater advantage over synthetic rubbers.NR has been a strategic raw
material that could not be replaced in some products, because of its outstanding
technical characteristics, such as high resilience, excellent flexibility, resistance against
splitting and impact resistance as well as excellent tensile strength and elongation
properties (Lindley, 1981; Wang et al., 2000). These superior physical properties have
made NR to be the only rubber usable for aircraft tires, 60% of heavy duty tires and
more than 40% of car tires consist of NR. It is well known that manufacturing and usage
of petroleum-based polymer and plastic is a source of environmental pollution. In
contrast NR is an inherently environmental friendly. Due to depletion of petroleum and
environmental concerns, various efforts have been devoted to produce new polymeric
materials by chemical modifications of sustainable resources. The double bond in the
repeating units of NR allows a number of chemical modifications such as vulcanization
(Saville & Watson, 1967), epoxidation (Baker et al., 1985), cyclization (Riyajan, 2009;
2
Sakdapipanich et al., 2002), chlorination (Zhong et al., 1999), degradation (Sadaka et
al., 2012) and grafting (Nakason et al., 2004a). NR also has some limitations. NR
cannot be used in some industries such as coating and adhesives because of its
processability due to its extremely high molecular weights and low solubility in organic
solvents (La Mantia et al., 2017). Liquid natural rubber (LNR) is prepared by
degradation of NR. The number average molecular weight (Mn) of LNR is less than
50000 (Nor & Ebdon, 1998) . Preparation of LNR has been an interesting subject for
decades, because of its strong adhesive power and possibility for further chemical
modifications. Several techniques have been employed to produce LNR. A
phenylhydrazine/oxygen system was developed by Pautrat et al. (1980) to promote
efficient oxidative degradation of NR. By varying the amount of phenylhydrazine in this
system, the desired molecular weight of LNR can be achieved. However, this method
suffered the shortcomings of removal of impurities and the dark brown colour of the
product (Pautrat, 1980). To prepare light colour LNR, potassium persulfate is used for
chain cleavage of polyisoprene (PI) but competitive reactions between chain cleavage
and recombination of unstable terminal carbonyl groups have decreased the efficiency
of degradation and difficulty in controlling the desired molecular weight of LNR
(Tangpakdee et al., 1998) . The study of degradation by using periodic acid was carried
out by Reyx et al. (1997). The 1H NMR spectrum of the obtained product revealed the
presence of cyclic structures as well as aldehyde and ketone moieties (Reyx &
Campistron, 1997). Solar energy in presence of transition metal complexes was used by
Tillekeratne et al. (Tillekeratne, 1977). Characterization of LNR showed that
hydroperoxide, carboxyl, ester and aldehyde functional groups were present (Nor &
Ebdon, 1998). Degradation of NR has been also carried out by thermal-oxidation (Li et
al., 1998), ozonolysis (Perera et al., 1988), and mastication (Harmon & Jacobs, 1966) .
3
Each of these methods degrades NR through different mechanisms and create different
amounts and types of functional groups.
One of the most important intermediate in organic synthesis is oxirane group. It
has the ability to react with many other chemical groups such as amino, hydroxyl and
carboxylic acid (Tanaka & Kakiuchi, 1963). Epoxidized natural rubber (ENR) is the
product of partially epoxidation of double bonds of NR by a peroxy acid (Perera &
Bradbury, 1992). Converting of NR to ENR improves several properties such as better
oil resistance, lower gas permeability, better wet grip, higher damping characteristic
(Gelling, 1991), glass transition temperature (Tg), and polarity (Kargarzadeh et al.,
2015a). ENR has both unsaturation and oxirane groups that could be utilized for further
chemical modifications (Baker et al., 1985).. During epoxidation, molecular weight
remains unchanged, therefore ENR faces the same limitations in process ability and low
solubility in organic solvents. Grafting is another valuable method for improving of
properties of NR. Grafting of polar monomer onto NR improves thermal, weathering
and oil resistance of the rubber (Moolsin & Robishaw, 2011). Furthermore, the low
modulus and hardness of NR could be improved by incorporation of a hard segment
such as polymethyl methacrylate onto NR. This incorporation could be done by grafting
or blending. Grafted natural rubber by polar monomers has also better wettability and
biocompatibility (Dafader et al., 2006). NR is mostly grafted with methyl acrylate,
acrylonitrile and styrene. The degree of grafting is in the range of 60-80%. A graft
copolymer “Hevea plus MG” based on methyl methacrylate natural rubber has been
marketed in the middle of 20 centuries. “Hevea plus MG” has excellent properties such
as electrical resistance, abrasion, hardness and modulus. Graft polymerization of NR
with methyl methacrylate has been reported widely by different authors. Cooper et al.
(1959) grafted methyl methacrylate onto natural rubber using ultra violet and γ ray as
initiator. The results showed that the rate of copolymerization was first order with
4
respect to monomer concentration. It was concluded that by photo initiated graft
polymerization the effect of temperature was very small. Several photo sensitizers were
tested. The lowest efficiency belonged to azobisissobutyronitrile and the best yield was
observed by 1-chloroanthraquinone. The grafting efficiency was dependent on reaction
time, reaction temperature, initiator and monomer concentration (Cooper et al., 1959) .
1.2 Problem statement
ENR contains very useful technical characteristics as mentioned before. The
good adhesion property of ENR and presence of oxirane group in the chemical structure
could find its application in coating. However, ENR suffers the shortcomings of poor
solubility in organic solvent, low Tg and incompatibility with most of the conventional
curing agents used for ring opening and crosslinking of epoxy resins. Furthermore,
uncured ENR suffers from softening at high temperatures and increased rigidity at low
temperatures (Aprem et al., 2005). To improve the processability and solubility ENR
could be degraded to decrease its molecular weight to less than 12000. On the other side
graft copolymerization of methyl methacrylate onto ENR could increase the Tg and
weathering resistance due to reduction in the amount of unsaturation some extent.
Furthermore, mixing of ENR with poly aliphatic amine as curing agent results in
separation of the rubber phase (Moolsin & Robishaw, 2011). Graft polymerization of
methyl methacrylate monomer could improve the phase separation and make it more
compatible with curing agents. Among the different degradation methods reported, there
is a lack of study which compare these methods under similar conditions. In first part of
our work we compare three different methods which degrade ENR25 through radical
mechanism. In the second part the product of chemical oxidation of ENR is studied and
compared. In the last part of our work MMA is grafted onto LENR obtained, to improve
5
its overall properties. The obtained grafted resin was cured with three different amine
and amine adducts to find out which curing agent gives the best performance.
1.3 Objectives
The current study is carried out with the following objectives:
a) To investigate degradation of ENR through radical mechanism using three
different methods. The three selected degradation methods are (i) mechanical milling,
(ii) radical oxidative degradations by potassium peroxodisulfate, and (iii) photo-
oxidation initiated by ultra violet (UV) irradiation.
b) To investigate degradation of ENR through chemical oxidation using H5IO6 and
KMnO4.
c) To graft methyl methacrylate to LENR obtained from UV degradation, and
using the grafted LENR as a resin for coating by curing it with different curing agents.
6
2 CHAPTER 2: LITERATURE REVIEW
2.1 Natural rubber
NR is currently ranked as the fourth most important natural resource after air
water and petroleum (Cornish, 2001) .The history of application of NR dates back to
1300 B.C., when Olmec civilization in South America used rubber to make rubbery
goods and balls. In 1770, Jose Priestly noticed that rubber could erase pencil marks.
Macintosh discovered that rubber could be used for water resistance finishing. He
applied a solution of rubber onto a cotton cloth, and it became water resistance. The first
product of vulcanized rubber was developed by Goodyear in 1893, the discovery which
made NR one of the most important and strategically products (Ikeda, 2014). NR is
currently used in different products such as tires, health equipment, adhesives, rubber
springs, vibration mounts, etc. Nearly 2500 plant species produce latex, but the Hevea
brasiliensis is the only commercial source of NR. The uncertainty in oil price and
demands for oil replacement are disadvantages for production of petroleum based
polymers and rubbers. It has led to an increase in the demand for NR which comes from
a sustainable resource (Warren‐Thomas et al., 2015). In 1876 Hevea brasiliensis was
successfully transplanted from the Amazon to the Malaya Peninsula and Ceylon in
South East Asia. The global NR production in 2013 was 11.15 million tonnes, which
had an increase of 4.7% compared to the year before (Rasutis et al., 2015). About 90%
of NR are produced in South-East Asia. NR consists predominantly of cis-1,4-
polyisoprene. Isoprene is produced by different kind of trees. The emission of isoprene
allows protects plants against heat stress. Polyisoprene is produced by adding activated
isoprene molecule, isopentenyl diphosphate, to the growing chain. Cis-
7
prenyltransferases catalyses the polymerization reaction (Schmidt et al., 2010).The
colloidal suspension gathered from Hevea brasiliensis is called NR. The tapping
normally is done three times per week. The latex will be coagulated from suspension
using formic acid. NR collected contains 30 -35% rubber. After centrifugation of the
latex, the rubber content will increase to 60 %. To retard bacterial growth and increase
the pH, ammonia is added to the latex. Treated NR contains 0.2-0.7% NH3. The rubber
content depends on soil properties, age of the tree and seasonal effect (Subramaniam,
1995). Young trees produce NR with lower content of molecular weight (Mn ) because
of incomplete biosynthesis of the rubber chain (Kovuttikulrangsie & Tanaka, 1999).
Tangpakdee et al. (1996) reported that an increase in the age of the tree can cause a rise
in Mn of NR. In gel permeation chromatography (GPC) the molecular weight
distribution (MWD) could be unimodal, if only one peak appears but by appearance of
several peaks the MWD is multi modal. The trees younger than two years shows a
unimodal MWD (Tangpakdee et al., 1996). As the tree ages, a skewed uni or bi modal
MWD could be observed, in which the high weight average molecular weight (Mw) peak
is bigger than the low Mw peak (Kovuttikulrangsie & Sakdapipanich, 2004). The Mw is
in the range of 104-107 g/mol and polydispersity ranging from 2.5 to 10. Size
distribution of rubber particles in the latex phase is in between 0.05 micron to 0.3
micron (Sakdapipanich et al., 2002). NR could not crystallize under ordinary condition
and it exists as amorphous rubbery material. In opposition to NR, Gutta-percha is
formed from trans- 1, 4-polyisoprene, and has more regular conformation. It is able to
crystallize under normal conditions and hence exist as rigid hard material (Nor &
Ebdon, 1998). There are other impurities inside NR such as: 1) neutral lipids, 2.4%, 2)
proteins, 2.2%, 3) glycolipids and phospholipids 1%, 4) carbohydrate, 0.4%, 5) ash,
0.2%. Several amino acids inside NR can cause allergic response during usage of
products based on NR; therefore, sometimes deproteinized NR will be preferred to use.
8
However, there are many applications that NR could not be replaced by synthetic rubber
such as jet and air craft carriers where NR offers better mechanical performance. There
were many attempts to synthesize NR .The best result was reported by Halasa et al.
using Ziegler-Natta and metallocene catalyst which yielded the highest cis isoprene
content of about 98.5% with average number of molecular weight of 200000 g/mol
(Halasa et al., 2007). However, so far none of the synthetic polyisoprene have been able
to match the mechanical performance of NR.
2.2 Modification of Natural rubber
NR is used to make more than 40000 different products. This wide range of
application is due to the possibility of modification of NR to obtain the desired
properties. There are two main kinds of modification such as: Physical modification and
chemical modification.
Physical modification 2.2.1
Physical modification could be done through blending of NR with other
polymers or materials such as carbon black. Blending is considered as the simplest and
most adaptable techniques for developing new materials. It is essential to have the
ability to anticipate and comprehend the physical, mechanical properties and
morphology of the blended polymer. Polymer blending could result in a homogeneous
phase or separated phases or a mixture of both. The amount of homogeneity is
dependent on several factors such as processing temperature, solvent properties and
additives that are employed (Rameshwaram et al., 2005). The majority of polymer
blends are observed to be immiscible. The process which alters the interfacial properties
9
of immiscible blends is called compatibilization. Compatibilization is based on the
concept of reducing interfacial tension coefficient, which can lead to stabilization of
desired blend morphology. A blend compatibilizer could be a macromolecule having
interfacial activities in the heterogeneous polymer blends (Koning et al., 1998). There
are different methods of polymer blending such as: 1) roll milling, 2) melt blending, 3)
solvent blending, 4) latex blending. The properties of a blended polymer are dependent
on the nature of its constituents, phases and phase continuity. Tg, modulus and
morphology could explain the properties of a blended polymer (Favis, 2000) . NR is a
non-polar polymer and suffers from poor heat resistance, ozone resistance and low oil
and organic solvent resistance. Blending of NR with polar polymers could improve
specific properties of NR. The polar polymers with groups such as acrylonitrile,
fluorine, epoxy, carbonyl and chlorine have great resistance to swelling to oil and
organic solvent. For example blending of NR with chloroprene rubber increases the
resistance against heat and ozone (Thomas et al., 2013). The oil extended NR is the
product of blending NR with oil which has application in tire industry to enhance skid
resistance of tire on wet roads (Corish, 1967). Blending of polypropylene with NR with
definite composition has properties of vulcanized rubber such a resilience and
flexibility but can soften with heat, like thermoplastic polymers (Ismail, 2002) . Nitrile
polymer (copolymer of acrylonitrile and butadiene) has excellent oil resistant property
due to presence of acrylonitrile. The higher the proportion of acrylonitrile the greater is
the oil resistance. Blending of NR and nitrile rubber enhances the characteristic
properties of both polymers. The vulcanized blend (NR and nitrile rubber) has good
strength resistance similar to NR and great resistance to swelling to oil similar to nitrile
rubber (Jones & Tinker, 1997). Blending of ethylene –propylene (EPM) copolymer with
NR has a great economical advantage due to the cheap price of NR. Electrical
resistance and great ozone resistance are prominent properties of blended NR with
10
EPM. This material is mostly used as electrical protection sheathing (Jones & Tinker,
1997). The second kind of physical modification is deproteinizing of NR. Deproteinized
NR has better mechanical properties due to increased hydrocarbon content and
decreased nitrogen and ash content. Removal of protein reduces the moisture sensitivity
and so it finds more usage in electrical and engineering industry. Besides deproteinized
natural rubber has less allergic effect compared with NR (Manroshan et al., 2009).
Chemical modification 2.2.2
There are three kinds of chemical modification such as: 1) Modification by bond
rearrangement such as cyclisation, cis-trans isomerization, carbon- carbon crosslinking
and depolymerisation (Lee et al., 1963), 2) Grafting a new polymer onto NR backbone
and 3) Modification by introducing of new chemical groups like chlorine and epoxy
such as epoxidized natural rubber.
2.2.2.1 Cyclization
Cyclization of NR is done by treating of NR with acid catalyst at elevated
temperature (not more than 140ºC). Intermolecular cyclization of neighboring unit could
occur by various acid and Friedel-Crafts catalyst. Lewis acids such as TiCl4, SnCl4,
FeCl3 and BF3 have been used for cyclization (Mirzataheri, 2000) . During cyclization,
mono cyclic structure and poly cyclic structure could be formed. The resulting product
is very brittle but still shows some elastic behavior (Hashim et al., 2002). Property and
structure of cyclized rubber is related on the reaction condition and cyclization agent.
The product of cyclization of NR is resistant to alkalis and acids; therefore, it is used in
anti-corrosion and marine coatings. Cyclized rubber also finds application in adhesive
11
industry (Mirzataheri, 2000). Cyclized NR has greater tensile strength, abrasion
resistance and hardness compared to NR. During cyclization of NR a drop in viscosity
is observed which is caused by the decrease in the effective volume of the polyisoprene
molecule and also degradation of long chain molecules of NR. During cyclization the
empirical formula of NR does not change but a partial loss of unsaturation is observed
(Lee et al., 1963). Several methods have been used to determine the degree of
cyclization of rubber such as titration with bromine, Wijs method, hydro chlorination,
iodometric titration and titration by thiosulfate after reaction with per benzoic acid. Lee
et al. (1963) reported that using per benzoic acid is the most effective method for
determination of unsaturation.
2.2.2.2 Cis-trans isomerization
Several unsaturated and conjugated polyolefins could undergo cis-trans
isomerization under UV exposure and in presence of sulfur and bromide compounds.
However, this method is not effective to interconvert the isomerization of NR. Cis-trans
isomerization of NR was achieved by treatment with SO2 at 140ºC after 24 h (Cunneen,
1960). The product contains 43% of cis double bond and 57% of trans double bond.
This ratio is the equilibrium composition for isoprene (Cunneen et al., 1959).
2.2.2.3 Vulcanization
The most important process in rubber industry is vulcanization (crosslinking).
Initially NR was utilized uncured and suffered from softening at high temperature and
increased rigidity at low temperatures (Aprem et al., 2005). Charles Goodyear in 1890
discovered a process called vulcanization. This process could enhance strength and the
12
elastic property of rubber due to formation of three-dimensional network by cross-
linking between rubber macromolecules. The tendency of crystallinity noticeably
decreases by vulcanization of rubber and the solvent resistant enhances significantly.
Poly and mono sulfidic crosslinks are created between the rubber chains and
accordingly reduce drastically the movement of the chains (Morrell & Blow, 1982).
Different chemicals have been used to vulcanize rubber such as sulfur, quinone, metal
oxide and peroxide (Mark et al., 2013). Vulcanization has been done by different energy
sources such as heat, irradiation, microwave energy and ultrasound. The cross link
formation and vulcanization rate could be determined by a rheometer or oscillating disk
(Morrell & Blow, 1982). There are three stage in vulcanization process, namely:
induction, curing and over cure. The period of time before crosslinking begins is called
induction or scorch. Curing is the time frame within the cross-linking reaction begins. In
over cure stage crosslinking destruction and cross linking inter change appears. By
plotting torque against time in over cure stage torque remains unchanged or decrease
slightly. There is an optimal value in crosslink density in that the tensile strength is
maximum. By further increase in crosslink density as occurs in over cure stage, tensile
strength decreases (López‐Manchado et al., 2003).The vulcanization reaction has been
improved by invention of organic accelerators, retarders and activators. The accelerators
are usually derivatives of alkyd dithiocarbamic acid and mercaptobenzothiazole. Zinc
oxide, nitrogenous base and fatty acid are used as activators in vulcanization process.
The role of activators is to make accelerators perform more effectively. The ratio of
sulfur to accelerator has a great influence on the cross-linking reaction. A low ratio of
sulfur to accelerator causes high proportion of mono sulfidic crosslinks, which has
better heat resistance. A high ratio produces longer cross-links with higher strength
(Aprem et al., 2005). Activated accelerator reacts with cyclic sulfur molecule and
creates active sulfur complex. The complex is unstable and self-destroyed with
13
producing radicals which attack isoprene in the rubber chain and create sulfur-rubber
intermediate. The sulfur rubber intermediate could attack another rubber chain to make
polysulfidic links between the rubber molecules. Dynamic vulcanization is the process
of vulcanizing a polymer in its molten state, while it is mixed with other polymers
which are inert to vulcanization reaction. Dynamic vulcanization is used widely to
produce thermoplastic polymers (Aprem et al., 2005).
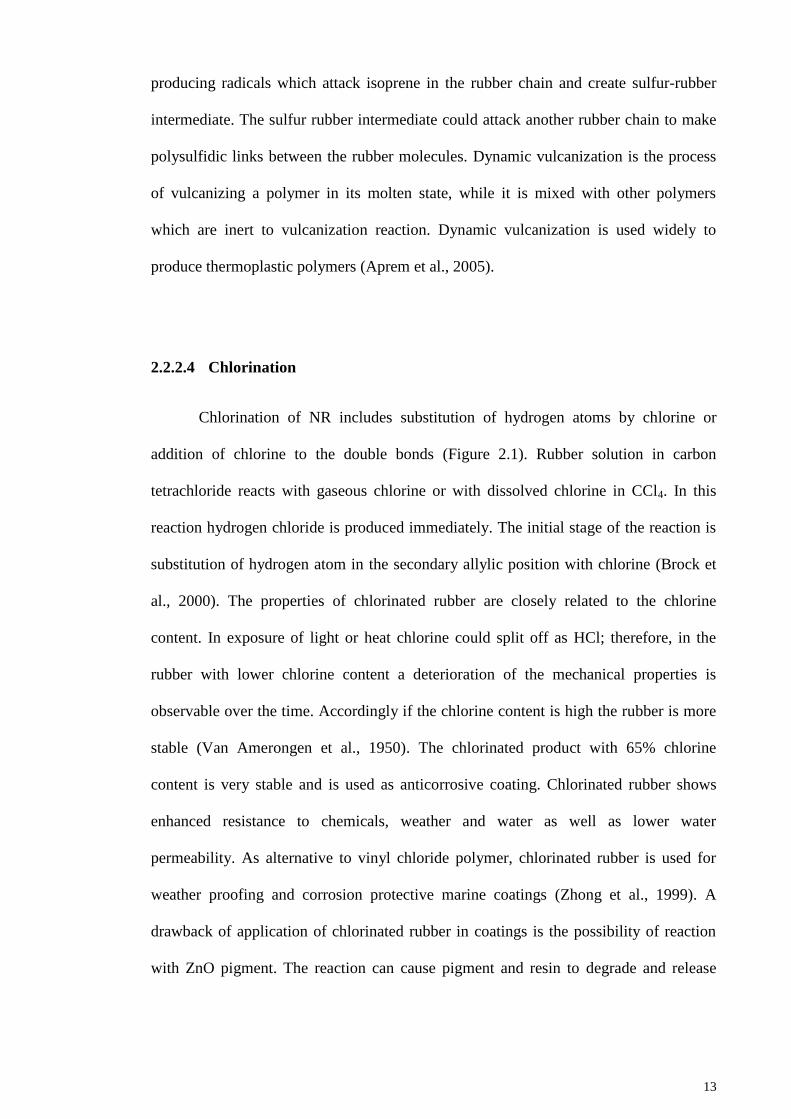
2.2.2.4 Chlorination
Chlorination of NR includes substitution of hydrogen atoms by chlorine or
addition of chlorine to the double bonds (Figure 2.1). Rubber solution in carbon
tetrachloride reacts with gaseous chlorine or with dissolved chlorine in CCl4. In this
reaction hydrogen chloride is produced immediately. The initial stage of the reaction is
substitution of hydrogen atom in the secondary allylic position with chlorine (Brock et
al., 2000). The properties of chlorinated rubber are closely related to the chlorine
content. In exposure of light or heat chlorine could split off as HCl; therefore, in the
rubber with lower chlorine content a deterioration of the mechanical properties is
observable over the time. Accordingly if the chlorine content is high the rubber is more
stable (Van Amerongen et al., 1950). The chlorinated product with 65% chlorine
content is very stable and is used as anticorrosive coating. Chlorinated rubber shows
enhanced resistance to chemicals, weather and water as well as lower water
permeability. As alternative to vinyl chloride polymer, chlorinated rubber is used for
weather proofing and corrosion protective marine coatings (Zhong et al., 1999). A
drawback of application of chlorinated rubber in coatings is the possibility of reaction
with ZnO pigment. The reaction can cause pigment and resin to degrade and release
14
HCl. At temperature higher than 60º the same decomposition is observed so the usage
of chlorinated rubber is not appropriate at elevated temperature (Brock et al., 2000).
Figure 2.1: Chlorination of NR: (1 Addition reaction. (2 Substitution reaction.
2.2.2.5 Hydrogenation
Polymers with olefinic units have a low resistance to heat and hydrogenation of
NR can enhance resistance to heat and oxidative degradation through saturation of
isoprene. Furthermore, hydrogenated isoprene shows lower gas permeability and better
resistance to oil in comparison with NR. Thermal properties of hydrogenated NR
increase along with the rise in degree of hydrogenation without noticeable change in Tg.
These new properties increase the application of hydrogenated NR in various industries
including military, automotive and aerospace (Samran et al., 2005). Catalytic
hydrogenation of NR could be carried out by heterogeneous or homogenous catalysts.
Hydrogenation could be done by using hydrogen gases in the presence of metal
catalysts such as Ni, Pd and Pt. Hydrogenation with a heterogeneous catalyst such as Pd
has a yield of 8% hydrogenation mainly due to sticky nature of NR that can contaminate
15
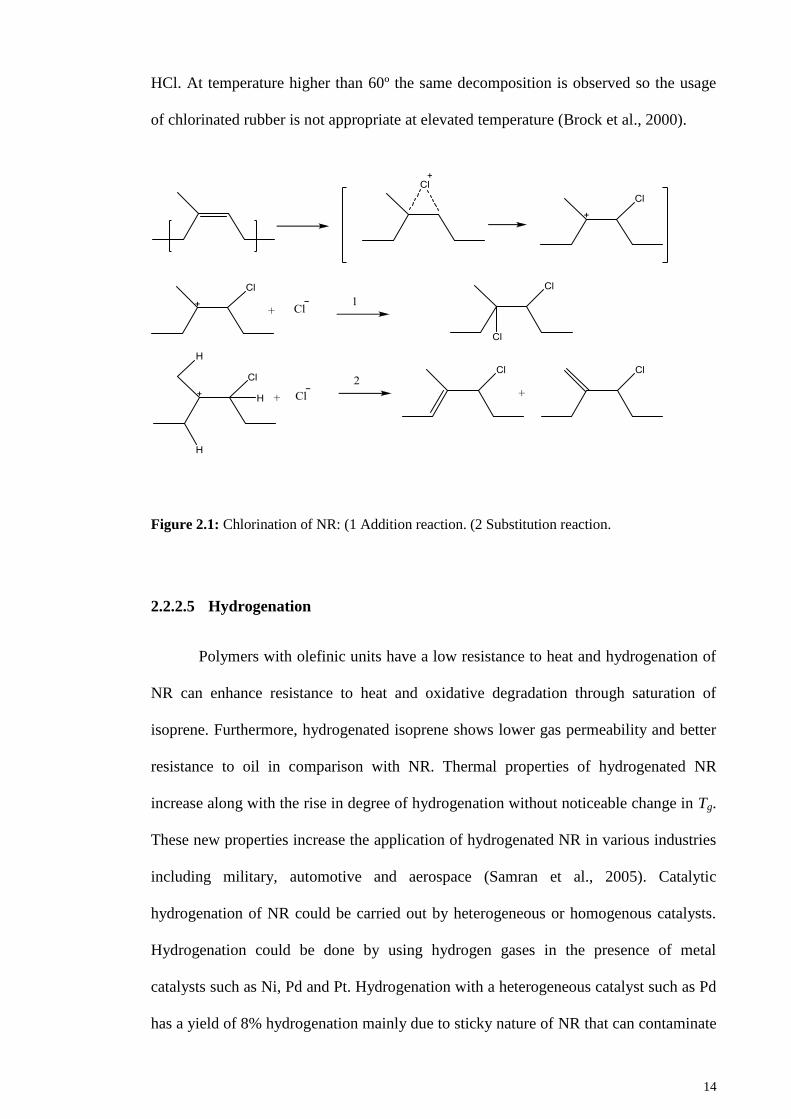
the surface of catalyst (Phinyocheep, 2014) Complete hydrogenation of NR was
reported by Singha et.al, using RhCl(PPh3)3 as catalyst. They reported that the degree of
hydrogenation is related to concentration of catalyst and NR(Singha et al., 1997) .
Diimide (N2H2) is also capable to release and transfer H2 to unsaturated isoprene unit.
Hydrogenation using diimide could be carried out under low pressure and utilizing
simple apparatus. Oxidation of hydrazine or decomposition of
arenesulphonylhydrazides by heat could produce diimide. Para-
toluenesulphonylhydrazide (p-TSH) has been carried out for hydrogenation of NR
(Samran et al., 2005). p-TSH decomposes at 135ºC and generates diimide and para-
toluenesulfonic acid (Figure 2.2). 1 mol of p-TSH could hydrogenize one mol of C=C
bond. The drawback of this reaction is the presence of para-toluenesulfonic acid which
causes cis-trans isomerization in the isoprene unit.
Figure 2.2: Hydrogenation of NR using p-TSH at 135 ºC.
2.3 Epoxidized natural rubber
Epoxidized natural rubber (ENR) as commercial product was produced in the
1980. NR could be easily epoxidized in solution by peroxy acids such as peracetic,
16
perbenzoic acid etc. Epoxidation could be done in latex form as well as in organic
solutions (Azhar et al., 2017). In industrial epoxidation process, two main reagents are
used: peroxyacetic acid or mixture of formic acid and hydrogen peroxide. Epoxidation
reaction can go further to reach any desired epoxy content. Among various organic
peroxyacids only m-chloroperbenzoic acid could react quantitatively with the double
bond. The activation energy for epoxidation reaction is 56.2 kJ/mol. The yield of
epoxidation is related to reaction time and concentration of NR and peroxyacid
(Vernekar et al., 1992). During epoxidation several side reactions occur which introduce
functional groups such as tetrahydrofuran, hydroxyl and ester groups into the NR chain
(Burfield et al., 1984).There is a linear enhancement of Tg with increase in epoxy
content. By 1 mol % increase in epoxy content, Tg increase around 1º C. ENR with 25
mol% epoxidation (ENR25) has a Tg of -47º C, while Tg of ENR with 50 mol%
epoxidation (ENR50) is -22º C (Gelling, 1991). The increase of Tg is expected to
enhance many properties of ENR such as better and stronger bond to metal, tensile
strength, fatigue behaviour and wet grip. Wet grip is an important measurement of tire
safety. The tires with better wet grip, exhibit shorter distance to halt on wet road when
brake is applied (Hashim et al., 2002).NR is susceptible to crystallization at low
temperatures. Crystallization of NR leads to significant changes in mechanical
performance. A nonlinear increase in density and Young’s modulus is observed with
rise in degree of crystallization. Low temperature crystallization does not occur in
ENR25 and ENR50 (Fuller et al., 2004). The characteristic peak of oxirane group in IR
spectrum appears at 870 cm-1
and belongs to stretching vibrations of (cis C-O).
Characterization peak of NR appears at 835cm-1
which is related to cis double bond
(=C-H). In the NMR spectrum, the methine proton adjacent to oxirane group appears at
2.68 ppm while the methine proton attached to the double bond has a peak at 5.14 ppm.
By dividing of integration area of these two methine protons epoxy content could be
17
measured. There are also other methods for calculation of epoxy content of ENR such
as direct titration with hydrogen bromide acid, differential scanning calorimetry (DSC)
technique and elemental analysis (EA). DSC results of ENR have shown that increase in
epoxy content linearly affected the increase of Tg (Burfield et al., 1984). By increasing
the epoxide content various properties of ENR are improved such as polarity, and air
permeability. The increase in polarity of ENR can result in more resistance to oil and
nonpolar solvent, while it deteriorates resistance to polar solvents. In the same manner,
the tack of ENR towards nonpolar polymers decrease, but on the contrary the
compatibility with polar polymer enhances obviously. Oil resistance of ENR 50 is
comparable to acrylonitrile butadiene rubber and also its air permeability is similar to
butyl rubber (Baker et al., 1985) . Because of the improved oil resistance ENR could be
utilized for oil -contact engine parts such as seals tubes and hoses (Phinyocheep, 2014).
Oxirane group could undergo both electrophilic and nucleophilic attacks. Therefore, in
the epoxidation process due to presence of acid, ring opening could occur. In the ring
opening of epoxide both steric and electronic factors are important. The final product of
ring opening of epoxides by an acid is trans diols. Ring opening of adjacent epoxide
18
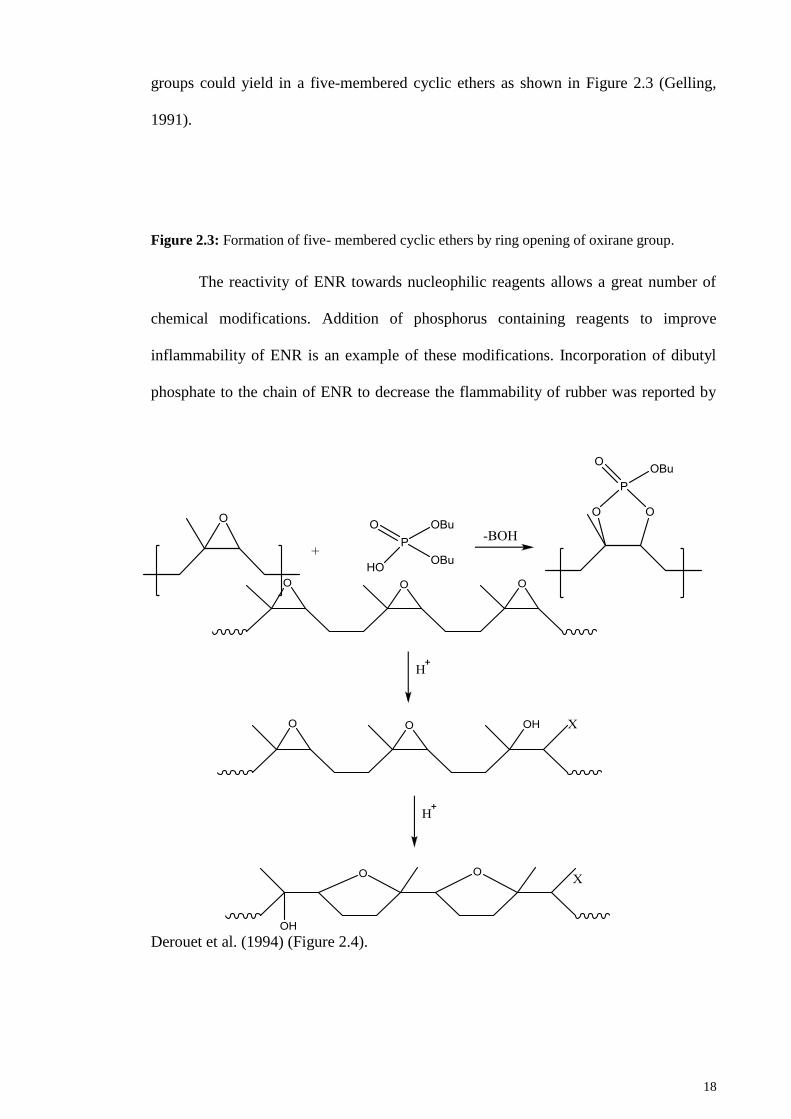
groups could yield in a five-membered cyclic ethers as shown in Figure 2.3 (Gelling,
1991).
Figure 2.3: Formation of five- membered cyclic ethers by ring opening of oxirane group.
The reactivity of ENR towards nucleophilic reagents allows a great number of
chemical modifications. Addition of phosphorus containing reagents to improve
inflammability of ENR is an example of these modifications. Incorporation of dibutyl
phosphate to the chain of ENR to decrease the flammability of rubber was reported by
Derouet et al. (1994) (Figure 2.4).
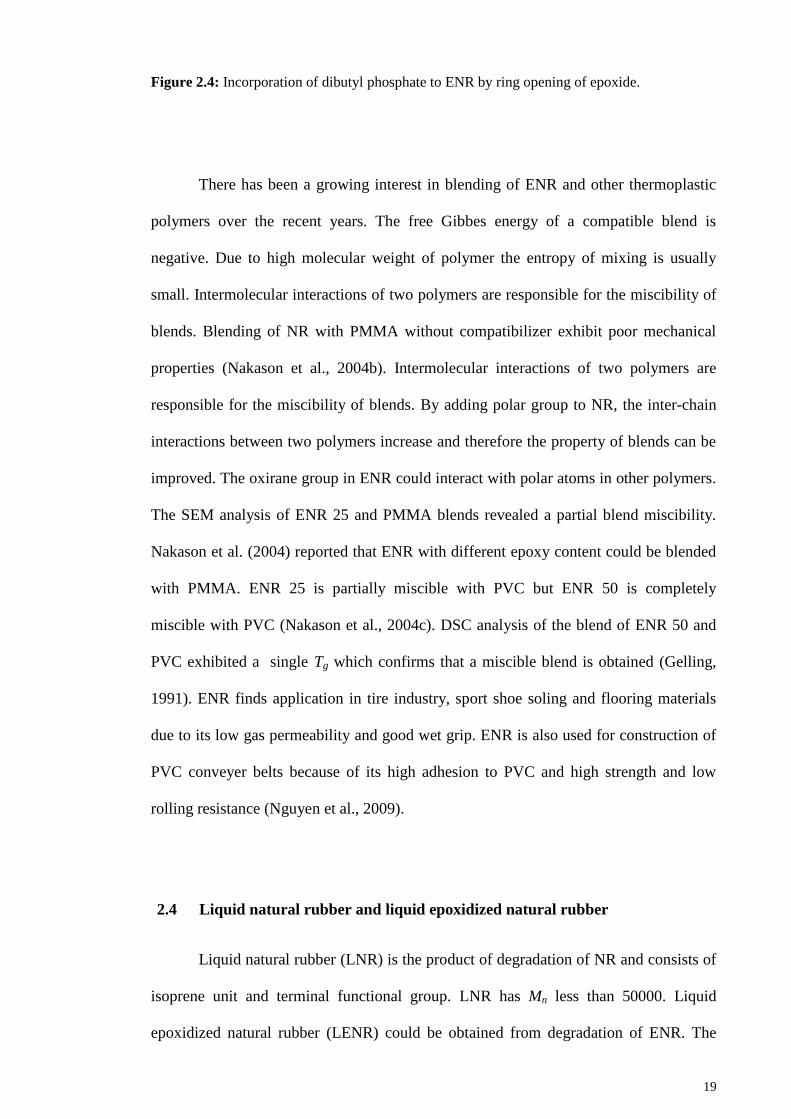
19
Figure 2.4: Incorporation of dibutyl phosphate to ENR by ring opening of epoxide.
There has been a growing interest in blending of ENR and other thermoplastic
polymers over the recent years. The free Gibbes energy of a compatible blend is
negative. Due to high molecular weight of polymer the entropy of mixing is usually
small. Intermolecular interactions of two polymers are responsible for the miscibility of
blends. Blending of NR with PMMA without compatibilizer exhibit poor mechanical
properties (Nakason et al., 2004b). Intermolecular interactions of two polymers are
responsible for the miscibility of blends. By adding polar group to NR, the inter-chain
interactions between two polymers increase and therefore the property of blends can be
improved. The oxirane group in ENR could interact with polar atoms in other polymers.
The SEM analysis of ENR 25 and PMMA blends revealed a partial blend miscibility.
Nakason et al. (2004) reported that ENR with different epoxy content could be blended
with PMMA. ENR 25 is partially miscible with PVC but ENR 50 is completely
miscible with PVC (Nakason et al., 2004c). DSC analysis of the blend of ENR 50 and
PVC exhibited a single Tg which confirms that a miscible blend is obtained (Gelling,
1991). ENR finds application in tire industry, sport shoe soling and flooring materials
due to its low gas permeability and good wet grip. ENR is also used for construction of
PVC conveyer belts because of its high adhesion to PVC and high strength and low
rolling resistance (Nguyen et al., 2009).
2.4 Liquid natural rubber and liquid epoxidized natural rubber
Liquid natural rubber (LNR) is the product of degradation of NR and consists of
isoprene unit and terminal functional group. LNR has Mn less than 50000. Liquid
epoxidized natural rubber (LENR) could be obtained from degradation of ENR. The
20
degradation methods of NR and ENR are similar but ENR degrades through cleavage of
oxirane group and double bonds. At room temperature LNR is a sticky liquid and can
easily flow, therefore its mixing process with other materials does not consume as much
energy required for mixing of NR. Due to presence of terminal functional groups, LNR
could be chain extended through double bonds or reactive terminal groups. This can
improve the mechanical properties of vulcanized rubber. There are a variety of
functional groups that could be added to LNR such as bromine, hydroxyl, vinyl, amine,
phenyl and carboxyl (Berry & Morrell, 1974). But the most attractive and useful
terminal groups are carboxyl and hydroxyl. Due to excellent adhesion power and strong
cross-linking reactivity of LNR and LENR they have been utilized for adhesives,
compatibilizers, reactive plasticizers, viscosity modifier and sealants (Nair et al., 1997).
Synthesis 2.4.1
Preparation of LNR and LENR has been an attractive subject to the scientists.
There are 5 different methods for production of LNR such as photo degradation,
metathesis , redox, oxidation of double bond using chemical reagents and degradation at
high temperature (Kargarzadeh et al., 2014). LNR obtained from each method of
depolymerization has specific properties depending on the used method.
2.4.1.1 Redox method
21
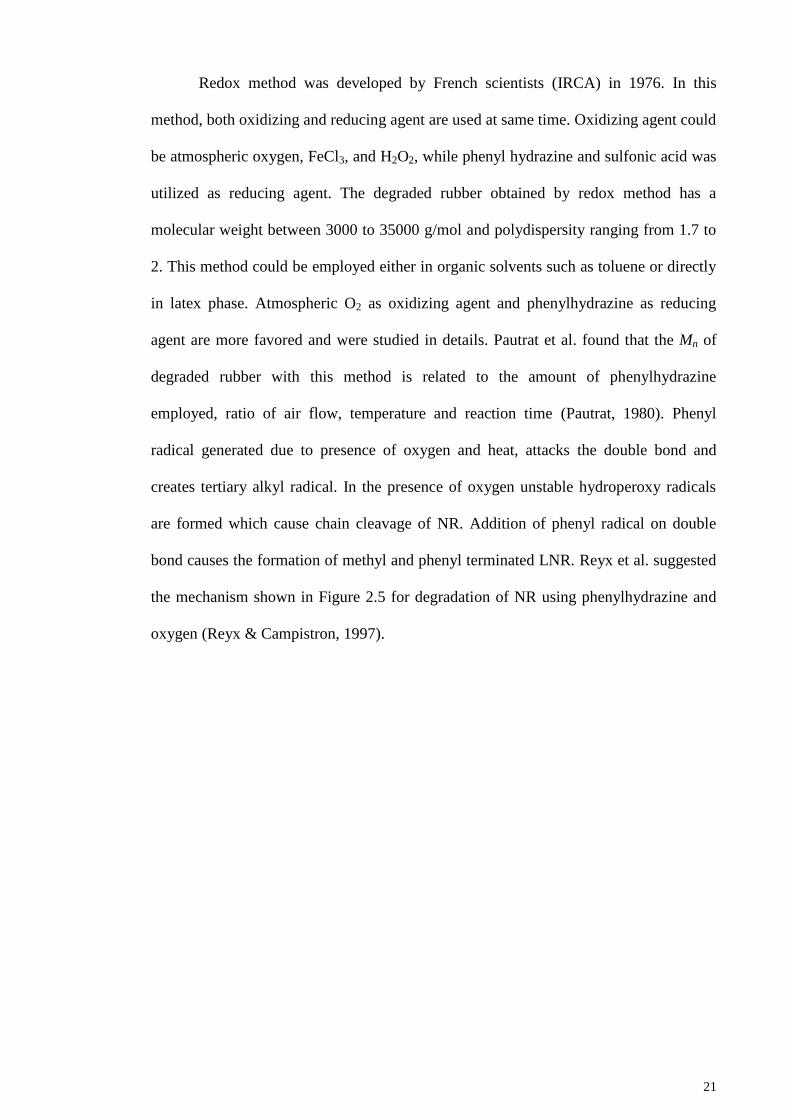
Redox method was developed by French scientists (IRCA) in 1976. In this
method, both oxidizing and reducing agent are used at same time. Oxidizing agent could
be atmospheric oxygen, FeCl3, and H2O2, while phenyl hydrazine and sulfonic acid was
utilized as reducing agent. The degraded rubber obtained by redox method has a
molecular weight between 3000 to 35000 g/mol and polydispersity ranging from 1.7 to
2. This method could be employed either in organic solvents such as toluene or directly
in latex phase. Atmospheric O2 as oxidizing agent and phenylhydrazine as reducing
agent are more favored and were studied in details. Pautrat et al. found that the Mn of
degraded rubber with this method is related to the amount of phenylhydrazine
employed, ratio of air flow, temperature and reaction time (Pautrat, 1980). Phenyl
radical generated due to presence of oxygen and heat, attacks the double bond and
creates tertiary alkyl radical. In the presence of oxygen unstable hydroperoxy radicals
are formed which cause chain cleavage of NR. Addition of phenyl radical on double
bond causes the formation of methyl and phenyl terminated LNR. Reyx et al. suggested
the mechanism shown in Figure 2.5 for degradation of NR using phenylhydrazine and
oxygen (Reyx & Campistron, 1997).
22
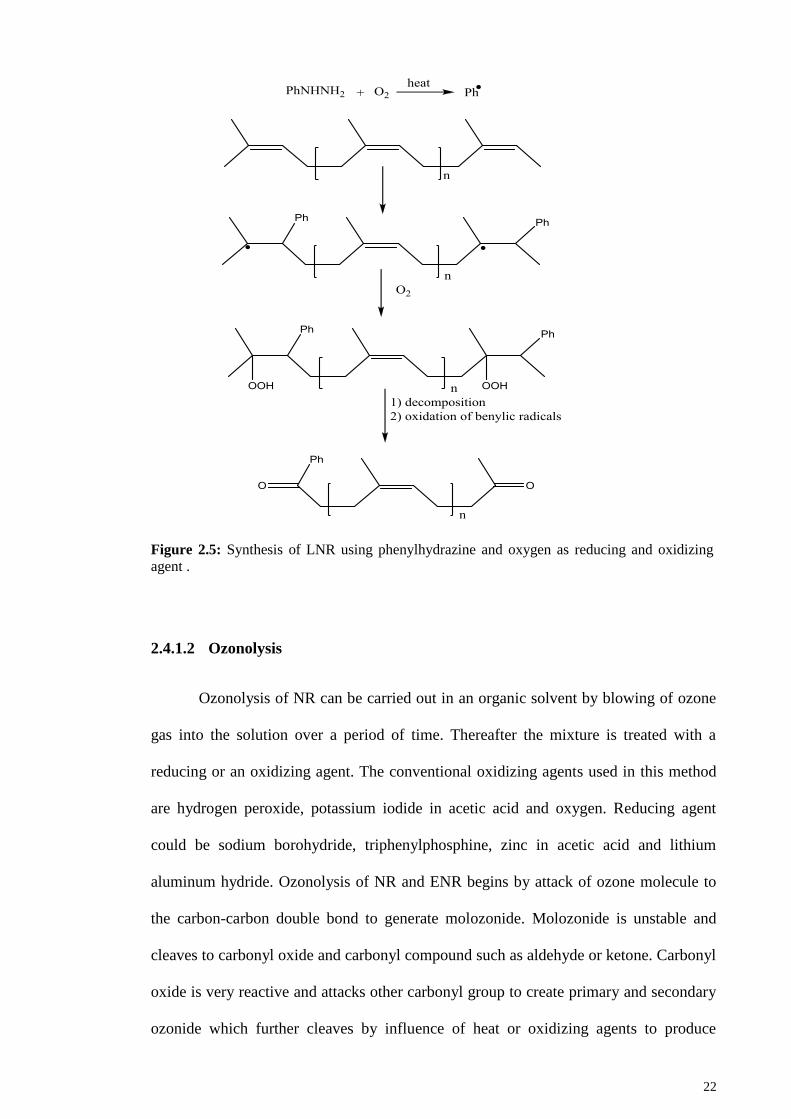
Figure 2.5: Synthesis of LNR using phenylhydrazine and oxygen as reducing and oxidizing
agent .
2.4.1.2 Ozonolysis
Ozonolysis of NR can be carried out in an organic solvent by blowing of ozone
gas into the solution over a period of time. Thereafter the mixture is treated with a
reducing or an oxidizing agent. The conventional oxidizing agents used in this method
are hydrogen peroxide, potassium iodide in acetic acid and oxygen. Reducing agent
could be sodium borohydride, triphenylphosphine, zinc in acetic acid and lithium
aluminum hydride. Ozonolysis of NR and ENR begins by attack of ozone molecule to
the carbon-carbon double bond to generate molozonide. Molozonide is unstable and
cleaves to carbonyl oxide and carbonyl compound such as aldehyde or ketone. Carbonyl
oxide is very reactive and attacks other carbonyl group to create primary and secondary
ozonide which further cleaves by influence of heat or oxidizing agents to produce
23
aldehyde and alcohols. Ozonolysis of NR is a significant and convenient method for
generation of unsaturated oligomers bearing active functional group such as hydroxyl,
carboxyl, ketone and aldehyde. Ozonolysis of NR in chloroform at a flow rate of 1.73
g/h of O3 was reported by Nor at el. The reaction was done at 0˚C and the Mn of NR
decreased from 271000 to less than 900 within 20 minutes which is a significantly rapid
method to prepare LNR. It has been found that degradation has occurred mostly in the
first minute of reaction and the degraded NR showed a bimodal distribution of Mn. By
proceeding of the reaction, Mn reached to 853 and the distribution of Mn became
unimodal again. They had reported that very low molecular weight levulinaldehyde and
levulinic acid were produced during ozonolysis. IR spectra of the ozonolysed rubber
showed a decrease in intensity of peaks at 1450 cm-1
and 835 cm-1
related to the
methylene group (-CH2- deforming) and double bond (=C-H wagging) respectively. The
peak at 1378 cm-1
assigned to methyl group (-CH3 asymmetric deformation) did not
change noticeably as the methyl group are not significantly affected by ozonolysis. Two
new peaks with great intensity were observed at 1720 cm-1
and 3440 cm-1
which are
related to carbonyl group and OH moiety. Another major change observed in the IR
spectra was the appearance of characteristic peak of ozonide at 1084 cm-1
. Kodena et al.
ozonolyzed high ammonia NR by bubbling ozone at a flow rate of 4g/h in the latex
phase, with subsequent treatment with hydrogen peroxide. The degradation rate was
related to the ozone concentration. Addition of hydrogen peroxide accelerated the
degradation rate but a rise in hydrogen peroxide concentration did not show any further
effect. Proceeding of reaction caused a decrease in initial pH from 8 to 6 which was due
to formation of low molecular weight levulinic acid. They had demonstrated that
degradation by ozone at pH below 8 do not go through the formation of ozonide but
interaction between hydrogen peroxide and ozone creating hydroxyl and hydroperoxy
radicals. Therefore, they suggested that the main reaction at acidic condition should be
24
radical oxidation (Kodama et al., 2003). As reported by Montaudo et al. the ozonolysis
of NR in 0˚C in hexane did not lead to formation of ozonide but only telechelic
oligomers bearing ketone and carboxylic acid. Degradation of unsaturated rubber by
ozone is still a potential method to produce LNR bearing reactive oxygenated terminal
groups (Montaudo et al., 1992).
2.4.1.3 Photochemical degradation
The energy of light with wave length of 300 nm to 600 nm is about 47 to 95
kcal. The dissociation energies of various bond of the polyisoprene are given in Table
2.1. From this table, it can be seen that energy of light is strong enough to lead to
photochemical bond dissociation of NR resulting in production of free radicals. External
initiator can be used to accelerate photo-degradation. External initiators such as dicumyl
peroxide, 2,2- azobis-(isobutyronitrile), benzoyl peroxide, etc. can reduce considerably
the induction period and generate free radicals. Impurities such as hydroperoxide and
peroxide could act also as initiators. Even highly pure polymers contain these kind of
impurities (Wiles & Carlsson, 1980). In some commercial resins, antioxidant and
peroxide decomposer are used to reduce the amount of peroxide and hydroperoxide
impurities.
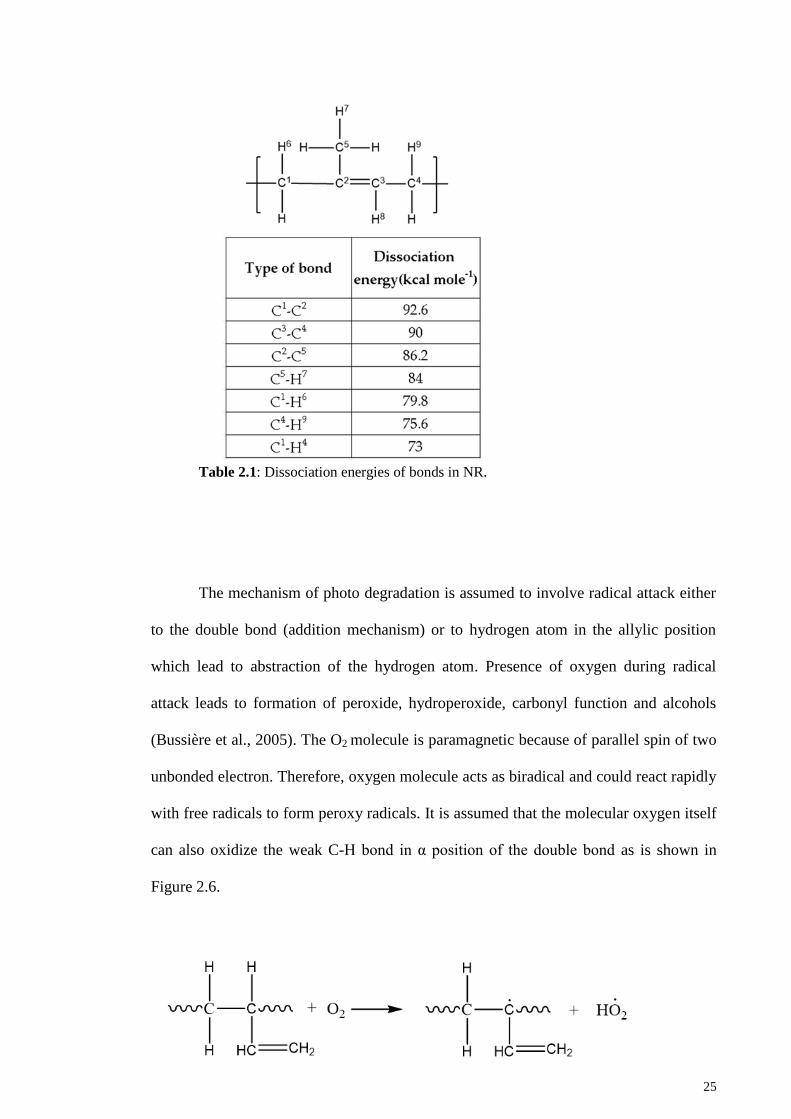
25
Table 2.1: Dissociation energies of bonds in NR.
The mechanism of photo degradation is assumed to involve radical attack either
to the double bond (addition mechanism) or to hydrogen atom in the allylic position
which lead to abstraction of the hydrogen atom. Presence of oxygen during radical
attack leads to formation of peroxide, hydroperoxide, carbonyl function and alcohols
(Bussière et al., 2005). The O2 molecule is paramagnetic because of parallel spin of two
unbonded electron. Therefore, oxygen molecule acts as biradical and could react rapidly
with free radicals to form peroxy radicals. It is assumed that the molecular oxygen itself
can also oxidize the weak C-H bond in α position of the double bond as is shown in
Figure 2.6.
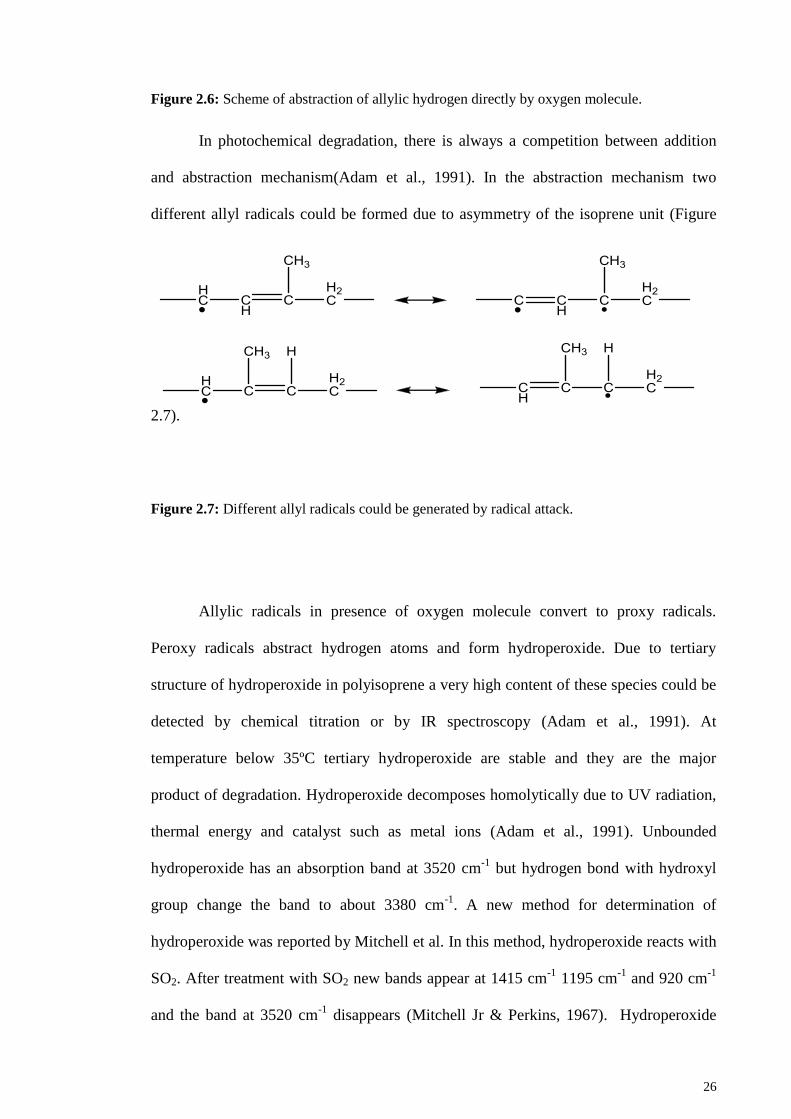
26
Figure 2.6: Scheme of abstraction of allylic hydrogen directly by oxygen molecule.
In photochemical degradation, there is always a competition between addition
and abstraction mechanism(Adam et al., 1991). In the abstraction mechanism two
different allyl radicals could be formed due to asymmetry of the isoprene unit (Figure
2.7).
Figure 2.7: Different allyl radicals could be generated by radical attack.
Allylic radicals in presence of oxygen molecule convert to proxy radicals.
Peroxy radicals abstract hydrogen atoms and form hydroperoxide. Due to tertiary
structure of hydroperoxide in polyisoprene a very high content of these species could be
detected by chemical titration or by IR spectroscopy (Adam et al., 1991). At
temperature below 35ºC tertiary hydroperoxide are stable and they are the major
product of degradation. Hydroperoxide decomposes homolytically due to UV radiation,
thermal energy and catalyst such as metal ions (Adam et al., 1991). Unbounded
hydroperoxide has an absorption band at 3520 cm-1
but hydrogen bond with hydroxyl
group change the band to about 3380 cm-1
. A new method for determination of
hydroperoxide was reported by Mitchell et al. In this method, hydroperoxide reacts with
SO2. After treatment with SO2 new bands appear at 1415 cm-1
1195 cm-1
and 920 cm-1
and the band at 3520 cm-1
disappears (Mitchell Jr & Perkins, 1967). Hydroperoxide
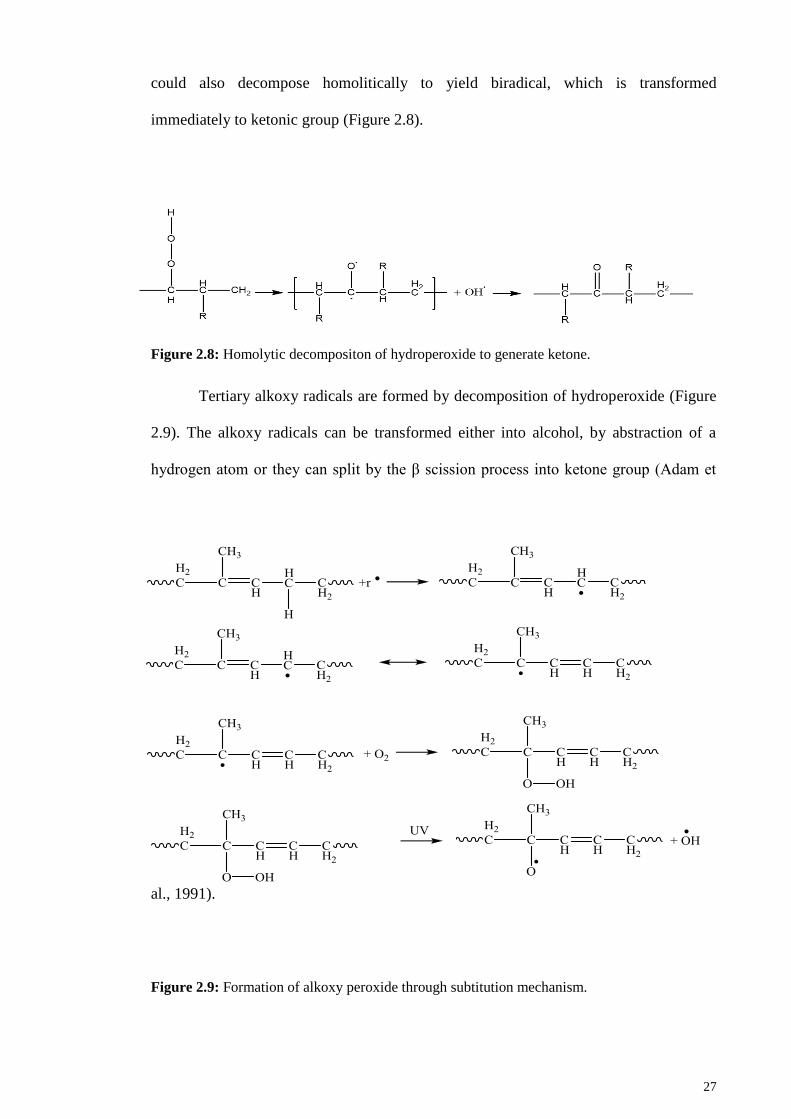
27
could also decompose homolitically to yield biradical, which is transformed
immediately to ketonic group (Figure 2.8).
Figure 2.8: Homolytic decompositon of hydroperoxide to generate ketone.
Tertiary alkoxy radicals are formed by decomposition of hydroperoxide (Figure
2.9). The alkoxy radicals can be transformed either into alcohol, by abstraction of a
hydrogen atom or they can split by the β scission process into ketone group (Adam et
al., 1991).
Figure 2.9: Formation of alkoxy peroxide through subtitution mechanism.
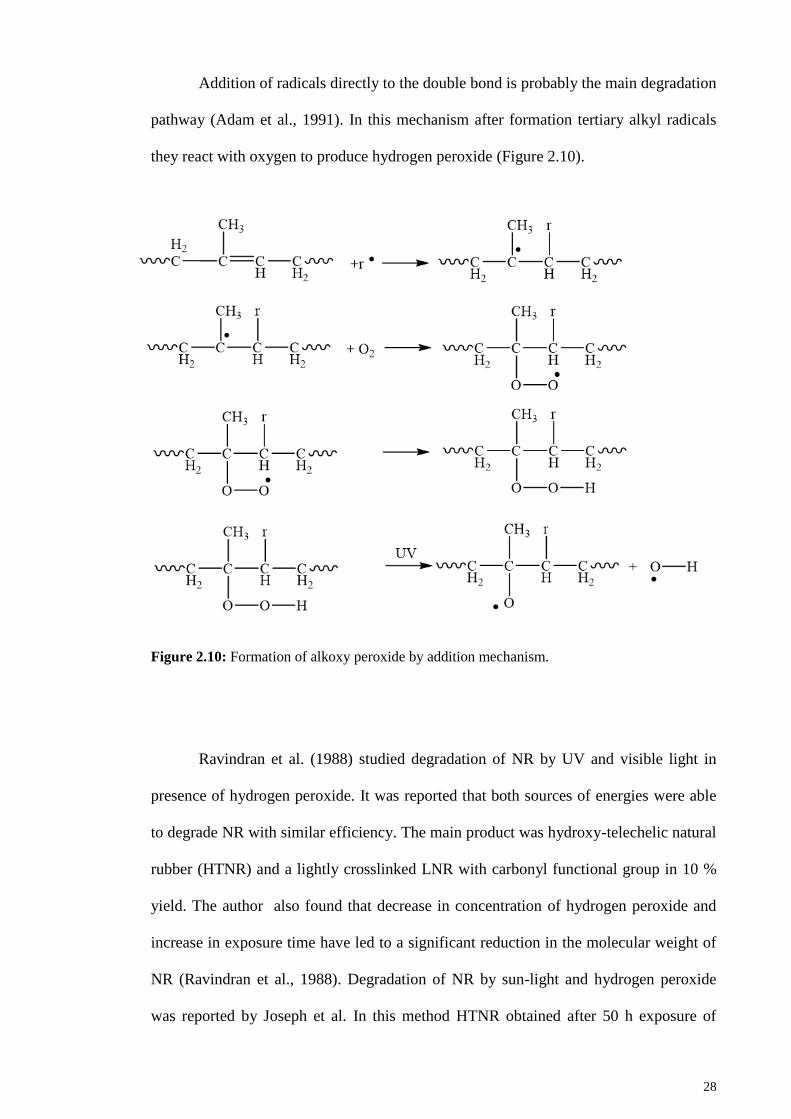
28
Addition of radicals directly to the double bond is probably the main degradation
pathway (Adam et al., 1991). In this mechanism after formation tertiary alkyl radicals
they react with oxygen to produce hydrogen peroxide (Figure 2.10).
Figure 2.10: Formation of alkoxy peroxide by addition mechanism.
Ravindran et al. (1988) studied degradation of NR by UV and visible light in
presence of hydrogen peroxide. It was reported that both sources of energies were able
to degrade NR with similar efficiency. The main product was hydroxy-telechelic natural
rubber (HTNR) and a lightly crosslinked LNR with carbonyl functional group in 10 %
yield. The author also found that decrease in concentration of hydrogen peroxide and
increase in exposure time have led to a significant reduction in the molecular weight of
NR (Ravindran et al., 1988). Degradation of NR by sun-light and hydrogen peroxide
was reported by Joseph et al. In this method HTNR obtained after 50 h exposure of
29
sunlight reached a Mn =7600. However no details of type of functional group was
reported (Joseph, 1991). Kargarzadeh et al. (2015) degraded ENR and NR using visible
light (fluorescent lamp, 40 watts) for 50 days exposure at 80º C. The Mn of NR
decreased from 2x10⁶ to 2x10
5 after degradation. IR spectra of degraded ENR and NR
showed the presence of hydroperoxide and carbonyl on the backbone of the rubber.
Furthermore a decrease in double bond density was observed (Kargarzadeh et al., 2015).
Dos Santos et al. demonstrated that UV degradation of polyisoprene films depended the
wavelength of UV irradiation; under 253 nm irradiation led to crosslinking of NR but at
wavelength above 300nm chain scission prevailed. It was argued that there is
competition between degradation and cross linkage mechanism in the photochemical
degradation and the wave length of the irradiation determines the prevailed mechanism
(Dos Santos et al., 2005).
2.4.1.4 Degradation using chemical reagents
Degradation of NR by chemical reagents has been widely investigated. Using
chemical reagents for chain cleavage of rubber seem to offer the possibility to control
the molecular weight of LNR and LENR, by varying the amount of reagent employed.
Up until now different oxidants were used to degrade rubber to produce telechelic liquid
rubber such as H5IO6, K2S2O8, Pb(OAc)4,(NH4)2S2O8, RuO4 and Na2WO4. (Fainleib et
al., 2013; Zhang et al., 2010). For depolymerization of ENR in latex phase,
Phinyocheep et al. (2005) used periodic acid because of its good solubility in water.
ENR was treated with periodic acid at 30ºC. The IR spectrum of product revealed that
there were no changes in oxirane group during depolymerization but appearance of
strong signals at 1721 cm-1
and 3460 cm-1
attributed to carboxyl group and hydroxyl
function respectively (Phinyocheep et al., 2005). It was concluded that the chemical
30
structure of the degraded ENR is composed of isoprene unit, epoxidized structure,
ketone and aldehyde end. The molecular weight deduction during chain cleavage was
depended on reaction time whereby Mn of the degraded rubber obtained was around 500
g/mol after 21 h processing with H5IO6. During the different reaction times, no change
in epoxy content was observed which implies that during depolymerization with
periodic acid, oxirane group is not involved in the reaction mechanism; instead the
reaction seems likely to have occurred via carbon double bond with an intermediate
such as vic diols. The efficiency of degradation of NR under the same condition using
periodic acid was definitely less than degradation of ENR as has been reported. It was
concluded that faster reaction of ENR with periodic acid is due to higher polarity of
ENR compared to NR. At prolonged reaction time, there was a small change in Mw but
the intensity of carbonyl group continuously increased. Gillier-Ritoit el al. (2003)
degraded synthesized epoxidized polyisoprene (EPI) with periodic acid. The reaction
was done in different solvents such as THF and chloroform (Gillier‐ Ritoit et al., 2003).
The yield of reaction with THF as solvent under the same condition was greater than
chloroform. It was concluded that a correlation between epoxide content and degree of
depolymerization exists. Moreover, the decrease in epoxy content in epoxidized
polyisoprene is correlated to an increase in Mn, which means a decrease of reaction
yields. Synthetic polyisoprene was also degraded with periodic acid. The results of EPI
and PI showed that degradation of PI needed twice greater amount of periodic acid to
achieve the same yield. Gillier-Ritoit el al. (2003) suggested a two-step mechanism for
the reaction. In the first step periodic acid attacks the double bond and converts it to
oxirane or vic diol. Oxirane or vic diol is cleaved by a second equivalent of H5IO6
(Figure 2.11). Gillier-Ritoit el al. (2003) experiments revealed that epoxy group is the
main part of mechanism of degradation reaction. The cleavage of oxirane is very fast
whereas the cleavage of double bond is a slow reaction (Gillier‐ Ritoit et al., 2003).
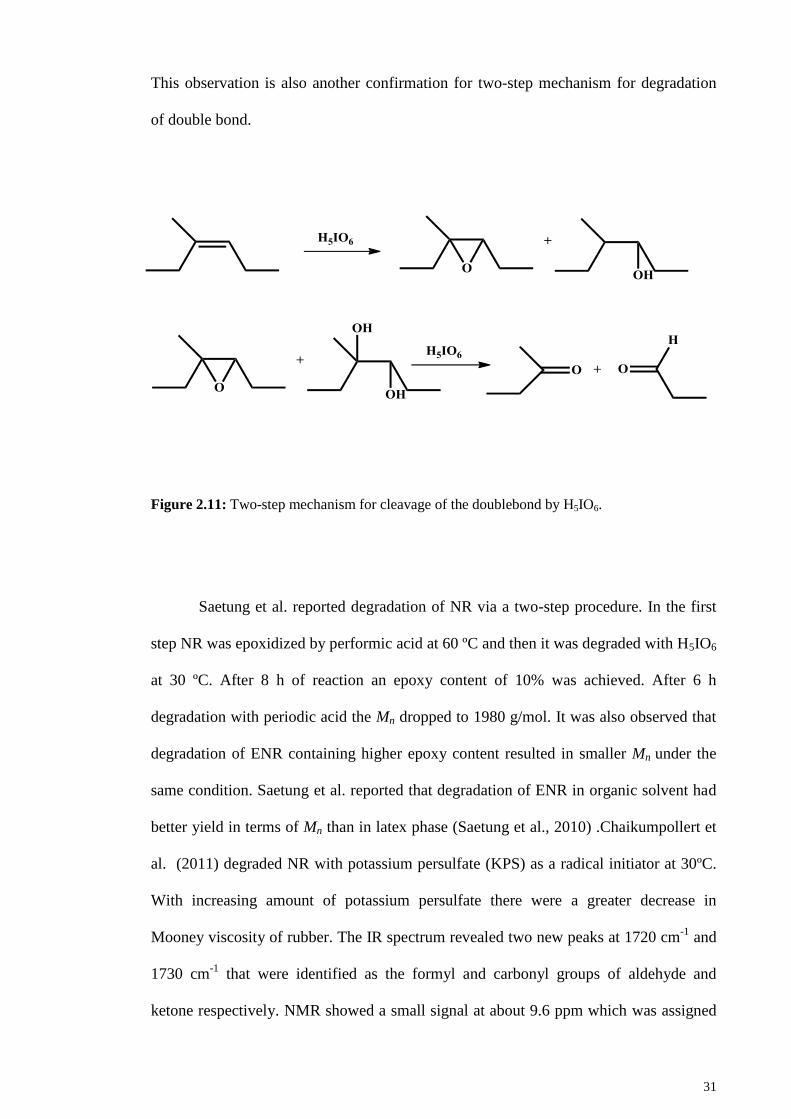
31
This observation is also another confirmation for two-step mechanism for degradation
of double bond.
Figure 2.11: Two-step mechanism for cleavage of the doublebond by H5IO6.
Saetung et al. reported degradation of NR via a two-step procedure. In the first
step NR was epoxidized by performic acid at 60 ºC and then it was degraded with H5IO6
at 30 ºC. After 8 h of reaction an epoxy content of 10% was achieved. After 6 h
degradation with periodic acid the Mn dropped to 1980 g/mol. It was also observed that
degradation of ENR containing higher epoxy content resulted in smaller Mn under the
same condition. Saetung et al. reported that degradation of ENR in organic solvent had
better yield in terms of Mn than in latex phase (Saetung et al., 2010) .Chaikumpollert et
al. (2011) degraded NR with potassium persulfate (KPS) as a radical initiator at 30ºC.
With increasing amount of potassium persulfate there were a greater decrease in
Mooney viscosity of rubber. The IR spectrum revealed two new peaks at 1720 cm-1
and
1730 cm-1
that were identified as the formyl and carbonyl groups of aldehyde and
ketone respectively. NMR showed a small signal at about 9.6 ppm which was assigned
32
to proton of formyl groups. The signal of methyl ketone which should appear at 2.1 ppm
was not isolated due to overlapping with isoprene methyl protons. Chaikumpollert et al.
(2011) concluded that during chain scission terminal formyl and carbonyl groups
appeared. The suggested mechanism for oxidative degradation with KPS is chain
scission at double bond of isoprene. The tensile strength of NR before degradation was
7.73 MPa which decreased to 1.6 MPa after degradation. NR and the degraded product
were vulcanized in the same condition. The tensile strengths results revealed that the
vulcanized rubber and the degraded one both had the same tensile strength of about 11.9
MPa. This implied that tensile strength of vulcanized rubbers was independent of
molecular weight of the NR employed (Chaikumpollert et al., 2011) . Deproteinized
natural rubber (DPNR) has less ageing property than NR because NR contains naturally
formed antioxidants which will be removed by deproteinizing. Tangpakadee et al.
(1998) degraded DPNR through different radical initiators such as potassium persulfate
(KPS), azobisisobutyronitrile (AIBN) and benzoyl peroxide. Better result was obtained
by degradation with KPS because of its good solubility in water and latex. Tangpakadee
et al. (1998) concluded that during degradation with KPS aldol condensation occurs, in
which reactive formaldehyde group will react with carbonyl group. The recombination
of carbonyl groups due aldol condensation increase the average number of molecular
weight of DPNR. To reduce the effect of aldol reaction several kinds of carbonyl
compounds such as acetone, propanal and formaldehyde were added into the reaction
mixture (the aldol condensation will occur between degraded DPNR and one of these
carbonyl compounds). The rate of depolymerization was faster in presence of carbonyl
compound than with the radical initiator alone. The minimum molecular weight was
obtained by 1 phr KPS and 15 phr propanal after 5 h of the reaction. To obtain the
optimum reaction temperature different temperatures (45º, 60º and 75ºC) were applied.
The best yield was achieved at 60ºC. Measurement of particle size distribution and
33
mean diameter particle size after and before depolymerization shows any changes,
which means that the rubber particles are not broken during degradation. The deduction
in polydispersity indicate that reaction proceeds randomly to come to equilibrium.
During depolymerization reaction primary and secondary hydroxyl group were formed
which was confirmed by reduction with LiAlH4 and1H-NMR analysis.
13C-NMR reveals
that both cis and trans epoxide groups are present in degraded product, which indicates
that degradation reaction with KPS is a radical reaction (Tangpakdee et al., 1998).
Klinkali et al. (2003) obtained LENR with Mn=10000 through degradation of ENR by
(NH4)2S2O8 in the presence of propanal. Authors found that the epoxy content does not
changed during degradation. The resulting LENR consists different terminal group such
as aldehyde and α and β unsaturated carbonyl groups. Due to degradation, a decline in
Tg of degraded product was observed (Klinklai et al., 2003). Ibrahim et al. (2014)
degraded NR using the combination of H2O2 and NaNO2. H2O2 could attack double
bond and convert it to oxirane ring and NaNO2 act as oxidizing agent and open the
epoxy ring, which cause chain cleavage. NO gas is released as by-product during the
reaction. It was found that the change in pH of reaction generate LNR with different
functional group. In basic condition carbonyl, terminal groups are created, but in acidic
condition creation of hydroxyl terminal group is mostly preferred. LNR obtained in
acidic condition has lower molecular weight around 10500 after 24 h at 70º C; therefore,
degradation at pH below 7 appears to be more effective. The Mn of degraded rubber in
basic condition is around 12000 (Fainleib et al., 2013). Ibrahim et al. (2014) reported
degradation of NR using H2O2 and NaNO2 at temperature of 70ºC in latex phase. The
reaction was carried out in an acidic medium. It was observed that a change in ratio of
H2O2 to NaNO2 affects the reaction yield. The best yield was observed at the ratio of 1:1
H2O2 to NaNO2. LNR obtained in this method contains carbonyl and hydroxyl terminal
group and achieve a Mn around 24000 after 8 h of reaction in the best condition.
34
Excessive amount of NaNO2 caused an increase in Mn and polydispersity. By employing
higher concentration of H2O2 than NaNO2 a decrease in intensity of peak at 3400 cm-1
was observed. This peak is assigned to hydroxyl group (Ibrahim & Mustafa, 2014).
2.4.1.5 Other methods
In polymer chemistry metathesis is widely used for polymerization of cyclic
olefins to produce cyclic poly (alkenamer) but degradation of unsaturated polymers
using this method is also reported (Alimuniar et al., 1990; Ivin, 1983). Metathesis can
induce the cleavage and reforming of double bond. This kind of reaction is catalytically
induced and could be done by various type of transition metal complexes such as
Mo, Re, W with aluminum alkyl compound as co-catalyst. Metathesis includes inter-and
intra-molecular reactions which result in degradation and formation of cyclic structure
(Phinyocheep, 2014). Alimuniar et al. (1990) reported metathesis degradation of NR
using tungsten hexachloride and tetra methyl tin as catalyst. The Mn of degrade rubber
decrease from 1.2 x 10⁶
to 1.4 x10⁴ gmol
-1. It was observed that a raise in temperature
of reaction generate LNR with lower Mn. The drawback of this method is the sensitivity
of the catalyst toward impurities therefore, the NR should be purified several times
before reaction (Alimuniar et al., 1990). This procedure is further developed to
synthesize difunctional telechelic unsaturated polymers with low molecular weight
bearing different functional groups such as: boranes, esters, silanes, imide and silyl
ether (Chung & Chasmawala, 1992; Marmo & Wagener, 1997). Ultrasound technique
has the capability to produce free radicals (hydroxide and hydrogen in water solution)
therefore it has been used widely as reaction initiator or for improving the reaction rates
of chemical reactions. Ultrasound has been used for degradation of polymers. The
35
mechanism of ultrasonic degradation is not known exactly. One proposed mechanism
suggest that ultrasound radiation produces cavitation bubbles. Formation and break
down of these bubbles near the middle of the polymer chain could be the reason of
degradation of dissolved polymer. The physical and mechanical properties of cavitation
bubbles are related to viscosity, frequencies of the ultrasound waves, diffusion and
thermal conductivity coefficiencies (Mauler et al., 1997). Utara et al. (2013) observed a
reduction in molecular weight of NR in latex phase by ultrasonic radiation. They found
that an increase in frequency of ultrasonic wave from 20 kHz to 25 kHz causes a
decrease in Mn of treated rubber. They have also reported that by increasing of latex
concentration from 5 to 32 % DRC the Mn of product decreases. As reported by Utara et
al. (2013) the structure of degraded NR after sonication remains unaltered. In the best
condition Mn of degraded rubber decreases from 2.14x10⁶ to 2.38x10
5 after 10 min
sonication at 25kHz (Utara & Moonart, 2013).
2.5 Graft polymerization
Besides blending, chemical modification of NR by grafting has been used as a
valuable method for improving of properties of NR. Several monomers have been
reported for grafting modification of NR including styrene (Kawahara et al., 2006),
methyl methacrylate (MMA) (Thiraphattaraphun et al., 2001), dimethylaminoethyl
methacrylate (Kangwansupamonkon et al., 2005), maleic anhydride (Nakason et al.,
2004a), acrylonitrile (Claramma et al., 1989) and divinylbenzene (Zhou et al., 2001). It
has been confirmed by many of the researchers that the most suitable monomers for
grafting on NR are styrene and methyl methacrylate (Kochthongrasamee et al., 2006).
Grafted natural rubber has better tensile property wettability and biocompatibility
(Dafader et al., 2006). The grafting reaction can be carried out in latex, solvent and
36
solid phase (Hashim et al., 2002). According to polymer morphology there are two
kinds of core-shell copolymers: soft core-hard shell and hard core- soft shell
(Charmondusit et al., 1998). Grafting of methyl methacrylate to NR results in a soft
core-hard shell copolymer which has application as impact modifier. Different initiating
systems have been used to graft monomers onto NR including potassium permanganate-
ascorbic acid redox system (Nayak & Basak, 1986), tert-butyl hydroperoxide-
tetraethylene pentaamine (Arayapranee et al., 2002), benzoyl peroxide, acetylacetonate
complex and manganese (Lenka et al., 1985), and potassium persulfate-sodium
thiosulfate redox initiators (Kochthongrasamee et al., 2006). Grafting of monomers such
as methyl methacrylate into NR often coincides with homopolymerization. The
technique of separation of graft copolymer and homopolymer is based on the solubility
of the mixture in different solvents. Unreacted rubber could be separated from the
mixture with petroleum ether. Generated homopolymer could be extracted using
Soxhlet extractor by acetone or alcohol. After each extraction, the grafting efficiency
could be determined by residual weight method (Thiraphattaraphun et al., 2001). Graft
copolymerization of methyl methacrylate to NR back bone using potassium bromate as
initiator was investigated by Lenka et al. To remove the homopolymer, extraction was
carried out with benzene. Increasing the concentration of potassium bromate up to a
specific amount (5x10⁻³
mol/L) had a positive effect on graft polymerization but further
increase reduced the yield of the polymer. It was concluded that higher concentration of
potassium bromate facilitates homopolymerization over graft copolymerization. An
increase in monomer concentration up to a specific amount (0.1 mol) increases the
extent of polymer and there after it decreases. This is due to homopolymerization has
occurred by increasing of monomer concentration. Solvent has an important effect on
MMA grafting. The best yield was observed by aprotic polar solvent such as DMSO
37
(Lenka et al., 1985). The order of solvents if grafting efficiency is concerned was found
to be:
DMSO>DMF>Dioxane>Benzene>Chloroform
The effect of solvents on grafting yield was justified by different capability of
solvents to swell the rubber as well as the ability of solvents to form solvent radical
from the primary radicals generated by initiators. The yield of copolymerization
changed by using different monomer and the best results in order to reactivity of
monomers and grafting yield follows the following sequence:
methyl methacrylate > ethyl acrylate > butyl acrylate > methyl acrylate >ethyl
methyl acrylate > acrylonitrile.
Grafting of methyl methacrylate monomer onto NR using potassium persulfate
as initiator was reported by Thiraphattarapun et al. (2001). They reported that the
grafting increased with increase in initiator concentration to a determined amount;
furthermore, increase of initiator will produce abundance free radicals which recombine
together and does not affect the conversion speed. They found that homopolymerization
overcome graft polymerization at initiator (KPS) concentration more than 0.75 phr. By
increasing monomer concentration up to 100 phr the grafting yield increased; and
further increase in monomer concentration homopolymerization prevailed as had been
reported before by Lenka et al. (1985) whereby KPS decomposed at higher temperature
so the conversion increased by rising of temperature, but at temperature greater than
55ºC the grafting efficiency decreased due to homopolymerization. After 8 h of reaction
the maximum level of grafting efficiency was achieved. By prolonged reaction time due
to decreases of active grafting site, a deduction in grafting reaction could be observed.
Grafting of NR with MMA in latex stage is a core shell type copolymerization in which
38
NR acts as core and MMA as shell. The grafting reaction of NR occurs largely at the
surface of NR because dissolved KPS in water could not diffuse inside the rubber
chains. NR seeds show a spherical morphology which was surrounded by a thin layer of
PMMA as a graft copolymer (Suksawad et al., 2011). Preparation of thermoplastic
elastomer from NR by graft copolymerization of styrene monomer in latex stage was
reported by Suksawad et al. (2011). Tert-butyl hydroperoxide and
tetraethylenpentamine were used as initiator system. They found that the appropriate
concentration of initiator to achieve best grafting efficiency depends on monomer
concentration and there is no linear relation between monomer and initiator
concentration. For example, the best grafting efficiency at a monomer concentration of
1.5 (mol/kg rubber) was observed by initiator concentration of about 3.3 x10⁻²
(mol/kg
rubber). By increasing of monomer concentration to 5.5 (mol/kg rubber) the best
efficiency was observed by employing 20x10-2
(mol/kg rubber) of initiator. It was
demonstrated that grafting efficiency plays a vital role in mechanical properties of
obtained graft copolymer. For example, only graft copolymers with grafting efficiency
higher than 60 mol% could have a tensile strength greater than 20 MPa (Suksawad et
al., 2011).
2.6 Coating
General information 2.6.1
There are two main reasons for applying coating which is for corrosion
prevention and decorative purposes. Most metals are produced by reducing ores. If
metals are exposed to the atmosphere they have the tendency return to their original
chemical structure. This process is called corrosion. Applying coating prevents
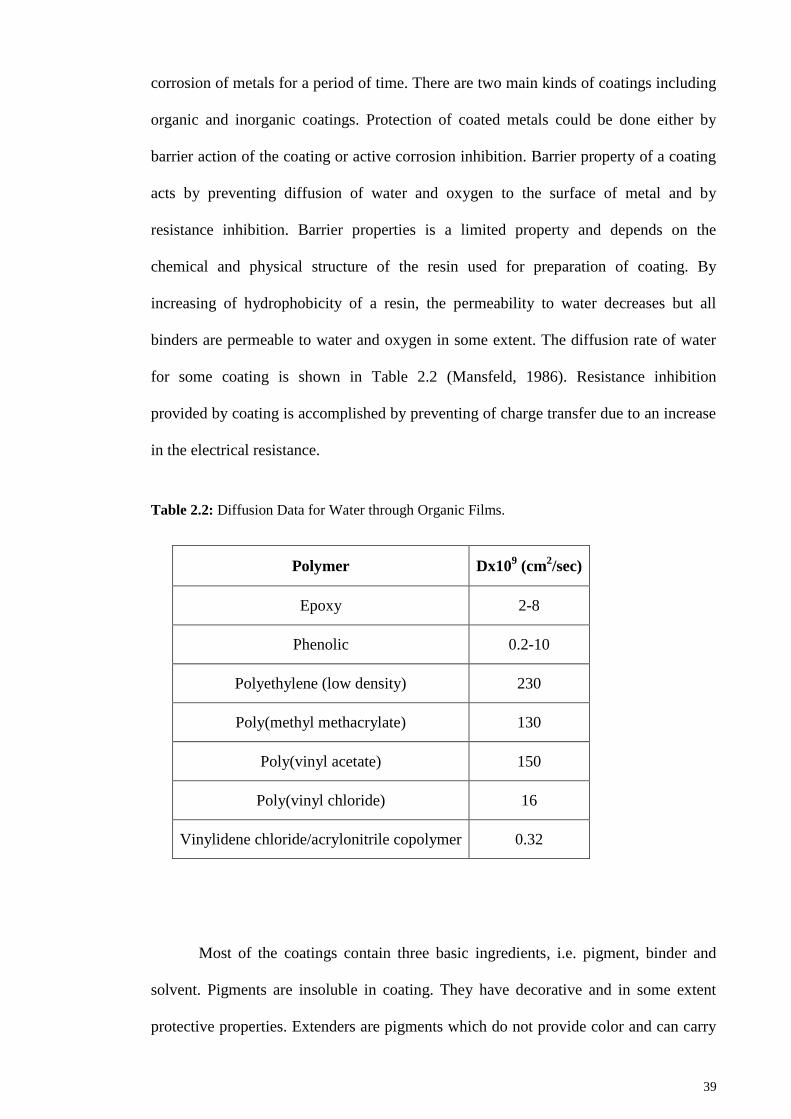
39
corrosion of metals for a period of time. There are two main kinds of coatings including
organic and inorganic coatings. Protection of coated metals could be done either by
barrier action of the coating or active corrosion inhibition. Barrier property of a coating
acts by preventing diffusion of water and oxygen to the surface of metal and by
resistance inhibition. Barrier properties is a limited property and depends on the
chemical and physical structure of the resin used for preparation of coating. By
increasing of hydrophobicity of a resin, the permeability to water decreases but all
binders are permeable to water and oxygen in some extent. The diffusion rate of water
for some coating is shown in Table 2.2 (Mansfeld, 1986). Resistance inhibition
provided by coating is accomplished by preventing of charge transfer due to an increase
in the electrical resistance.
Table 2.2: Diffusion Data for Water through Organic Films.
Polymer Dx109 (cm
2/sec)
Epoxy 2-8
Phenolic 0.2-10
Polyethylene (low density) 230
Poly(methyl methacrylate) 130
Poly(vinyl acetate) 150
Poly(vinyl chloride) 16
Vinylidene chloride/acrylonitrile copolymer 0.32
Most of the coatings contain three basic ingredients, i.e. pigment, binder and
solvent. Pigments are insoluble in coating. They have decorative and in some extent
protective properties. Extenders are pigments which do not provide color and can carry
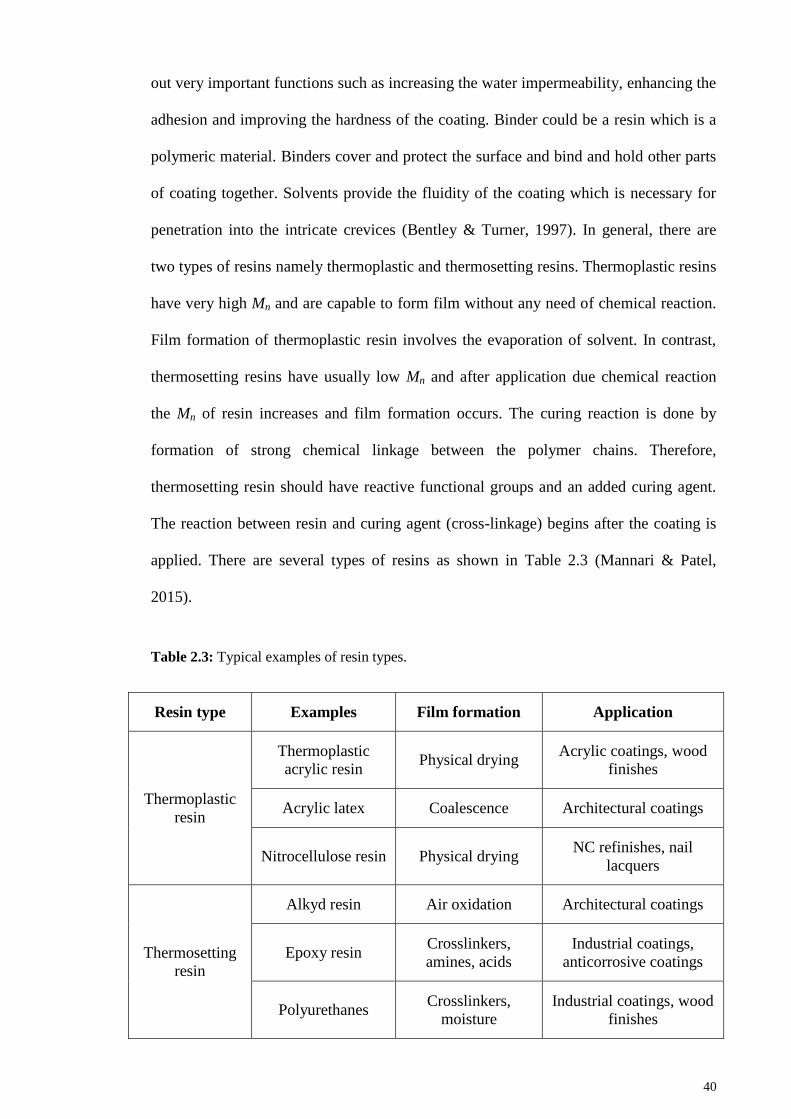
40
out very important functions such as increasing the water impermeability, enhancing the
adhesion and improving the hardness of the coating. Binder could be a resin which is a
polymeric material. Binders cover and protect the surface and bind and hold other parts
of coating together. Solvents provide the fluidity of the coating which is necessary for
penetration into the intricate crevices (Bentley & Turner, 1997). In general, there are
two types of resins namely thermoplastic and thermosetting resins. Thermoplastic resins
have very high Mn and are capable to form film without any need of chemical reaction.
Film formation of thermoplastic resin involves the evaporation of solvent. In contrast,
thermosetting resins have usually low Mn and after application due chemical reaction
the Mn of resin increases and film formation occurs. The curing reaction is done by
formation of strong chemical linkage between the polymer chains. Therefore,
thermosetting resin should have reactive functional groups and an added curing agent.
The reaction between resin and curing agent (cross-linkage) begins after the coating is
applied. There are several types of resins as shown in Table 2.3 (Mannari & Patel,
2015).
Table 2.3: Typical examples of resin types.
Resin type Examples Film formation Application
Thermoplastic
resin
Thermoplastic
acrylic resin Physical drying
Acrylic coatings, wood
finishes
Acrylic latex Coalescence Architectural coatings
Nitrocellulose resin Physical drying NC refinishes, nail
lacquers
Thermosetting
resin
Alkyd resin Air oxidation Architectural coatings
Epoxy resin Crosslinkers,
amines, acids
Industrial coatings,
anticorrosive coatings
Polyurethanes Crosslinkers,
moisture
Industrial coatings, wood
finishes
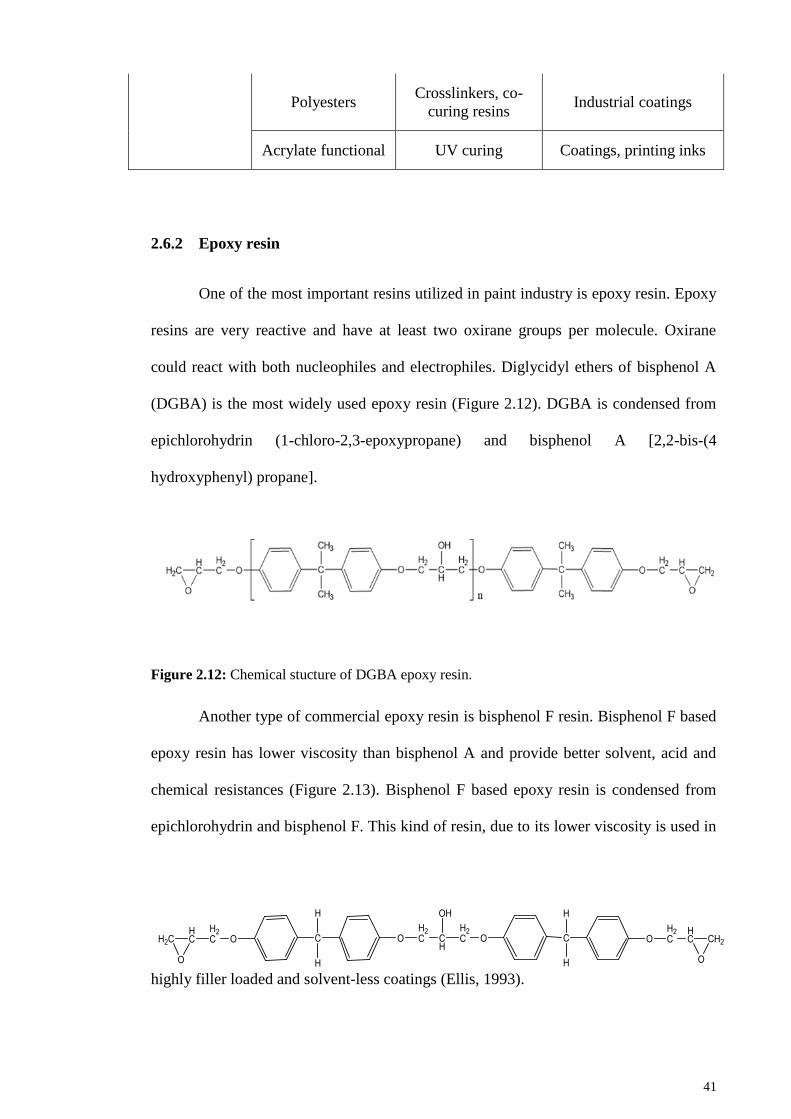
41
Polyesters Crosslinkers, co-
curing resins Industrial coatings
Acrylate functional UV curing Coatings, printing inks
Epoxy resin 2.6.2
One of the most important resins utilized in paint industry is epoxy resin. Epoxy
resins are very reactive and have at least two oxirane groups per molecule. Oxirane
could react with both nucleophiles and electrophiles. Diglycidyl ethers of bisphenol A
(DGBA) is the most widely used epoxy resin (Figure 2.12). DGBA is condensed from
epichlorohydrin (1-chloro-2,3-epoxypropane) and bisphenol A [2,2-bis-(4
hydroxyphenyl) propane].
Figure 2.12: Chemical stucture of DGBA epoxy resin.
Another type of commercial epoxy resin is bisphenol F resin. Bisphenol F based
epoxy resin has lower viscosity than bisphenol A and provide better solvent, acid and
chemical resistances (Figure 2.13). Bisphenol F based epoxy resin is condensed from
epichlorohydrin and bisphenol F. This kind of resin, due to its lower viscosity is used in
highly filler loaded and solvent-less coatings (Ellis, 1993).
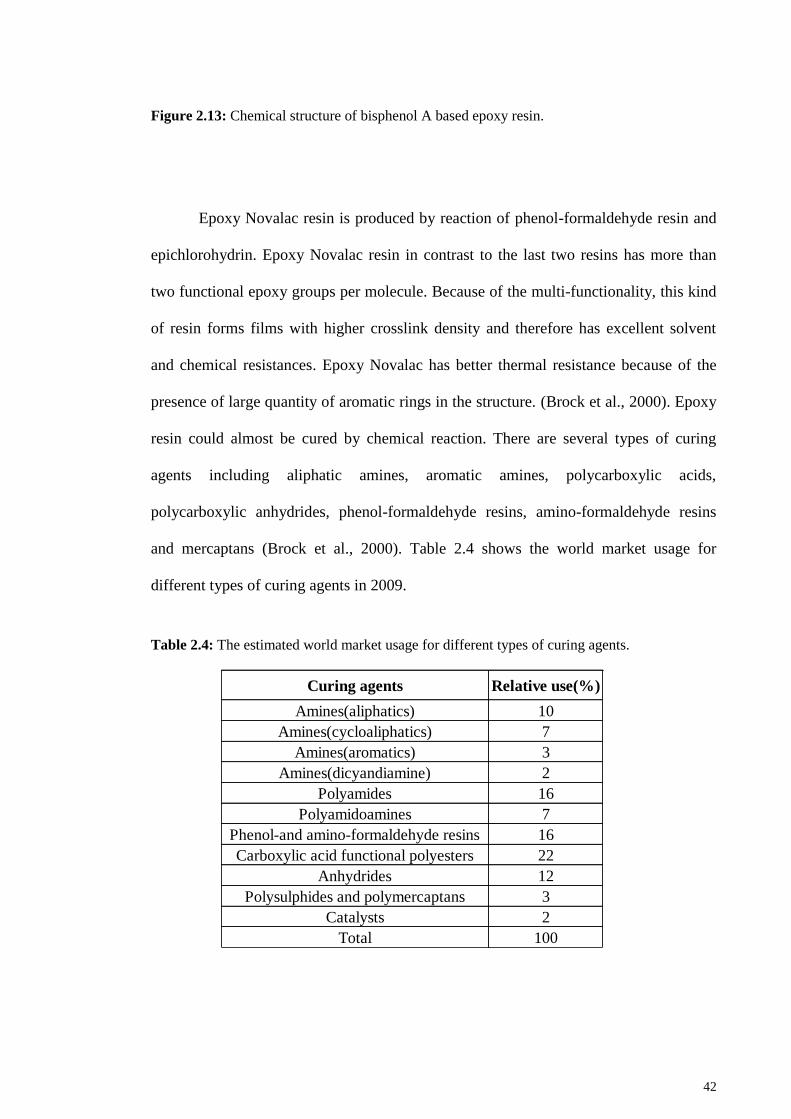
42
Figure 2.13: Chemical structure of bisphenol A based epoxy resin.
Epoxy Novalac resin is produced by reaction of phenol-formaldehyde resin and
epichlorohydrin. Epoxy Novalac resin in contrast to the last two resins has more than
two functional epoxy groups per molecule. Because of the multi-functionality, this kind
of resin forms films with higher crosslink density and therefore has excellent solvent
and chemical resistances. Epoxy Novalac has better thermal resistance because of the
presence of large quantity of aromatic rings in the structure. (Brock et al., 2000). Epoxy
resin could almost be cured by chemical reaction. There are several types of curing
agents including aliphatic amines, aromatic amines, polycarboxylic acids,
polycarboxylic anhydrides, phenol-formaldehyde resins, amino-formaldehyde resins
and mercaptans (Brock et al., 2000). Table 2.4 shows the world market usage for
different types of curing agents in 2009.
Table 2.4: The estimated world market usage for different types of curing agents.
Curing agents Relative use(%)
Amines(aliphatics) 10
Amines(cycloaliphatics) 7
Amines(aromatics) 3
Amines(dicyandiamine) 2
Polyamides 16
Polyamidoamines 7
Phenol-and amino-formaldehyde resins 16
Carboxylic acid functional polyesters 22
Anhydrides 12
Polysulphides and polymercaptans 3
Catalysts 2
Total 100
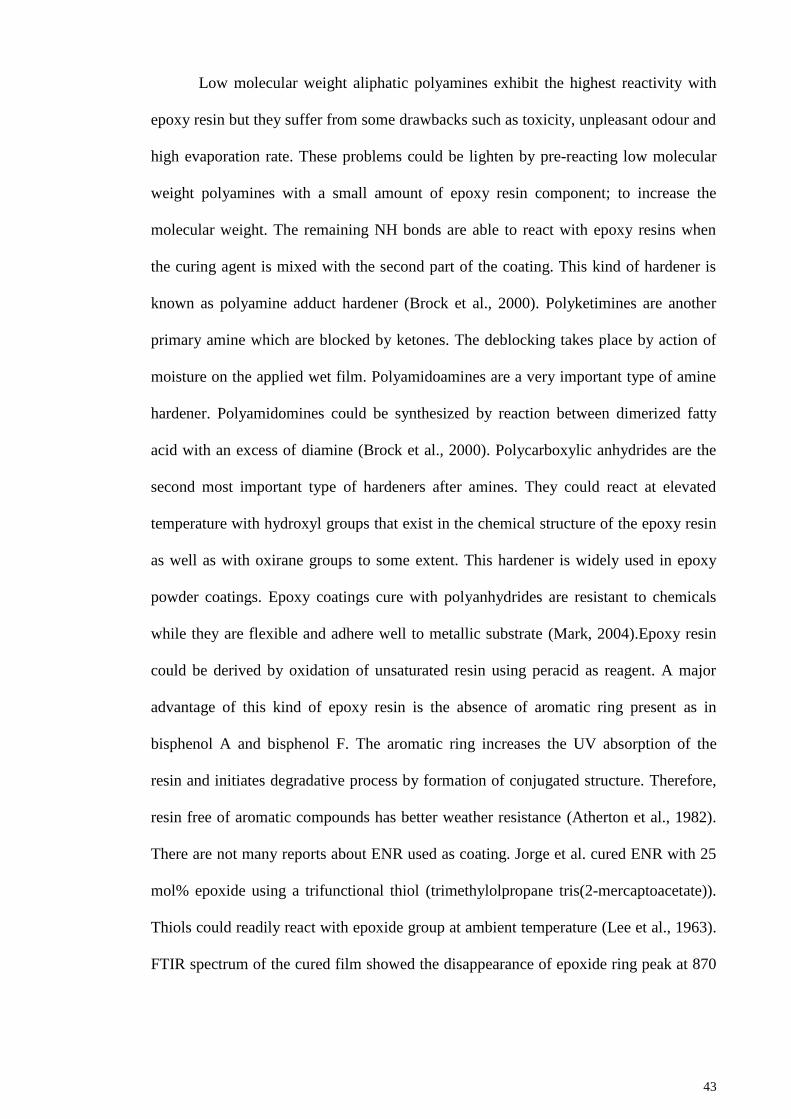
43
Low molecular weight aliphatic polyamines exhibit the highest reactivity with
epoxy resin but they suffer from some drawbacks such as toxicity, unpleasant odour and
high evaporation rate. These problems could be lighten by pre-reacting low molecular
weight polyamines with a small amount of epoxy resin component; to increase the
molecular weight. The remaining NH bonds are able to react with epoxy resins when
the curing agent is mixed with the second part of the coating. This kind of hardener is
known as polyamine adduct hardener (Brock et al., 2000). Polyketimines are another
primary amine which are blocked by ketones. The deblocking takes place by action of
moisture on the applied wet film. Polyamidoamines are a very important type of amine
hardener. Polyamidomines could be synthesized by reaction between dimerized fatty
acid with an excess of diamine (Brock et al., 2000). Polycarboxylic anhydrides are the
second most important type of hardeners after amines. They could react at elevated
temperature with hydroxyl groups that exist in the chemical structure of the epoxy resin
as well as with oxirane groups to some extent. This hardener is widely used in epoxy
powder coatings. Epoxy coatings cure with polyanhydrides are resistant to chemicals
while they are flexible and adhere well to metallic substrate (Mark, 2004).Epoxy resin
could be derived by oxidation of unsaturated resin using peracid as reagent. A major
advantage of this kind of epoxy resin is the absence of aromatic ring present as in
bisphenol A and bisphenol F. The aromatic ring increases the UV absorption of the
resin and initiates degradative process by formation of conjugated structure. Therefore,
resin free of aromatic compounds has better weather resistance (Atherton et al., 1982).
There are not many reports about ENR used as coating. Jorge et al. cured ENR with 25
mol% epoxide using a trifunctional thiol (trimethylolpropane tris(2-mercaptoacetate)).
Thiols could readily react with epoxide group at ambient temperature (Lee et al., 1963).
FTIR spectrum of the cured film showed the disappearance of epoxide ring peak at 870
44
cm-1
. It was observed that the cured film has better tensile strength as well as thermal
and swelling properties (Jorge et al., 2010).
45
3 CHAPTER 3: MATERIALS & METHODS
3.1 Materials
Potassium peroxodisulfate (K2S2O8) and disodium hydrogen phosphate was
obtained as extra pure chemicals from Hamburg Chemical GmbH. Tetrahydrofuran
(THF), acetic acid (glacial 100%), 2-butanone (MEK), potassium hydrogen phthalate,
chlorobenzene, petroleum ether and toluene were reagent grade chemicals from Merck.
Periodic acid was purchased from Fischer Scientific. Potassium permanganate
(KMnO4), benzophenone, acetone and ethanol were reagent grade chemicals from R&M
Chemicals. Hexamethyldiamine 98% was obtained from Sigma Aldrich. ENR 25 (ENR)
and Natural rubber (NR) used was SMR 20 (SMR, Standard Malaysian Rubber), a kind
gift from Rubber Research Institute of Malaysia (RRIM). ENR25 is an epoxidized
natural rubber with 25 mol % epoxidation.
Preparation of ENR 25 solution 3.1.1
ENR 25 was mechanically masticated using a laboratory two- roll mill at a roll
speed of 5.2 (cm sec-1
). The roll diameter was 4 cm and the nip gap was adjusted to 0.2
mm with the nip setting of 4 mm for 3 times. The masticated rubber was used for
preparing of following solution:
46
3.1.1.1 ENR 25 solution (13.4 % w/w) in MEK
The masticated ENR 25 was then weighed and introduced in a reaction vessel.
MEK was added to make up the concentration equal to 13.4 % w/w. The solution was
stirred with a mechanical stirrer at a speed of 1000 rpm until ENR 25 is dissolved.
3.1.1.2 ENR 25 solution (5.6% w/w) in THF
The masticated ENR 25 was then weighed and introduced in a reaction vessel.
THF was added to make up the concentration equal to 5.6 % w/w. The solution was
stirred with a mechanical stirrer at a speed of 1000 rpm until ENR 25 is dissolved.
3.2 Different degradation methods to produce LENR
Mechanical breakdown of ENR25 3.2.1
ENR25 (5 g) was milled used a laboratory two- roll mill at a roll speed of
5.2(cm sec-1
). The roll diameter was 4 cm and the nip gap was adjusted to 0.2 mm. One
sample of ENR25 was milled for 3 h and a second sample was milled for 8 h. After
milling, the sticky LENR was dissolved with toluene from the rollers and collected into
a beaker, and toluene was removed by vacuum distillation at 40 ºC.
Oxidative degradation initiated by potassium peroxodisulfate. 3.2.2
74.6 g of dissolved ENR 25 in MEK (13.4% w/w) was charged into a reaction
vessel. Potassium peroxodisulfate (6.4 g) and disodium hydrogen phosphate (8.9 g)
47
were dissolved in 27 ml water and then it was added drop-wise to the ENR solution.
The reaction was carried out at 60 º C. A flow of air was pumped to the solution during
mixing with an overhead stirrer. After the specific reaction time, the solution was
cooled down and the degraded ENR was coagulated by adding methanol and washed
several times with water. The obtained liquid rubber was dried in a vacuum oven at
room temperature.
Photo-oxidation with UV radiation. 3.2.3
Two methods were used for degradation by UV radiation. There were two
differences between these methods. The first one was the intensity of UV irradiation
which was increased by approaching the UV lamp to the ENR solution and the second
one was the concentration of ENR solution utilized. The two methods are described as
follows:
3.2.3.1 Method A:
A UV lamp, Dymax 5000 EC, supplies radiation at 365 nm (λ) and intensity of
225 mW/cm2. ENR25 (15 g) was dissolved in toluene (135 g) and introduced in a
beaker which was stirred with a magnetic stirrer during irradiation. The UV lamp was
located 30 cm above the beaker and a fan cooled the set up during irradiation. The lamp
was switched on for 30 min and off for 30 min. During the UV irradiation, the
temperature of rubber solution did not go over 50ºC. After different radiation time the
solvent was evaporated off under reduced pressure at 40ºC and the products were
analysed with FTIR, NMR and GPC.
48
3.2.3.2 Method B:
A solution of 15 g ENR 25 dissolved in 165 g toluene was prepared. The ENR
25 solution was charged into a beaker and was stirred with magnetic stirrer. A UV lamp,
DYMEX 5000 EC supplies radiation with wave length 365 nm and intensity of 225
mW/cm2. The lamp was switched on for 30 min and off for 30 min. The UV lamp was
located around 15 cm above the solution. The setup was carefully covered with
aluminium foil and cooled with a fan during reaction. At the specified time of
irradiation, the solvent was removed under reduced pressure at room temperature. The
experiment was repeated with 1, 3, 5, 7, 10, 14 and 18 h of irradiation time. To
investigate the effect of epoxide group on the degradation, NR is also degraded under
the same conditions as ENR by this method.
Oxidative degradation with potassium permanganate 3.2.4
Degradation was carried out in a reaction vessel equipped with a mechanical
stirrer. Initially the vessel was charged with 169 g of ENR25 solution in THF (5.9%
w/w). KMnO4 (10 g) was dissolved in a mixture of 160 g water and 11.4 g acetic acid.
The dissolved ENR was mixed with various amounts of mentioned KMnO4 solution:
e.g. 0.026, 0.044, 0.075 and 0.145 mol of KMnO4 per hundred grams of rubber (mphr)
as is shown in Table 3.1. Samples of the reaction solution were withdrawn after 1, 3, 5,
10 and 18 h respectively. After filtering samples were coagulated by adding methanol
and washed several times with water. The obtained liquid rubber was dried in a vacuum
oven at room temperature. The same procedure was used for degradation of NR.
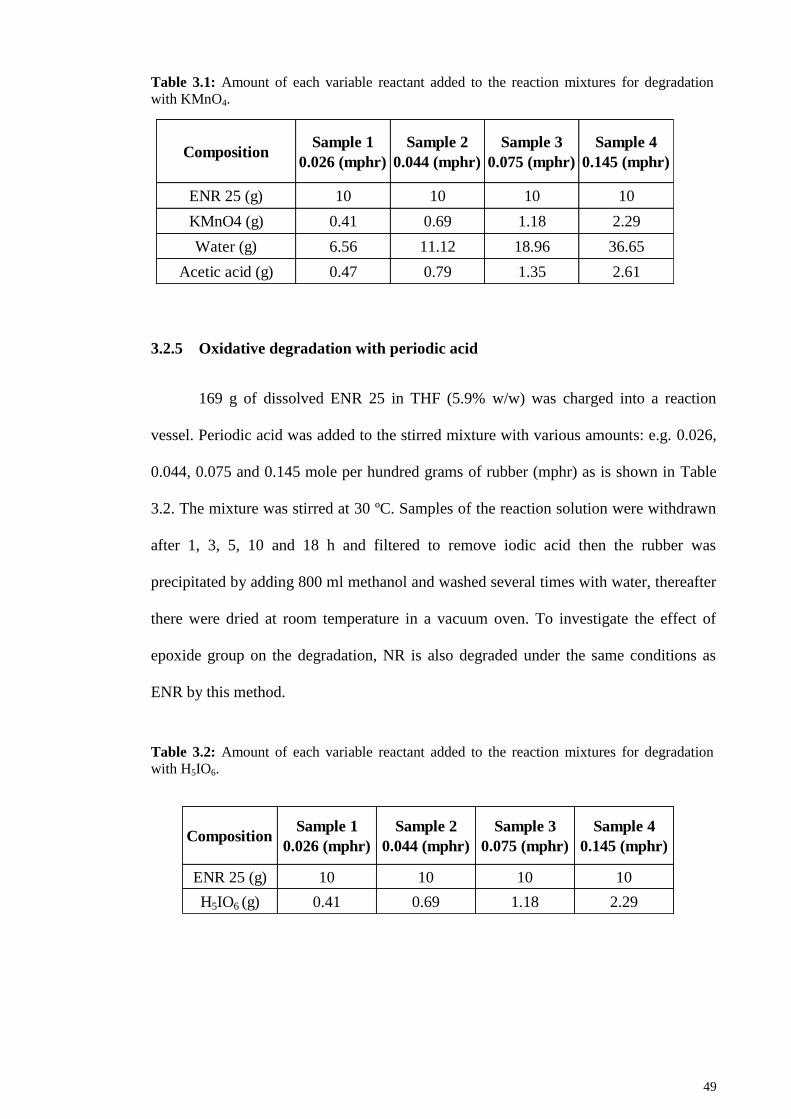
49
Table 3.1: Amount of each variable reactant added to the reaction mixtures for degradation
with KMnO4.
Oxidative degradation with periodic acid 3.2.5
169 g of dissolved ENR 25 in THF (5.9% w/w) was charged into a reaction
vessel. Periodic acid was added to the stirred mixture with various amounts: e.g. 0.026,
0.044, 0.075 and 0.145 mole per hundred grams of rubber (mphr) as is shown in Table
3.2. The mixture was stirred at 30 ºC. Samples of the reaction solution were withdrawn
after 1, 3, 5, 10 and 18 h and filtered to remove iodic acid then the rubber was
precipitated by adding 800 ml methanol and washed several times with water, thereafter
there were dried at room temperature in a vacuum oven. To investigate the effect of
epoxide group on the degradation, NR is also degraded under the same conditions as
ENR by this method.
Table 3.2: Amount of each variable reactant added to the reaction mixtures for degradation
with H5IO6.
CompositionSample 1
0.026 (mphr)
Sample 2
0.044 (mphr)
Sample 3
0.075 (mphr)
Sample 4
0.145 (mphr)
ENR 25 (g) 10 10 10 10
KMnO4 (g) 0.41 0.69 1.18 2.29
Water (g) 6.56 11.12 18.96 36.65
Acetic acid (g) 0.47 0.79 1.35 2.61
CompositionSample 1
0.026 (mphr)
Sample 2
0.044 (mphr)
Sample 3
0.075 (mphr)
Sample 4
0.145 (mphr)
ENR 25 (g) 10 10 10 10
H5IO6 (g) 0.41 0.69 1.18 2.29
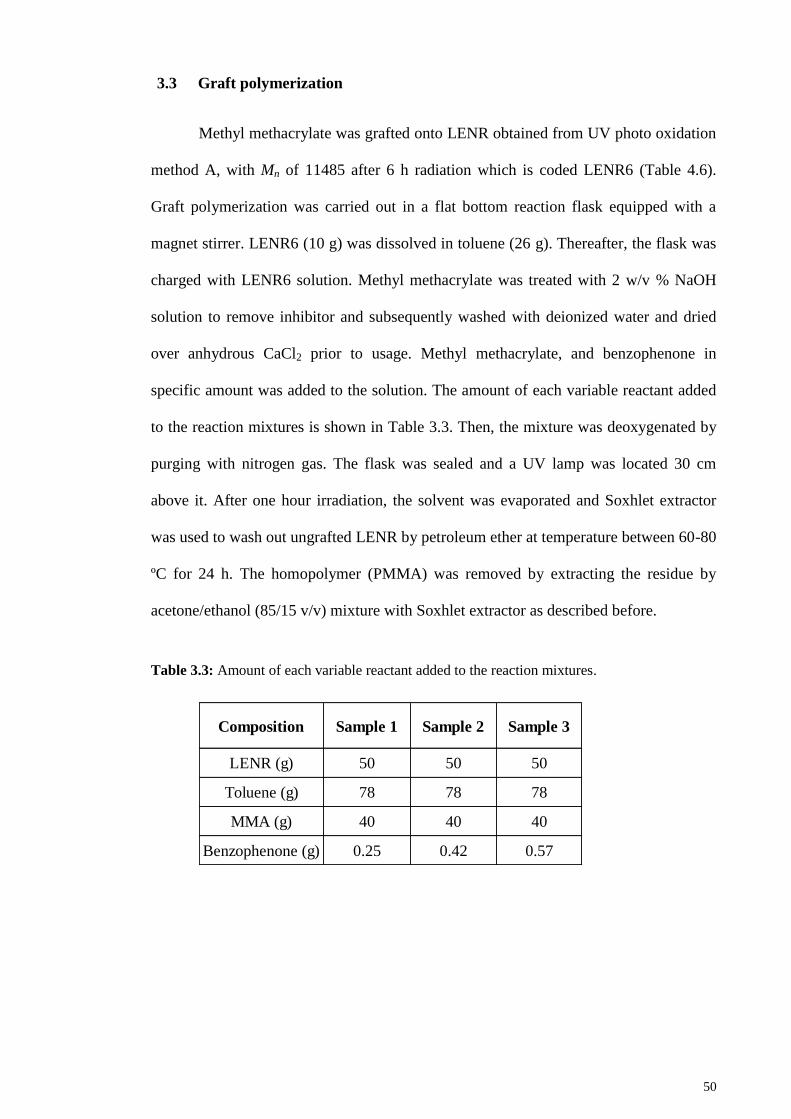
50
3.3 Graft polymerization
Methyl methacrylate was grafted onto LENR obtained from UV photo oxidation
method A, with Mn of 11485 after 6 h radiation which is coded LENR6 (Table 4.6).
Graft polymerization was carried out in a flat bottom reaction flask equipped with a
magnet stirrer. LENR6 (10 g) was dissolved in toluene (26 g). Thereafter, the flask was
charged with LENR6 solution. Methyl methacrylate was treated with 2 w/v % NaOH
solution to remove inhibitor and subsequently washed with deionized water and dried
over anhydrous CaCl2 prior to usage. Methyl methacrylate, and benzophenone in
specific amount was added to the solution. The amount of each variable reactant added
to the reaction mixtures is shown in Table 3.3. Then, the mixture was deoxygenated by
purging with nitrogen gas. The flask was sealed and a UV lamp was located 30 cm
above it. After one hour irradiation, the solvent was evaporated and Soxhlet extractor
was used to wash out ungrafted LENR by petroleum ether at temperature between 60-80
ºC for 24 h. The homopolymer (PMMA) was removed by extracting the residue by
acetone/ethanol (85/15 v/v) mixture with Soxhlet extractor as described before.
Table 3.3: Amount of each variable reactant added to the reaction mixtures.
Composition Sample 1 Sample 2 Sample 3
LENR (g) 50 50 50
Toluene (g) 78 78 78
MMA (g) 40 40 40
Benzophenone (g) 0.25 0.42 0.57
51
3.4 Characterization Methods
1H-NMR spectroscopy 3.4.1
To determine molecular structure of samples, nuclear magnetic resonance
spectroscopy operating at 270 MHz on a JNM-GSX270 Fourier Transform
Spectrometer with deuterated chloroform as a solvent was used. The concentration of
the sample in deuterated chloroform solution was 1-5 w/v%. The ratio of olefinic
methine proton to oxirane methine proton was calculated based on the equation 3.1.
Ratio of olefinic methine proton to oxirane methine proton =(
)
[3.1]
Where, A is integrated area of the signals and subscript numbers represent
chemical shift (ppm).
FTIR spectroscopy 3.4.2
FTIR spectra were recorded on a Perkin Elmer FTIR RX1 spectrometer at room
temperature, with 4 scans from 4000 to 400 cm-1
and resolution of 4 cm-1
. To minimize
the effect of non-uniform film thickness, ENR was dissolved in toluene in a fixed
concentration. A constant quantity of the solution was put onto a NaCl cell, and the
solvent removed by a hot air blower.
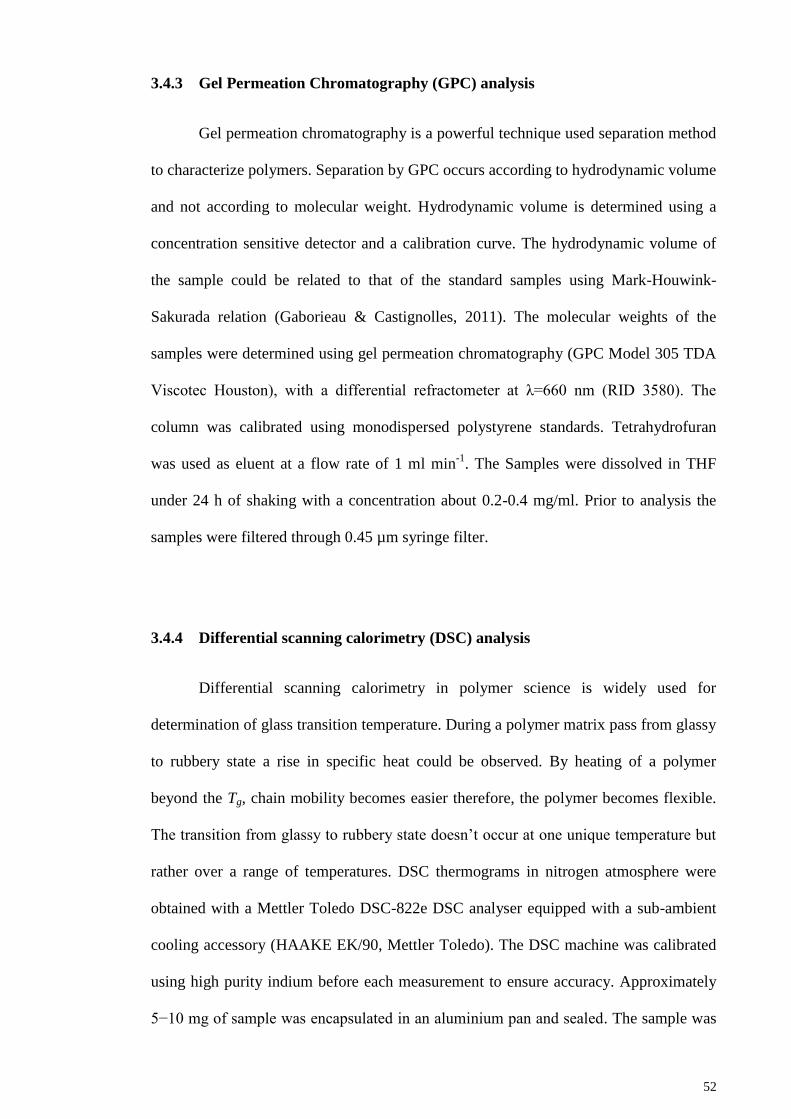
52
Gel Permeation Chromatography (GPC) analysis 3.4.3
Gel permeation chromatography is a powerful technique used separation method
to characterize polymers. Separation by GPC occurs according to hydrodynamic volume
and not according to molecular weight. Hydrodynamic volume is determined using a
concentration sensitive detector and a calibration curve. The hydrodynamic volume of
the sample could be related to that of the standard samples using Mark-Houwink-
Sakurada relation (Gaborieau & Castignolles, 2011). The molecular weights of the
samples were determined using gel permeation chromatography (GPC Model 305 TDA
Viscotec Houston), with a differential refractometer at λ=660 nm (RID 3580). The
column was calibrated using monodispersed polystyrene standards. Tetrahydrofuran
was used as eluent at a flow rate of 1 ml min-1
. The Samples were dissolved in THF
under 24 h of shaking with a concentration about 0.2-0.4 mg/ml. Prior to analysis the
samples were filtered through 0.45 µm syringe filter.
Differential scanning calorimetry (DSC) analysis 3.4.4
Differential scanning calorimetry in polymer science is widely used for
determination of glass transition temperature. During a polymer matrix pass from glassy
to rubbery state a rise in specific heat could be observed. By heating of a polymer
beyond the Tg, chain mobility becomes easier therefore, the polymer becomes flexible.
The transition from glassy to rubbery state doesn’t occur at one unique temperature but
rather over a range of temperatures. DSC thermograms in nitrogen atmosphere were
obtained with a Mettler Toledo DSC-822e DSC analyser equipped with a sub-ambient
cooling accessory (HAAKE EK/90, Mettler Toledo). The DSC machine was calibrated
using high purity indium before each measurement to ensure accuracy. Approximately
5−10 mg of sample was encapsulated in an aluminium pan and sealed. The sample was
53
analysed by heating from -60 °C to 80 °C at a scan rate of 20 °C/min. Tg was defined as
the middle point of the inflection in the DSC curves.
Determination of Epoxy content by direct titration method 3.4.5
Epoxy content of ENR and LENR was determined by titration method. Known
weight of rubber was dissolved in chlorobenzene. The solution was titrated with
standardized hydrobromic acid in glacial acetic acid, using crystal violet indicator. This
method was developed by Durbetaki (1956). Burfield & Gan (1975) realized that this
method was relevant for determination of epoxy content of ENR. The reagents
mentioned above were prepared as follows:
a) Known weight of sample was introduced into an Erlenmeyer flask. The
sample was dissolved in 50 ml of chlorobenzene.
b) For preparation of crystal violet indicator solution 0.1 g of crystal violet was
dissolved into 10 ml glacial acetic acid into an Erlenmeyer flask.
c) A solution (0.1N) of hydrogen bromide was prepared by dissolving of 6.33 g
HBr (32% in acetic acid) in 250 ml of glacial acetic acid.
d) 5 g of potassium hydrogen phthalate (KHP) was dried in the oven at 110 ºC
for 2 h. The KHP solution was prepared by dissolving of 0.4 g KHP in 10 ml of glacial
acetic acid into an Erlenmeyer flask. After dissolving, 5 drops of crystal violet indicator
was added into the flask titrated with 0.1 N HBr solution in a burette to get a blue green
end point. The normality of HBr solution was calculated as follows:
(
) [3.2]
54
Where: W is the weight of KHP, g, used and V is HBr solution used, ml.
e) 5 drops of crystal violet indicator solution was added to sample solution and
then it was titrated with HBr solution to get a blue green colour endpoint.
f) A blank sample was prepared by adding 5 drops of crystal violet indicator in
50 ml of chlorobenzene into an Erlenmeyer flask. The blank sample was titrated in an
identical manner.
g) The epoxy content, E, in gram equivalents of oxirane groups per 100 g of
sample was calculated as follows:
E=(
) [3.3]
Where: N is normality of the HBr solution, V is HBr solution used for
titration of sample, ml, B is HBr solution used for titration of blank sample, ml and W is
the weight of sample used, g.
3.5 Preparation of coating based on grafted LENR
Grafted LENR 3.5.1
The epoxy content of grafted LENR (GLENR2) was measured by the method
explained in section 3.4.5. The Tg of obtained grafted LENR was measured by DSC
method. The typical properties of GLENR2 are shown in Table 3.4.
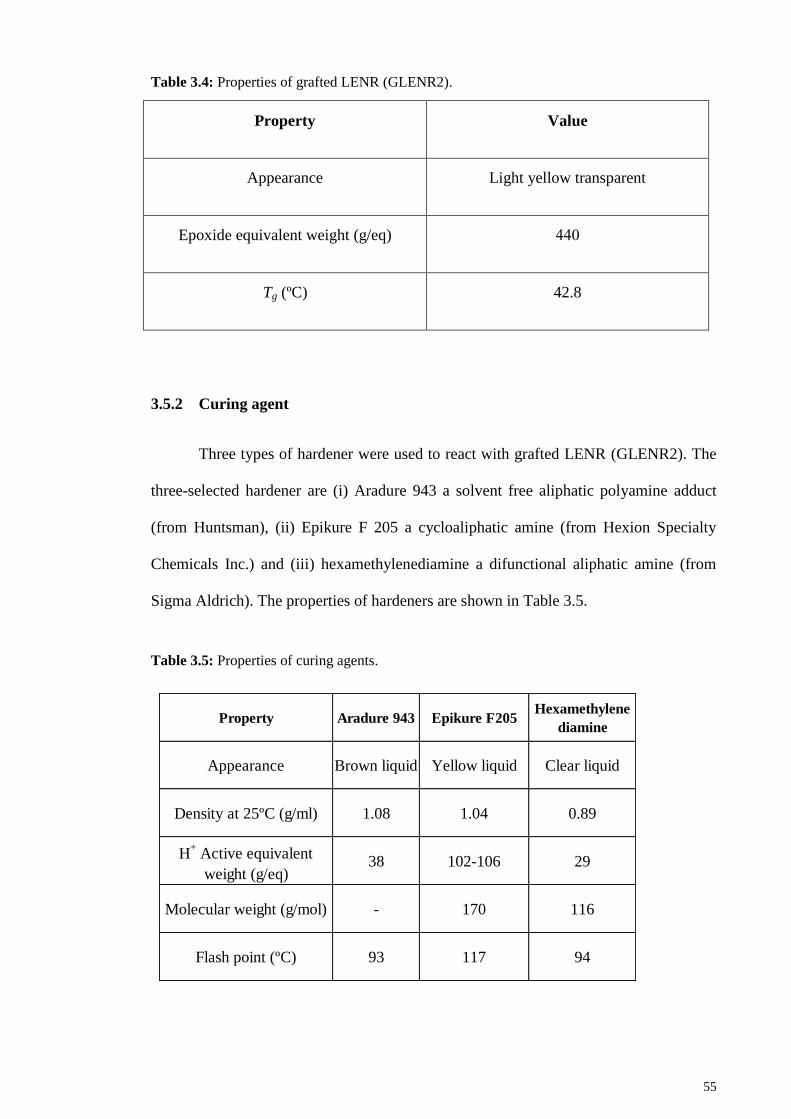
55
Table 3.4: Properties of grafted LENR (GLENR2).
Property Value
Appearance Light yellow transparent
Epoxide equivalent weight (g/eq) 444
Tg (ºC) 42.8
Curing agent 3.5.2
Three types of hardener were used to react with grafted LENR (GLENR2). The
three-selected hardener are (i) Aradure 943 a solvent free aliphatic polyamine adduct
(from Huntsman), (ii) Epikure F 205 a cycloaliphatic amine (from Hexion Specialty
Chemicals Inc.) and (iii) hexamethylenediamine a difunctional aliphatic amine (from
Sigma Aldrich). The properties of hardeners are shown in Table 3.5.
Table 3.5: Properties of curing agents.
Property Aradure 943 Epikure F205Hexamethylene
diamine
Appearance Brown liquid Yellow liquid Clear liquid
Density at 25ºC (g/ml) 1.08 1.04 0.89
H+ Active equivalent
weight (g/eq)38 102-106 29
Molecular weight (g/mol) - 170 116
Flash point (ºC) 93 117 94
56
Treatment of iron panel 3.5.3
The surface of iron panels was abraded with sand paper No.400 and No.600. To
remove the dust from the abrasion the panels were wiped off with a wet cotton cloth for
several times. Thereafter, the surface was wiped again with wet cloth soaked in toluene-
propanol (50/50 v/v) mixture. The prepared panel were stored in drying cabinet prior to
usage.
Preparation of coating mixture 3.5.4
Three different mixtures of grafted LENR(GLENR2) with the mentioned
hardener were prepared with the following stochiometric ratio:
Aradure 943: > 100g GLENR2 3..2 g Aradure 943 curing agent.
EpikureF205: > 100g GLENR2 52..2g Epikure F205 curing agent.
Hexamethylenediamine: > 100g GLENR2 ..26g Hexamethylenediamine
curing agent.
The prepared coating mixtures were diluted with toluene-MEK (70/30 w/w)
mixture and stirred until they become homogenous. Coating mixtures were applied on
iron panels using Sheen Coater (Model S971096) with a wet film thickness of 100 µm.
The coated panels left to dry at room temperature for 6 days before testing.
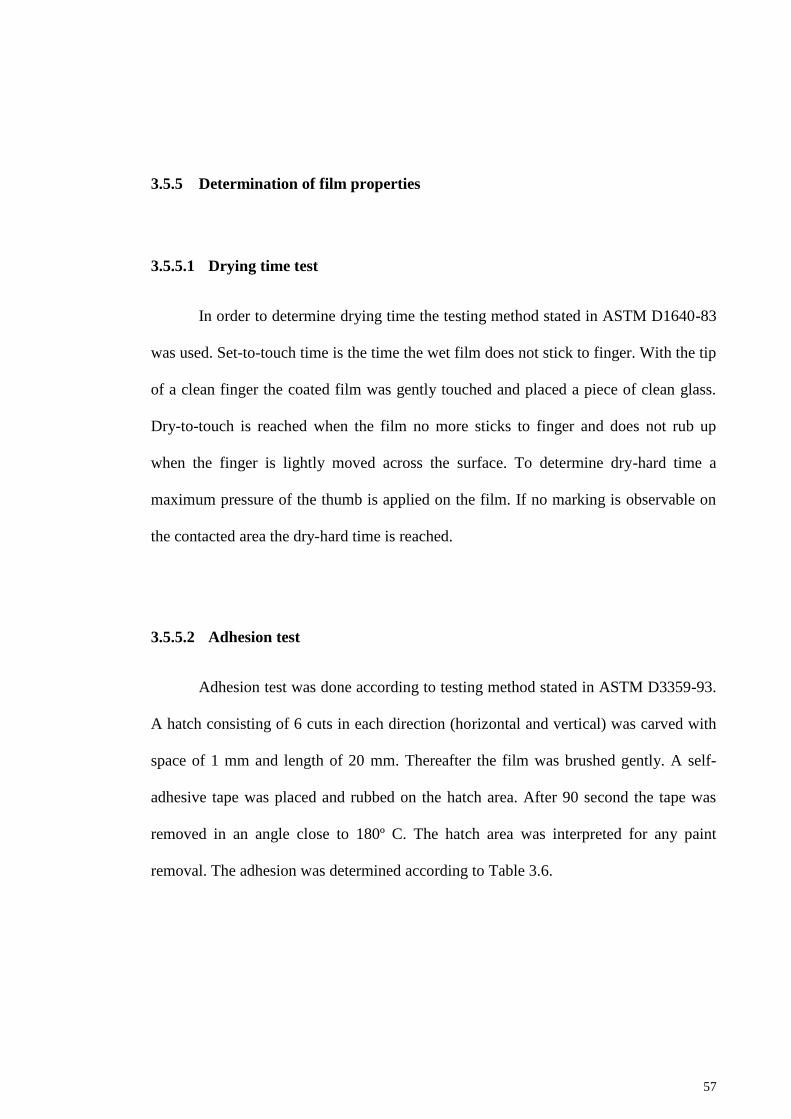
57
Determination of film properties 3.5.5
3.5.5.1 Drying time test
In order to determine drying time the testing method stated in ASTM D1640-83
was used. Set-to-touch time is the time the wet film does not stick to finger. With the tip
of a clean finger the coated film was gently touched and placed a piece of clean glass.
Dry-to-touch is reached when the film no more sticks to finger and does not rub up
when the finger is lightly moved across the surface. To determine dry-hard time a
maximum pressure of the thumb is applied on the film. If no marking is observable on
the contacted area the dry-hard time is reached.
3.5.5.2 Adhesion test
Adhesion test was done according to testing method stated in ASTM D3359-93.
A hatch consisting of 6 cuts in each direction (horizontal and vertical) was carved with
space of 1 mm and length of 20 mm. Thereafter the film was brushed gently. A self-
adhesive tape was placed and rubbed on the hatch area. After 90 second the tape was
removed in an angle close to 180º C. The hatch area was interpreted for any paint
removal. The adhesion was determined according to Table 3.6.
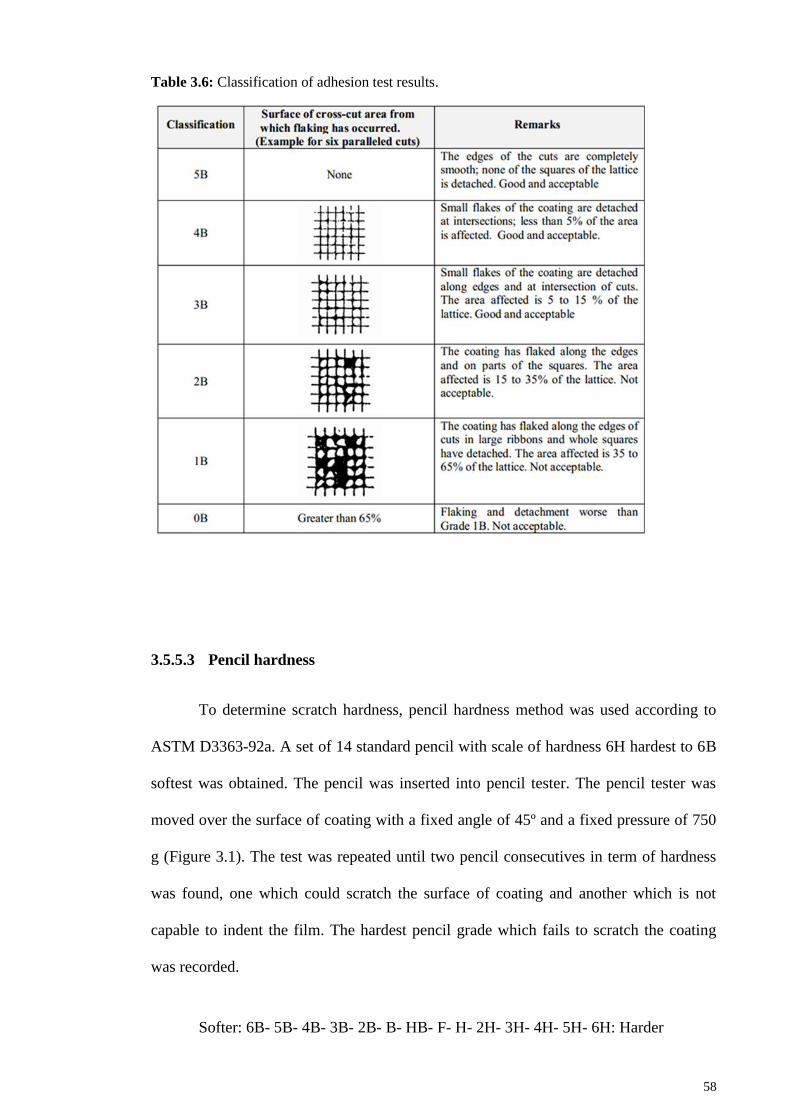
58
Table 3.6: Classification of adhesion test results.
3.5.5.3 Pencil hardness
To determine scratch hardness, pencil hardness method was used according to
ASTM D3363-92a. A set of 14 standard pencil with scale of hardness 6H hardest to 6B
softest was obtained. The pencil was inserted into pencil tester. The pencil tester was
moved over the surface of coating with a fixed angle of 45º and a fixed pressure of 750
g (Figure 3.1). The test was repeated until two pencil consecutives in term of hardness
was found, one which could scratch the surface of coating and another which is not
capable to indent the film. The hardest pencil grade which fails to scratch the coating
was recorded.
Softer: 6B- 5B- 4B- 3B- 2B- B- HB- F- H- 2H- 3H- 4H- 5H- 6H: Harder
59
Figure 3.1: Pencil hardness kit
3.5.5.4 Water resistance and alkali resistance
The resistance of coating against immersion in water was determined according
ASTM D1647-89 and the reported procedure by Taylor et al. (Taylor & Marks, 1972).
The coated panel was placed into a beaker. Distilled water was introduced into the
beaker. After 18 h the panel was removed and the film condition was evaluated. The
defects including whitening, shrinkage, film softened, loss of glass and lift off was
reported. Coated panels were immersed in NaOH (0.5N) aqueous solution for 8 h.
Thereafter, the panels were taken out and inspected for any defect following the same
procedure as that of water resistance.
60
4 CHAPTER 4: RESULTS AND DISCUSSION
4.1 Study of three degradation methods to produce LENR through radical
mechanism
Introduction 4.1.1
In this part three degradation methods are compared including (i) mechanical
milling, (ii) oxidative degradation initiated by potassium peroxodisulfate and (iii) photo-
oxidation initiated by ultra violet (UV) irradiation. The mechanism of these three
methods is assumed to involve radical attack either to the double bond (addition
mechanism) or to hydrogen atom in the allylic position which leads to abstraction of the
hydrogen atom.
Degradation using a roll mill 4.1.2
The mechanical breakdown by mastication occurs because long chain molecules
break by action of stress. The shearing forces acting on rubber during mastication, first
overcoming intermolecular forces in bulk deformation of rubber and then cause rupture
of primary bonds of rubber chain with length greater than a critical value so it becomes
extended and breaks at a band located in the central section between chain segments.
But chain length shorter than critical length could not be broken. If oxygen is present it
reacts quickly with the free radicals and ultimately lead to formation of lower molecular
weights. If mastication undergoes without oxygen under an inert atmosphere, radicals
recombine together and this could lead to production of more branching and
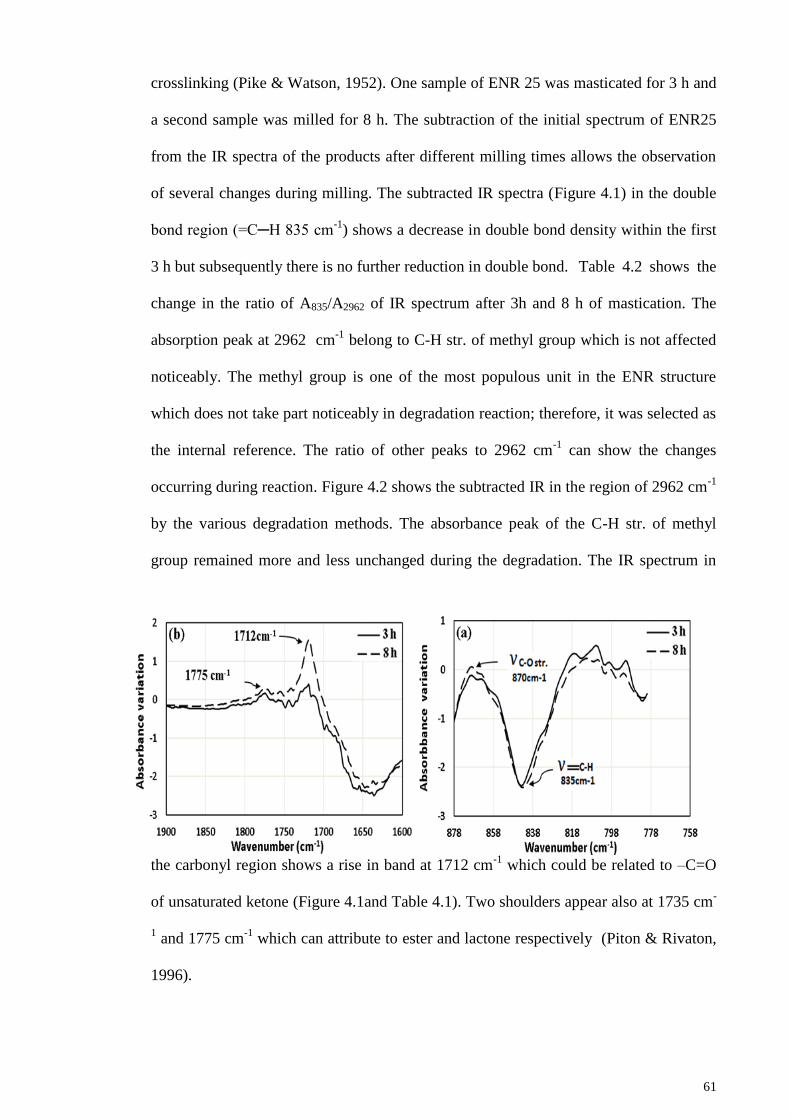
61
crosslinking (Pike & Watson, 1952). One sample of ENR 25 was masticated for 3 h and
a second sample was milled for 8 h. The subtraction of the initial spectrum of ENR25
from the IR spectra of the products after different milling times allows the observation
of several changes during milling. The subtracted IR spectra (Figure 4.1) in the double
bond region (=C─H 835 cm-1
) shows a decrease in double bond density within the first
3 h but subsequently there is no further reduction in double bond. Table 4.2 shows the
change in the ratio of A835/A2962 of IR spectrum after 3h and 8 h of mastication. The
absorption peak at 2962 cm-1
belong to C-H str. of methyl group which is not affected
noticeably. The methyl group is one of the most populous unit in the ENR structure
which does not take part noticeably in degradation reaction; therefore, it was selected as
the internal reference. The ratio of other peaks to 2962 cm-1
can show the changes
occurring during reaction. Figure 4.2 shows the subtracted IR in the region of 2962 cm-1
by the various degradation methods. The absorbance peak of the C-H str. of methyl
group remained more and less unchanged during the degradation. The IR spectrum in
the carbonyl region shows a rise in band at 1712 cm-1
which could be related to –C=O
of unsaturated ketone (Figure 4.1and Table 4.1). Two shoulders appear also at 1735 cm-
1 and 1775 cm
-1 which can attribute to ester and lactone respectively (Piton & Rivaton,
1996).
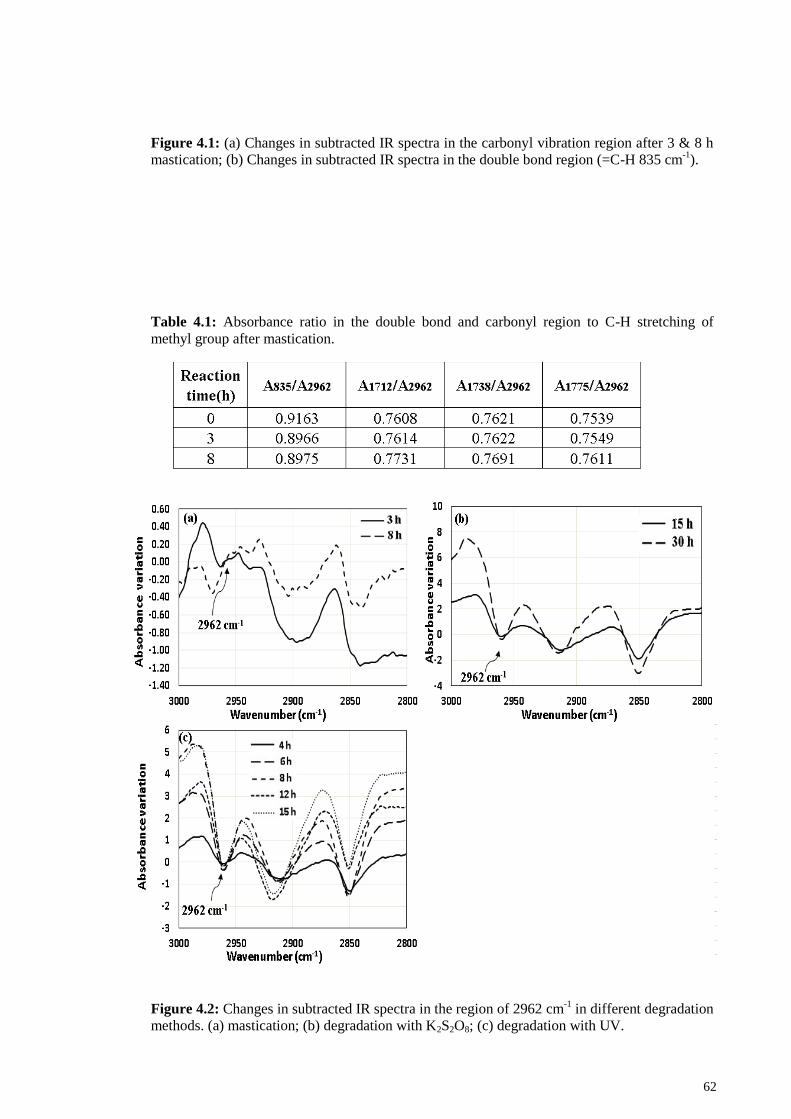
62
Figure 4.1: (a) Changes in subtracted IR spectra in the carbonyl vibration region after 3 & 8 h
mastication; (b) Changes in subtracted IR spectra in the double bond region (=C-H 835 cm-1
).
Table 4.1: Absorbance ratio in the double bond and carbonyl region to C-H stretching of
methyl group after mastication.
Figure 4.2: Changes in subtracted IR spectra in the region of 2962 cm-1
in different degradation
methods. (a) mastication; (b) degradation with K2S2O8; (c) degradation with UV.
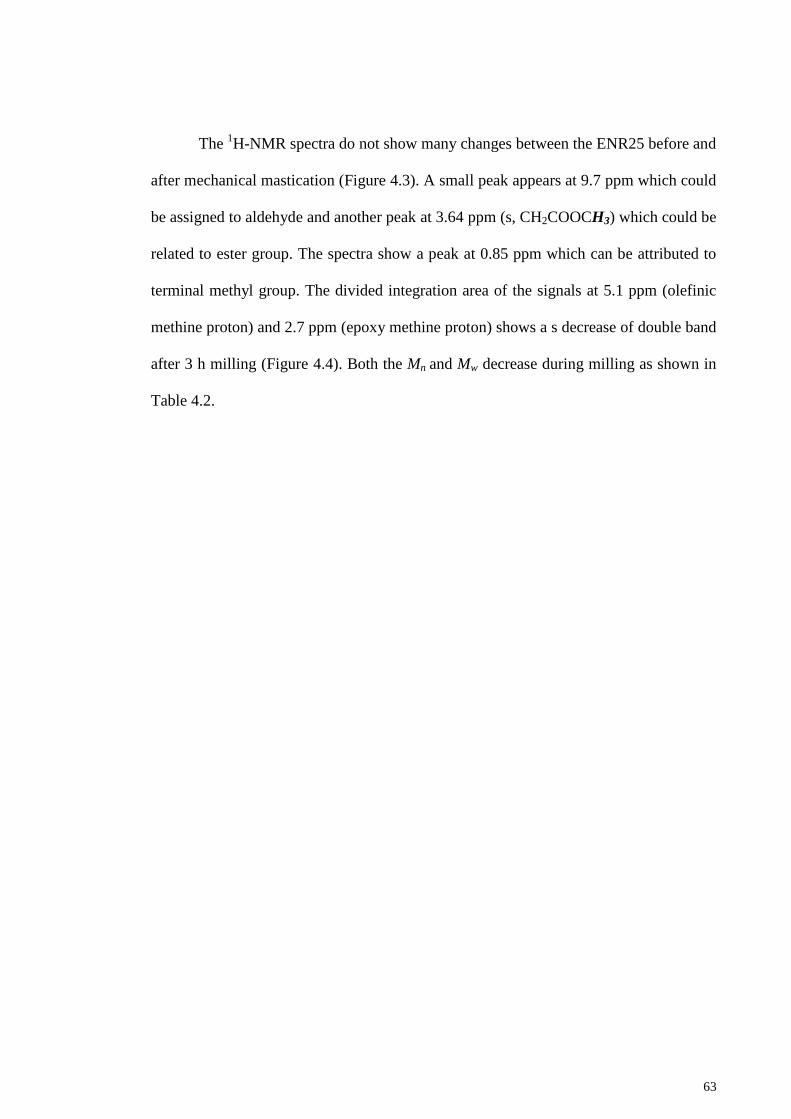
63
The 1H-NMR spectra do not show many changes between the ENR25 before and
after mechanical mastication (Figure 4.3). A small peak appears at 9.7 ppm which could
be assigned to aldehyde and another peak at 3.64 ppm (s, CH2COOCH3) which could be
related to ester group. The spectra show a peak at 0.85 ppm which can be attributed to
terminal methyl group. The divided integration area of the signals at 5.1 ppm (olefinic
methine proton) and 2.7 ppm (epoxy methine proton) shows a s decrease of double band
after 3 h milling (Figure 4.4). Both the Mn and Mw decrease during milling as shown in
Table 4.2.
64
Figure 4.3: 1H- NMR of (a) ENR25; (b) LENR produced after 8 h mastication.
Table 4.2: Results of average molecular weight and polydispersity index after milling.
Milling time (h) M n M w PDI
0 148391 695508 4.68
3 21962 63622 2.9
8 11623 40762 3.5
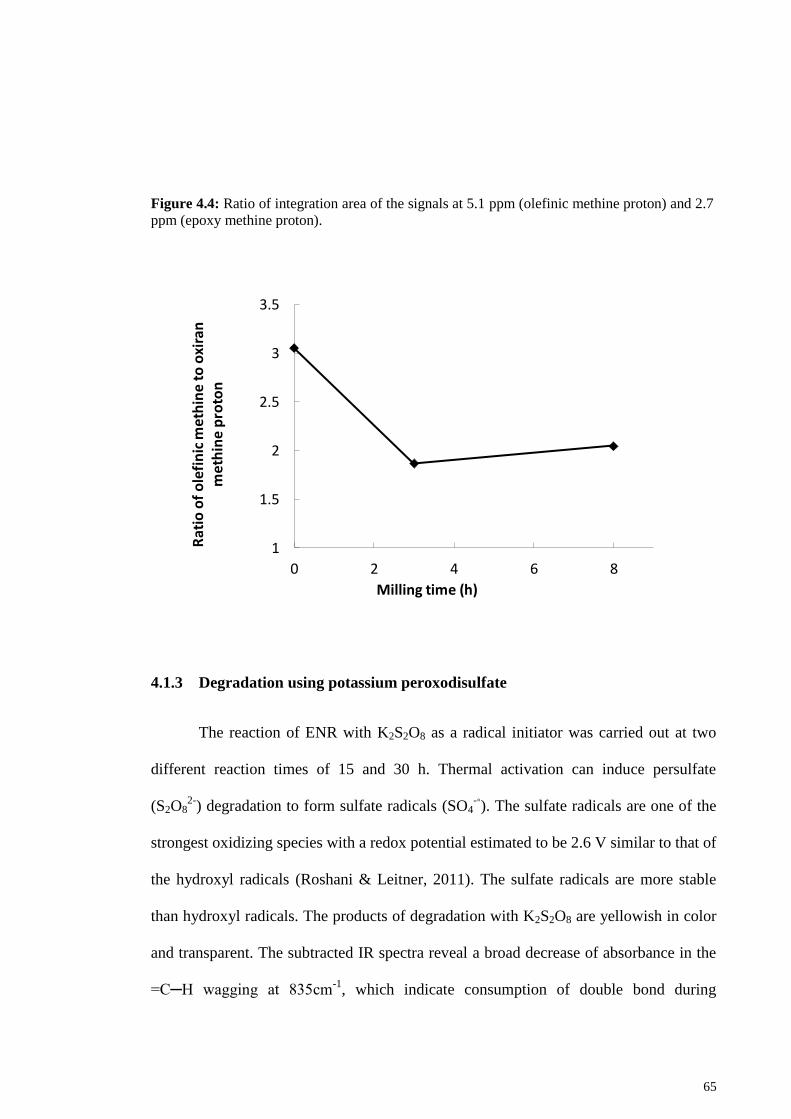
65
Figure 4.4: Ratio of integration area of the signals at 5.1 ppm (olefinic methine proton) and 2.7
ppm (epoxy methine proton).
Degradation using potassium peroxodisulfate 4.1.3
The reaction of ENR with K2S2O8 as a radical initiator was carried out at two
different reaction times of 15 and 30 h. Thermal activation can induce persulfate
(S2O82-
) degradation to form sulfate radicals (SO4-◦). The sulfate radicals are one of the
strongest oxidizing species with a redox potential estimated to be 2.6 V similar to that of
the hydroxyl radicals (Roshani & Leitner, 2011). The sulfate radicals are more stable
than hydroxyl radicals. The products of degradation with K2S2O8 are yellowish in color
and transparent. The subtracted IR spectra reveal a broad decrease of absorbance in the
=C─H wagging at 835cm-1
, which indicate consumption of double bond during
1
1.5
2
2.5
3
3.5
0 2 4 6 8
Rat
io o
f o
lefi
nic
met
hin
e to
oxi
ran
m
eth
ine
pro
ton
Milling time (h)
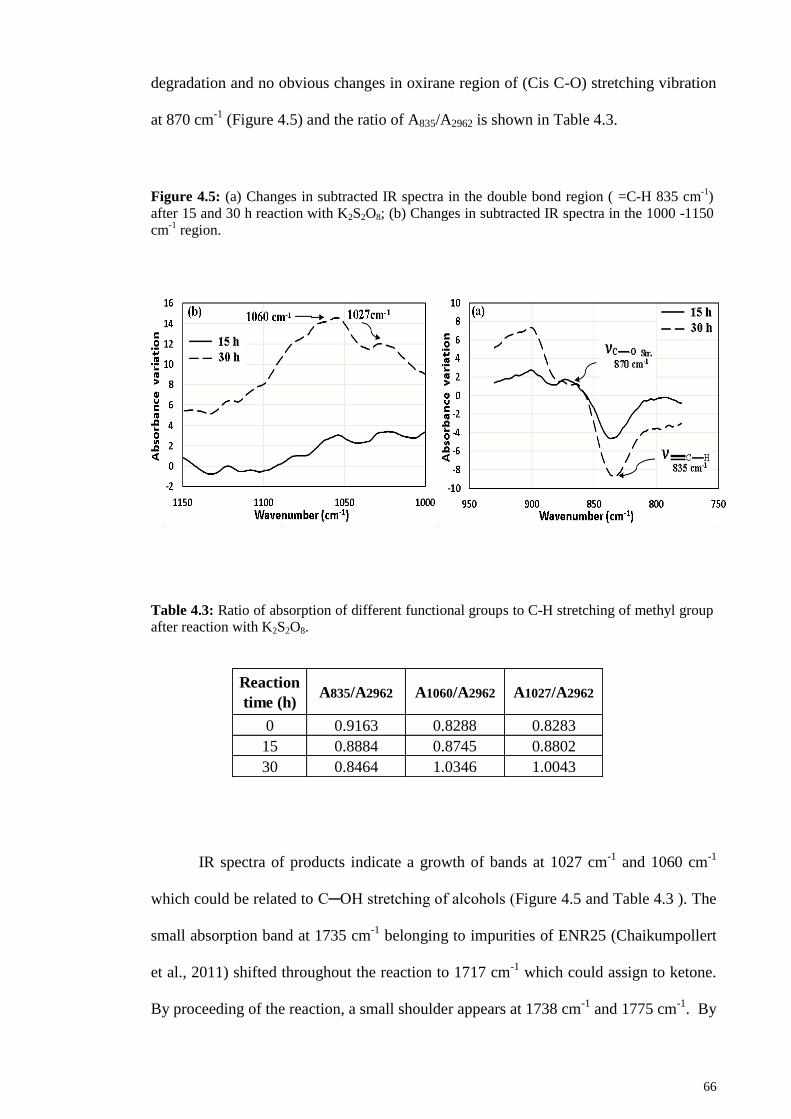
66
degradation and no obvious changes in oxirane region of (Cis C-O) stretching vibration
at 870 cm-1
(Figure 4.5) and the ratio of A835/A2962 is shown in Table 4.3.
Figure 4.5: (a) Changes in subtracted IR spectra in the double bond region ( =C-H 835 cm-1
)
after 15 and 30 h reaction with K2S2O8; (b) Changes in subtracted IR spectra in the 1000 -1150
cm-1
region.
Table 4.3: Ratio of absorption of different functional groups to C-H stretching of methyl group after reaction with K2S2O8.
IR spectra of products indicate a growth of bands at 1027 cm-1
and 1060 cm-1
which could be related to C─OH stretching of alcohols (Figure 4.5 and Table 4.3 ). The
small absorption band at 1735 cm-1
belonging to impurities of ENR25 (Chaikumpollert
et al., 2011) shifted throughout the reaction to 1717 cm-1
which could assign to ketone.
By proceeding of the reaction, a small shoulder appears at 1738 cm-1
and 1775 cm-1
. By
Reaction
time (h)A835/A2962 A1060/A2962 A1027/A2962
0 0.9163 0.8288 0.8283
15 0.8884 0.8745 0.8802
30 0.8464 1.0346 1.0043
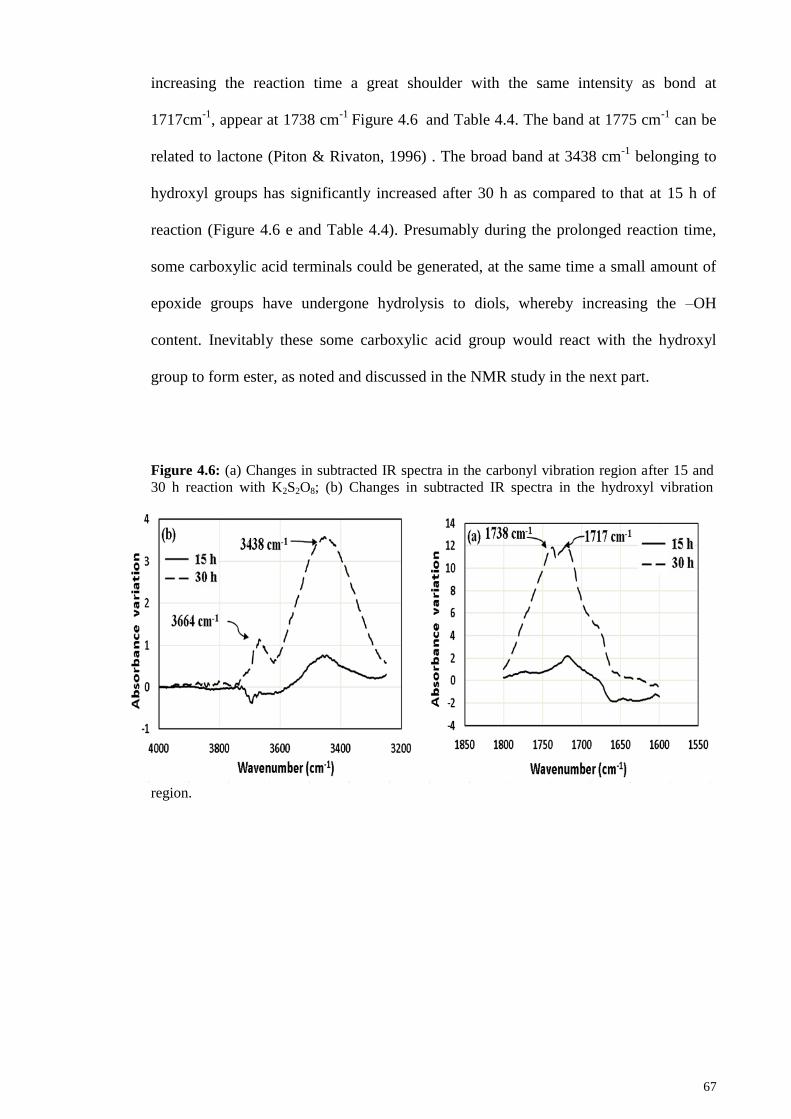
67
increasing the reaction time a great shoulder with the same intensity as bond at
1717cm-1
, appear at 1738 cm-1
Figure 4.6 and Table 4.4. The band at 1775 cm
-1 can be
related to lactone (Piton & Rivaton, 1996) . The broad band at 3438 cm-1
belonging to
hydroxyl groups has significantly increased after 30 h as compared to that at 15 h of
reaction (Figure 4.6 e and Table 4.4). Presumably during the prolonged reaction time,
some carboxylic acid terminals could be generated, at the same time a small amount of
epoxide groups have undergone hydrolysis to diols, whereby increasing the –OH
content. Inevitably these some carboxylic acid group would react with the hydroxyl
group to form ester, as noted and discussed in the NMR study in the next part.
Figure 4.6: (a) Changes in subtracted IR spectra in the carbonyl vibration region after 15 and
30 h reaction with K2S2O8; (b) Changes in subtracted IR spectra in the hydroxyl vibration
region.
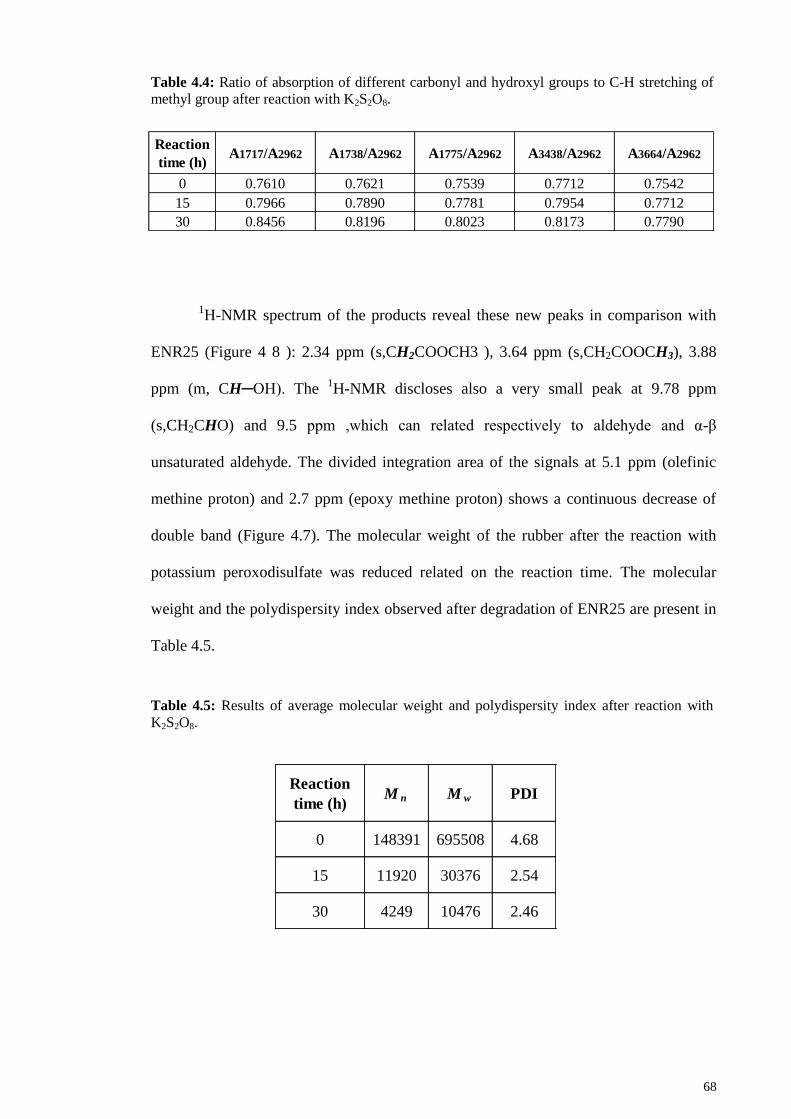
68
Table 4.4: Ratio of absorption of different carbonyl and hydroxyl groups to C-H stretching of
methyl group after reaction with K2S2O8.
1H-NMR spectrum of the products reveal these new peaks in comparison with
ENR25 (Figure 4 8 ): 2.34 ppm (s,CH2COOCH3 ), 3.64 ppm (s,CH2COOCH3), 3.88
ppm (m, CH─OH). The 1H-NMR discloses also a very small peak at 9.78 ppm
(s,CH2CHO) and 9.5 ppm ,which can related respectively to aldehyde and α-β
unsaturated aldehyde. The divided integration area of the signals at 5.1 ppm (olefinic
methine proton) and 2.7 ppm (epoxy methine proton) shows a continuous decrease of
double band (Figure 4.7). The molecular weight of the rubber after the reaction with
potassium peroxodisulfate was reduced related on the reaction time. The molecular
weight and the polydispersity index observed after degradation of ENR25 are present in
Table 4.5.
Table 4.5: Results of average molecular weight and polydispersity index after reaction with
K2S2O8.
Reaction
time (h)A1717/A2962 A1738/A2962 A1775/A2962 A3438/A2962 A3664/A2962
0 0.7610 0.7621 0.7539 0.7712 0.7542
15 0.7966 0.7890 0.7781 0.7954 0.7712
30 0.8456 0.8196 0.8023 0.8173 0.7790
Reaction
time (h)M n M w PDI
0 148391 695508 4.68
15 11920 30376 2.54
30 4249 10476 2.46
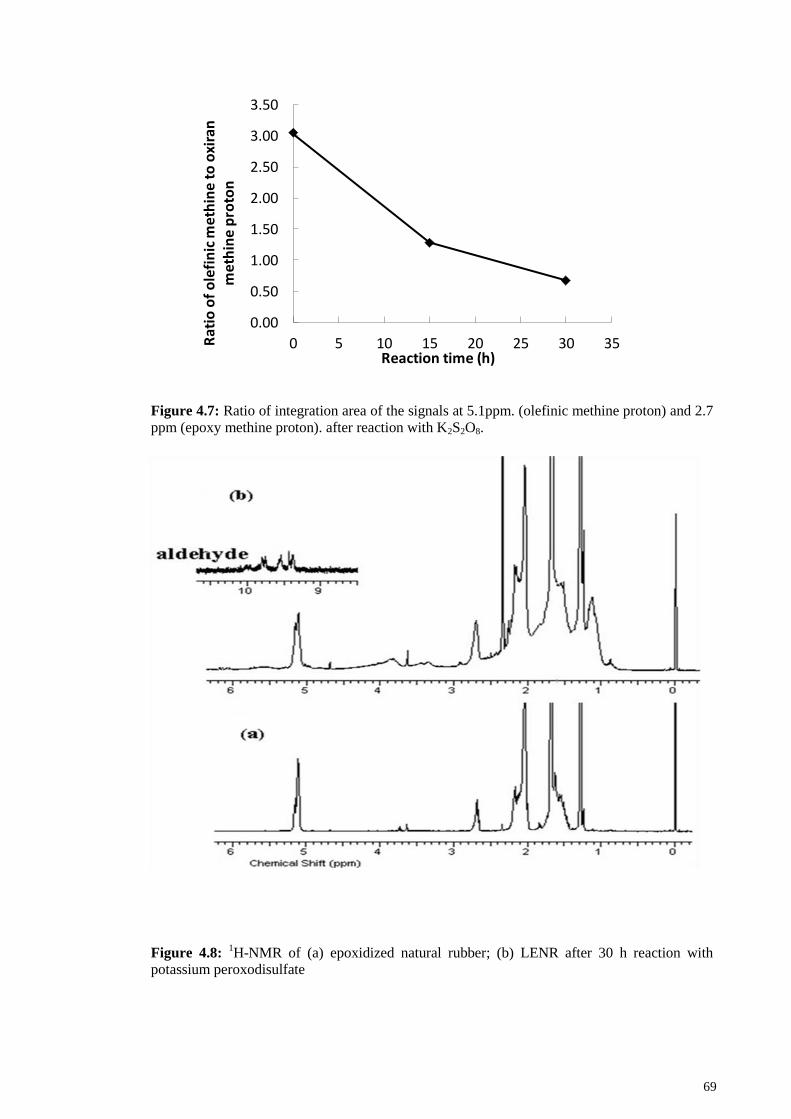
69
Figure 4.7: Ratio of integration area of the signals at 5.1ppm. (olefinic methine proton) and 2.7
ppm (epoxy methine proton). after reaction with K2S2O8.
Figure 4.8: 1H-NMR of (a) epoxidized natural rubber; (b) LENR after 30 h reaction with
potassium peroxodisulfate
0.00
0.50
1.00
1.50
2.00
2.50
3.00
3.50
0 5 10 15 20 25 30 35Rat
io o
f o
lefi
nic
me
thin
e t
o o
xira
n
me
thin
e p
roto
n
Reaction time (h)
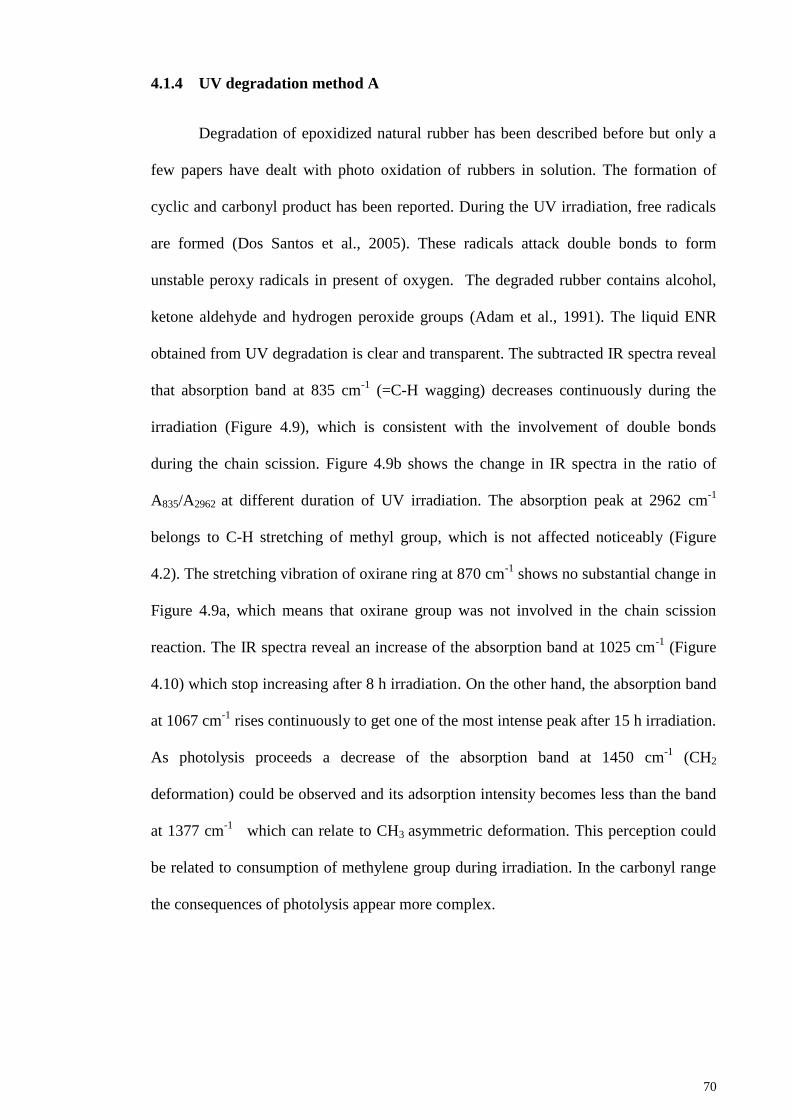
70
UV degradation method A 4.1.4
Degradation of epoxidized natural rubber has been described before but only a
few papers have dealt with photo oxidation of rubbers in solution. The formation of
cyclic and carbonyl product has been reported. During the UV irradiation, free radicals
are formed (Dos Santos et al., 2005). These radicals attack double bonds to form
unstable peroxy radicals in present of oxygen. The degraded rubber contains alcohol,
ketone aldehyde and hydrogen peroxide groups (Adam et al., 1991). The liquid ENR
obtained from UV degradation is clear and transparent. The subtracted IR spectra reveal
that absorption band at 835 cm-1
(=C-H wagging) decreases continuously during the
irradiation (Figure 4.9), which is consistent with the involvement of double bonds
during the chain scission. Figure 4.9b shows the change in IR spectra in the ratio of
A835/A2962 at different duration of UV irradiation. The absorption peak at 2962 cm-1
belongs to C-H stretching of methyl group, which is not affected noticeably (Figure
4.2). The stretching vibration of oxirane ring at 870 cm-1
shows no substantial change in
Figure 4.9a, which means that oxirane group was not involved in the chain scission
reaction. The IR spectra reveal an increase of the absorption band at 1025 cm-1
(Figure
4.10) which stop increasing after 8 h irradiation. On the other hand, the absorption band
at 1067 cm-1
rises continuously to get one of the most intense peak after 15 h irradiation.
As photolysis proceeds a decrease of the absorption band at 1450 cm-1
(CH2
deformation) could be observed and its adsorption intensity becomes less than the band
at 1377 cm-1
which can relate to CH3 asymmetric deformation. This perception could
be related to consumption of methylene group during irradiation. In the carbonyl range
the consequences of photolysis appear more complex.
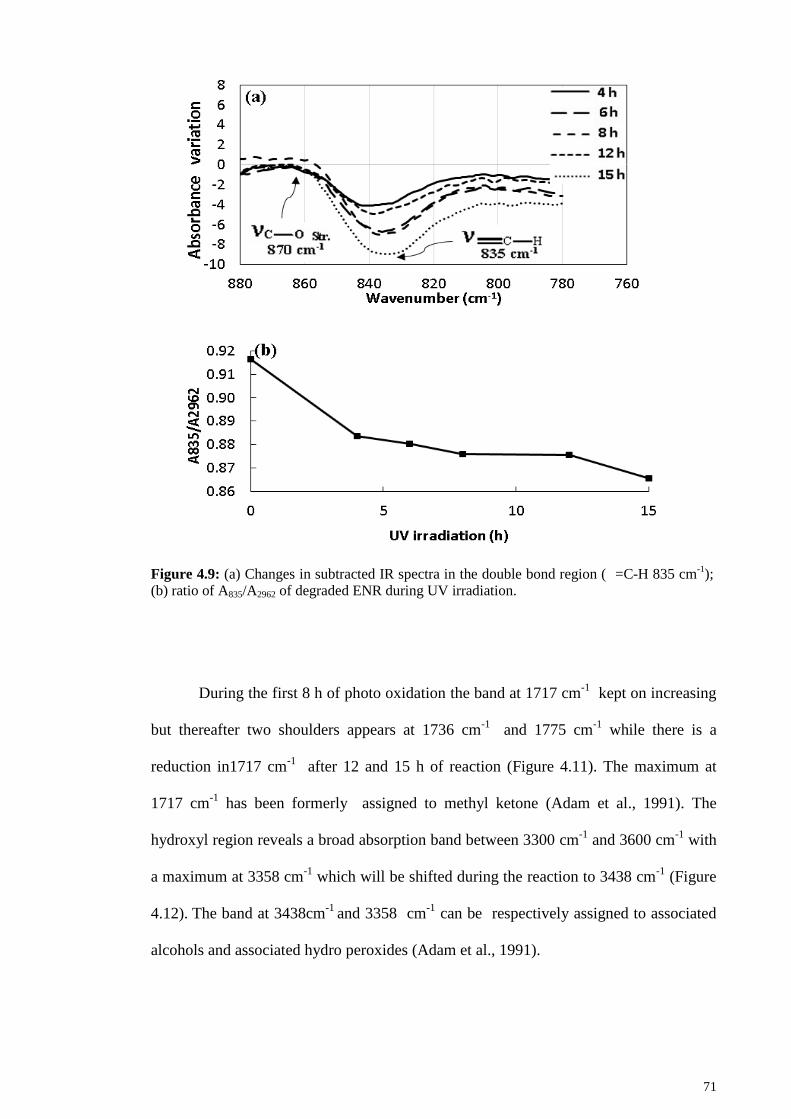
71
Figure 4.9: (a) Changes in subtracted IR spectra in the double bond region ( =C-H 835 cm-1
); (b) ratio of A835/A2962 of degraded ENR during UV irradiation.
During the first 8 h of photo oxidation the band at 1717 cm-1
kept on increasing
but thereafter two shoulders appears at 1736 cm-1
and 1775 cm-1
while there is a
reduction in1717 cm-1
after 12 and 15 h of reaction (Figure 4.11). The maximum at
1717 cm-1
has been formerly assigned to methyl ketone (Adam et al., 1991). The
hydroxyl region reveals a broad absorption band between 3300 cm-1
and 3600 cm-1
with
a maximum at 3358 cm-1
which will be shifted during the reaction to 3438 cm-1
(Figure
4.12). The band at 3438cm-1 and 3358 cm
-1 can be respectively assigned to associated
alcohols and associated hydro peroxides (Adam et al., 1991).
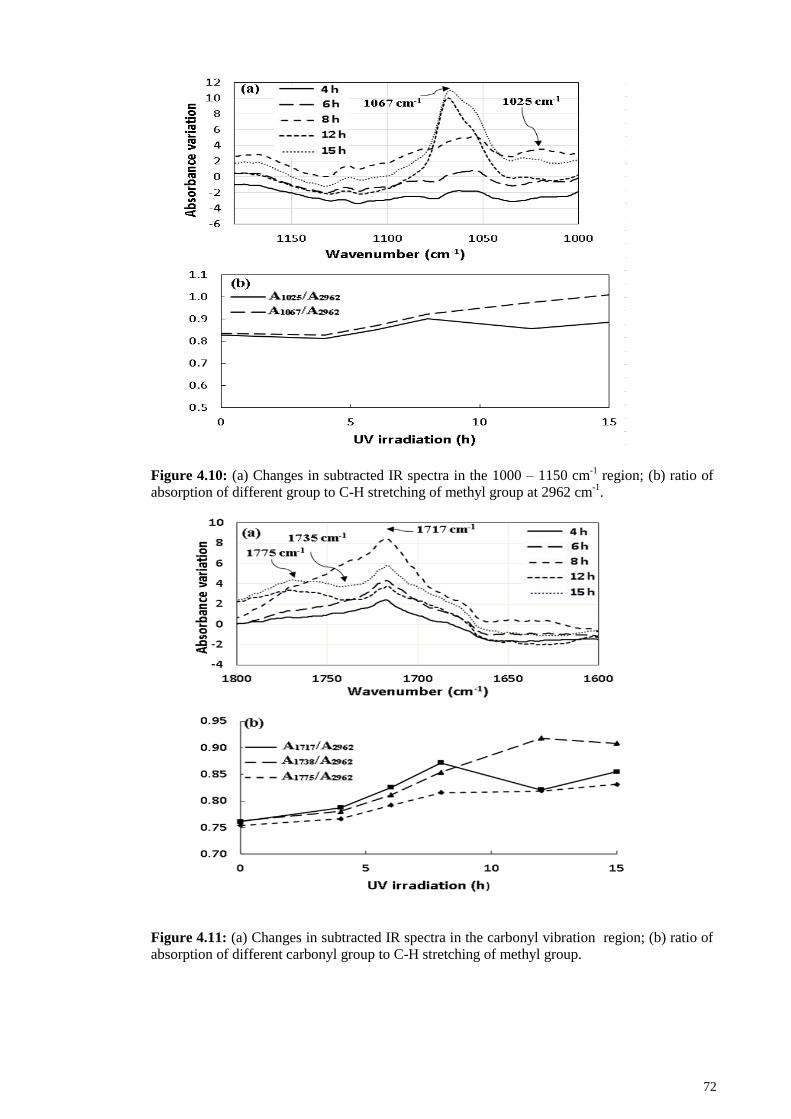
72
Figure 4.10: (a) Changes in subtracted IR spectra in the 1000 – 1150 cm-1
region; (b) ratio of
absorption of different group to C-H stretching of methyl group at 2962 cm-1
.
Figure 4.11: (a) Changes in subtracted IR spectra in the carbonyl vibration region; (b) ratio of
absorption of different carbonyl group to C-H stretching of methyl group.
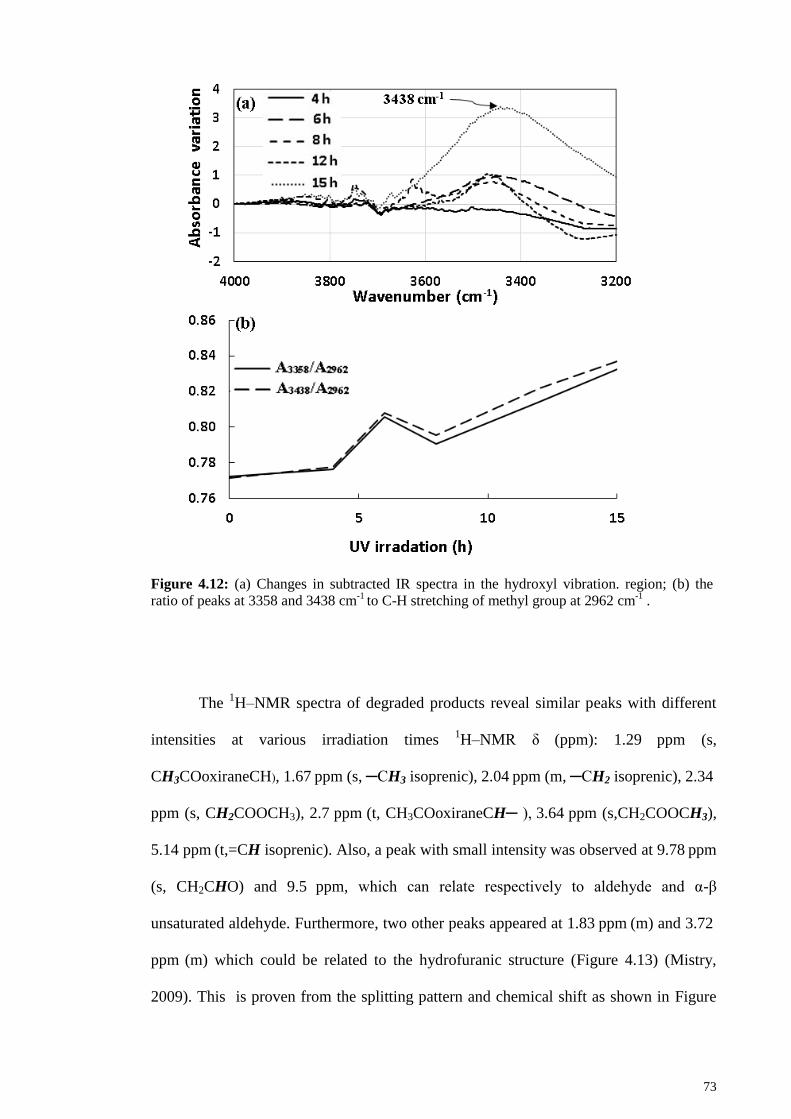
73
Figure 4.12: (a) Changes in subtracted IR spectra in the hydroxyl vibration. region; (b) the
ratio of peaks at 3358 and 3438 cm-1
to C-H stretching of methyl group at 2962 cm-1
.
The 1H–NMR spectra of degraded products reveal similar peaks with different
intensities at various irradiation times 1H–NMR δ (ppm): 1.29 ppm (s,
CH3COoxiraneCH(, 1.67 ppm (s, ─CH3 isoprenic), 2.04 ppm (m, ─CH2 isoprenic), 2.34
ppm (s, CH2COOCH3), 2.7 ppm (t, CH3COoxiraneCH─ ), 3.64 ppm (s,CH2COOCH3),
5.14 ppm (t,=CH isoprenic). Also, a peak with small intensity was observed at 9.78 ppm
(s, CH2CHO) and 9.5 ppm, which can relate respectively to aldehyde and α-β
unsaturated aldehyde. Furthermore, two other peaks appeared at 1.83 ppm (m) and 3.72
ppm (m) which could be related to the hydrofuranic structure (Figure 4.13) (Mistry,
2009). This is proven from the splitting pattern and chemical shift as shown in Figure
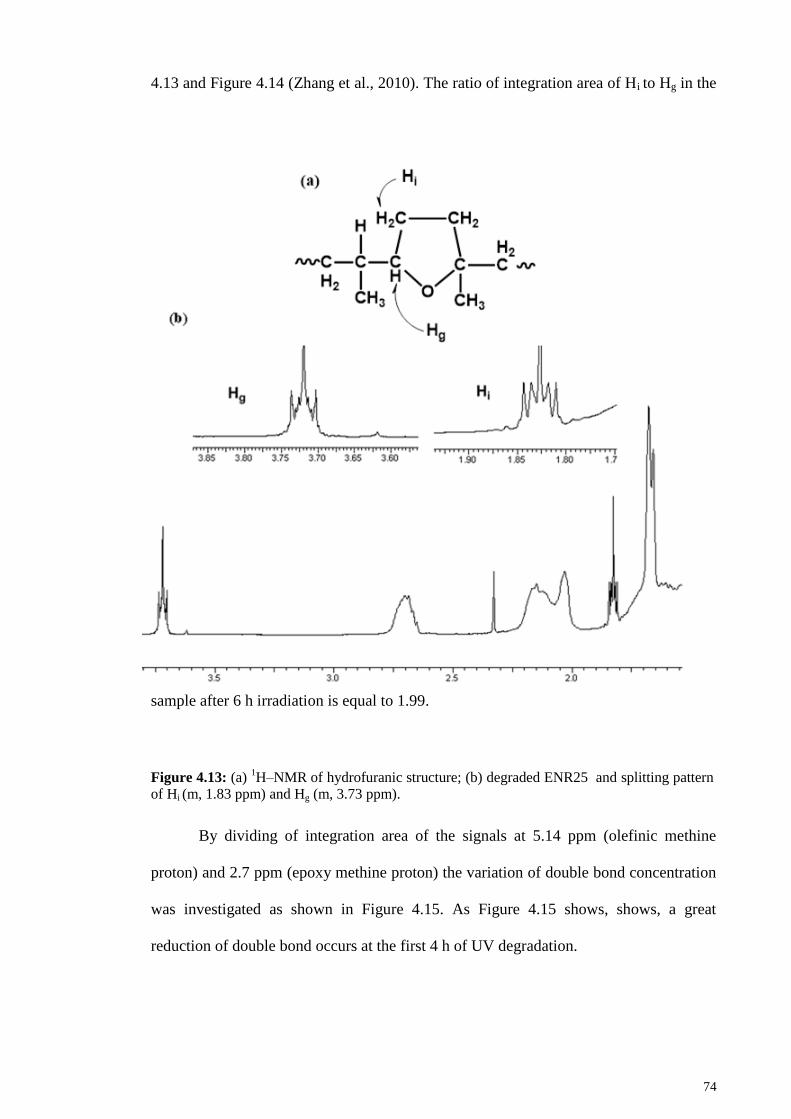
74
4.13 and Figure 4.14 (Zhang et al., 2010). The ratio of integration area of Hi to Hg in the
sample after 6 h irradiation is equal to 1.99.
Figure 4.13: (a) 1H–NMR of hydrofuranic structure; (b) degraded ENR25 and splitting pattern
of Hi (m, 1.83 ppm) and Hg (m, 3.73 ppm).
By dividing of integration area of the signals at 5.14 ppm (olefinic methine
proton) and 2.7 ppm (epoxy methine proton) the variation of double bond concentration
was investigated as shown in Figure 4.15. As Figure 4.15 shows, shows, a great
reduction of double bond occurs at the first 4 h of UV degradation.
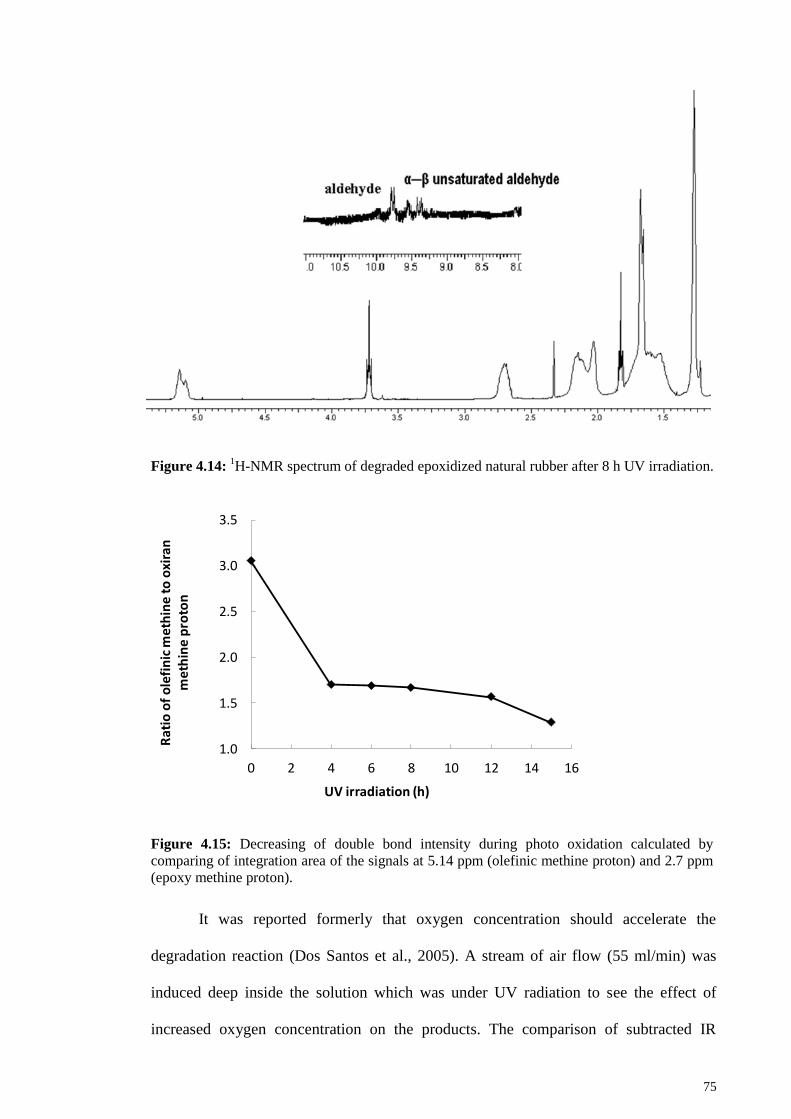
75
Figure 4.14: 1H-NMR spectrum of degraded epoxidized natural rubber after 8 h UV irradiation.
Figure 4.15: Decreasing of double bond intensity during photo oxidation calculated by
comparing of integration area of the signals at 5.14 ppm (olefinic methine proton) and 2.7 ppm
(epoxy methine proton).
It was reported formerly that oxygen concentration should accelerate the
degradation reaction (Dos Santos et al., 2005). A stream of air flow (55 ml/min) was
induced deep inside the solution which was under UV radiation to see the effect of
increased oxygen concentration on the products. The comparison of subtracted IR
1.0
1.5
2.0
2.5
3.0
3.5
0 2 4 6 8 10 12 14 16
Rat
io o
f o
lefi
nic
met
hin
e to
oxi
ran
m
eth
ine
pro
ton
UV irradiation (h)
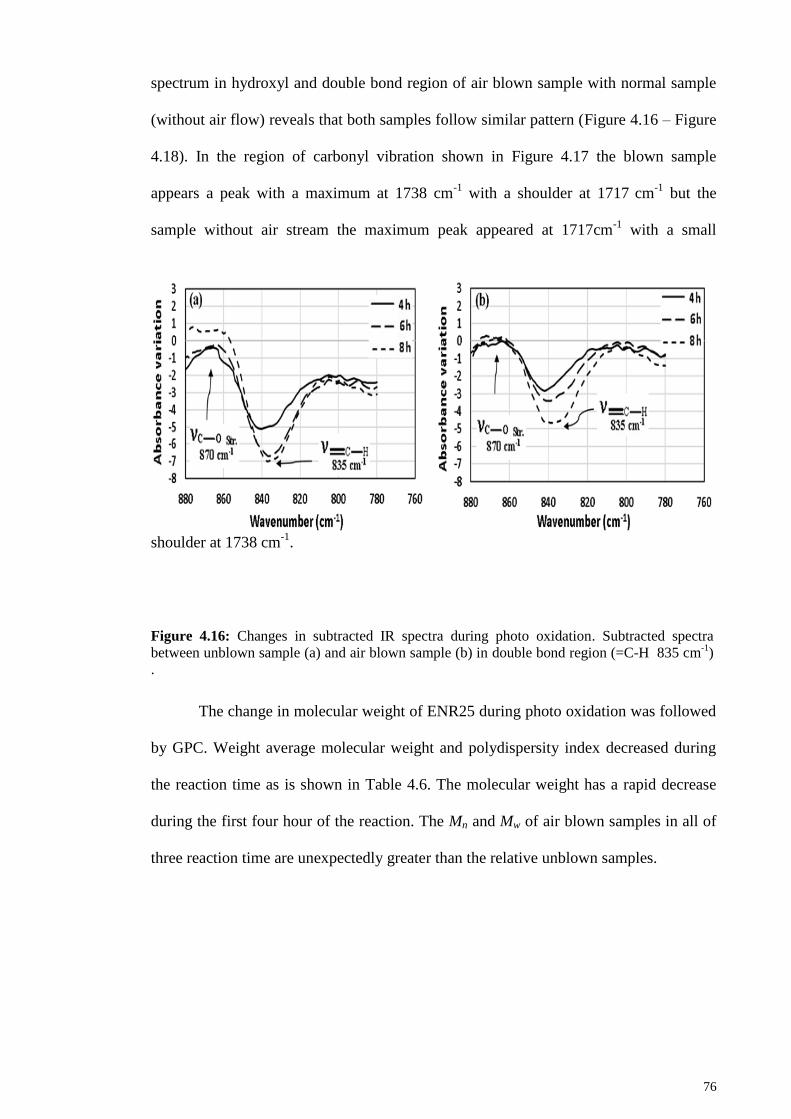
76
spectrum in hydroxyl and double bond region of air blown sample with normal sample
(without air flow) reveals that both samples follow similar pattern (Figure 4.16 – Figure
4.18). In the region of carbonyl vibration shown in Figure 4.17 the blown sample
appears a peak with a maximum at 1738 cm-1
with a shoulder at 1717 cm-1
but the
sample without air stream the maximum peak appeared at 1717cm-1
with a small
shoulder at 1738 cm-1
.
Figure 4.16: Changes in subtracted IR spectra during photo oxidation. Subtracted spectra
between unblown sample (a) and air blown sample (b) in double bond region (=C-H 835 cm-1
)
.
The change in molecular weight of ENR25 during photo oxidation was followed
by GPC. Weight average molecular weight and polydispersity index decreased during
the reaction time as is shown in Table 4.6. The molecular weight has a rapid decrease
during the first four hour of the reaction. The Mn and Mw of air blown samples in all of
three reaction time are unexpectedly greater than the relative unblown samples.
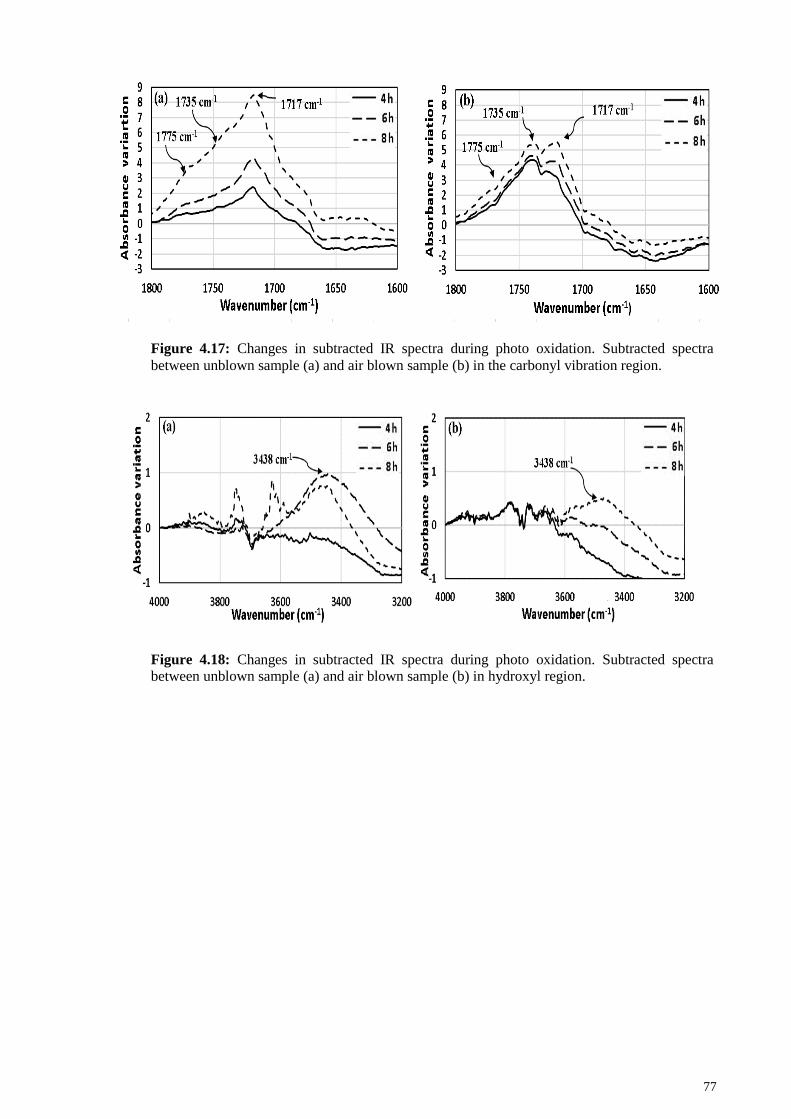
77
Figure 4.17: Changes in subtracted IR spectra during photo oxidation. Subtracted spectra
between unblown sample (a) and air blown sample (b) in the carbonyl vibration region.
Figure 4.18: Changes in subtracted IR spectra during photo oxidation. Subtracted spectra between unblown sample (a) and air blown sample (b) in hydroxyl region.
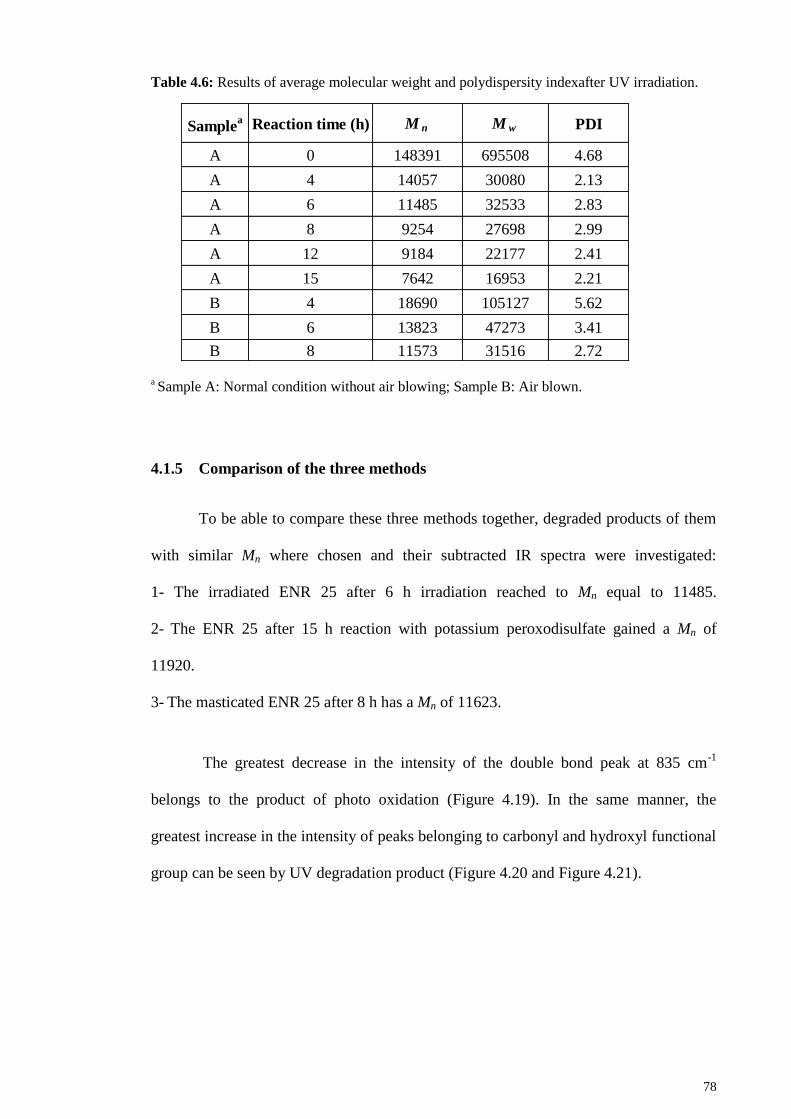
78
Table 4.6: Results of average molecular weight and polydispersity indexafter UV irradiation.
a Sample A: Normal condition without air blowing; Sample B: Air blown.
Comparison of the three methods 4.1.5
To be able to compare these three methods together, degraded products of them
with similar Mn where chosen and their subtracted IR spectra were investigated:
1- The irradiated ENR 25 after 6 h irradiation reached to Mn equal to 11485.
2- The ENR 25 after 15 h reaction with potassium peroxodisulfate gained a Mn of
11920.
3- The masticated ENR 25 after 8 h has a Mn of 11623.
The greatest decrease in the intensity of the double bond peak at 835 cm-1
belongs to the product of photo oxidation (Figure 4.19). In the same manner, the
greatest increase in the intensity of peaks belonging to carbonyl and hydroxyl functional
group can be seen by UV degradation product (Figure 4.20 and Figure 4.21).
Samplea Reaction time (h) M n M w PDI
A 0 148391 695508 4.68
A 4 14057 30080 2.13
A 6 11485 32533 2.83
A 8 9254 27698 2.99
A 12 9184 22177 2.41
A 15 7642 16953 2.21
B 4 18690 105127 5.62
B 6 13823 47273 3.41
B 8 11573 31516 2.72
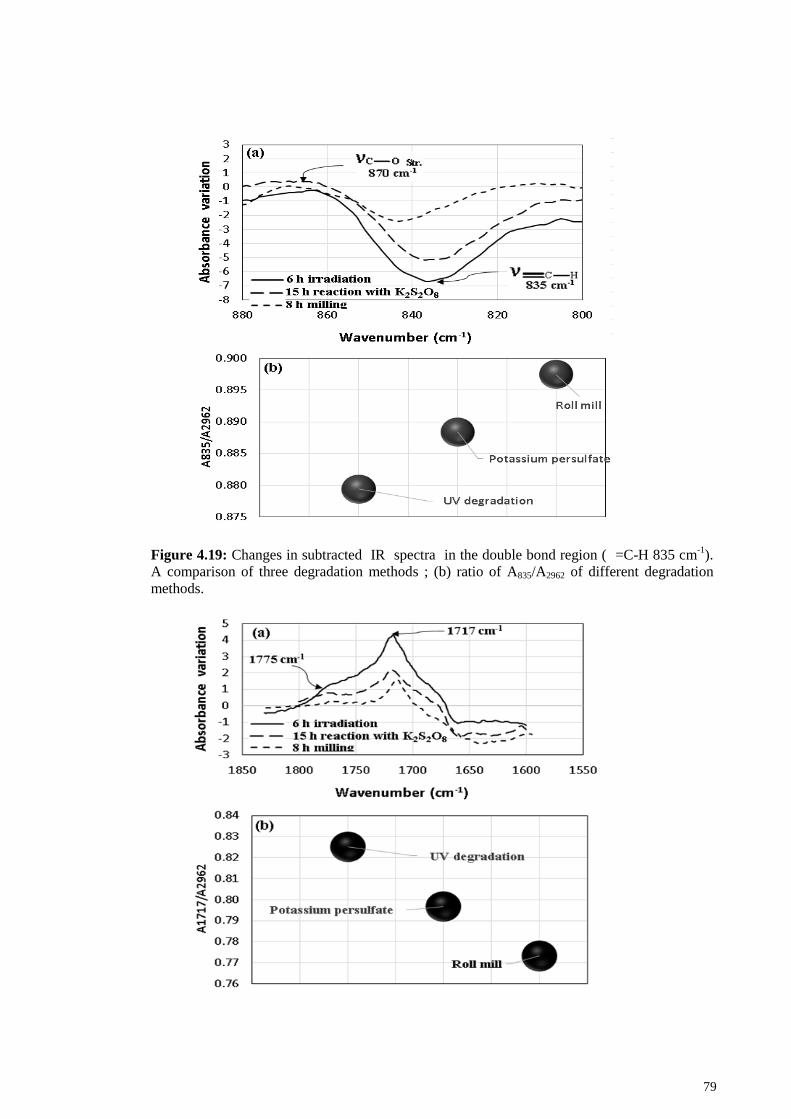
79
Figure 4.19: Changes in subtracted IR spectra in the double bond region ( =C-H 835 cm-1
).
A comparison of three degradation methods ; (b) ratio of A835/A2962 of different degradation
methods.
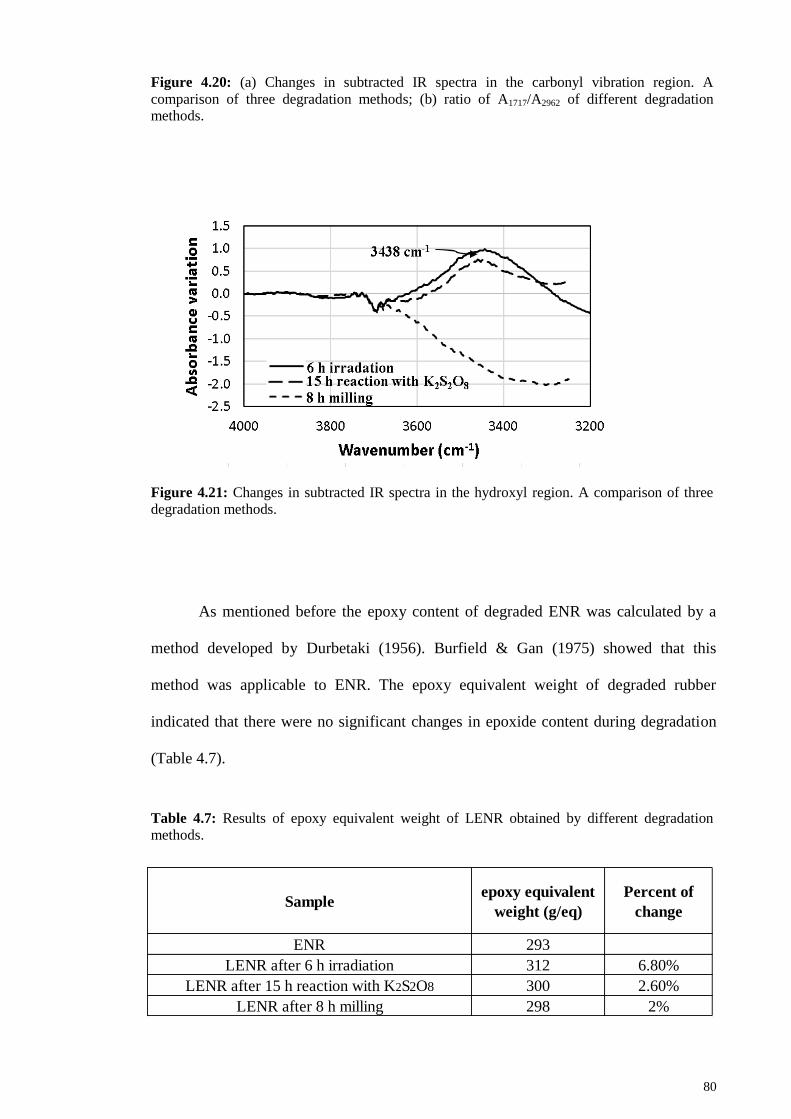
80
Figure 4.20: (a) Changes in subtracted IR spectra in the carbonyl vibration region. A
comparison of three degradation methods; (b) ratio of A1717/A2962 of different degradation methods.
Figure 4.21: Changes in subtracted IR spectra in the hydroxyl region. A comparison of three
degradation methods.
As mentioned before the epoxy content of degraded ENR was calculated by a
method developed by Durbetaki (1956). Burfield & Gan (1975) showed that this
method was applicable to ENR. The epoxy equivalent weight of degraded rubber
indicated that there were no significant changes in epoxide content during degradation
(Table 4.7).
Table 4.7: Results of epoxy equivalent weight of LENR obtained by different degradation
methods.
Sampleepoxy equivalent
weight (g/eq)
Percent of
change
ENR 293
LENR after 6 h irradiation 312 6.80%
LENR after 15 h reaction with K2S2O8 300 2.60%
LENR after 8 h milling 298 2%
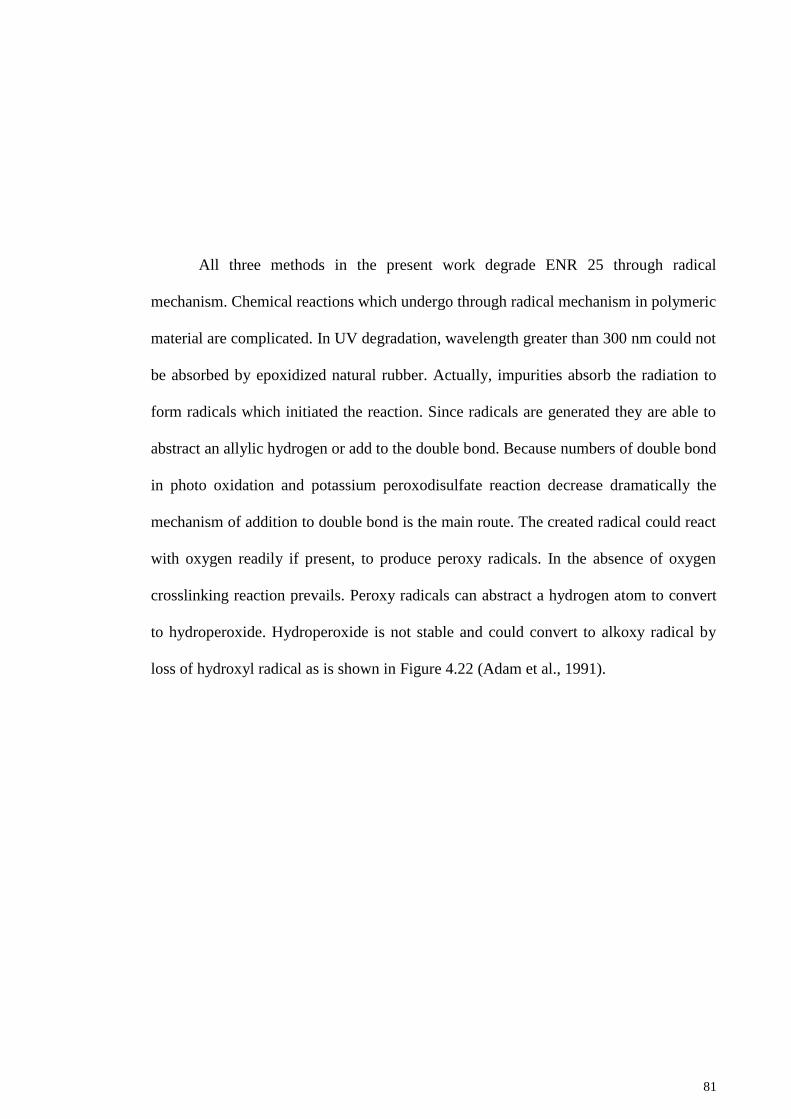
81
All three methods in the present work degrade ENR 25 through radical
mechanism. Chemical reactions which undergo through radical mechanism in polymeric
material are complicated. In UV degradation, wavelength greater than 300 nm could not
be absorbed by epoxidized natural rubber. Actually, impurities absorb the radiation to
form radicals which initiated the reaction. Since radicals are generated they are able to
abstract an allylic hydrogen or add to the double bond. Because numbers of double bond
in photo oxidation and potassium peroxodisulfate reaction decrease dramatically the
mechanism of addition to double bond is the main route. The created radical could react
with oxygen readily if present, to produce peroxy radicals. In the absence of oxygen
crosslinking reaction prevails. Peroxy radicals can abstract a hydrogen atom to convert
to hydroperoxide. Hydroperoxide is not stable and could convert to alkoxy radical by
loss of hydroxyl radical as is shown in Figure 4.22 (Adam et al., 1991).

82
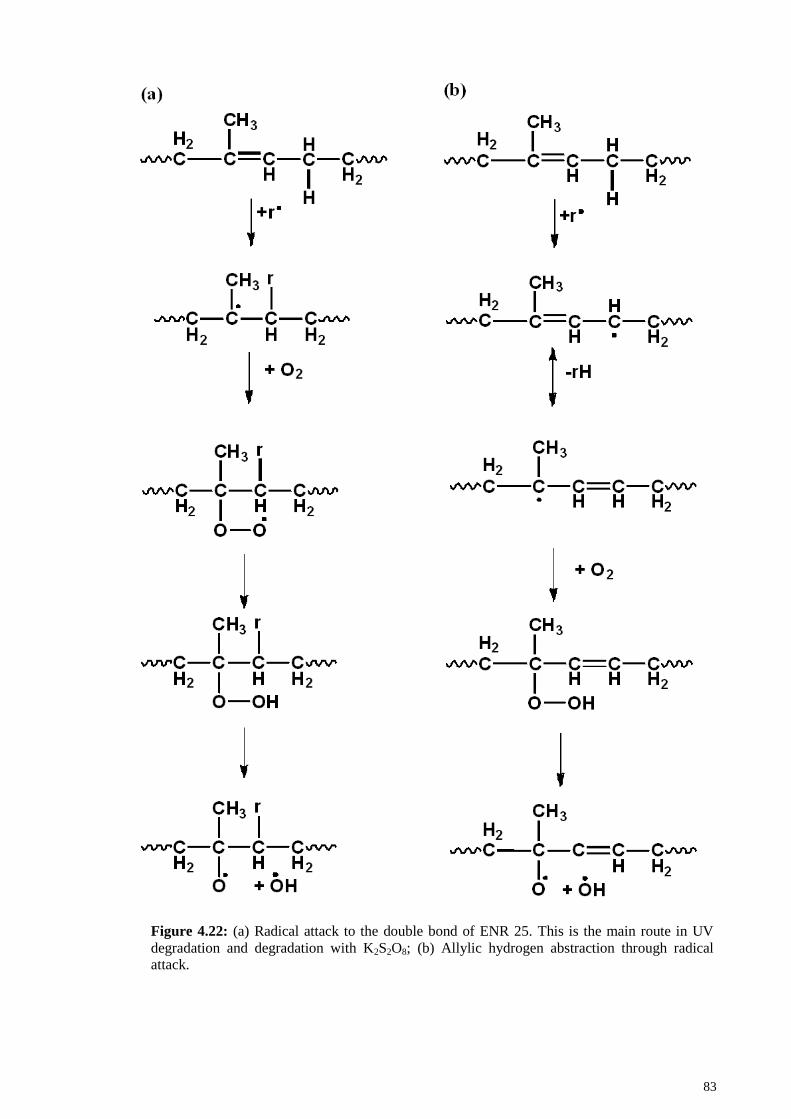
83
Figure 4.22: (a) Radical attack to the double bond of ENR 25. This is the main route in UV
degradation and degradation with K2S2O8; (b) Allylic hydrogen abstraction through radical attack.
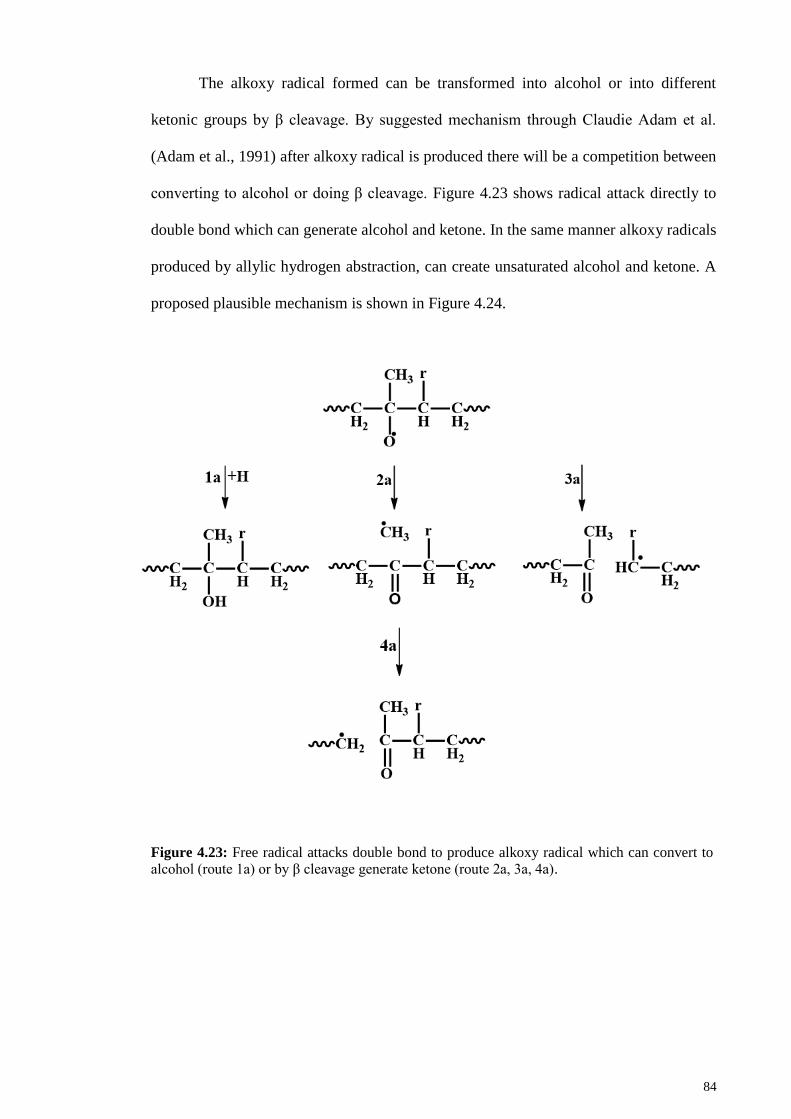
84
The alkoxy radical formed can be transformed into alcohol or into different
ketonic groups by β cleavage. By suggested mechanism through Claudie Adam et al.
(Adam et al., 1991) after alkoxy radical is produced there will be a competition between
converting to alcohol or doing β cleavage. Figure 4.23 shows radical attack directly to
double bond which can generate alcohol and ketone. In the same manner alkoxy radicals
produced by allylic hydrogen abstraction, can create unsaturated alcohol and ketone. A
proposed plausible mechanism is shown in Figure 4.24.
Figure 4.23: Free radical attacks double bond to produce alkoxy radical which can convert to alcohol (route 1a) or by β cleavage generate ketone (route 2a, 3a, 4a).
85
Figure 4.24: Free radical abstracts allylic hydrogen to produce alkoxy radical which can
convert to alcohol (route 1b) or by β cleavages generate unsaturated ketone (route 2b, 3b, 4b) .
The main routes are 1b and 4b.
The route 1a and 1b will result in alcohol and enol products. The paths 3a, 3b
and 4a, 4b result in chain degradation and production of saturated and unsaturated
ketones. The absorption band at 1717 cm-1
could be attributed to ketones and the
absorption peak which appears at 1712 cm-1
in roll mill degraded product could be
related to unsaturated ketones which could explain why in mastication there is no exact
relation between chain scission and double bond deduction. Because by rupturing of
primary bond between the neighboring methylene groups, two allyl radicals will be
generated (Pike & Watson, 1952) (Figure 4.25) which could attack a double bond or
convert to a more stable tertiary alkyl radical that can react with oxygen to produce
peroxy radicals. This radical can convert to unsaturated ketone by β cleavage.
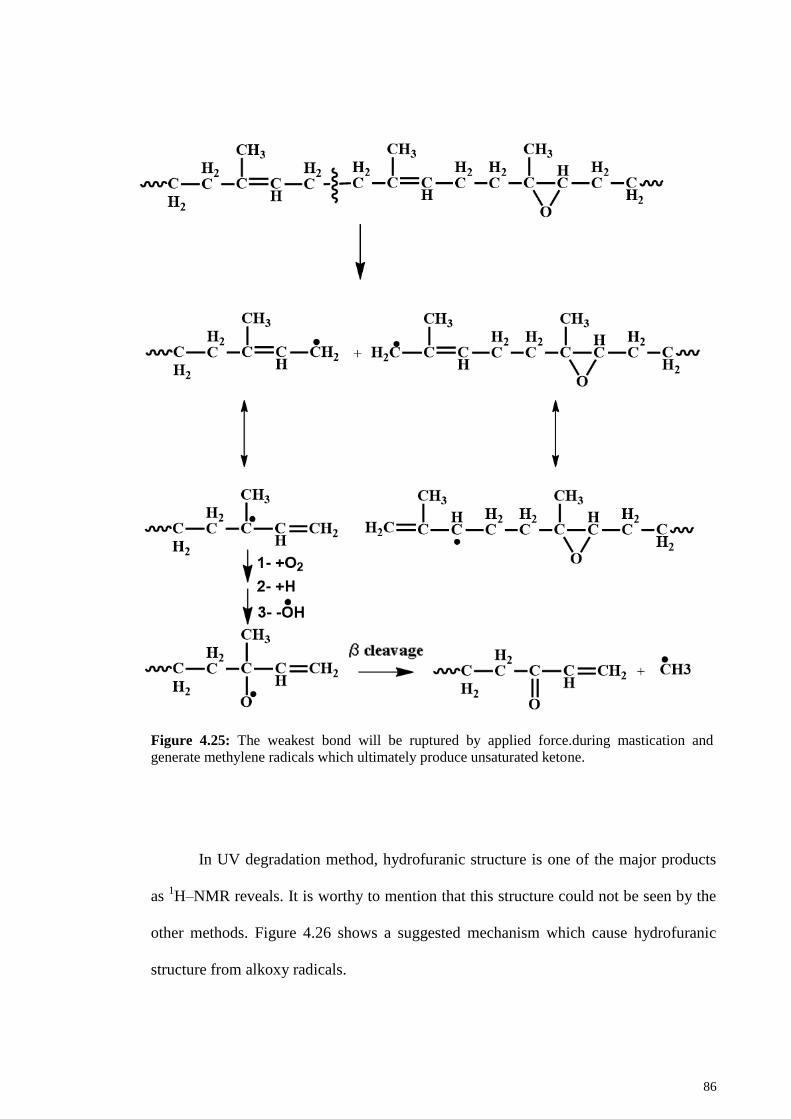
86
Figure 4.25: The weakest bond will be ruptured by applied force.during mastication and
generate methylene radicals which ultimately produce unsaturated ketone.
In UV degradation method, hydrofuranic structure is one of the major products
as 1H–NMR reveals. It is worthy to mention that this structure could not be seen by the
other methods. Figure 4.26 shows a suggested mechanism which cause hydrofuranic
structure from alkoxy radicals.
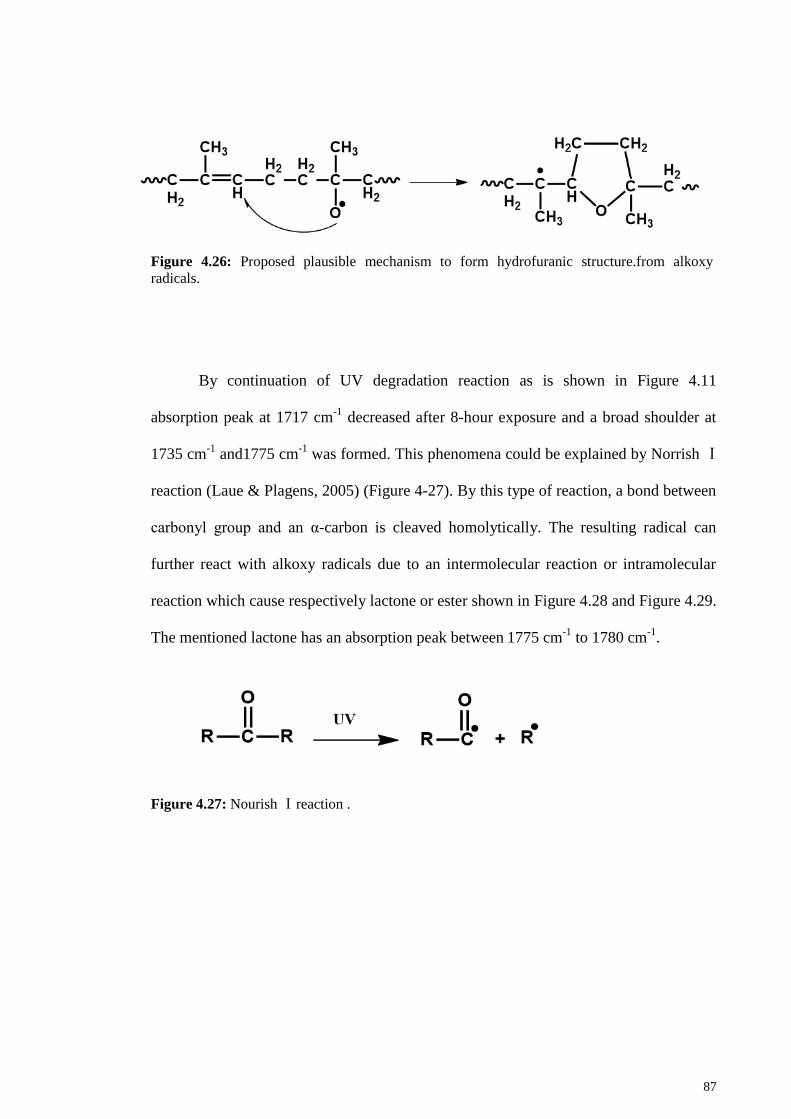
87
Figure 4.26: Proposed plausible mechanism to form hydrofuranic structure.from alkoxy
radicals.
By continuation of UV degradation reaction as is shown in Figure 4.11
absorption peak at 1717 cm-1
decreased after 8-hour exposure and a broad shoulder at
1735 cm-1
and1775 cm-1
was formed. This phenomena could be explained by Norrish Ⅰ
reaction (Laue & Plagens, 2005) (Figure 4-27). By this type of reaction, a bond between
carbonyl group and an α-carbon is cleaved homolytically. The resulting radical can
further react with alkoxy radicals due to an intermolecular reaction or intramolecular
reaction which cause respectively lactone or ester shown in Figure 4.28 and Figure 4.29.
The mentioned lactone has an absorption peak between 1775 cm-1
to 1780 cm-1
.
Figure 4.27: Nourish Ⅰ reaction .
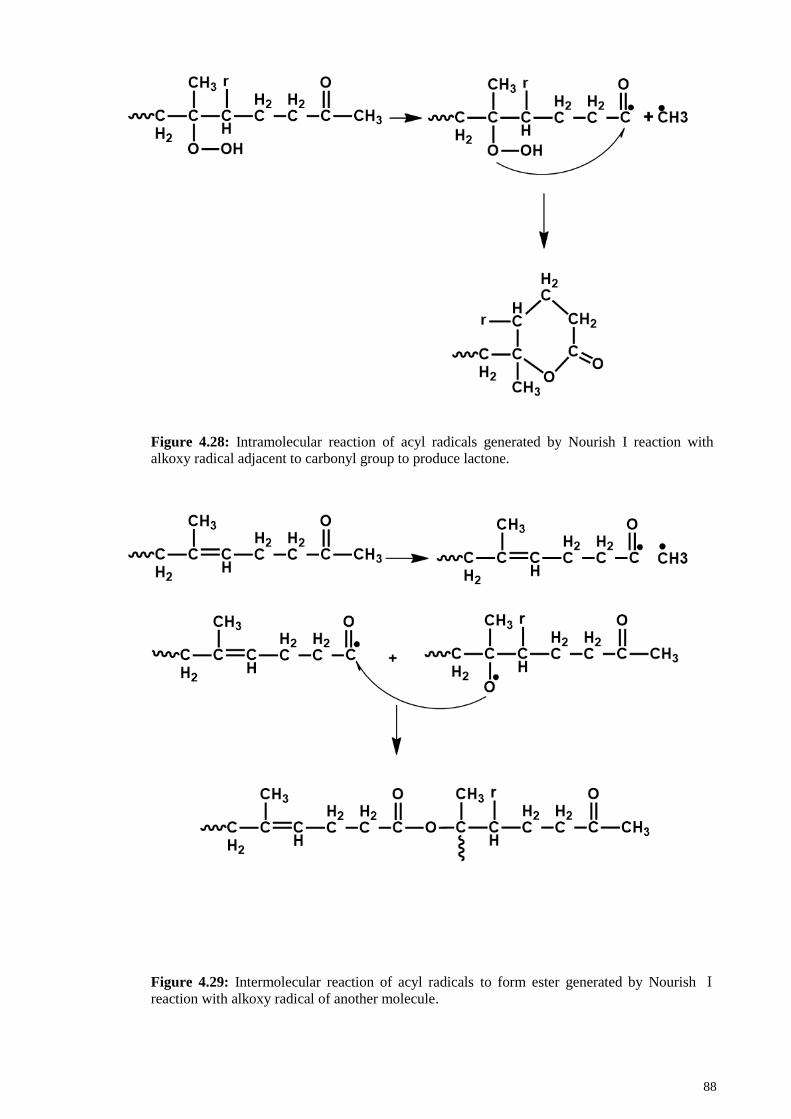
88
Figure 4.28: Intramolecular reaction of acyl radicals generated by Nourish I reaction with alkoxy radical adjacent to carbonyl group to produce lactone.
Figure 4.29: Intermolecular reaction of acyl radicals to form ester generated by Nourish Ⅰ
reaction with alkoxy radical of another molecule.
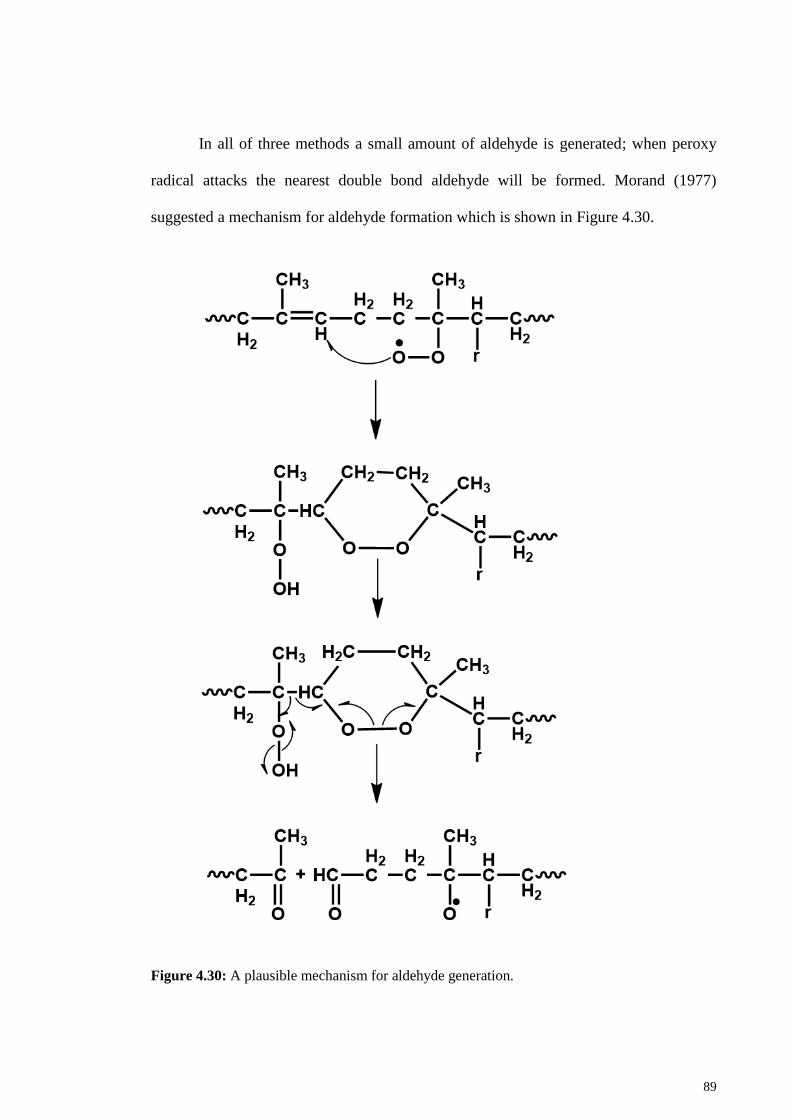
89
In all of three methods a small amount of aldehyde is generated; when peroxy
radical attacks the nearest double bond aldehyde will be formed. Morand (1977)
suggested a mechanism for aldehyde formation which is shown in Figure 4.30.
Figure 4.30: A plausible mechanism for aldehyde generation.
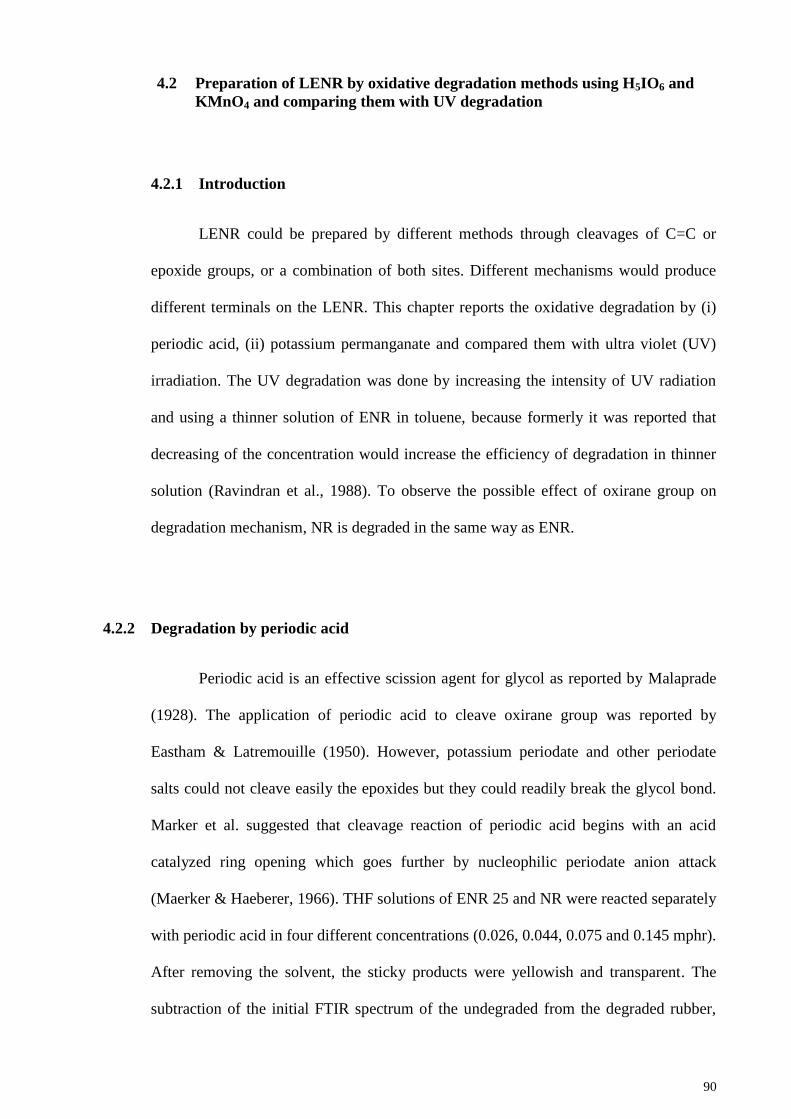
90
4.2 Preparation of LENR by oxidative degradation methods using H5IO6 and
KMnO4 and comparing them with UV degradation
Introduction 4.2.1
LENR could be prepared by different methods through cleavages of C=C or
epoxide groups, or a combination of both sites. Different mechanisms would produce
different terminals on the LENR. This chapter reports the oxidative degradation by (i)
periodic acid, (ii) potassium permanganate and compared them with ultra violet (UV)
irradiation. The UV degradation was done by increasing the intensity of UV radiation
and using a thinner solution of ENR in toluene, because formerly it was reported that
decreasing of the concentration would increase the efficiency of degradation in thinner
solution (Ravindran et al., 1988). To observe the possible effect of oxirane group on
degradation mechanism, NR is degraded in the same way as ENR.
Degradation by periodic acid 4.2.2
Periodic acid is an effective scission agent for glycol as reported by Malaprade
(1928). The application of periodic acid to cleave oxirane group was reported by
Eastham & Latremouille (1950). However, potassium periodate and other periodate
salts could not cleave easily the epoxides but they could readily break the glycol bond.
Marker et al. suggested that cleavage reaction of periodic acid begins with an acid
catalyzed ring opening which goes further by nucleophilic periodate anion attack
(Maerker & Haeberer, 1966). THF solutions of ENR 25 and NR were reacted separately
with periodic acid in four different concentrations (0.026, 0.044, 0.075 and 0.145 mphr).
After removing the solvent, the sticky products were yellowish and transparent. The
subtraction of the initial FTIR spectrum of the undegraded from the degraded rubber,
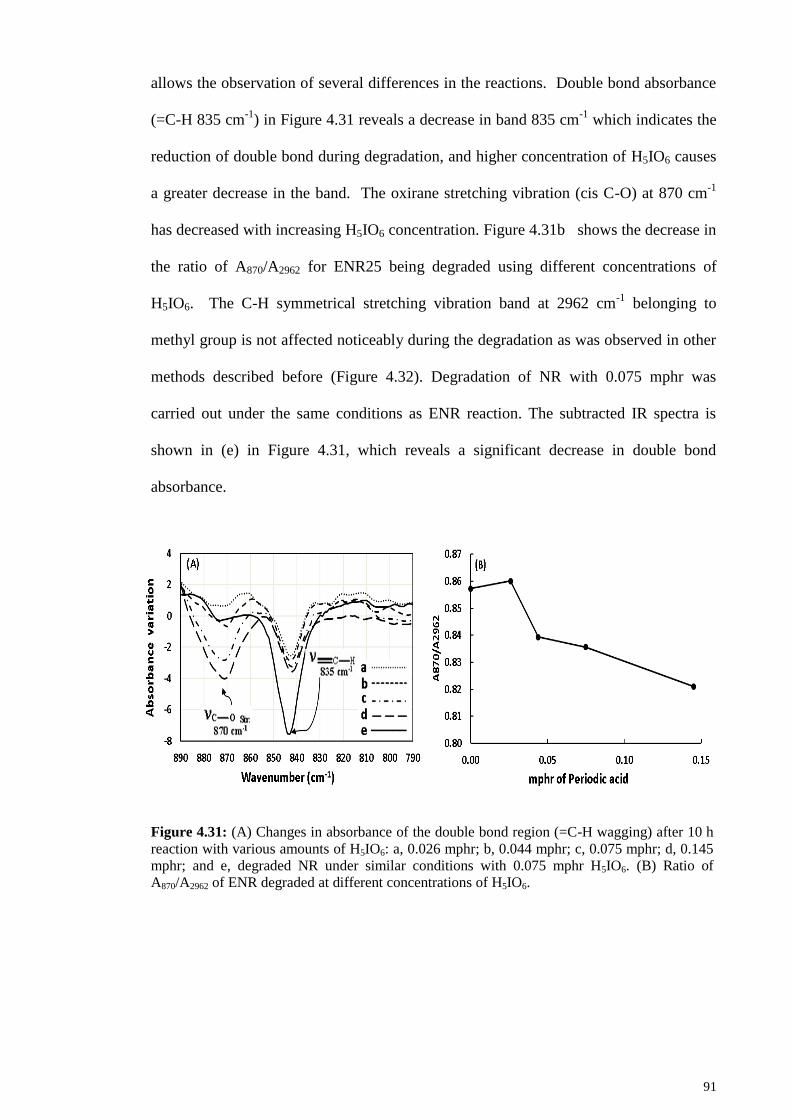
91
allows the observation of several differences in the reactions. Double bond absorbance
(=C-H 835 cm-1
) in Figure 4.31 reveals a decrease in band 835 cm-1
which indicates the
reduction of double bond during degradation, and higher concentration of H5IO6 causes
a greater decrease in the band. The oxirane stretching vibration (cis C-O) at 870 cm-1
has decreased with increasing H5IO6 concentration. Figure 4.31b shows the decrease in
the ratio of A870/A2962 for ENR25 being degraded using different concentrations of
H5IO6. The C-H symmetrical stretching vibration band at 2962 cm-1
belonging to
methyl group is not affected noticeably during the degradation as was observed in other
methods described before (Figure 4.32). Degradation of NR with 0.075 mphr was
carried out under the same conditions as ENR reaction. The subtracted IR spectra is
shown in (e) in Figure 4.31, which reveals a significant decrease in double bond
absorbance.
Figure 4.31: (A) Changes in absorbance of the double bond region (=C-H wagging) after 10 h
reaction with various amounts of H5IO6: a, 0.026 mphr; b, 0.044 mphr; c, 0.075 mphr; d, 0.145
mphr; and e, degraded NR under similar conditions with 0.075 mphr H5IO6. (B) Ratio of
A870/A2962 of ENR degraded at different concentrations of H5IO6.
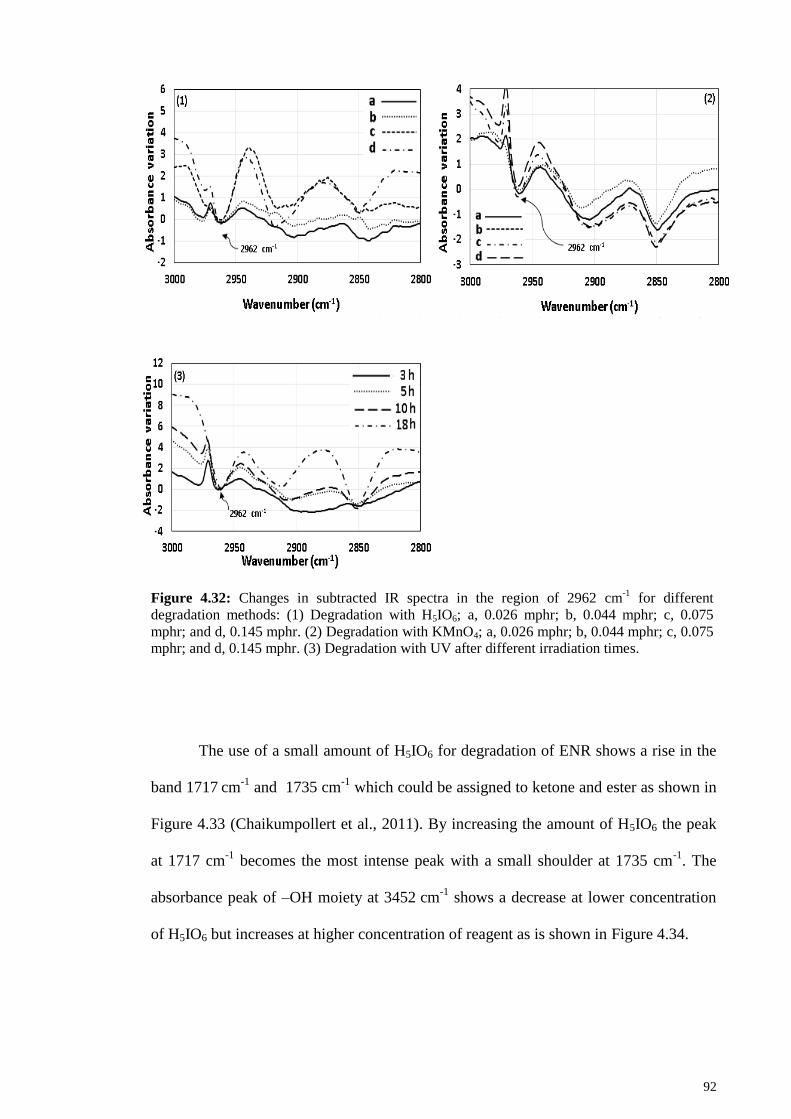
92
Figure 4.32: Changes in subtracted IR spectra in the region of 2962 cm-1
for different
degradation methods: (1) Degradation with H5IO6; a, 0.026 mphr; b, 0.044 mphr; c, 0.075
mphr; and d, 0.145 mphr. (2) Degradation with KMnO4; a, 0.026 mphr; b, 0.044 mphr; c, 0.075 mphr; and d, 0.145 mphr. (3) Degradation with UV after different irradiation times.
The use of a small amount of H5IO6 for degradation of ENR shows a rise in the
band 1717 cm-1
and 1735 cm-1
which could be assigned to ketone and ester as shown in
Figure 4.33 (Chaikumpollert et al., 2011). By increasing the amount of H5IO6 the peak
at 1717 cm-1
becomes the most intense peak with a small shoulder at 1735 cm-1
. The
absorbance peak of –OH moiety at 3452 cm-1
shows a decrease at lower concentration
of H5IO6 but increases at higher concentration of reagent as is shown in Figure 4.34.
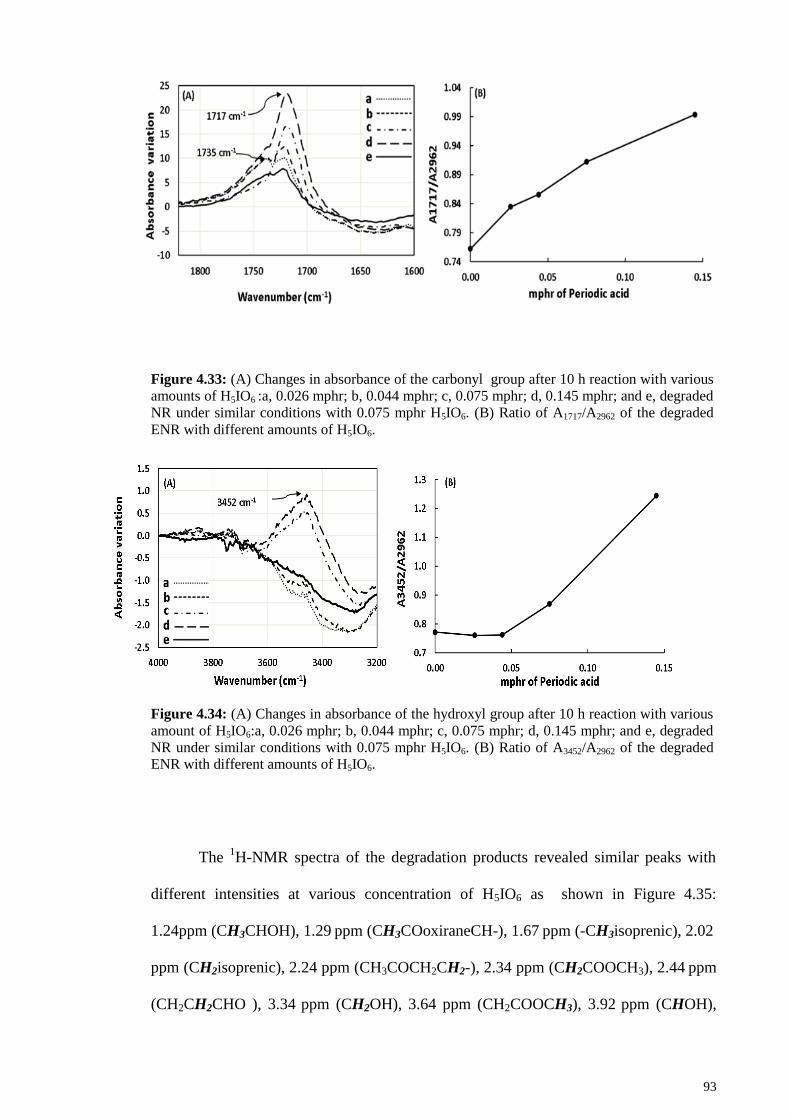
93
Figure 4.33: (A) Changes in absorbance of the carbonyl group after 10 h reaction with various
amounts of H5IO6 :a, 0.026 mphr; b, 0.044 mphr; c, 0.075 mphr; d, 0.145 mphr; and e, degraded
NR under similar conditions with 0.075 mphr H5IO6. (B) Ratio of A1717/A2962 of the degraded
ENR with different amounts of H5IO6.
Figure 4.34: (A) Changes in absorbance of the hydroxyl group after 10 h reaction with various
amount of H5IO6:a, 0.026 mphr; b, 0.044 mphr; c, 0.075 mphr; d, 0.145 mphr; and e, degraded
NR under similar conditions with 0.075 mphr H5IO6. (B) Ratio of A3452/A2962 of the degraded ENR with different amounts of H5IO6.
The 1H-NMR spectra of the degradation products revealed similar peaks with
different intensities at various concentration of H5IO6 as shown in Figure 4.35:
1.24ppm (CH3CHOH), 1.29 ppm (CH3COoxiraneCH-), 1.67 ppm (-CH3isoprenic), 2.02
ppm (CH2isoprenic), 2.24 ppm (CH3COCH2CH2-), 2.34 ppm (CH2COOCH3), 2.44 ppm
(CH2CH2CHO ), 3.34 ppm (CH2OH), 3.64 ppm (CH2COOCH3), 3.92 ppm (CHOH),
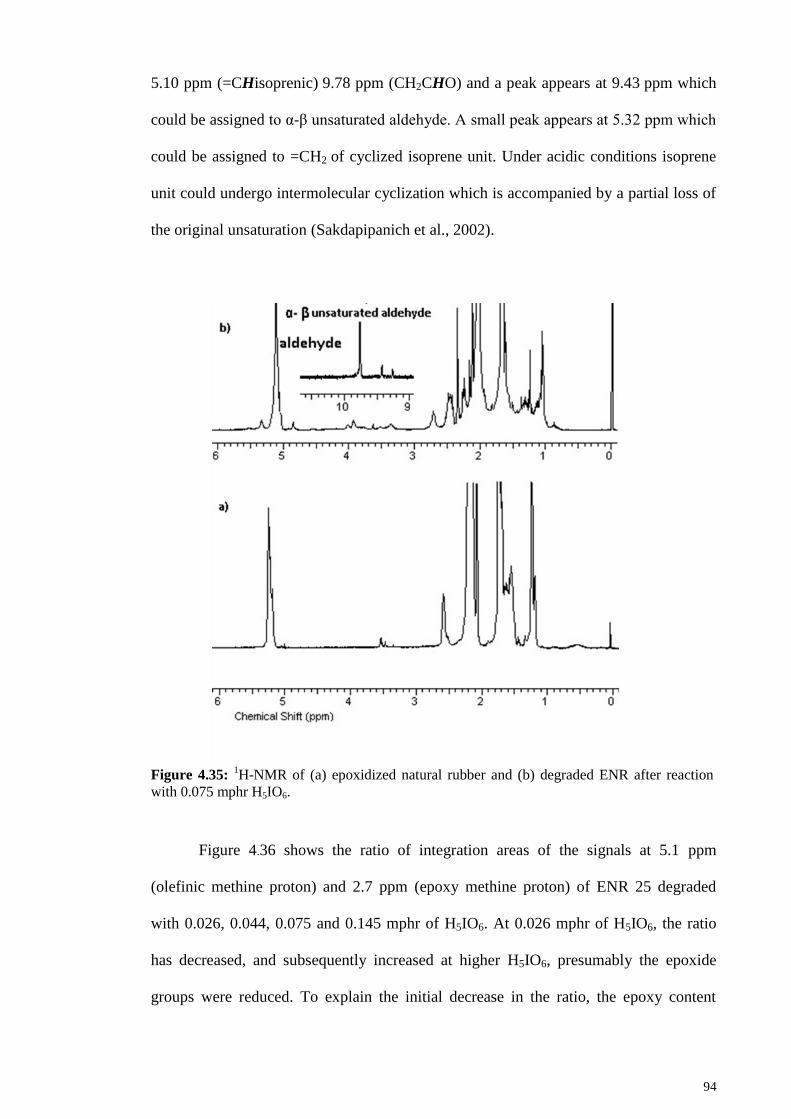
94
5.10 ppm (=CHisoprenic) 9.78 ppm (CH2CHO) and a peak appears at 9.43 ppm which
could be assigned to α-β unsaturated aldehyde. A small peak appears at 5.32 ppm which
could be assigned to =CH2 of cyclized isoprene unit. Under acidic conditions isoprene
unit could undergo intermolecular cyclization which is accompanied by a partial loss of
the original unsaturation (Sakdapipanich et al., 2002).
Figure 4.35: 1H-NMR of (a) epoxidized natural rubber and (b) degraded ENR after reaction
with 0.075 mphr H5IO6.
Figure 4.36 shows the ratio of integration areas of the signals at 5.1 ppm
(olefinic methine proton) and 2.7 ppm (epoxy methine proton) of ENR 25 degraded
with 0.026, 0.044, 0.075 and 0.145 mphr of H5IO6. At 0.026 mphr of H5IO6, the ratio
has decreased, and subsequently increased at higher H5IO6, presumably the epoxide
groups were reduced. To explain the initial decrease in the ratio, the epoxy content
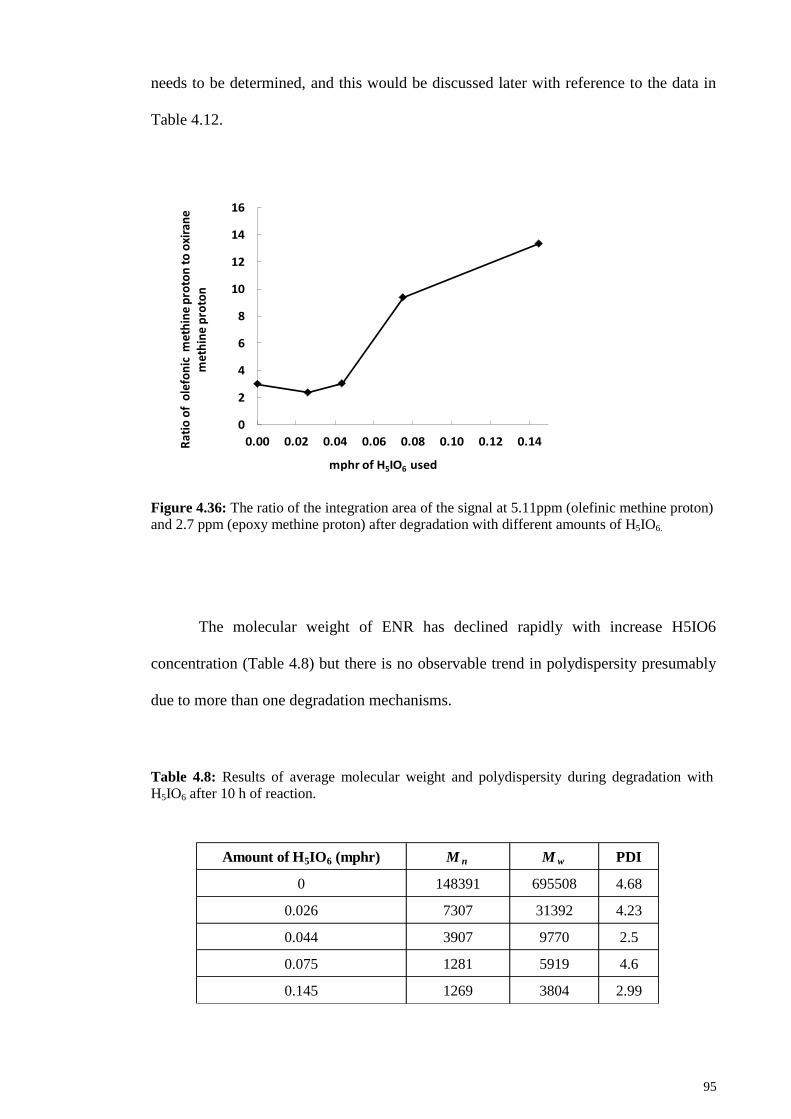
95
needs to be determined, and this would be discussed later with reference to the data in
Table 4.12.
Figure 4.36: The ratio of the integration area of the signal at 5.11ppm (olefinic methine proton) and 2.7 ppm (epoxy methine proton) after degradation with different amounts of H5IO6.
The molecular weight of ENR has declined rapidly with increase H5IO6
concentration (Table 4.8) but there is no observable trend in polydispersity presumably
due to more than one degradation mechanisms.
Table 4.8: Results of average molecular weight and polydispersity during degradation with H5IO6 after 10 h of reaction.
Amount of H5IO6 (mphr) M n M w PDI
0 148391 695508 4.68
0.026 7307 31392 4.23
0.044 3907 9770 2.5
0.075 1281 5919 4.6
0.145 1269 3804 2.99
0
2
4
6
8
10
12
14
16
0.00 0.02 0.04 0.06 0.08 0.10 0.12 0.14Rat
io o
f o
lefo
nic
met
hin
e p
roto
n t
o o
xira
ne
m
eth
ine
pro
ton
mphr of H5IO6 used
96
Degradation using potassium permanganate 4.2.3
Degradation of ENR by potassium permanganate has not been reported before.
Oxidative cleavage of double bond with KMnO4 is a very complicating reaction. The
reaction of unsaturated hydrocarbons with KMnO4 at room temperature under alkaline
conditions yields cis diols (Wiberg & Saegebarth, 1957). KMnO4 is a strong oxidizing
agent which could oxidize the product further. Under acidic conditions, the cleavage of
double bond occurs without formation of diol. The first step of reaction is followed by
generation of cyclic manganate esters which undergo cyclic fragmentation (Dash et al.,
2009). Manganese dioxide is produced during the reaction and the reaction mixture
turns dark brown. The manganese dioxide is insoluble in THF and could be removed by
filtration. Figure 4.37 shows the subtracted IR spectra of degradation products. The
band at 835 cm-1
(=CH wagging) which indicate consumption of the double bond
decreases with increasing the concentration of KMnO4. A decline of band 870 cm-1
,
attributed to oxirane group, is also observed. The ratio of A835/A2962 is shown in Figure
4.37 (B). The subtracted IR of degraded NR which is shown in (e) in Figure 4.37 (A)
reveals an intense decrease at the band 835 cm-1
(=CH wagging). Figure 4.38 shows
band at 1717 cm-1
increases with the concentration of KMnO4. The peak at 1735 cm-1
appears when KMnO4 concentration is at 0.044 mphr and higher. This is assigned to the
ester groups. This peak is not seen in NR.
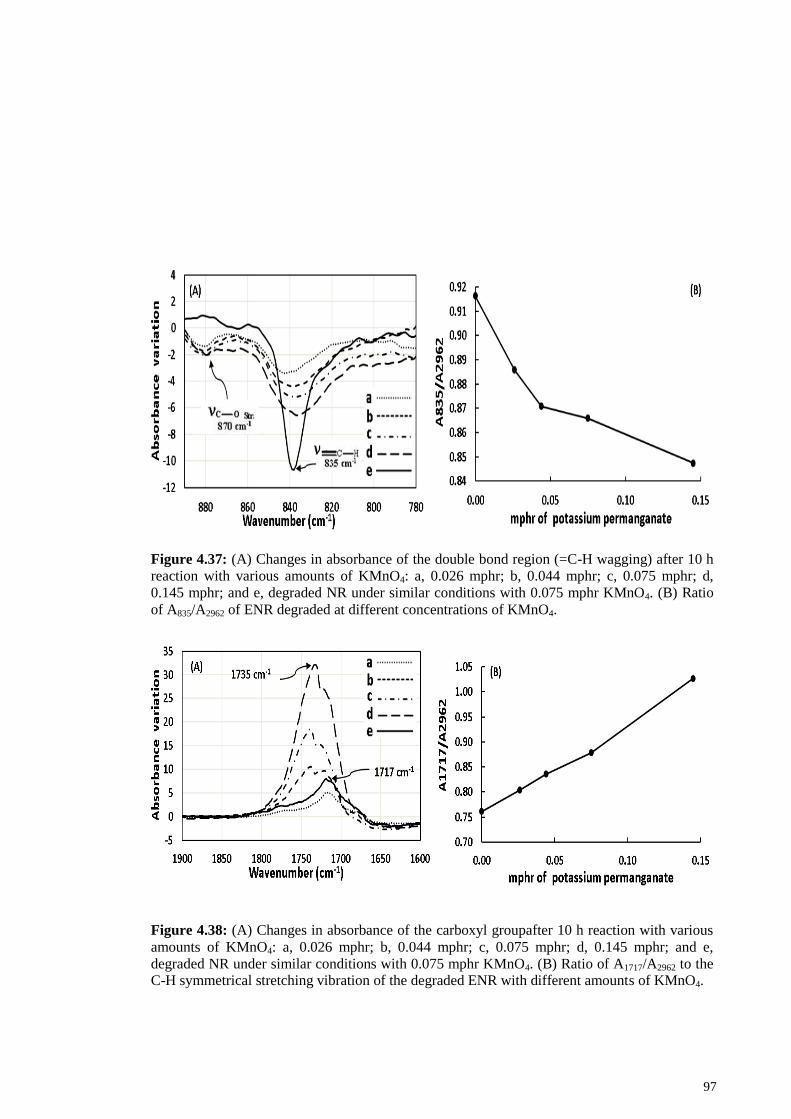
97
Figure 4.37: (A) Changes in absorbance of the double bond region (=C-H wagging) after 10 h
reaction with various amounts of KMnO4: a, 0.026 mphr; b, 0.044 mphr; c, 0.075 mphr; d,
0.145 mphr; and e, degraded NR under similar conditions with 0.075 mphr KMnO4. (B) Ratio
of A835/A2962 of ENR degraded at different concentrations of KMnO4.
Figure 4.38: (A) Changes in absorbance of the carboxyl groupafter 10 h reaction with various
amounts of KMnO4: a, 0.026 mphr; b, 0.044 mphr; c, 0.075 mphr; d, 0.145 mphr; and e,
degraded NR under similar conditions with 0.075 mphr KMnO4. (B) Ratio of A1717/A2962 to the C-H symmetrical stretching vibration of the degraded ENR with different amounts of KMnO4.
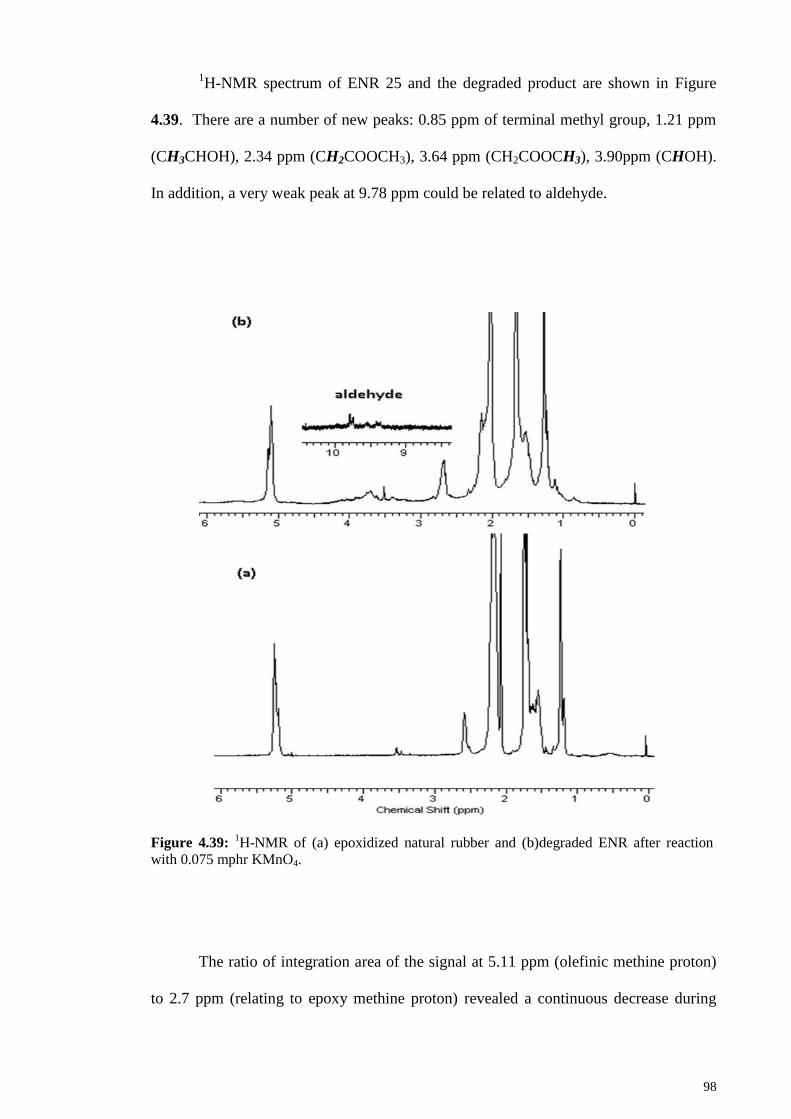
98
1H-NMR spectrum of ENR 25 and the degraded product are shown in Figure
4.39. There are a number of new peaks: 0.85 ppm of terminal methyl group, 1.21 ppm
(CH3CHOH), 2.34 ppm (CH2COOCH3), 3.64 ppm (CH2COOCH3), 3.90ppm (CHOH).
In addition, a very weak peak at 9.78 ppm could be related to aldehyde.
Figure 4.39: 1H-NMR of (a) epoxidized natural rubber and (b)degraded ENR after reaction
with 0.075 mphr KMnO4.
The ratio of integration area of the signal at 5.11 ppm (olefinic methine proton)
to 2.7 ppm (relating to epoxy methine proton) revealed a continuous decrease during
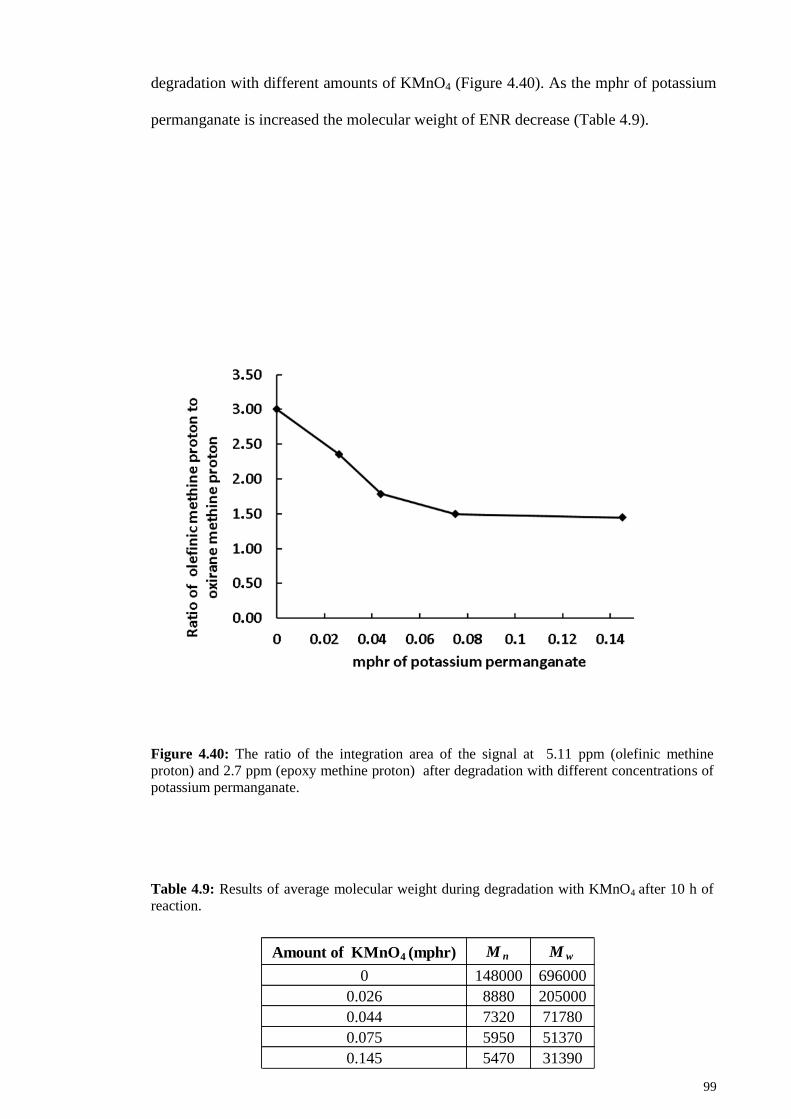
99
degradation with different amounts of KMnO4 (Figure 4.40). As the mphr of potassium
permanganate is increased the molecular weight of ENR decrease (Table 4.9).
Figure 4.40: The ratio of the integration area of the signal at 5.11 ppm (olefinic methine
proton) and 2.7 ppm (epoxy methine proton) after degradation with different concentrations of
potassium permanganate.
Table 4.9: Results of average molecular weight during degradation with KMnO4 after 10 h of
reaction.
Amount of KMnO4 (mphr) M n M w
0 148000 696000
0.026 8880 205000
0.044 7320 71780
0.075 5950 51370
0.145 5470 31390
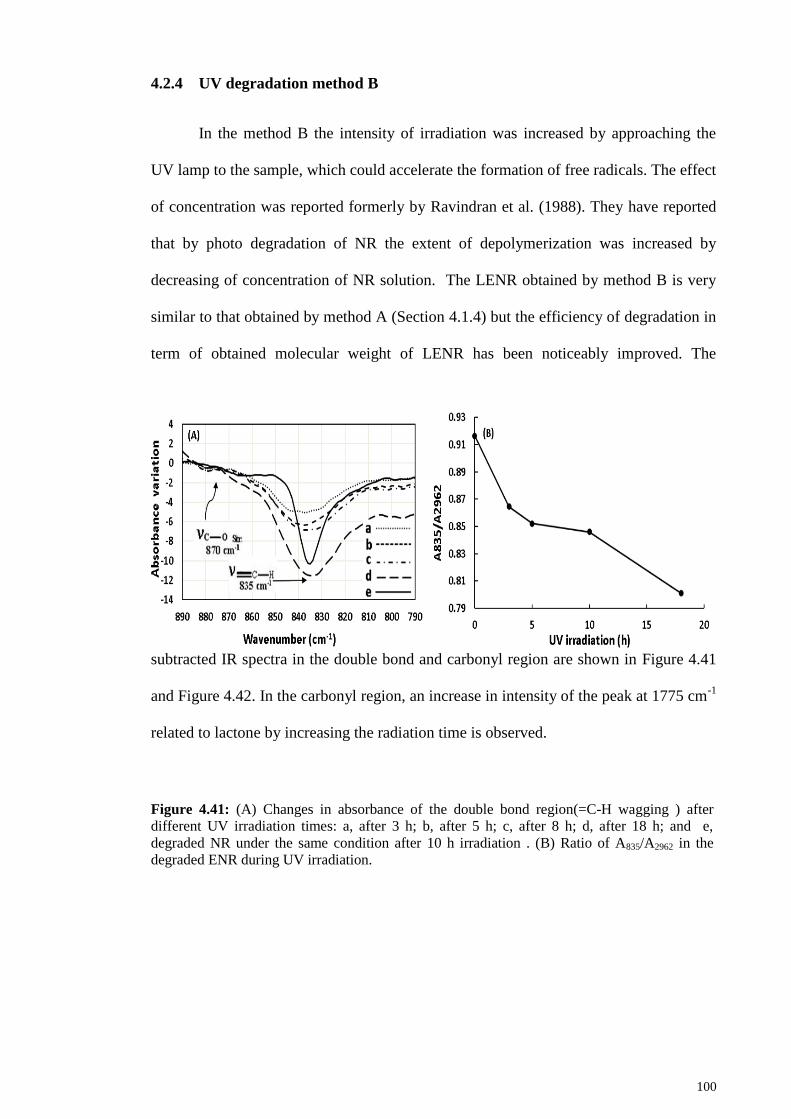
100
UV degradation method B 4.2.4
In the method B the intensity of irradiation was increased by approaching the
UV lamp to the sample, which could accelerate the formation of free radicals. The effect
of concentration was reported formerly by Ravindran et al. (1988). They have reported
that by photo degradation of NR the extent of depolymerization was increased by
decreasing of concentration of NR solution. The LENR obtained by method B is very
similar to that obtained by method A (Section 4.1.4) but the efficiency of degradation in
term of obtained molecular weight of LENR has been noticeably improved. The
subtracted IR spectra in the double bond and carbonyl region are shown in Figure 4.41
and Figure 4.42. In the carbonyl region, an increase in intensity of the peak at 1775 cm-1
related to lactone by increasing the radiation time is observed.
Figure 4.41: (A) Changes in absorbance of the double bond region(=C-H wagging ) after
different UV irradiation times: a, after 3 h; b, after 5 h; c, after 8 h; d, after 18 h; and e,
degraded NR under the same condition after 10 h irradiation . (B) Ratio of A835/A2962 in the
degraded ENR during UV irradiation.
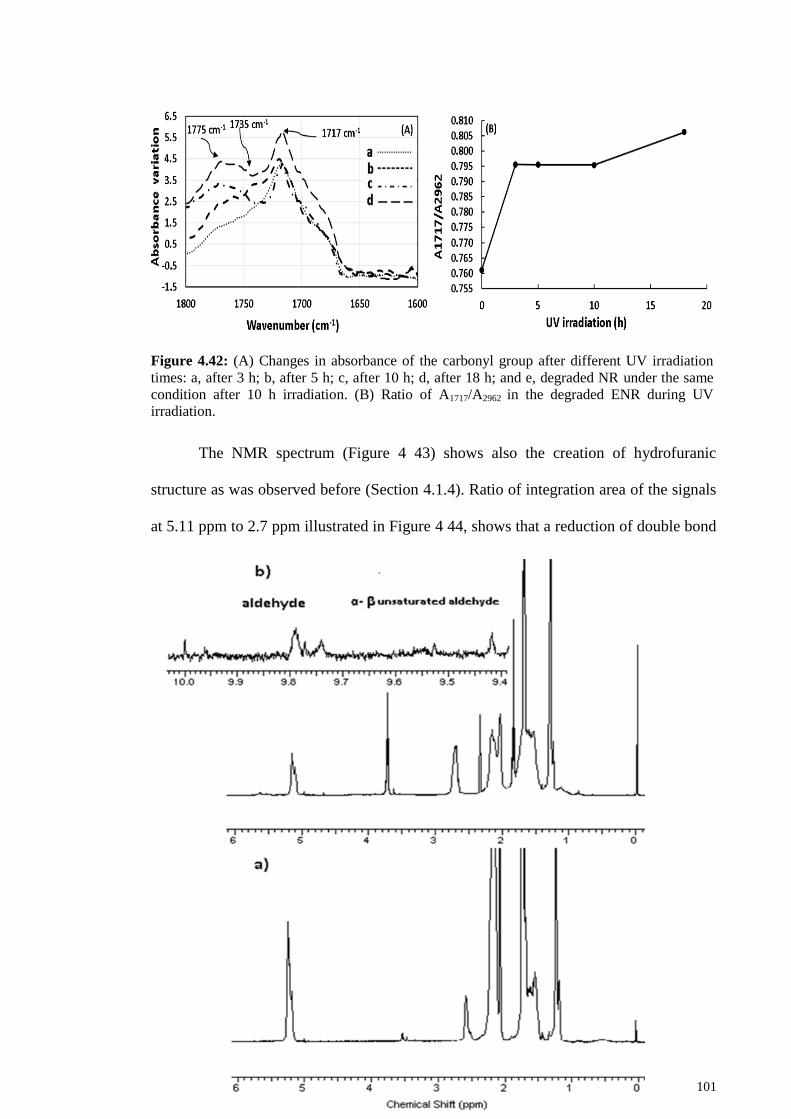
101
Figure 4.42: (A) Changes in absorbance of the carbonyl group after different UV irradiation
times: a, after 3 h; b, after 5 h; c, after 10 h; d, after 18 h; and e, degraded NR under the same
condition after 10 h irradiation. (B) Ratio of A1717/A2962 in the degraded ENR during UV
irradiation.
The NMR spectrum (Figure 4 43) shows also the creation of hydrofuranic
structure as was observed before (Section 4.1.4). Ratio of integration area of the signals
at 5.11 ppm to 2.7 ppm illustrated in Figure 4 44, shows that a reduction of double bond
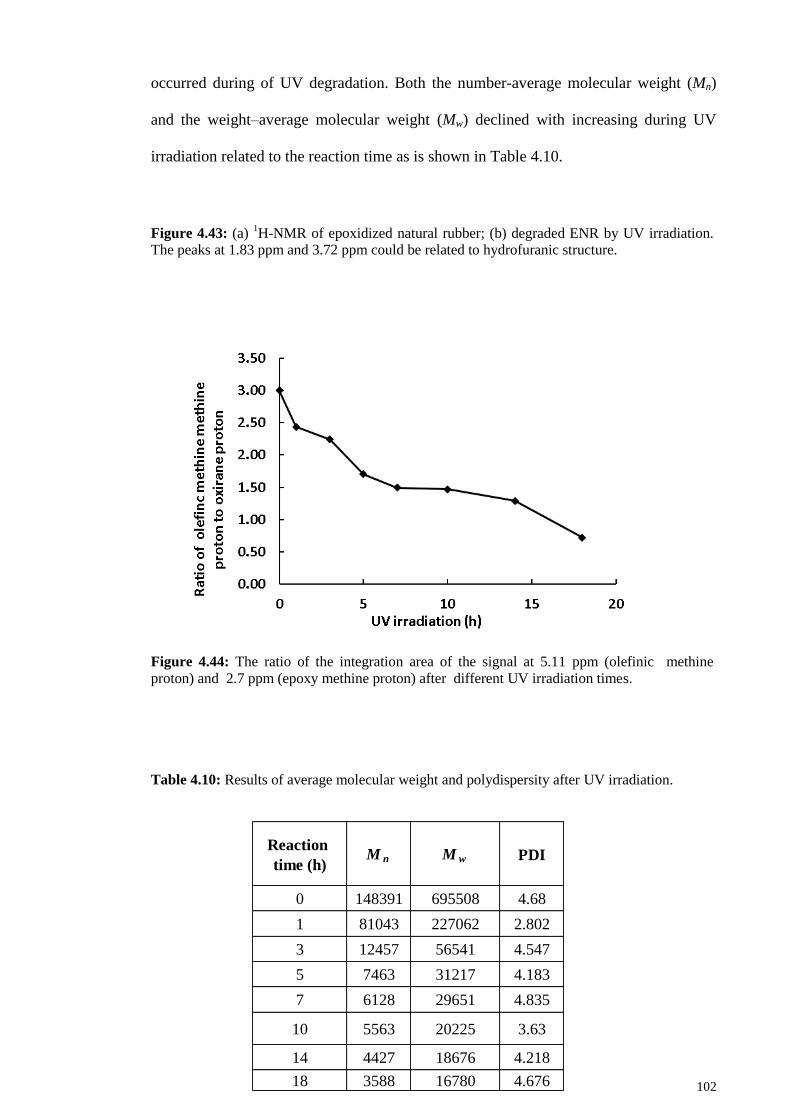
102
occurred during of UV degradation. Both the number-average molecular weight (Mn)
and the weight–average molecular weight (Mw) declined with increasing during UV
irradiation related to the reaction time as is shown in Table 4.10.
Figure 4.43: (a) 1H-NMR of epoxidized natural rubber; (b) degraded ENR by UV irradiation.
The peaks at 1.83 ppm and 3.72 ppm could be related to hydrofuranic structure.
Figure 4.44: The ratio of the integration area of the signal at 5.11 ppm (olefinic methine
proton) and 2.7 ppm (epoxy methine proton) after different UV irradiation times.
Table 4.10: Results of average molecular weight and polydispersity after UV irradiation.
Reaction
time (h)M n M w PDI
0 148391 695508 4.68
1 81043 227062 2.802
3 12457 56541 4.547
5 7463 31217 4.183
7 6128 29651 4.835
10 5563 20225 3.63
14 4427 18676 4.218
18 3588 16780 4.676
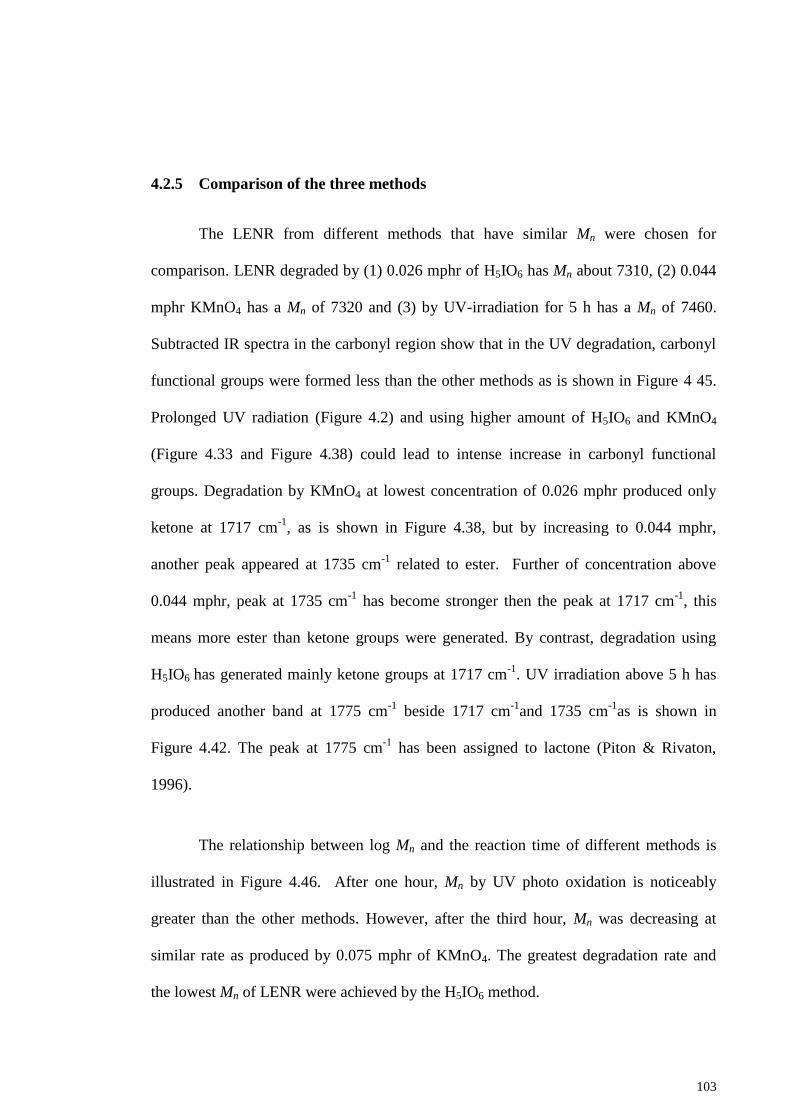
103
Comparison of the three methods 4.2.5
The LENR from different methods that have similar Mn were chosen for
comparison. LENR degraded by (1) 0.026 mphr of H5IO6 has Mn about 7310, (2) 0.044
mphr KMnO4 has a Mn of 7320 and (3) by UV-irradiation for 5 h has a Mn of 7460.
Subtracted IR spectra in the carbonyl region show that in the UV degradation, carbonyl
functional groups were formed less than the other methods as is shown in Figure 4 45.
Prolonged UV radiation (Figure 4.2) and using higher amount of H5IO6 and KMnO4
(Figure 4.33 and Figure 4.38) could lead to intense increase in carbonyl functional
groups. Degradation by KMnO4 at lowest concentration of 0.026 mphr produced only
ketone at 1717 cm-1
, as is shown in Figure 4.38, but by increasing to 0.044 mphr,
another peak appeared at 1735 cm-1
related to ester. Further of concentration above
0.044 mphr, peak at 1735 cm-1
has become stronger then the peak at 1717 cm-1
, this
means more ester than ketone groups were generated. By contrast, degradation using
H5IO6 has generated mainly ketone groups at 1717 cm
-1. UV irradiation above 5 h has
produced another band at 1775 cm-1
beside 1717 cm-1
and 1735 cm-1
as is shown in
Figure 4.42. The peak at 1775 cm-1
has been assigned to lactone (Piton & Rivaton,
1996).
The relationship between log Mn and the reaction time of different methods is
illustrated in Figure 4.46. After one hour, Mn by UV photo oxidation is noticeably
greater than the other methods. However, after the third hour, Mn was decreasing at
similar rate as produced by 0.075 mphr of KMnO4. The greatest degradation rate and
the lowest Mn of LENR were achieved by the H5IO6 method.
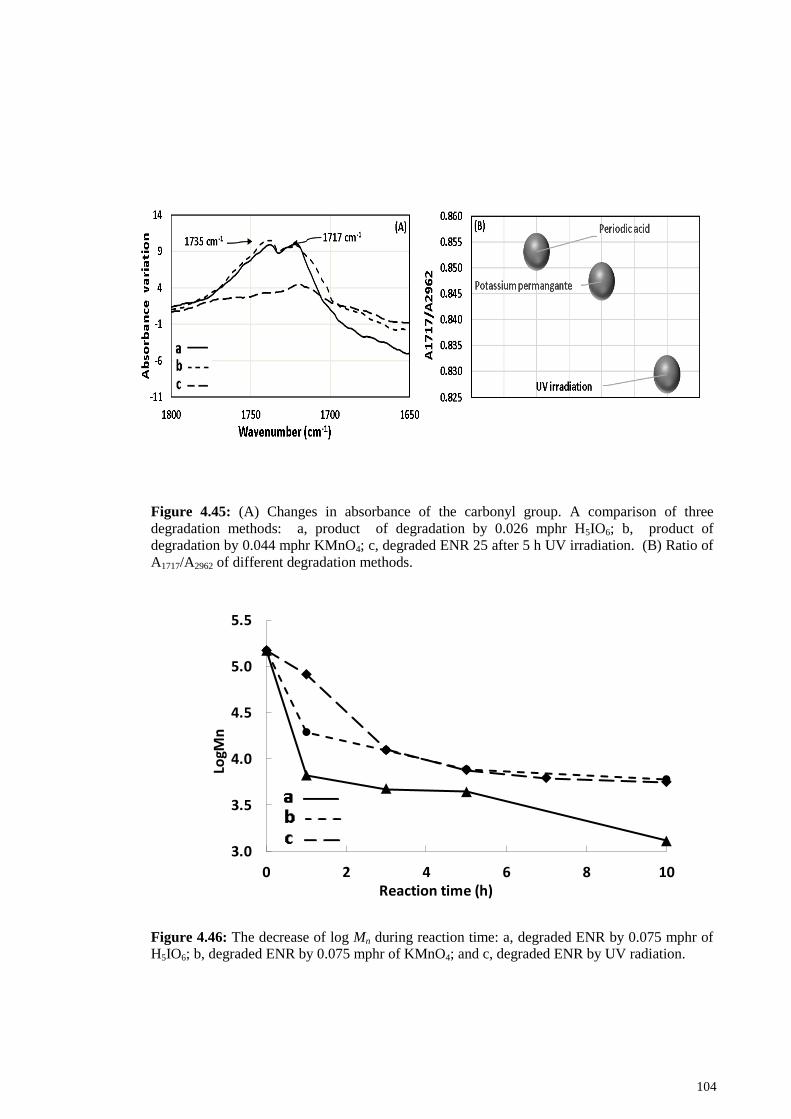
104
Figure 4.45: (A) Changes in absorbance of the carbonyl group. A comparison of three
degradation methods: a, product of degradation by 0.026 mphr H5IO6; b, product of
degradation by 0.044 mphr KMnO4; c, degraded ENR 25 after 5 h UV irradiation. (B) Ratio of
A1717/A2962 of different degradation methods.
Figure 4.46: The decrease of log Mn during reaction time: a, degraded ENR by 0.075 mphr of H5IO6; b, degraded ENR by 0.075 mphr of KMnO4; and c, degraded ENR by UV radiation.
3.0
3.5
4.0
4.5
5.0
5.5
0 2 4 6 8 10
LogM
n
Reaction time (h)
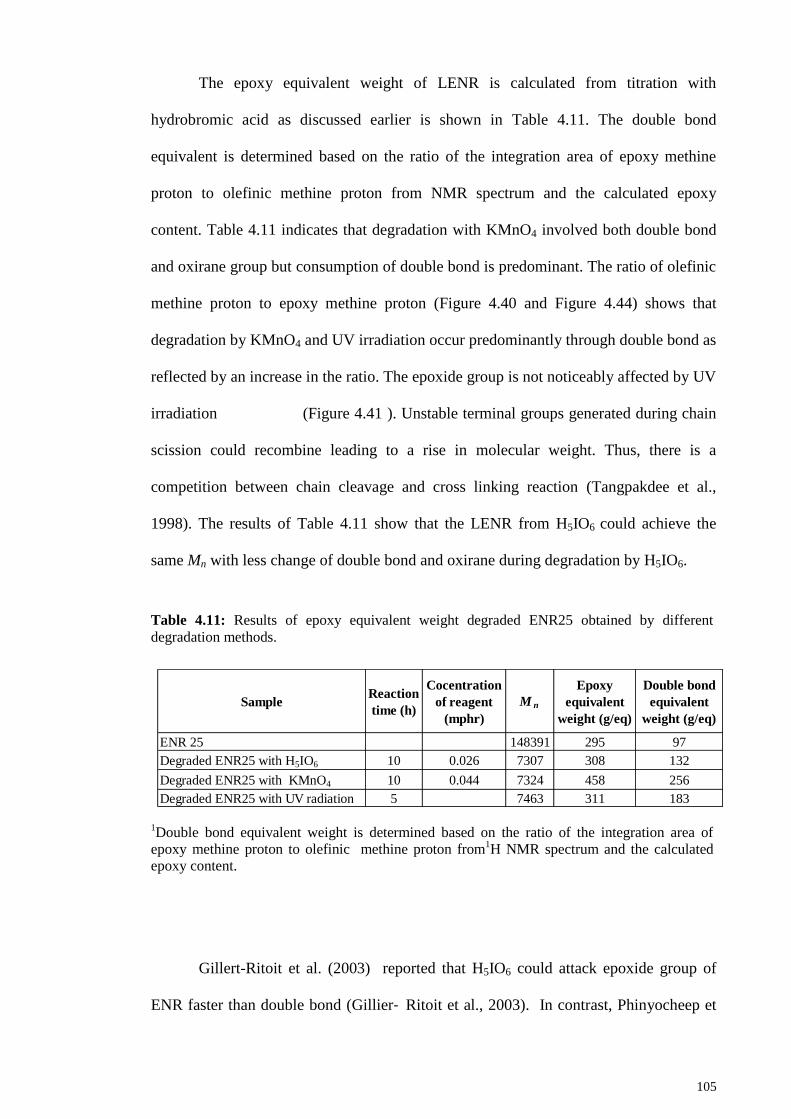
105
The epoxy equivalent weight of LENR is calculated from titration with
hydrobromic acid as discussed earlier is shown in Table 4.11. The double bond
equivalent is determined based on the ratio of the integration area of epoxy methine
proton to olefinic methine proton from NMR spectrum and the calculated epoxy
content. Table 4.11 indicates that degradation with KMnO4 involved both double bond
and oxirane group but consumption of double bond is predominant. The ratio of olefinic
methine proton to epoxy methine proton (Figure 4.40 and Figure 4.44) shows that
degradation by KMnO4 and UV irradiation occur predominantly through double bond as
reflected by an increase in the ratio. The epoxide group is not noticeably affected by UV
irradiation (Figure 4.41 ). Unstable terminal groups generated during chain
scission could recombine leading to a rise in molecular weight. Thus, there is a
competition between chain cleavage and cross linking reaction (Tangpakdee et al.,
1998). The results of Table 4.11 show that the LENR from H5IO6 could achieve the
same Mn with less change of double bond and oxirane during degradation by H5IO6.
Table 4.11: Results of epoxy equivalent weight degraded ENR25 obtained by different
degradation methods.
1Double bond equivalent weight is determined based on the ratio of the integration area of
epoxy methine proton to olefinic methine proton from1H NMR spectrum and the calculated
epoxy content.
Gillert-Ritoit et al. (2003) reported that H5IO6 could attack epoxide group of
ENR faster than double bond (Gillier‐ Ritoit et al., 2003). In contrast, Phinyocheep et
SampleReaction
time (h)
Cocentration
of reagent
(mphr)
M n
Epoxy
equivalent
weight (g/eq)
Double bond
equivalent
weight (g/eq)
ENR 25 148391 295 97
Degraded ENR25 with H5IO6 10 0.026 7307 308 132
Degraded ENR25 with KMnO4 10 0.044 7324 458 256
Degraded ENR25 with UV radiation 5 7463 311 183
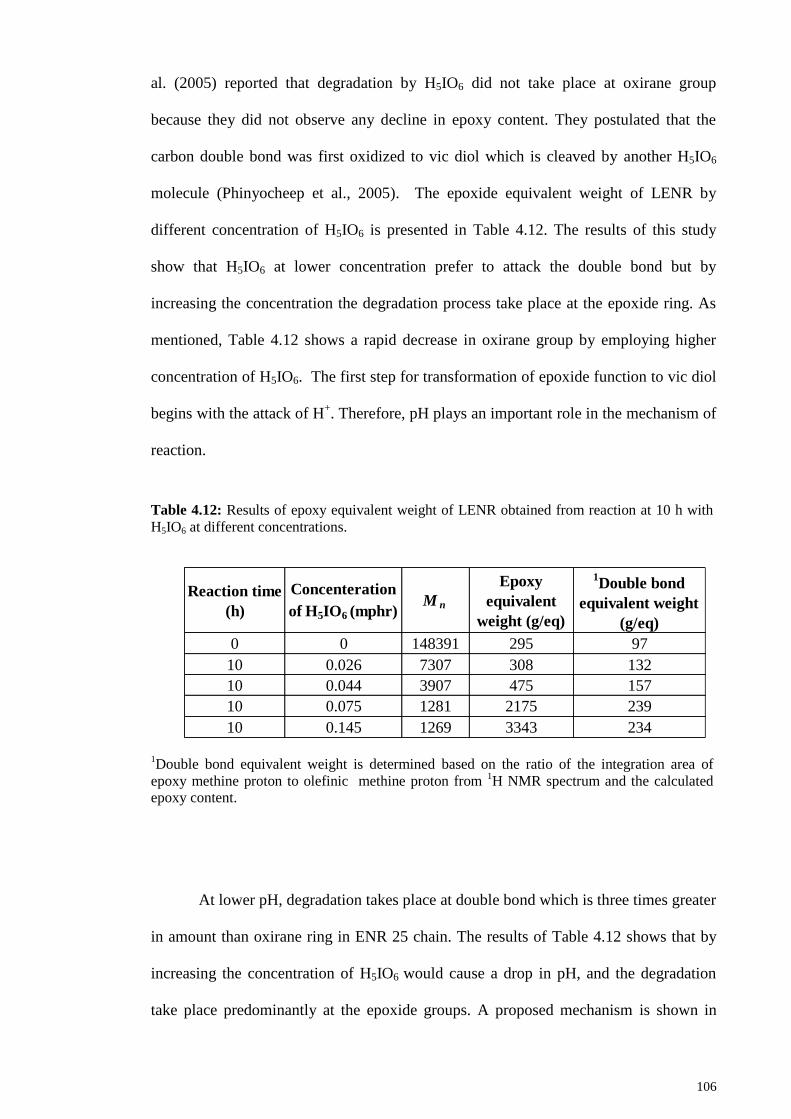
106
al. (2005) reported that degradation by H5IO6 did not take place at oxirane group
because they did not observe any decline in epoxy content. They postulated that the
carbon double bond was first oxidized to vic diol which is cleaved by another H5IO6
molecule (Phinyocheep et al., 2005). The epoxide equivalent weight of LENR by
different concentration of H5IO6 is presented in Table 4.12. The results of this study
show that H5IO6 at lower concentration prefer to attack the double bond but by
increasing the concentration the degradation process take place at the epoxide ring. As
mentioned, Table 4.12 shows a rapid decrease in oxirane group by employing higher
concentration of H5IO6. The first step for transformation of epoxide function to vic diol
begins with the attack of H+. Therefore, pH plays an important role in the mechanism of
reaction.
Table 4.12: Results of epoxy equivalent weight of LENR obtained from reaction at 10 h with
H5IO6 at different concentrations.
1Double bond equivalent weight is determined based on the ratio of the integration area of
epoxy methine proton to olefinic methine proton from 1H NMR spectrum and the calculated
epoxy content.
At lower pH, degradation takes place at double bond which is three times greater
in amount than oxirane ring in ENR 25 chain. The results of Table 4.12 shows that by
increasing the concentration of H5IO6 would cause a drop in pH, and the degradation
take place predominantly at the epoxide groups. A proposed mechanism is shown in
Reaction time
(h)
Concenteration
of H5IO6 (mphr)M n
Epoxy
equivalent
weight (g/eq)
1Double bond
equivalent weight
(g/eq)
0 0 148391 295 97
10 0.026 7307 308 132
10 0.044 3907 475 157
10 0.075 1281 2175 239
10 0.145 1269 3343 234
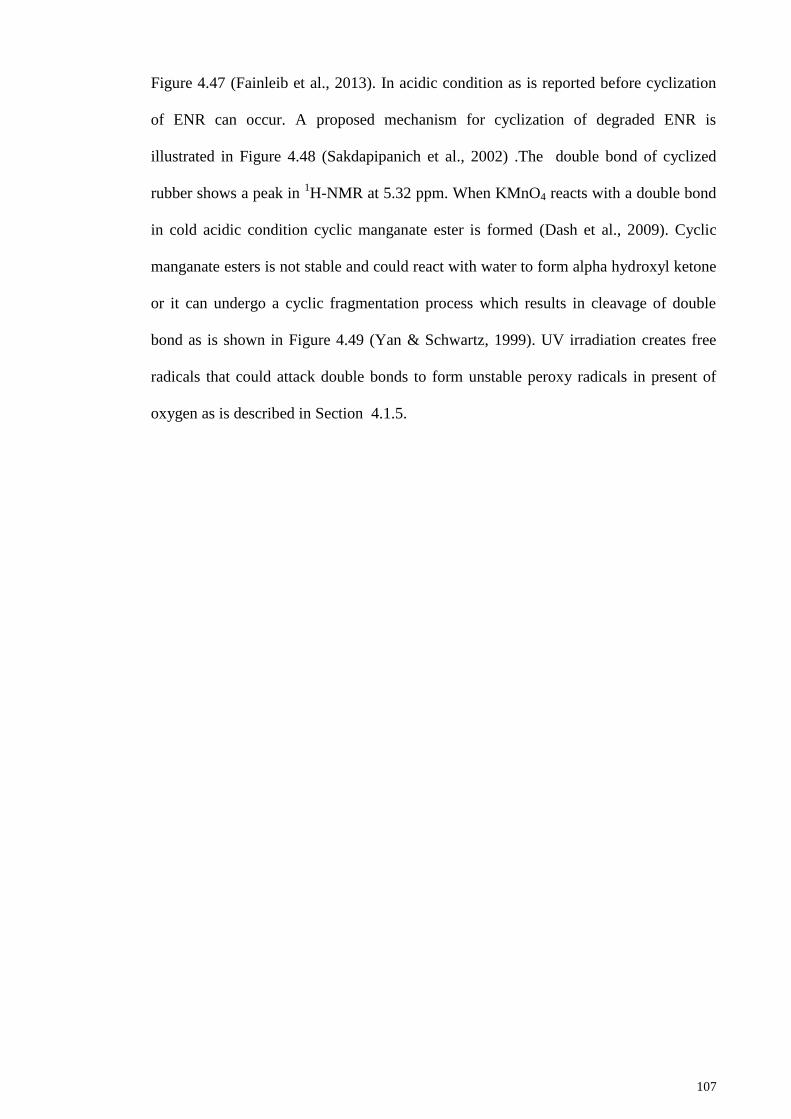
107
Figure 4.47 (Fainleib et al., 2013). In acidic condition as is reported before cyclization
of ENR can occur. A proposed mechanism for cyclization of degraded ENR is
illustrated in Figure 4.48 (Sakdapipanich et al., 2002) .The double bond of cyclized
rubber shows a peak in 1H-NMR at 5.32 ppm. When KMnO4 reacts with a double bond
in cold acidic condition cyclic manganate ester is formed (Dash et al., 2009). Cyclic
manganate esters is not stable and could react with water to form alpha hydroxyl ketone
or it can undergo a cyclic fragmentation process which results in cleavage of double
bond as is shown in Figure 4.49 (Yan & Schwartz, 1999). UV irradiation creates free
radicals that could attack double bonds to form unstable peroxy radicals in present of
oxygen as is described in Section 4.1.5.
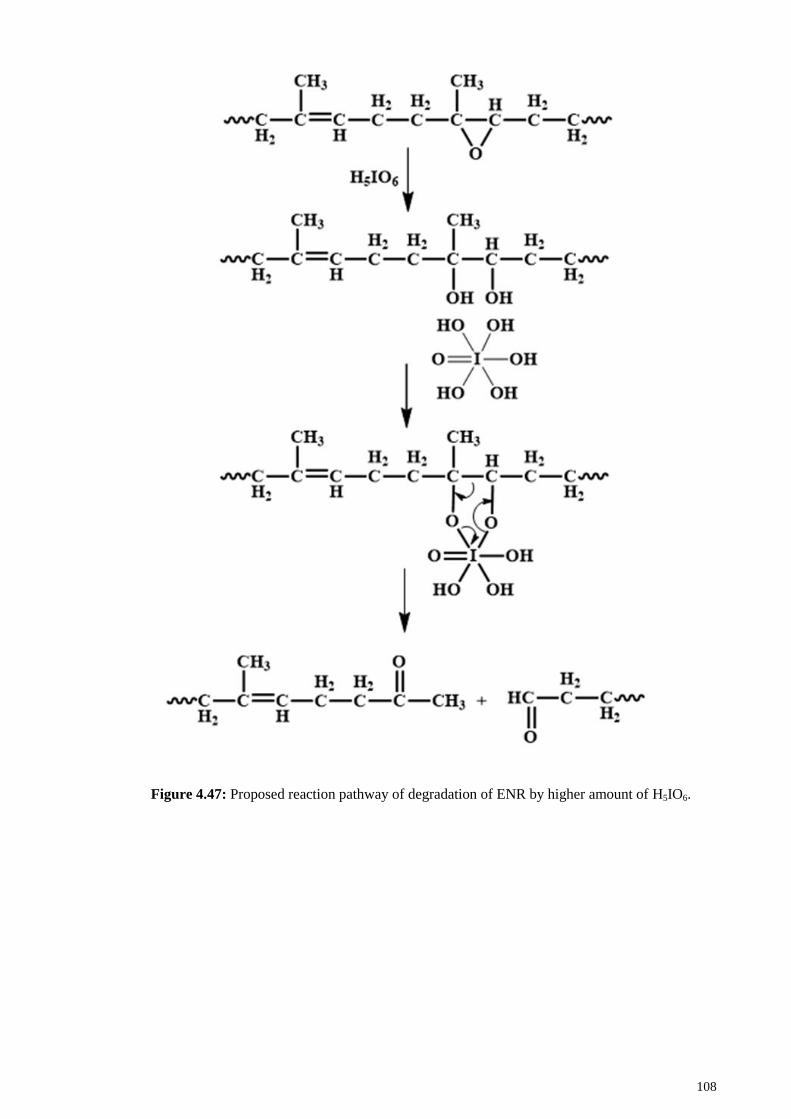
108
Figure 4.47: Proposed reaction pathway of degradation of ENR by higher amount of H5IO6.
109
Figure 4.48: A suggested mechanism for cyclization of ENR in present of H5IO6.
Figure 4.49: Presumed mechanism of degradation reaction of ENR in the presence of KMnO4 .
110
4.3 Preparation of coating based on LENR
LENR is a promising material for usage in coating applications. It has several
properties required in coating industry including good solubility in organic solvents,
good processability, good adhesion and wettability to various surfaces and outstanding
elasticity (Jorge et al., 2010). Due to presence of oxirane group in the backbone of
LENR it could be cured such as epoxy resin with an amine hardener. For this purpose,
LENR suffers from some drawbacks, including low Tg and incompatibility with most of
the hardeners used for curing of epoxy resin at room temperature. One way to overcome
this problem is by grafting methyl methacrylate onto LENR. Graft copolymerization of
NR and ENR has been done under different medium such as solution, latex and
monomer media. Graft copolymerization on rubber is initiated by attack of free radical
to the α methylene hydrogen atom (Arayapranee et al., 2002) . There are various
methods to generate free radicals such as thermal decomposition of peroxides,
persulfate dissociation, photo initiation or electron beam radiation. The graft
copolymerization with electron beam does not need any photo initiator, because the
bombardment of high energy electrons produce enough free radicals to push up graft
polymerization. In this work, UV radiation is used to generate the free radicals. To
accelerate the radical formation through UV radiation photo initiator is used to speed up
free radical formation. The proposed mechanism is shown below in which MA, LENR
and In indicate methyl methacrylate, liquid epoxidized natural rubber and initiator
respectively:
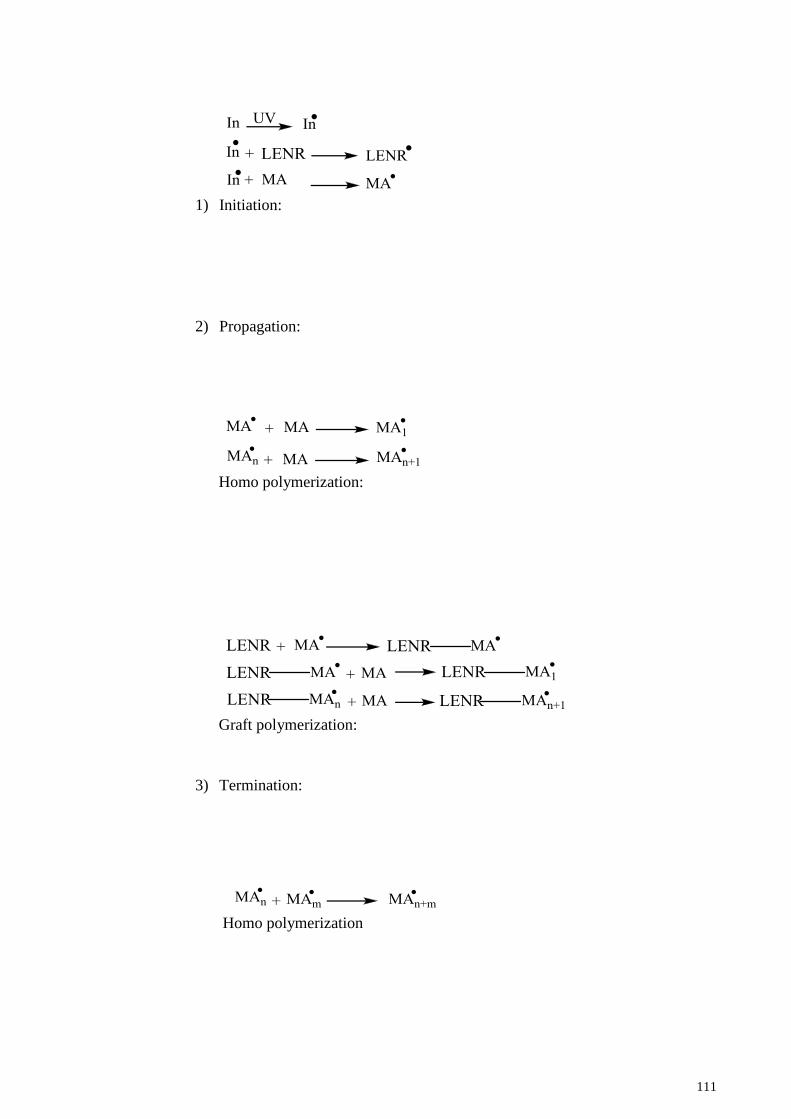
111
1) Initiation:
2) Propagation:
Homo polymerization:
Graft polymerization:
3) Termination:
Homo polymerization
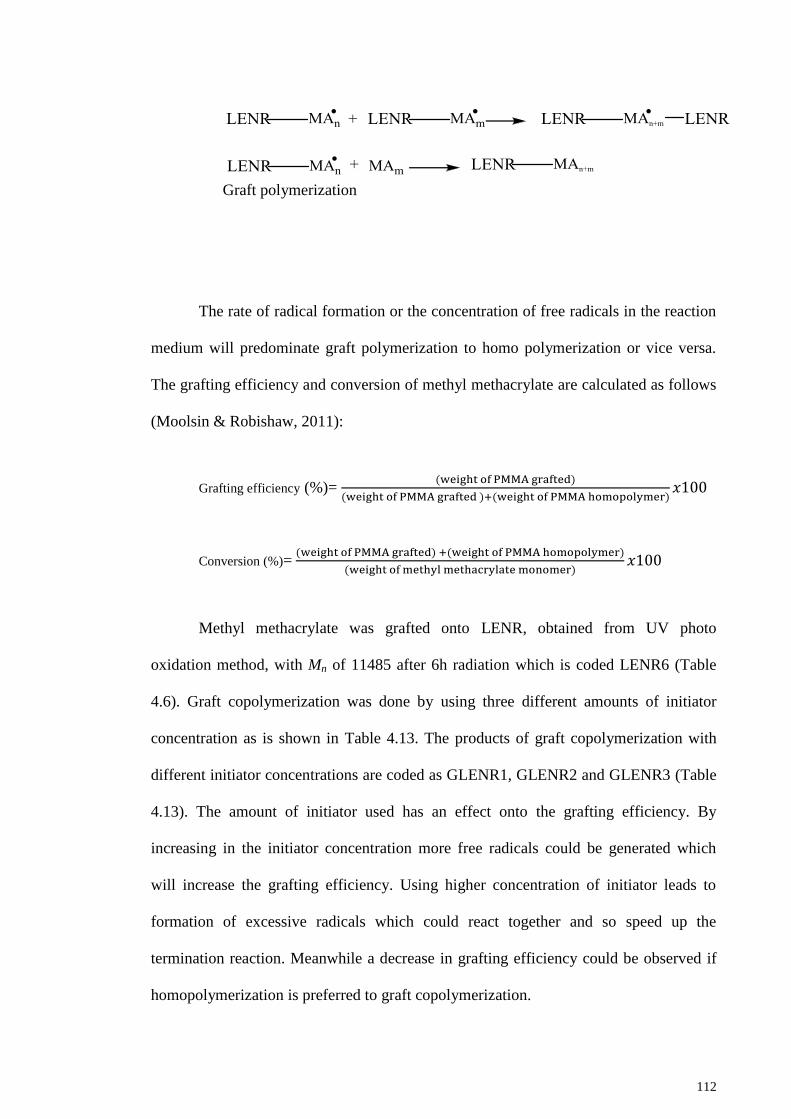
112
Graft polymerization
The rate of radical formation or the concentration of free radicals in the reaction
medium will predominate graft polymerization to homo polymerization or vice versa.
The grafting efficiency and conversion of methyl methacrylate are calculated as follows
(Moolsin & Robishaw, 2011):
Grafting efficiency (%)=
Conversion (%)=
Methyl methacrylate was grafted onto LENR, obtained from UV photo
oxidation method, with Mn of 11485 after 6h radiation which is coded LENR6 (Table
4.6). Graft copolymerization was done by using three different amounts of initiator
concentration as is shown in Table 4.13. The products of graft copolymerization with
different initiator concentrations are coded as GLENR1, GLENR2 and GLENR3 (Table
4.13). The amount of initiator used has an effect onto the grafting efficiency. By
increasing in the initiator concentration more free radicals could be generated which
will increase the grafting efficiency. Using higher concentration of initiator leads to
formation of excessive radicals which could react together and so speed up the
termination reaction. Meanwhile a decrease in grafting efficiency could be observed if
homopolymerization is preferred to graft copolymerization.
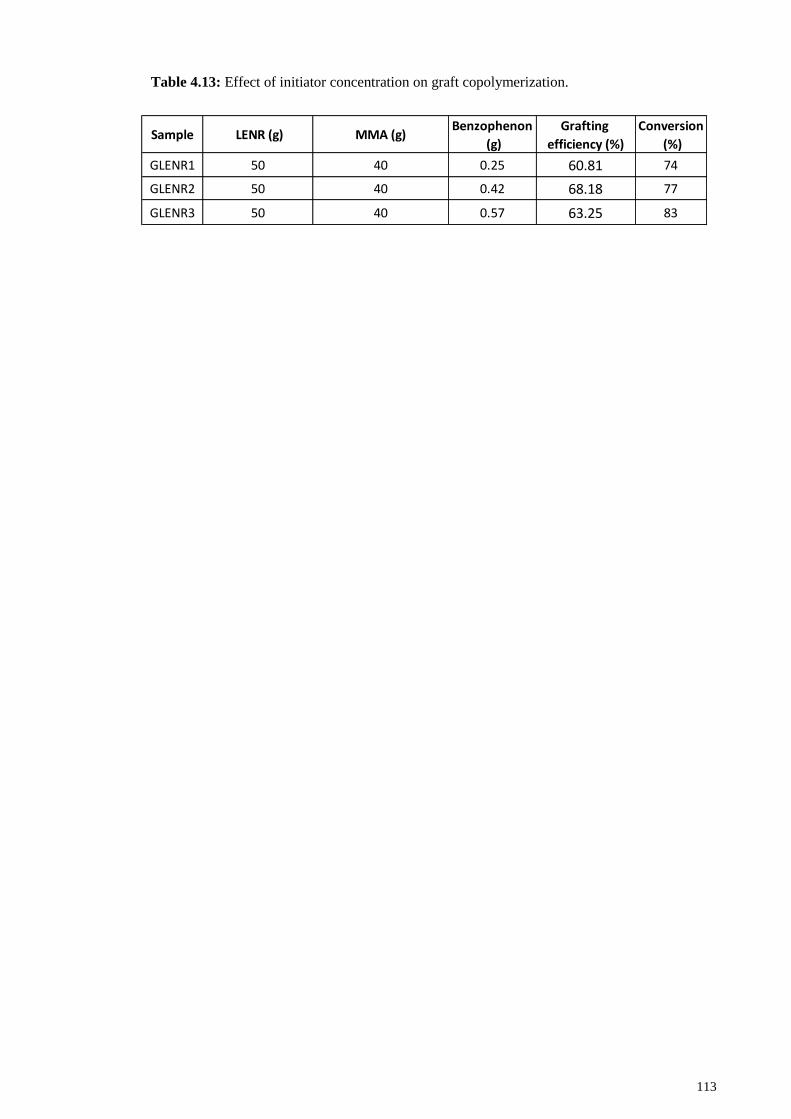
113
Table 4.13: Effect of initiator concentration on graft copolymerization.
Sample LENR (g) MMA (g)Benzophenon
(g)
Grafting
efficiency (%)
Conversion
(%)
GLENR1 50 40 0.25 60.81 74
GLENR2 50 40 0.42 68.18 77
GLENR3 50 40 0.57 63.25 83
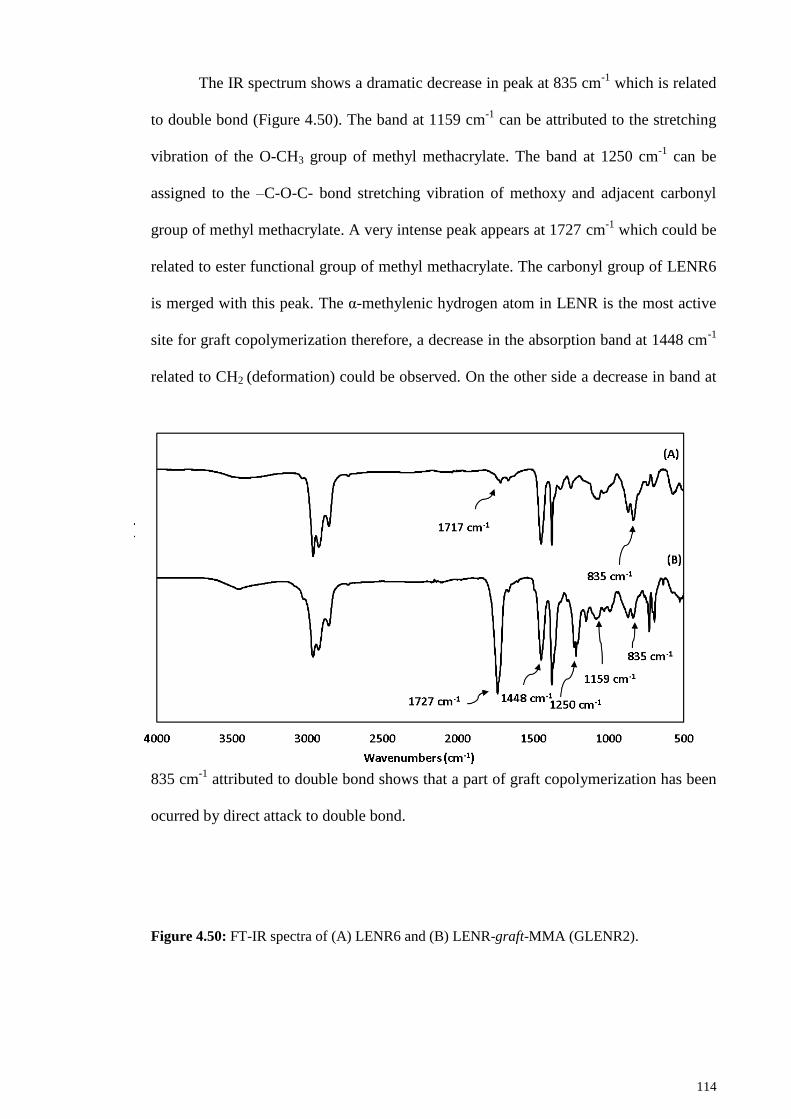
114
The IR spectrum shows a dramatic decrease in peak at 835 cm-1
which is related
to double bond (Figure 4.50). The band at 1159 cm-1
can be attributed to the stretching
vibration of the O-CH3 group of methyl methacrylate. The band at 1250 cm-1
can be
assigned to the –C-O-C- bond stretching vibration of methoxy and adjacent carbonyl
group of methyl methacrylate. A very intense peak appears at 1727 cm-1
which could be
related to ester functional group of methyl methacrylate. The carbonyl group of LENR6
is merged with this peak. The α-methylenic hydrogen atom in LENR is the most active
site for graft copolymerization therefore, a decrease in the absorption band at 1448 cm-1
related to CH2 (deformation) could be observed. On the other side a decrease in band at
835 cm-1
attributed to double bond shows that a part of graft copolymerization has been
ocurred by direct attack to double bond.
Figure 4.50: FT-IR spectra of (A) LENR6 and (B) LENR-graft-MMA (GLENR2).
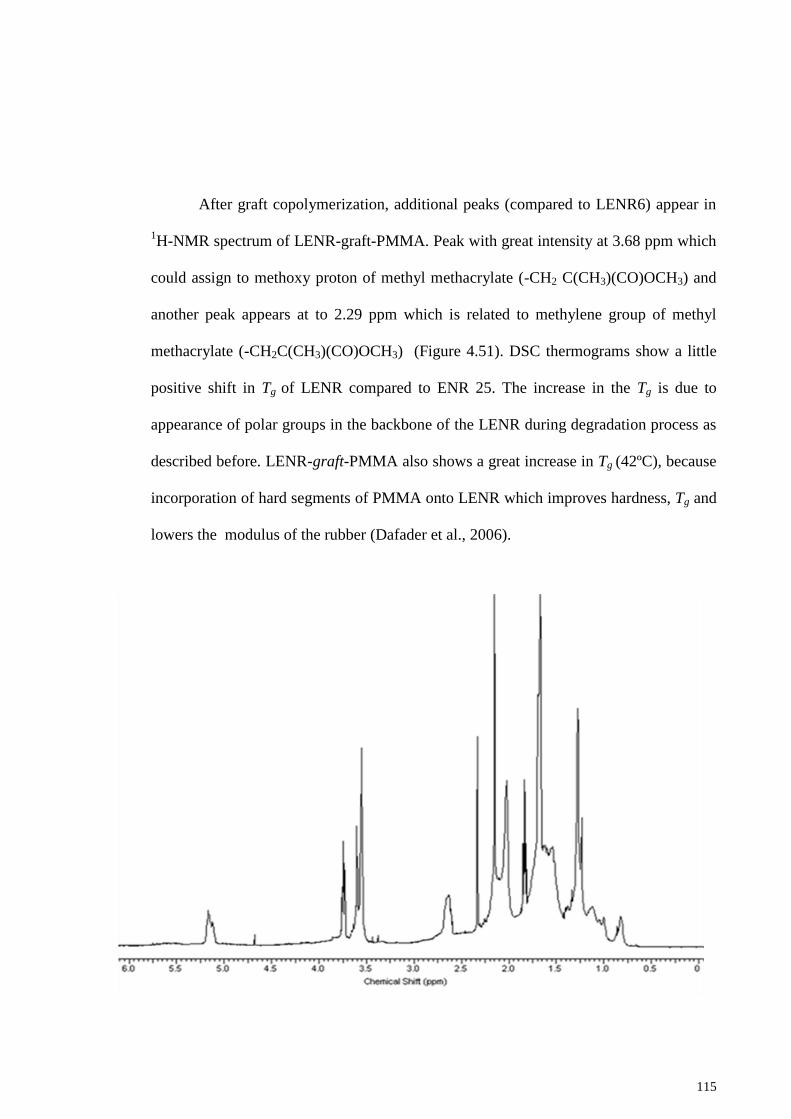
115
After graft copolymerization, additional peaks (compared to LENR6) appear in
1H-NMR spectrum of LENR-graft-PMMA. Peak with great intensity at 3.68 ppm which
could assign to methoxy proton of methyl methacrylate (-CH2 C(CH3)(CO)OCH3) and
another peak appears at to 2.29 ppm which is related to methylene group of methyl
methacrylate (-CH2C(CH3)(CO)OCH3) (Figure 4.51). DSC thermograms show a little
positive shift in Tg of LENR compared to ENR 25. The increase in the Tg is due to
appearance of polar groups in the backbone of the LENR during degradation process as
described before. LENR-graft-PMMA also shows a great increase in Tg (42ºC), because
incorporation of hard segments of PMMA onto LENR which improves hardness, Tg and
lowers the modulus of the rubber (Dafader et al., 2006).
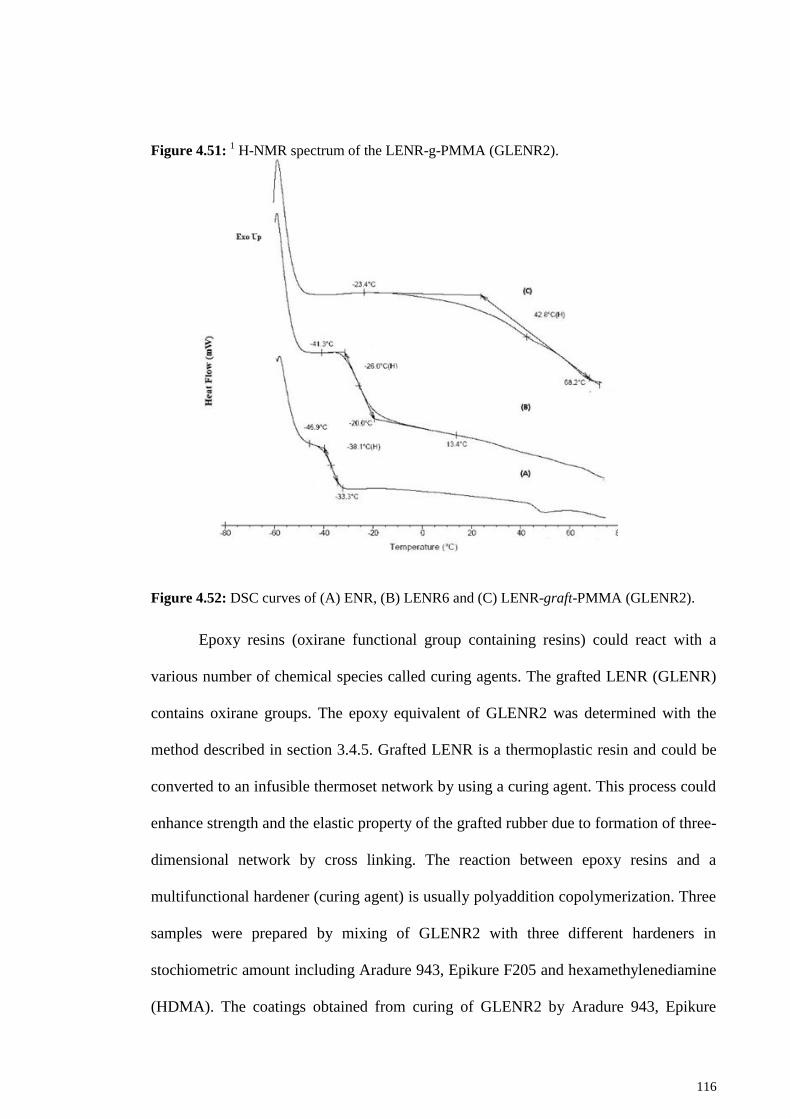
116
Figure 4.51: 1 H-NMR spectrum of the LENR-g-PMMA (GLENR2).
Figure 4.52: DSC curves of (A) ENR, (B) LENR6 and (C) LENR-graft-PMMA (GLENR2).
Epoxy resins (oxirane functional group containing resins) could react with a
various number of chemical species called curing agents. The grafted LENR (GLENR)
contains oxirane groups. The epoxy equivalent of GLENR2 was determined with the
method described in section 3.4.5. Grafted LENR is a thermoplastic resin and could be
converted to an infusible thermoset network by using a curing agent. This process could
enhance strength and the elastic property of the grafted rubber due to formation of three-
dimensional network by cross linking. The reaction between epoxy resins and a
multifunctional hardener (curing agent) is usually polyaddition copolymerization. Three
samples were prepared by mixing of GLENR2 with three different hardeners in
stochiometric amount including Aradure 943, Epikure F205 and hexamethylenediamine
(HDMA). The coatings obtained from curing of GLENR2 by Aradure 943, Epikure
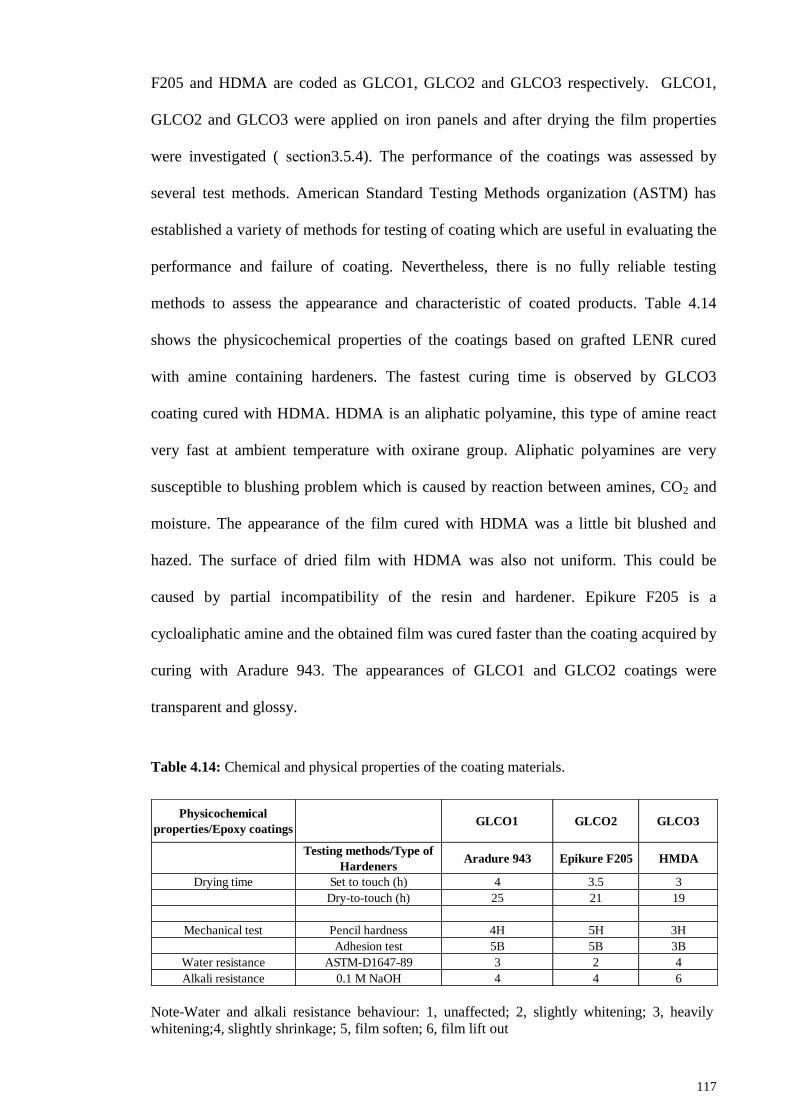
117
F205 and HDMA are coded as GLCO1, GLCO2 and GLCO3 respectively. GLCO1,
GLCO2 and GLCO3 were applied on iron panels and after drying the film properties
were investigated ( noitces 3.5.4). The performance of the coatings was assessed by
several test methods. American Standard Testing Methods organization (ASTM) has
established a variety of methods for testing of coating which are useful in evaluating the
performance and failure of coating. Nevertheless, there is no fully reliable testing
methods to assess the appearance and characteristic of coated products. Table 4.14
shows the physicochemical properties of the coatings based on grafted LENR cured
with amine containing hardeners. The fastest curing time is observed by GLCO3
coating cured with HDMA. HDMA is an aliphatic polyamine, this type of amine react
very fast at ambient temperature with oxirane group. Aliphatic polyamines are very
susceptible to blushing problem which is caused by reaction between amines, CO2 and
moisture. The appearance of the film cured with HDMA was a little bit blushed and
hazed. The surface of dried film with HDMA was also not uniform. This could be
caused by partial incompatibility of the resin and hardener. Epikure F205 is a
cycloaliphatic amine and the obtained film was cured faster than the coating acquired by
curing with Aradure 943. The appearances of GLCO1 and GLCO2 coatings were
transparent and glossy.
Table 4.14: Chemical and physical properties of the coating materials.
Note-Water and alkali resistance behaviour: 1, unaffected; 2, slightly whitening; 3, heavily
whitening;4, slightly shrinkage; 5, film soften; 6, film lift out
Physicochemical
properties/Epoxy coatingsGLCO1 GLCO2 GLCO3
Testing methods/Type of
HardenersAradure 943 Epikure F205 HMDA
Drying time Set to touch (h) 4 3.5 3
Dry-to-touch (h) 25 21 19
Mechanical test Pencil hardness 4H 5H 3H
Adhesion test 5B 5B 3B
Water resistance ASTM-D1647-89 3 2 4
Alkali resistance 0.1 M NaOH 4 4 6
118
Hardness of a coating is defined as the capacity of a coating to resist to
permanent or temporary deformation, damage, or penetration by hard object.
Deformation of a coating implies mutual displacement and interchange of chain
segment, therefore cross-linking density, entanglement, crystallinity and molecular
structure of the resin of the coating has a noticeable effect on the hardness of the film
(Fink-Jensen, 1965). The resistance of a coating against deformation decreases by
increasing layer thickness; therefore, is very important to measure the thickness before
testing the hardness of the film. The scratch hardness was determined by pencil
hardness test. The results show that GLCO2 coating has the highest pencil hardness.
This could be explained by presence of rigid cyclic structure of Epikure F205
(cycloaliphatic amine) in the network formation of the dried film. Adhesion and
cohesion are two main factors which affect noticeably on durability and performance of
a coating. Cohesion is measured by elongation test and is defined as inner strength of a
material which is provided by the bonding force between the various molecules of the
coating film. Adhesion could be defined as strength of bonds between the coating
material and the substrate. There are different kinds of bonding forces such as covalent,
metallic, hydrogen bonding, dispersion dipole and induction. Adhesion to the substrate
begins with interfacial molecular contact by wetting process. A fluid such as coating is
able to wet a surface (substrate) if it has a lower surface tension than substrate. After
wetting, by penetrating of coating molecules across the interface, interfacial bonds
between film and substrate are formed. LENR has low surface tension which is
necessary for proper wettability of substrate. Presence of polar groups in methyl
methacrylate and creation of hydroxyl group by ring opening of epoxide could provide
an appropriate adhesion to iron substrate. Therefore, good adhesion is observed by
GLCO1 and GLCO2 coatings. Incompatibility between resin and hardener in coating
mixture affects the wetting process which could cause some decrease in adhesion to the
119
substrate as is observed by GLCO3 coating. Aliphatic polyamine molecule consists of
two parts including amine functional group which has high polarity and a hydrocarbon
part that is almost non-polar and hydrophobic, therefore by increasing of H active
equivalent weight of hardener a rise in weight percentage of nonpolar group is expected.
Increasing of non-polarity and hydrophobicity could improve the water impermeability.
H active equivalent weight of HDMA and Epikure F205 are respectively 29 (g/eq) and
104 (g/eq). Consequently, a better water resistant was seen by GLCO2. Furthermore, a
non-uniformity in film formation that was observed by GLCO3 could increase the water
permeability and worsen the water resistance. Aradure 943 is an amine adduct hardener;
this means that a little part of amine group has been reacted with oxirane group to
increase the molecular weight and enhance the compatibility of hardener but Aradure
943 has still a low H active equivalent weight (38 g/eq), which could explain the lower
water resistance of GLCO1 compared to GLCO2 coating cured with Epikure F205.
Pendant hydroxyl group generated by curing reaction and polar groups present in MMA
mostly provide the adhesion to the substrate. The ester groups in MMA are not resistant
towards alkali. Hydrolysis of ester linkage is catalysed by alkali, therefore all of the
coatings showed weak alkali resistance. FTIR spectra of GLENR. GLCO1, GLCO2 and
GLCO3 are shown in Figure 4.53. FTIR spectra of coating samples show a noticeably
decrease in absorption band at 870 cm-1
. This peak is attributed to the stretching
vibration of oxirane ring. This observation implies that ring opening of oxirane group
has been occurred during curing reactions.
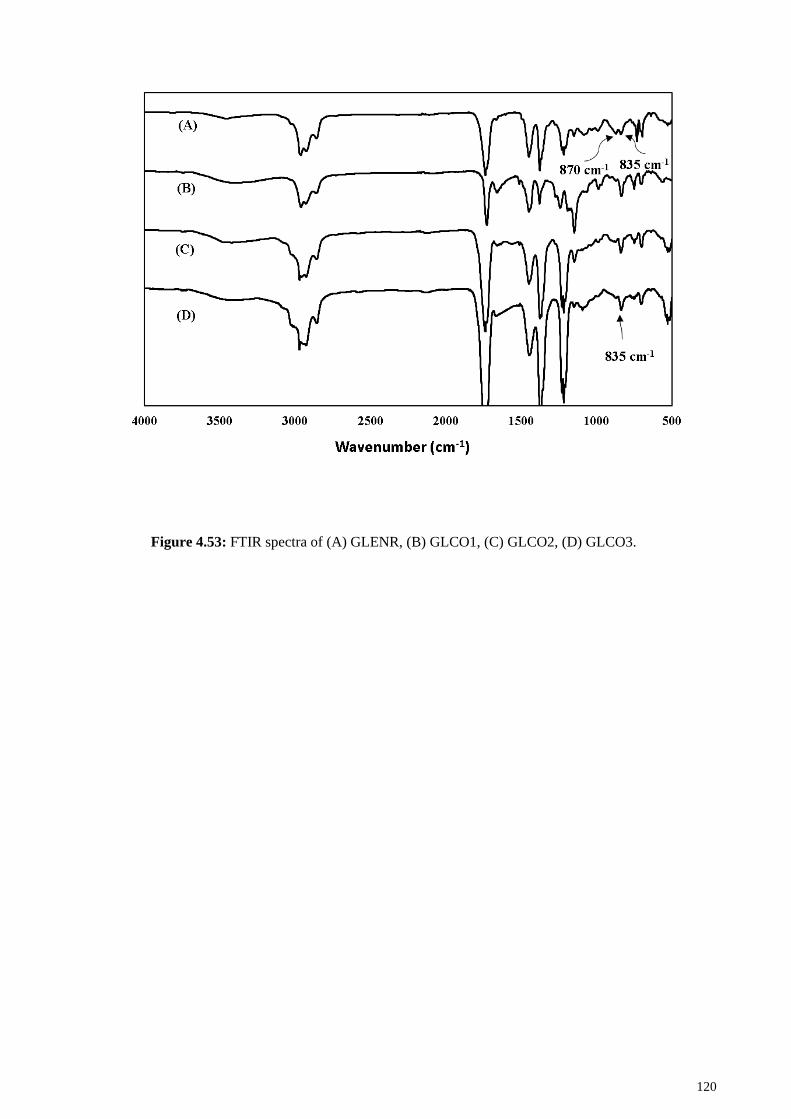
120
Figure 4.53: FTIR spectra of (A) GLENR, (B) GLCO1, (C) GLCO2, (D) GLCO3.
121
5 CHAPTER 5: CONCLUSION AND FURTHER WORK
5.1 Conclusions
Liquid epoxidized natural rubber (LENR) was successfully prepared by 5
different methods including (i) mechanical milling, (ii) degradation initiated by
potassium peroxodisulfate (iii) photo-oxidation initiated by ultra violet (iv) oxidative
degradation by periodic acid, (v) oxidative degradation using potassium permanganate.
The first three methods degraded ENR through radical mechanism. The products
of these three methods were compared together. In all three methods, a decrease in
double bond intensity is observed, but only in degradation with roll mill is there no
linear relation between degradation degree and decrease of double bond. It could imply
that generated radicals prefer to abstract an allylic hydrogen rather than add to the
double bond. The comparison of the degradation products showed that UV degradation
induced more carbonyl and hydroxyl group to the backbone of the ENR; therefore, its
product has more saturated and less double bond compared to other two methods. In all
these three methods ketone, aldehyde, ester and lactone were produced. NMR spectrum
showed that hydrofuranic structure is the main product of UV degradation, which was
not formed in reaction with K2S2O8 and mastication. Depending on time, better yield
was observed by UV degradation but increase of oxygen concentration did not enhance
the efficiency in this method. An increase in oxygen concentration in UV degradation
can lead to higher generation of free radicals which prevail cross linking reaction over
degradation, therefore LENR with higher Mn was obtained. Decreasing of concentration
122
of ENR solution and increasing of intensity of irradiation in UV photo oxidation
method, enhanced noticeably the efficiency of UV degradation.
The last two methods including degradation by H5IO6, and degradation using
KMnO4 generate LENR by oxidative degradation. LENR obtained from these methods
was characterized and compared with LENR acquired by UV photo oxidation method.
Degradation of ENR by KMnO4 and UV irradiation continue mostly by attack via
double bond, therefore a decrease in the ratio peak areas of olefinic methine proton to
epoxy methine proton was observed. The results of oxirane group titration showed that
degradation with periodic acid could take place at epoxide or via double bond group. At
concentration of above 0.044 mol H5IO6, per hundred grams of rubber (mphr)
degradation occurred by ring opening of oxirane group. FTIR and NMR results showed
that LENR obtained by H5IO6 has more ketone groups while the LENR from
degradation by KMnO4 has more ester groups. Cyclization of isoprene unit was only
observed during the degradation by H5IO6. Among these three methods, H5IO6 achieved
the fastest rate of degradation and lowest Mn under comparable conditions.
Comparing of LENR obtained by these five methods shows:
1) In term of molecular weight oxidative degradation by H5IO6 and KMnO4 are
more effective than radical degradation.
2) LENR acquired by oxidative degradation methods has more polar carbonyl
and ester group according to greater increase in intensity of absorption in carbonyl
region in FTIR spectra.
123
3) Regarding to NMR spectrum in degradation by H5IO6, the diversity of
carbonyl and hydroxyl group generated on the backbone of LENR was greater than
other methods.
4) An increase in the ratio peak areas of olefinic methine proton to epoxy
methine proton was observed only by degradation using H5IO6, which implies that
degradation by H5IO6 occurs predominantly through oxirane group.
5) Mastication with two roll mill produced LENR with greatest degree of
unsaturation and less amounts of polar groups; therefore, the chemical structure of
LENR is more similar to ENR in comparison with other methods.
To improve the overall properties of LENR, methyl methacrylate was graft
copolymerized onto LENR. Graft copolymerization was successfully done using UV
radiation for formation of free radicals. To speed up free radical formation photo
initiator, benzophenone, was used in different concentration. The amount of initiator
used has an effect onto the grafting efficiency. By increasing in the initiator
concentration an increase in the grafting efficiency was observed. Using a higher
concentration of initiator speeds up the termination reaction. Meanwhile a decrease in
grafting efficiency could be observed if homopolymerization is preferred to graft
copolymerization. The best grafting efficiency was achieved by using 0.84 phr of
benzophenone. Graft copolymerization on rubber is initiated by attack of free radical to
the α methylene hydrogen atom, on the other side a decrease in band at 835 cm-1
attributed to double bond showed that a part of graft copolymerization has been
occurred by direct attack to double bond. DSC thermograms showed a little positive
shift in Tg of LENR compared to ENR 25. LENR-graft-PMMA showed a great increase
in Tg (42ºC), because incorporation of hard segments of PMMA onto LENR. The graft
124
copolymerization improved the compatibility and mixability of LENR-graft-PMMA
towards polar curing agents. LENR-graft-PMMA was mixed with three different kinds
of hardeners including Aradure 943, Epikure F205 and hexamethylenediamine. The
mixture was applied as coating on iron plate. The FTIR spectra of the coatings revealed
a noticeable decrease in absorption band at 870 cm-1
which implies oxirane ring opening
by curing reaction. The best chemical and physical properties were observed by the
coating cured with Epikure F 205 (cycloaliphatic amine). Linear aliphatic amine
containing short alkyl chain such as HMDA was not totally compatible with GLENR
and the appearance of the film was a little bit blushed and hazed. Furthermore, the
surface of dried film with HDMA was not uniform.
5.2 Suggestion for further research
This research has presented the groundwork for preparing epoxy resin for
coating based on LENR as an environmentally friendly material. There are many
reaction possibilities that can be used in improving this research. Epoxy resins are very
reactive and could react with several different hardeners such as aliphatic amines,
aromatic amines, polycarboxylic acids, polycarboxylic anhydrides, phenol-
formaldehyde resins, amino-formaldehyde resins and mercaptans and so on, this makes
them very versatile polymers to produce a broad range of coating materials with
different properties. Another interesting prospect is to study the effect of other types of
monomer grafted onto LENR. For example, grafting of 2-hydroxyethyl methacrylate
onto LENR or LNR could improve the adhesion to substrate due to presence of
hydroxyl groups and the resin has also the capability to be cured with different kinds of
diisocyanates.

125
126
6 REFERENCES
Adam, C., Lacoste, J., and Lemaire, J. (1991). Photo-oxidation of polyisoprene.
Polymer Degradation and Stability, 32(1), 51-69.
Alimuniar, A., Yarmo, M. A., Rahman, M. A., Kohjiya, S., Ikeda, Y., and Yamashita, S.
(1990). Metathesis degradation of natural rubber. Polymer Bulletin, 23(1), 119-
126.
Aprem, A. S., Joseph, K., and Thomas, S. (2005). Recent developments in crosslinking
of elastomers. Rubber Chemistry and Technology, 78(3), 458-488.
Arayapranee, W., Prasassarakich, P., and Rempel, G. (2002). Synthesis of graft
copolymers from natural rubber using cumene hydroperoxide redox initiator.
Journal of Applied Polymer Science, 83(14), 2993-3001.
Atherton, N., Banks, L., and Ellis, B. (1982). Development of green and dark blue
colors in epoxy resins cured with 4, 4′‐ diaminodiphenylmethane. Journal of
Applied Polymer Science, 27(6), 2015-2023.
Azhar, N. H. A., Rasid, H. M., and Yusoff, S. F. M. (2017). Epoxidation and
hydroxylation of liquid natural rubber. Sains Malaysiana, 46(3), 485-491.
Baker, C., Gelling, I., and Newell, R. (1985). Epoxidized natural rubber. Rubber
Chemistry and Technology, 58(1), 67-85.
Bentley, J., and Turner, G. P. A. (1997). Introduction to paint chemistry and principles
of paint technology. Bristol,UK: CRC Press.
Berry, J., and Morrell, S. (1974). Liquid rubbers and the problems involved in their
application. Polymer, 15(8), 521-526.
Brock, T., Groteklaes, M., and Mischke, P. (2000). European Coatings Handbook.
Germany: Vincentz Network GmbH & Co KG.
Burfield, D., and Gan, S. (1975). Nonoxidative crosslinking reactions in natural rubber.
I. Determination of crosslinking groups. Journal of Polymer Science: Polymer
Chemistry Edition, 13(12), 2725-2734.
Burfield, D. R., Lim, K.-L., Law, K.-S., and Ng, S. (1984). Analysis of epoxidized
natural rubber. A comparative study of dsc, nmr, elemental analysis and direct
titration methods. Polymer, 25(7), 995-998.
127
Bussière, P.-O., Gardette, J.-L., Lacoste, J., and Baba, M. (2005). Characterization of
photodegradation of polybutadiene and polyisoprene: Chronology of
crosslinking and chain-scission. Polymer Degradation and Stability, 88(2), 182-
188.
Chaikumpollert, O., Sae-Heng, K., Wakisaka, O., Mase, A., Yamamoto, Y., and
Kawahara, S. (2011). Low temperature degradation and characterization of
natural rubber. Polymer Degradation and Stability, 96(11), 1989-1995.
Charmondusit, K., Kiatkamjornwong, S., and Prasassarakich, P. (1998). Grafting of
methyl methacrylate and styrene onto natural rubber. Journal of Scientific
Research Chulalongkorn University, 23(2), 167-181.
Chung, T., and Chasmawala, M. (1992). Synthesis of telechelic 1, 4-polybutadiene by
metathesis reactions and borane monomers. Macromolecules, 25(20), 5137-
5144.
Claramma, N., Mathew, N., and Thomas, E. (1989). Radiation induced graft
copolymerization of acrylonitrile on natural rubber. International Journal of
Radiation Applications and Instrumentation. Part C. Radiation Physics and
Chemistry, 33(2), 87-89.
Cooper, W., Vaughan, G., Miller, S., and Fielden, M. (1959). Graft copolymers from
natural rubber latex using visible, ultraviolet, and γ‐ ray initiation. Journal of
Polymer Science, 34(127), 651-670.
Corish, P. (1967). Fundamental studies of rubber blends. Rubber Chemistry and
Technology, 40(2), 324-340.
Cornish, K. (2001). Biochemistry of natural rubber, a vital raw material, emphasizing
biosynthetic rate, molecular weight and compartmentalization, in evolutionarily
divergent plant species. Natural Product Reports, 18(2), 182-189.
Cunneen, J. (1960). Cis-trans isomerization in natural polyisoprenes. Rubber Chemistry
and Technology, 33(2), 445-456.
Cunneen, J., Higgins, G., and Watson, W. (1959). cis‐ trans isomerization in
polyisoprenes. Part V. The isomerization of natural rubber, gutta‐ percha,
squalene, cis‐ and trans‐ 3‐ methylpent‐ 2‐ ene, and cis‐ polybutadiene, and its
quantitative estimation. Journal of Polymer Science, 40(136), 1-13.
Dafader, N., Haque, M., Akhtar, F., and Ahmad, M. (2006). Study on grafting of
different types of acrylic monomers onto natural rubber by γ-rays. Radiation
Physics and Chemistry, 168-172.
Dash, S., Patel, S., and Mishra, B. K. (2009). Oxidation by permanganate: Synthetic and
mechanistic aspects. Tetrahedron, 65(4), 707-739.
128
Derouet, D., Radhakrishnan, N., Brosse, J. C., and Boccaccio, G. (1994). Phosphorus
modification of epoxidized liquid natural rubber to improve flame resistance of
vulcanized rubbers. Journal of Applied Polymer Science, 52(9), 1309-1316.
Dos Santos, K., Suarez, P., and Rubim, J. (2005). Photo-degradation of synthetic and
natural polyisoprenes at specific UV radiations. Polymer Degradation and
Stability, 90(1), 34-43.
Durbetaki, A. (1956). Direct titration of oxirane oxygen with hydrogen bromide in
acetic acid. Analytical Chemistry, 28(12), 2000-2001.
Eastham, A., and Latremouille, G. (1950). The chemistry of ethylene oxide: An analysis
for ethylene oxide. Canadian Journal of Research, 28(6), 264-267.
Ellis, B. (1993). Chemistry and technology of epoxy resins. Netherlands: Springer.
Fainleib, A., Pires, R. V., Lucas, E. F., and Soares, B. G. (2013). Degradation of non-
vulcanized natural rubber-renewable resource for fine chemicals used in
polymer synthesis. Polímeros, 23(4), 441-450.
Favis, B. (2000). Polymer Blends, Vol. 1: Formulation (Vol. 1, pp. 501-538). New
York: John Wiley & Sons.
Fink-Jensen, P. (1965). Hardness testing of organic coatings. Pure and Applied
Chemistry, 10(3), 239-292.
Fuller, K., Gough, J., and Thomas, A. (2004). The effect of low‐ temperature
crystallization on the mechanical behavior of rubber. Journal of Polymer
Science Part B: Polymer Physics, 42(11), 2181-2190.
Gaborieau, M., and Castignolles, P. (2011). Size-exclusion chromatography (SEC) of
branched polymers and polysaccharides. Analytical and Bioanalytical
Chemistry, 399(4), 1413-1423.
Gelling, I. (1991). Epoxidised natural rubber. Journal of Natural Rubber Research,
6(3), 184-205.
Gillier‐ Ritoit, S., Reyx, D., Campistron, I., Laguerre, A., and Pal Singh, R. (2003a).
Telechelic cis‐ 1, 4‐ oligoisoprenes through the selective oxidolysis of
epoxidized monomer units and polyisoprenic monomer units in cis‐ 1, 4‐polyisoprenes. Journal of Applied Polymer Science, 87(1), 42-46.
Halasa, A. F., Hsu, W.-L., Ryba, A. M., Zhou, J.-P., Jasiunas, C. A., and Sandstrom, P.
H. (2007). Synthetic polyisoprene rubber: Google Patents.
Harmon, D., and Jacobs, H. (1966). Degradation of natural rubber during mill
mastication. Journal of Applied Polymer Science, 10(2), 253-257.
129
Hashim, A. S., Ong, S., and Jessey, R. (2002). A general review of recent developments
on chemical modification of NR. Natuurrubber Nat Rubber, 28, 3-9.
Ibrahim, S., and Mustafa, A. (2014). Effect of reagents concentration and ratio on
degradation of natural rubber latex in acidic medium. Malaysian Journal of
Analytical Sciences, 18(2), 405-414.
Ikeda, Y. (2014). Understanding network control by vulcanization for sulfur cross-
linked natural rubber (NR). Chemistry, Manufacture and Applications of Natural
Rubber, 119.
Ismail, H. (2002). Thermoplastic elastomers based on polypropylene/natural rubber and
polypropylene/recycle rubber blends. Polymer Testing, 21(4), 389-395.
Ivin, K. J. (1983). Olefin metathesis. London: Academic Press.
Jones, K., and Tinker, A. (1997). Blends of natural rubber: Novel techniques for
blending with specialty polymers. London, UK: Springer Science & Business
Media.
Jones, K. P. (1994). Natural rubber as a green commodity-Part II. Rubber
Developments, 47(3/4), 37-41.
Jorge, R., Lopes, L., Benzi, M., Ferreira, M., Gomes, A., and Nunes, R. (2010). Thiol
addition to epoxidized natural rubber: Effect on the tensile and thermal
properties. International Journal of Polymeric Materials, 59(5), 330-341.
Joseph, K. K. N., M. R. Gopinathan. (1991). Production of telechelic liquid natural
rubber. Polymer Science, 1, 353-355.
Kangwansupamonkon, W., Gilbert, R. G., and Kiatkamjornwong, S. (2005).
Modification of natural rubber by grafting with hydrophilic vinyl monomers.
Macromolecular Chemistry and Physics, 206(24), 2450-2460.
Kargarzadeh, H., Ahmad, I., and Abdullah, I. (2014). Liquid rubbers as toughening
agents. Micro-and Nanostructured Epoxy/Rubber Blends, 31-52.
Kargarzadeh, H., Ahmad, I., Abdullah, I., Thomas, R., Dufresne, A., Thomas, S., and
Hassan, A. (2015a). Functionalized liquid natural rubber and liquid epoxidized
natural rubber: A promising green toughening agent for polyester. Journal of
Applied Polymer Science, 132(3), n/a-n/a.
Klinklai, W., Kawahara, S., Mizumo, T., Yoshizawa, M., Sakdapipanich, J. T., Isono,
Y., and Ohno, H. (2003). Depolymerization and ionic conductivity of
enzymatically deproteinized natural rubber having epoxy group. European
Polymer Journal, 39(8), 1707-1712.
130
Kochthongrasamee, T., Prasassarakich, P., and Kiatkamjornwong, S. (2006). Effects of
redox initiator on graft copolymerization of methyl methacrylate onto natural
rubber. Journal of Applied Polymer Science, 101(4), 2587-2601.
Kodama, S., Nishi, K., and Furukawa, M. (2003). Preparation of low molecular weight
natural rubber by ozonolysis of high ammonia latex. Journal of Rubber
Research, 6(3), 153-163.
Koning, C., Van Duin, M., Pagnoulle, C., and Jerome, R. (1998). Strategies for
compatibilization of polymer blends. Progress in Polymer Science, 23(4), 707-
757.
Kovuttikulrangsie, S., and Sakdapipanich, J. T. (2004). The molecular weight (MW)
and molecular weight distribution (MWD) of NR from different age and clone
Hevea trees. Songklanakarin Journal of Science and Technology, 27, 337-342.
Kovuttikulrangsie, S., and Tanaka, Y. (1999). NR latex particle size and its molecular
weight from young and mature hevea trees. Journal of Rubber Research, 2(3),
150-159.
La Mantia, F., Morreale, M., Botta, L., Mistretta, M., Ceraulo, M., and Scaffaro, R.
(2017). Degradation of polymer blends: A brief review. Polymer Degradation
and Stability.
Laue, T., and Plagens, A. (2005). Named organic reactions. Germany: John Wiley &
Sons.
Lee, D., Scanlan, J., and Watson, W. (1963). The cyclization of natural rubber. Paper
presented at the Proceedings of the Royal Society of London A: Mathematical,
Physical and Engineering Sciences.
Lenka, S., Nayak, P. L., and Mohanty, I. B. (1985). Graft copolymerization onto natural
rubber, VIII. Graft copolymerization of methyl methacrylate onto rubber using a
potassium bromate/thiourea redox system. Die Angewandte Makromolekulare
Chemie, 134(1), 1-9.
Li, S. D., Chen, Y., Zhou, J., Li, P. S., Zhu, C. S., and Lin, M. L. (1998). Study on the
thermal degradation of epoxidized natural rubber. Journal of Applied Polymer
Science, 67(13), 2207-2211.
Lindley, P. B. (1981). Natural rubber structural bearings. Special Publication, 70, 353-
378.
López‐ Manchado, M., Arroyo, M., Herrero, B., and Biagiotti, J. (2003). Vulcanization
kinetics of natural rubber–organoclay nanocomposites. Journal of Applied
Polymer Science, 89(1), 1-15.
Maerker, G., and Haeberer, E. (1966). Direct cleavage of internal epoxides with
periodic acid. Journal of the American Oil Chemists Society, 43(2), 97-100.
131
Malaprade, L. (1928). Action of polyalcohols on periodic acid. Analytical application.
Bulletin de la Societe Chimique de France, 43, 683-696.
Mannari, V., and Patel, C. J. (2015). Understanding coatings raw materials (pp. 33).
Vincentz Network: Hanover, Germany.
Manroshan, S., Mustafa, A., Mok, K., Kawahara, S., Amir-Hashim, M., and Booten, K.
(2009). Comparison between sodium dodecyl sulfate and polyfructose surfactant
systems in urea deproteinisation of natural rubber latex. Journal of Rubber
Research, 12(1), 1-11.
Mansfeld, F. B. (1986). Corrosion mechanisms (Vol. 28). New York: CRC Press.
Mark, H. (2004). Encyclopedia of Polymer Science and Technology, 12 Volume Set
(Vol. 9). New York: Wiley-Interscience
Mark, J. E., Erman, B., and Roland, M. (2013). The science and technology of rubber.
New York: Academic press.
Marmo, J., and Wagener, K. (1997). Metathetical degradation and depolymerization of
unsaturated polymers. Rubber Chemistry and Technology, 70(3), 519-529.
Mauler, R., Guaragna, F., Gobbi, D., and Samios, D. (1997). Sonochemical degradation
of 1, 4-cis-polyisoprene using periodic acid-solvent and temperature effect.
European Polymer Journal, 33(3), 399-402.
Mirzataheri, M. (2000). The cyclization of natural rubber. Iranian Journal of Chemistry
and Chemical Engineering (IJCCE), 19(2), 91-96.
Mistry, B. (2009). A Handbook of spectroscopic data Chemistry (UV, IR, PMR, CNMR
and Mass Spectroscopy), Science College, Va/sad (Gujarat): Oxford Book
Company.
Mitchell Jr, J., and Perkins, L. (1967). Determination of hydroperoxide groups in
oxidized polyethylene. Paper presented at the Appl Polym Symp.
Montaudo, G., Scamporrino, E., Vitalini, D., and Rapisardi, R. (1992). Fast atom
bombardment mass spectrometric analysis of the partial ozonolysis products of
poly (isoprene) and poly (chloroprene). Journal of Polymer Science Part A:
Polymer Chemistry, 30(4), 525-532.
Mooibroek, H., and Cornish, K. (2000). Alternative sources of natural rubber. Applied
Microbiology and Biotechnology, 53(4), 355-365.
Moolsin, S., and Robishaw, N. K. (2011). Natural rubber modification by vinyl
monomers grafting: A review. Rangsit Journal of Arts and Sciences, Vol. 5( No.
1), 99-116.
132
Morand, J. (1977). Chain scission in the oxidation of polyisoprene. Rubber Chemistry
and Technology, 50(2), 373-396.
Morrell, S., and Blow, C. (1982). Rubber technology and manufacture. Blow, CM, Ed,
162(48-97).
Nair, N. R., Thomas, S., and Mathew, N. (1997). Liquid natural rubber as a viscosity
modifier in nitrile rubber processing. Polymer international, 42(3), 289-300.
Nakason, C., Kaesaman, A., Sainamsai, W., and Kiatkamjonwong, S. (2004a).
Rheological behavior of reactive blending of epoxidized natural rubber with
cassava starch and epoxidized natural rubber with natural rubber and cassava
starch. Journal of Applied Polymer Science, 91(3), 1752-1762.
Nakason, C., Kaesaman, A., and Supasanthitikul, P. (2004b). The grafting of maleic
anhydride onto natural rubber. Polymer Testing, 23(1), 35-41.
Nakason, C., Panklieng, Y., and Kaesaman, A. (2004c). Rheological and thermal
properties of thermoplastic natural rubbers based on poly (methyl
methacrylate)/epoxidized‐ natural‐ rubber blends. Journal of Applied Polymer
Science, 92(6), 3561-3572.
Nayak, P. L., and Basak, A. (1986). Graft copolymerization onto natural rubber. XV.
Graft copolymerization of methyl methacrylate onto natural rubber using a
potassium permanganate‐ ascorbic acid redox system. Journal of Applied
Polymer Science, 32(3), 4271-4275.
Nguyen, C. A., Xiong, S., Ma, J., Lu, X., and Lee, P. S. (2009). Toward electrochromic
device using solid electrolyte with polar polymer host. The Journal of Physical
Chemistry B, 113(23), 8006-8010.
Nor, H. M., and Ebdon, J. R. (1998). Telechelic liquid natural rubber: A review.
Progress in Polymer Science, 23(2), 143-177.
Pautrat, R. (1980). Liquid rubbers from natural polyisoprene: Preparation and
properties. Revue Generale du Caoutchouc et des Plastiques, 57, 91-97.
Perera, M., and Bradbury, J. (1992). Epoxidized natural rubber. Australian National
University: Chemistry Department, Canberra, ACT, 2600, 1-12.
Perera, M., Elix, J., and Bradbury, J. (1988). Ozonolysis of epoxidized natural rubber.
Journal of Applied Polymer Science, 36(1), 105-116.
Phinyocheep, P. (2014). Chemical modification of natural rubber (NR) for improved
performance. Chemistry, Manufacture and Applications of Natural Rubber (pp.
68-118). Woodhead Publishing: Oxford,UK.
133
Phinyocheep, P., Phetphaisit, C., Derouet, D., Campistron, I., and Brosse, J. (2005).
Chemical degradation of epoxidized natural rubber using periodic acid:
Preparation of epoxidized liquid natural rubber. Journal of Applied Polymer
Science, 95(1), 6-15.
Pike, M., and Watson, W. (1952). Mastication of rubber, I. Mechanism of plasticizing
by cold mastication. Journal of Polymer Science, 9(3), 229-251.
Piton, M., and Rivaton, A. (1996). Photooxidation of polybutadiene at long wavelengths
(λ> 300 nm). Polymer Degradation and Stability, 53(3), 343-359.
Rameshwaram, J., Yang, Y.-S., and Jeon, H. (2005). Structure–property relationships of
nanocomposite-like polymer blends with ultrahigh viscosity ratios. Polymer,
46(15), 5569-5579.
Rasutis, D., Soratana, K., McMahan, C., and Landis, A. E. (2015). A sustainability
review of domestic rubber from the guayule plant. Industrial Crops and
Products, 70, 383-394.
Ravindran, T., Nayar, M., and Francis, D. J. (1988). Production of hydroxyl‐ terminated
liquid natural rubber mechanism of photochemical depolymerization and
hydroxylation. Journal of Applied Polymer Science, 35(5), 1227-1239.
Reyx, D., and Campistron, I. (1997). Controlled degradation in tailor‐ made
macromolecules elaboration. Controlled chain‐ cleavages of polydienes by
oxidation and by metathesis. Die Angewandte Makromolekulare Chemie,
247(1), 197-211.
Riyajan, S.-A. (2009). Activation energy and thermodynamic parameters of cyclization
in purified natural rubber latex using a trimethyl silyl triflate. Journal of
Elastomers and Plastics, 41(2), 133-144.
Roshani, B., and Leitner, N. K. V. (2011). Effect of persulfate on the oxidation of
benzotriazole and humic acid by e-beam irradiation. Journal of Hazardous
Materials, 190(1), 403-408.
Sadaka, F., Campistron, I., Laguerre, A., and Pilard, J.-F. (2012). Controlled chemical
degradation of natural rubber using periodic acid: Application for recycling
waste tyre rubber. Polymer Degradation and Stability, 97(5), 816-828.
Saetung, A., Rungvichaniwat, A., Campistron, I., Klinpituksa, P., Laguerre, A.,
Phinyocheep, P., and Pilard, J. F. (2010). Controlled degradation of natural
rubber and modification of the obtained telechelic oligoisoprenes: Preliminary
study of their potentiality as polyurethane foam precursors. Journal of Applied
Polymer Science, 117(3), 1279-1289.
Sakdapipanich, J. T., Nawamawat, K., and Kawahara, S. (2002). Characterization of the
large and small rubber particles in fresh Hevea latex. Rubber Chemistry and
Technology, 75(2), 179-185.
134
Samran, J., Phinyocheep, P., Daniel, P., and Kittipoom, S. (2005). Hydrogenation of
unsaturated rubbers using diimide as a reducing agent. Journal of Applied
Polymer Science, 95(1), 16-27.
Saville, B., and Watson, A. (1967). Structural characterization of sulfur-vulcanized
rubber networks. Rubber Chemistry and Technology, 40(1), 100-148.
Schmidt, T., Lenders, M., Hillebrand, A., van Deenen, N., Munt, O., Reichelt, R.,
Eisenreich, W., Fischer, R., Prüfer, D., and Gronover, C. S. (2010).
Characterization of rubber particles and rubber chain elongation in Taraxacum
koksaghyz. BMC Biochemistry, 11(1), 1.
Singha, N. K., De, P., and Sivaram, S. (1997). Homogeneous catalytic hydrogenation of
natural rubber using RhCl (PPh3) 3. Journal of Applied Polymer Science, 66(9),
1647-1652.
Subramaniam, A. (1995). The chemistry of natural rubber latex. Immunology and
allergy clinics of North America, 15, 1-20.
Suksawad, P., Yamamoto, Y., and Kawahara, S. (2011). Preparation of thermoplastic
elastomer from natural rubber grafted with polystyrene. European Polymer
Journal, 47(3), 330-337.
Tanaka, Y., and Kakiuchi, H. (1963). Study of epoxy compounds. Part I. curing
reactions of epoxy resin and acid anhydride with amine and alcohol as catalyst.
Journal of Applied Polymer Science, 7(3), 1063-1081.
Tangpakdee, J., Mizokoshi, M., Endo, A., and Tanaka, Y. (1998). Novel method for
preparation of low molecular weight natural rubber latex. Rubber Chemistry and
Technology, 71(4), 795-802.
Tangpakdee, J., Tanaka, Y., Wititsuwannakul, R., and Chareonthiphakorn, N. (1996).
Possible mechanisms controlling molecular weight of rubbers in Hevea
brasiliensis. Phytochemistry, 42(2), 353-355.
Taylor, C. J. A., and Marks, S. (1972). Paint Technology Manuals: Convertible
coatings. London: Chapman and Hall.
Thiraphattaraphun, L., Kiatkamjornwong, S., Prasassarakich, P., and Damronglerd, S.
(2001). Natural rubber‐ g‐ methyl methacrylate/poly (methyl methacrylate)
blends. Journal of Applied Polymer Science, 81(2), 428-439.
Thomas, S., Chan, C. H., Pothen, L. A., Rajisha, K., and Maria, H. (2013). Natural
Rubber Materials: Volume 1: Blends and IPNs (Vol. 7): Royal Society of
Chemistry.
Tillekeratne, L. M. K. (1977). Studies on the use of solar energy for the preparation of
liquid rubber. Journal of the Rubber Research Institute of Sri Lanka, 54, 501-
507.
135
Utara, S., and Moonart, U. (2013). Effects of Frequency and Sonication Time on
Ultrasonic Degradation of Natural Rubber Latex. Paper presented at the
Advanced Materials Research.
Van Amerongen, G., Koningsberger, C., and Salomon, G. (1950). Chlorination of
natural rubber. I. Preparation and properties of chlorinated rubber. Journal of
Polymer Science, 5(6), 639-652.
Vernekar, S., Sabne, M., Patil, S., Patil, A., Idage, S., Avadhani, C., and Sivaram, S.
(1992). Effect of latex concentration on epoxidation of natural rubber (NR)
latex. Journal of Applied Polymer Science, 44(12), 2107-2114.
Wang, P., Tan, K., Ho, C., Khew, M., and Kang, E. (2000). Surface modification of
natural rubber latex films by graft copolymerization. European Polymer
Journal, 36(7), 1323-1331.
Warren‐ Thomas, E., Dolman, P. M., and Edwards, D. P. (2015). Increasing demand for
natural rubber necessitates a robust sustainability initiative to mitigate impacts
on tropical biodiversity. Conservation Letters, 8(4), 230-241.
Wiberg, K. B., and Saegebarth, K. A. (1957). The mechanisms of permanganate
oxidation. IV. Hydroxylation of olefins and related reactions. Journal of the
American Chemical Society, 79(11), 2822-2824.
Wiles, D., and Carlsson, D. (1980). Photostabilisation mechanisms in polymers: A
review. Polymer Degradation and Stability, 3(1), 61-72.
Yan, Y. E., and Schwartz, F. W. (1999). Oxidative degradation and kinetics of
chlorinated ethylenes by potassium permanganate. Journal of Contaminant
Hydrology, 37(3), 343-365.
Zhang, J., Zhou, Q., Jiang, X.-H., Du, A.-K., Zhao, T., van Kasteren, J., and Wang, Y.-
Z. (2010). Oxidation of natural rubber using a sodium tungstate/acetic
acid/hydrogen peroxide catalytic system. Polymer Degradation and Stability,
95(6), 1077-1082.
Zhong, J. P., Li, S. D., Wei, Y. C., Peng, Z., and Yu, H. P. (1999). Study on preparation
of chlorinated natural rubber from latex and its thermal stability. Journal of
Applied Polymer Science, 73(14), 2863-2867.
Zhou, M. H., Hoang, T., Kim, I. G., Ha, C. S., and Cho, W. J. (2001). Synthesis and
properties of natural rubber modified with stearyl methacrylate and
divinylbenzene by graft polymerization. Journal of Applied Polymer Science,
79(13), 2464-2470.
136
7 LIST OF ISI PUBLICATIONS AND PRESENTATIONS
Rooshenass, P., Yahya, R., Gan, S. N. (2016). Comparison of three different
degradation methods to produce liquid epoxidized natural rubber. Rubber Chemistry
and Technology, 89(1), 177-198.
Rooshenass, P., Yahya, R., Gan, S. N. (2017). Preparation of liquid epoxidized natural
rubber by oxidative degradations using periodic acid, potassium permanganate and UV-
irradiation. Journal of Polymers and the Environment, 1–15.
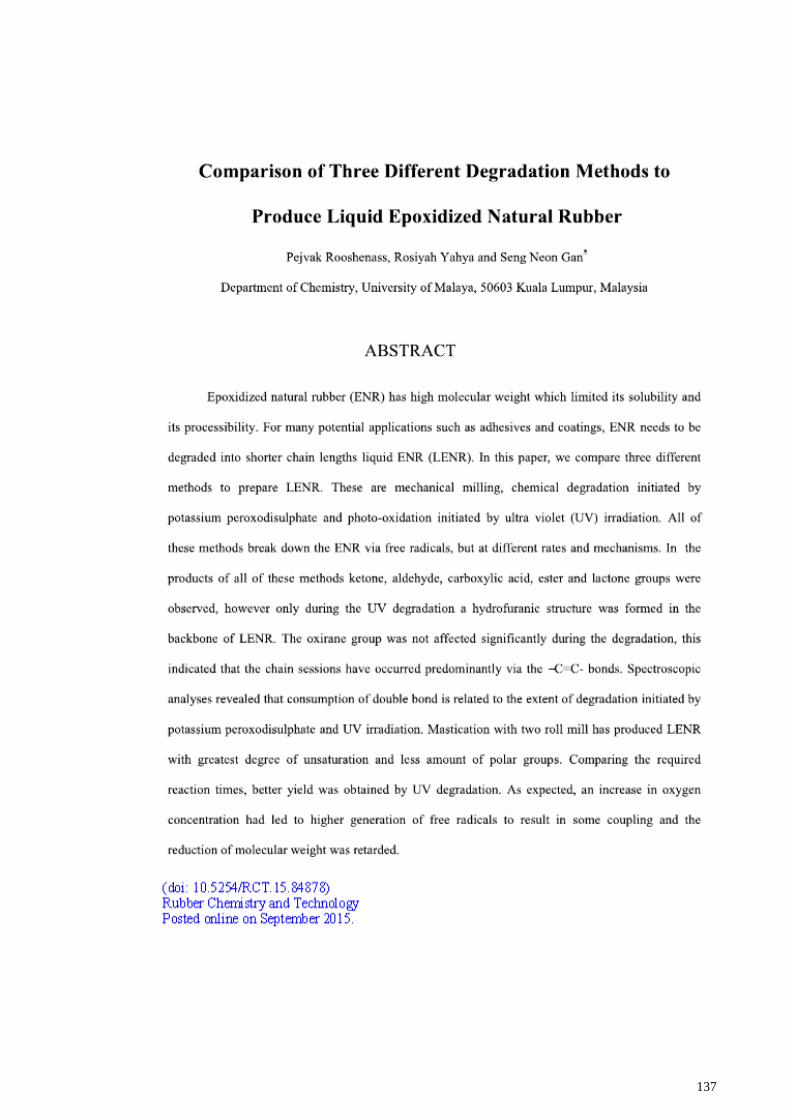
137

138
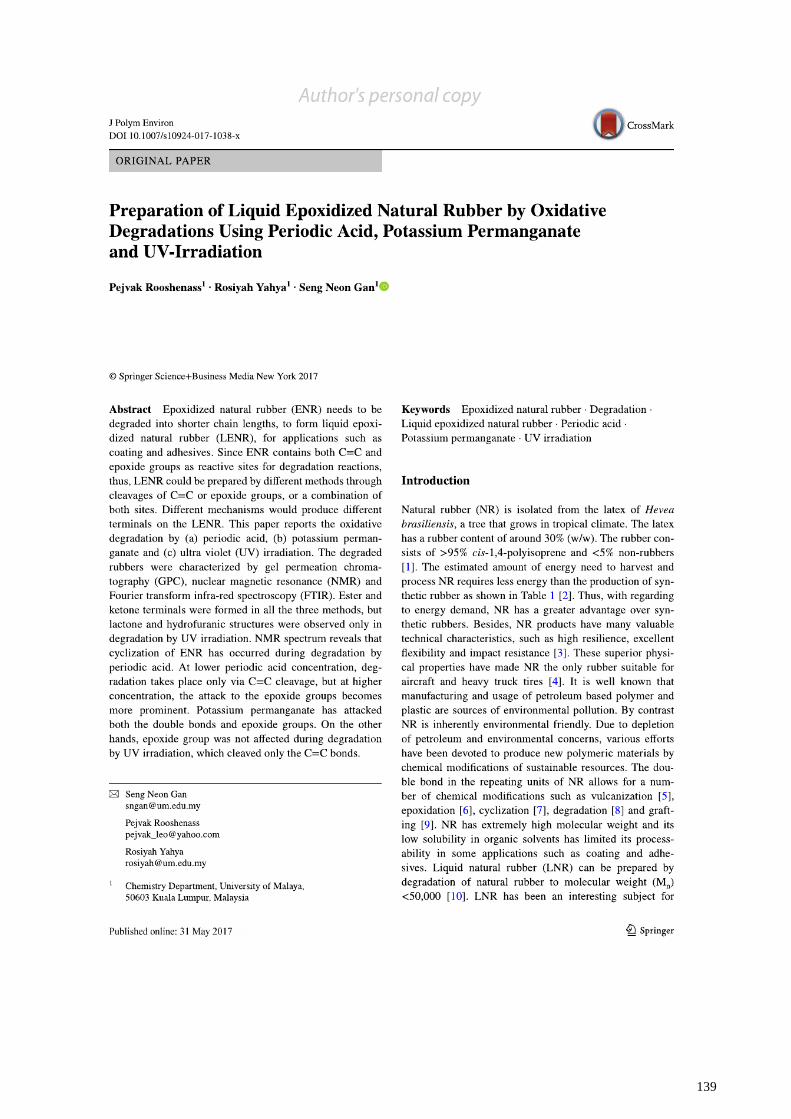
139