industrial crops statistics malaysia 2017 · statistik tanaman industri - j . senarai jadual dan...
TRANSCRIPT
INDUSTRIAL CROPS STATISTICSMalaysia
2017
STATISTIK TANAMAN INDUSTRI
JABATAN PERTANIANDepartment of Agriculture
Putrajaya, Malaysia

INDUSTRIAL CROPS STATISTICSMalaysia
2017
STATISTIK TANAMAN INDUSTRI
Jabatan Pertanian
Department of Agriculture
Putrajaya, Malaysia

STATISTIK TANAMAN INDUSTRI - C
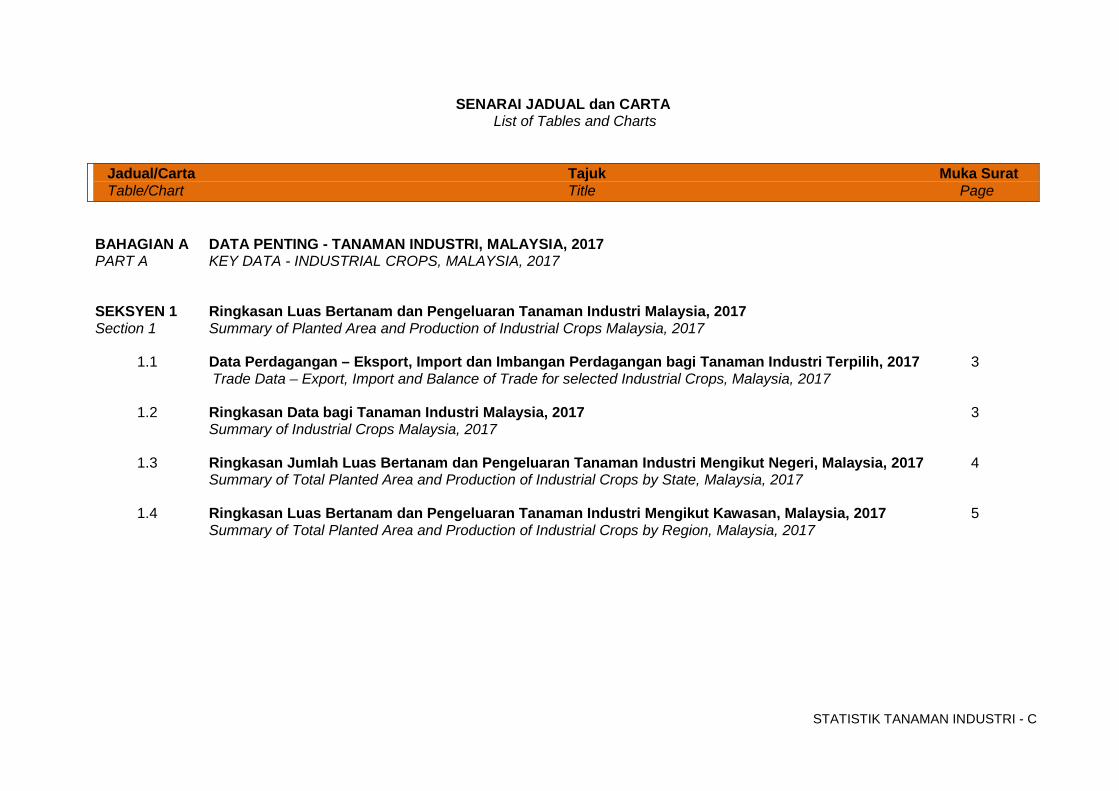
SENARAI JADUAL dan CARTA List of Tables and Charts
Jadual/Carta Tajuk Muka Surat Table/Chart Title Page BAHAGIAN A DATA PENTING - TANAMAN INDUSTRI, MALAYSIA, 2017 PART A KEY DATA - INDUSTRIAL CROPS, MALAYSIA, 2017
SEKSYEN 1 Ringkasan Luas Bertanam dan Pengeluaran Tanaman Industri Malaysia, 2017 Section 1 Summary of Planted Area and Production of Industrial Crops Malaysia, 2017
1.1 Data Perdagangan – Eksport, Import dan Imbangan Perdagangan bagi Tanaman Industri Terpilih, 2017 3
Trade Data – Export, Import and Balance of Trade for selected Industrial Crops, Malaysia, 2017 1.2 Ringkasan Data bagi Tanaman Industri Malaysia, 2017 3 Summary of Industrial Crops Malaysia, 2017
1.3 Ringkasan Jumlah Luas Bertanam dan Pengeluaran Tanaman Industri Mengikut Negeri, Malaysia, 2017 4 Summary of Total Planted Area and Production of Industrial Crops by State, Malaysia, 2017
1.4 Ringkasan Luas Bertanam dan Pengeluaran Tanaman Industri Mengikut Kawasan, Malaysia, 2017 5
Summary of Total Planted Area and Production of Industrial Crops by Region, Malaysia, 2017
STATISTIK TANAMAN INDUSTRI - D
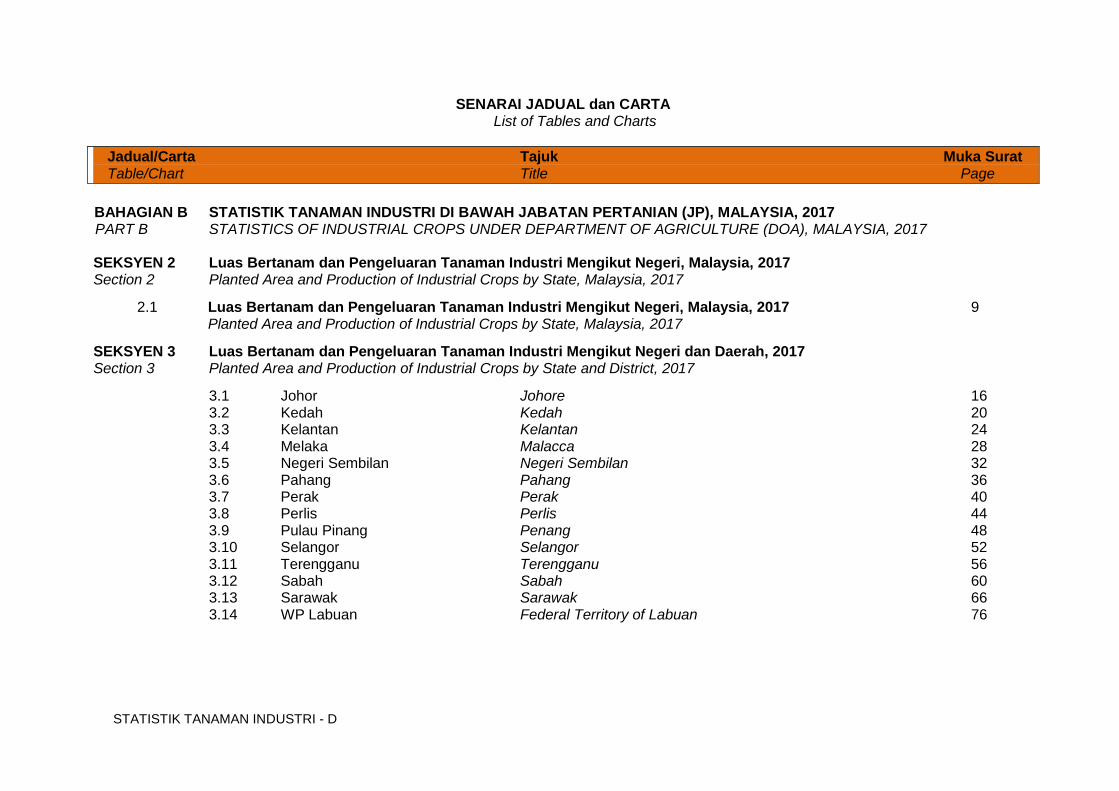
SENARAI JADUAL dan CARTA List of Tables and Charts
Jadual/Carta Tajuk Muka Surat Table/Chart Title Page
BAHAGIAN B STATISTIK TANAMAN INDUSTRI DI BAWAH JABATAN PERTANIAN (JP), MALAYSIA, 2017 PART B STATISTICS OF INDUSTRIAL CROPS UNDER DEPARTMENT OF AGRICULTURE (DOA), MALAYSIA, 2017
SEKSYEN 2 Luas Bertanam dan Pengeluaran Tanaman Industri Mengikut Negeri, Malaysia, 2017 Section 2 Planted Area and Production of Industrial Crops by State, Malaysia, 2017
2.1 Luas Bertanam dan Pengeluaran Tanaman Industri Mengikut Negeri, Malaysia, 2017 9 Planted Area and Production of Industrial Crops by State, Malaysia, 2017
SEKSYEN 3 Luas Bertanam dan Pengeluaran Tanaman Industri Mengikut Negeri dan Daerah, 2017 Section 3 Planted Area and Production of Industrial Crops by State and District, 2017
3.1 Johor Johore 16 3.2 Kedah Kedah 20 3.3 Kelantan Kelantan 24 3.4 Melaka Malacca 28 3.5 Negeri Sembilan Negeri Sembilan 32 3.6 Pahang Pahang 36 3.7 Perak Perak 40 3.8 Perlis Perlis 44 3.9 Pulau Pinang Penang 48 3.10 Selangor Selangor 52 3.11 Terengganu Terengganu 56 3.12 Sabah Sabah 60 3.13 Sarawak Sarawak 66 3.14 WP Labuan Federal Territory of Labuan 76

STATISTIK TANAMAN INDUSTRI - E
SENARAI JADUAL dan CARTA List of Tables and Charts
Jadual/Carta Tajuk Muka Surat Table/Chart Title Page
SEKSYEN 4 Luas Bertanam dan Pengeluaran Tanaman Industri Mengikut Jenis Pengurusan, Malaysia, 2017 Section 4 Planted Area and Production of Industrial Crops by Type of Management, Malaysia, 2017
4.1 Ringkasan Luas Bertanam dan Pengeluaran Tanaman Industri Mengikut Jenis Pengurusan, Malaysia, 2017 80
Planted Area and Production of Industrial Crops by Type of Management, Malaysia, 2017
4.2 Ringkasan Luas Bertanam dan Pengeluaran Tanaman Industri Mengikut Jenis Pengurusan dan Negeri, 82 Malaysia, 2017 Summary of Planted Area and Production of Industrial Crops by Type of Management and State, Malaysia 2017 4.2.1 hingga 4.2.3 Luas Bertanam dan Pengeluaran Tanaman Industri Mengikut Jenis Pengurusan dan Negeri, Malaysia, 2017 Planted Area and Production of Industrial Crops by Type of Management and State,Malaysia, 2017
4.2.1 Pekebun Kecil Smallholder 84 4.2.2 Estet Estate 88
4.2.3 Jabatan/Agensi Kerajaan Department/Government Agencies 92
STATISTIK TANAMAN INDUSTRI - F
SENARAI JADUAL dan CARTA List of Tables and Charts
Jadual/Carta Tajuk Muka Surat Table/Chart Title Page
SEKSYEN 5 Luas Bertanam dan Pengeluaran Tanaman Industri Mengikut Tanaman, Jenis Pengurusan dan Negeri, Malaysia, 2017 Section 5 Planted Area and Production of Industrial Crops by Crops, Type of Management and State, Malaysia, 2017
5.1 Kelapa Coconut 99 5.2 Kopi Coffee 102 5.3 Nipah Nipa Palm 106 5.4 Pinang Areca Nut 111 5.5 Roselle Roselle 115 5.6 Rumbia/Sagu Sago 119 5.7 Teh Tea 123 5.8 Cendawan Mushroom 126 5.9 Lebah Kelulut Kelulut Bee 131
5.10 Lebah Madu Honey Bee 135 5.11 Jagung Bijian Grain Corn 139
STATISTIK TANAMAN INDUSTRI - G
SENARAI JADUAL dan CARTA List of Tables and Charts
Jadual/Carta Tajuk Muka Surat Table/Chart Title Page
SEKSYEN 6 Luas Bertanam dan Pengeluaran Tanaman Industri Mengikut Jenis Pengurusan, Negeri, 2017 Section 6 Planted Area and Production of Industrial Crops by Type of Management, State, 2017
6.1 Johor Johore 143 6.2 Kedah Kedah 145 6.3 Kelantan Kelantan 147 6.4 Melaka Malacca 149 6.5 Negeri Sembilan Negri Sembilan 151 6.6 Pahang Pahang 153 6.7 Perak Perak 155 6.8 Perlis Perlis 157 6.9 Pulau Pinang Penang 159 6.10 Selangor Selangor 161 6.11 Terengganu Terengganu 163 6.12 Sabah Sabah 165 6.13 Sarawak Sarawak 167
6.14 WP Labuan Federal Territory of Labuan 169 SEKSYEN 7 Data Siri Masa – Ringkasan Luas Bertanam dan Pengeluaran Tanaman Industri, Malaysia, 2013 – 2017 Section 7 Time Series Data – Summary of Planted Area and Production of Industrial Crops, Malaysia, 2013 – 2017
7.1 Ringkasan Data Siri Masa Luas Bertanam dan Pengeluaran Tanaman Industri, Malaysia, 2013 – 2017 173 Summary of Time Series Data on Planted Area and Production of Industrial Crops, 2013 – 2017
STATISTIK TANAMAN INDUSTRI - H
SENARAI JADUAL dan CARTA List of Tables and Charts
Jadual/Carta Tajuk Muka Surat Table/Chart Title Page
SEKSYEN 8 Data Siri Masa – Luas Bertanam dan Pengeluaran Tanaman Industri Mengikut Negeri & Jenis Tanaman,
Malaysia, 2013 – 2017 Section 8 Time Series Data – Planted Area and Production of Industrial Crops by State & Type of Crops, Malaysia, 2013 – 2017
8.1 Kelapa Coconut 177
8.2 Kopi Coffee 179 8.3 Nipah Nipa Palm 181 8.4 Pinang Areca Nut 183 8.5 Roselle Roselle 185 8.6 Rumbia/Sagu Sago 187 8.7 Teh Tea 189 8.8 Cendawan Mushroom 191 8.9 Lebah Kelulut Kelulut Bee 193 8.10 Lebah Madu Honey Bee 195 8.11 Jagung Bijian Grain Corn 197 8.12 Ringkasan Summary 199
STATISTIK TANAMAN INDUSTRI - I
SENARAI JADUAL dan CARTA List of Tables and Charts
Jadual/Carta Tajuk Muka Surat Table/Chart Title Page
BAHAGIAN C STATISTIK TANAMAN INDUSTRI DI BAWAH KEMENTERIAN PERUSAHAAN PERLADANGAN DAN KOMODITI,
MALAYSIA (KPPK), 2017e PART C STATISTICS OF INDUSTRIAL CROPS UNDER MINISTRY OF PLANTATIONS INDUSTRIES AND COMMODITIES (MPIC), MALAYSIA, 2017e
SEKSYEN 9 Luas Bertanam dan Pengeluaran Tanaman Industri Utama Mengikut Jenis Pengurusan, Kawasan dan Negeri, Malaysia, 2017 (Data Sekunder : KPPK)
Section 9 Planted Area and Production of Main Industrial Crops by Type of Management, Region and State, Malaysia, 2017 (Secondary Data : MPIC)
9.0 Ringkasan Luas Bertanam dan Pengeluaran Tanaman Industri Utama, Malaysia, 2017e 204 Summary of Planted Area and Production of Main Industrial Crops, 2017e 9.1 Luas Bertanam dan Pengeluaran Getah Mengikut Jenis Pengurusan dan Kawasan, Malaysia, 2017e 205 Total Planted Area and Production of Rubber by Type of Management and Region, Malaysia, 2017e
9.2 Bertanam dan Pengeluaran Kelapa Sawit Mengikut Jenis Pengurusan dan Negeri, Malaysia, 2017e 206 Total Planted Area and Production of Oil Palm by Type of Management and State, Malaysia, 2017e
9.3 Luas Bertanam dan Pengeluaran Koko Mengikut Jenis Pengurusan dan Kawasan, Malaysia, 2017e 207
Total Planted Area and Production of Cocoa by Type of Management and Region, Malaysia, 2017e 9.4 Luas Bertanam dan Pengeluaran Lada Mengikut Kawasan, Malaysia, 2017e 208 Total Planted Area and Production of Pepper by Region, Malaysia, 2017e
9.5 Luas Bertanam dan Pengeluaran Tembakau Mengikut Jenis Tembakau dan Negeri, Malaysia, 2017e 209 Total Planted Area and Production of Tobacco by Type of Tobacco and State, Malaysia, 2017e
STATISTIK TANAMAN INDUSTRI - J
SENARAI JADUAL dan CARTA List of Tables and Charts
Jadual/Carta Tajuk Muka Surat Table/Chart Title Page
Lampiran 2 Senarai Tanaman Industri Mengikut Nama Tempatan, Inggeris dan Botani 212 Appendix 2 List of Industrial Crops by Local, English and Botanical Names
Lampiran 3 Jenis Pengurusan 213 Appendix 3 Type of Management
Lampiran 4 Sumber Rujukan 214 Appendix 4 Source of Reference Lampiran 5 Akronim 215 Appendix 5 Acronym
STATISTIK TANAMAN INDUSTRI - K
NOTA KETERANGAN
1. Pendahuluan
Statsitik tahun 2017 ini merupakan statistik tanaman industri melibatkan tanaman berikut:
a) Tanaman Industri di bawah Kementerian Pertanian dan Industri Asas Tani (MOA). b) Tanaman Industri di bawah Kementerian Perladangan Perindustrian dan Komoditi (KPPK).
2. Punca Maklumat dan Pengumpulan Data
Data bagi tanaman industri di bawah seliaan Kementerian Pertanian dan Industri Asas Tani, dikumpulkan secara tahunan dari Sistem AgrISGeoPortal yang diisi oleh Pembantu Pertanian Kawasan (PPK) secara bulanan. Bagi Sabah dan Sarawak, data dibekalkan oleh Jabatan Pertanian negeri masing-masing. Data yang dimajukan oleh negeri kemudiannya disemak dan disahkan bersama sebelum dicetak dan dibukukan. Bagi tanaman industri di bawah KPPK, data ditukarkan sebagai data sekunder.
EXPLANATORY NOTES 1. Introduction
The statistics for the year 2017 is report on industrial crops cover
the crops categorized as follows:
a) Industrial Crops under Ministry of Agriculture and Agro-based Industry (MOA).
b) Industrial Crops under Ministry of Plantation Industries and Commodities (MPIC).
2. Source of Information and Data Collection
Data for industrial crops that supervised under Ministry of Agriculture are compiled annually from AgrISGeoPortal collected monthly by Agriculture Assistants (AA’s). For Sabah and Sarawak, data supplied from each State Departments of Agriculture. Data submitted by the states then verified again together before printed and published. An industrial crop supplied by MPIC, the data has been changed to secondary data.
STATISTIK TANAMAN INDUSTRI - L
3. Konsep dan Liputan Luas Bertanam Tanaman 3.1 Luas Bertanam sesuatu tanaman adalah berasaskan kepada
Luas Bertanam Tanaman Setara (CHE). Luas Bertanam Tanaman Setara untuk tanaman kekal diperolehi melalui pengiraan jumlah bilangan pokok didalam sesuatu lot dibahagikan dengan bilangan pokok yang disyorkan sehektar bagi tanaman tersebut.
3.2 Bagi tanaman jangka pendek, Luas Bertanam Tanaman Setara
ialah jumlah luas bertanam yang ditanam beberapa kali setahun di atas kawasan yang sama.
3.3 Luas Bertanam tanaman merangkumi semua kawasan
pertanian di Malaysia termasuk di sektor pekebun kecil (individu dan kelompok), estet seperti FELDA, FELCRA dan RISDA, Rancangan Negeri, Jabatan/Agensi Kerajaan dan lain-lain skim pembangunan pertanian.
4. Anggaran Hasil Pengeluaran
4.1 Kaedah pengiraan anggaran hasil pengeluaran adalah berdasarkan kepada hasil potensi atau melalui rekod ladang.
3. Concept and Scope of Crop Planted Area
3.1 The Planted Area of each crop is based on the Crop Planted Area Equivalent (CHE). The CHE for a permanent crop is obtained by dividing the total number of trees planted on a particular lot by the recommended planting density per ha of that particular crop.
3.2 The CHE for short term crops is the total Planted Area Planted for
several times per year on the same area.
3.3 Crop Planted Area covers all agricultural areas in Malaysia including the small holder sectors (individual and Cluster Agricultural Projects/Group Farming ) estates such as FELDA, FELCRA and RISDA, States Schemes, Department / Government Agencies and other agriculture development schemes.
4. Estimation for Production 4.1 The method of estimating the production is based on potential
yield or farm record.
STATISTIK TANAMAN INDUSTRI - M
5. Konsep dan Definisi Konsep dan definisi yang digunakan adalah berasaskan
kepada syor daripada Pejabat Perangkaan Pertubuhan Bangsa-Bangsa Bersatu.
5.1 Estet Sebuah “estet” ditakrifkan sebagai : Satu kawasan, seluas lebih daripada 40.47 hektar (100 ekar)
dimana penanaman di bawah satu hak milik yang sah atau dalam keadaan tersusun.
5.2 Kebun Kecil
Ditakrifkan; satu kawasan, berkeluasan sama atau kurang
daripada 40.47 hektar (100 ekar), samada tersusun di bawah satu organisasi atau tidak tersusun.
Kebun Kecil yang tersusun termasuk kawasan dibawah
beberapa skim kerajaan seperti berikut : 5.2.1 Lembaga Kemajuan Tanah Persekutuan (FELDA) 5.2.2 Lembaga Penyatuan dan Pemulihan Tanah
Negara (FELCRA)
5. Concepts and Definitions
The definitions and concepts are based on the recommendations from the Statistical Office of the United Nations.
5.1 Estate An “estate” defined as: An areas, aggregating more than 40.47 hectares (100 acres),
planting is permitted and is under a single legal ownership or at normally organized.
5.2 Smallholdings
Defined an area, aggregating equal or less than 40.47 hectares (100 acres), whether organized or unorganized.
For the organized smallholdings include those areas under government schemes as follows:
5.2.1 Federal Land Development Authority (FELDA)
5.2.2 Federal Land Consolidation and Rehabilitation Authority
(FELCRA)
STATISTIK TANAMAN INDUSTRI - N
5.2.3 Pihak Berkuasa Kemajuan Pekebun Kecil Perusahaan Getah (RISDA)
5.2.4 Rancangan/Projek Tanah Kerajaan Persekutuan yang lain
5.2.5 Rancangan Tanah Kerajaan Negeri 5.2.6 Lain-lain
Singkatan yang digunakan : Simbol Keterangan - tidak ada n.a tidak diperolehi 0 data kurang dari 0.1ha Ha hektar Mt tan metrik
Catatan : Oleh kerana proses pembulatan angka dengan titik perpuluhan kepada angka penuh, jumlah angka yang berhampiran tidak sama dengan campuran satu persatu bagi tiap-tiap ruangan (dan baris) di Bahagian A, B dan C dalam laporan ini.
5.2.3 Rubber Industry Smallholders Development Authority (RISDA)
5.2.4 Other Federal Government Land Schemes/Projects
5.2.5 State Government Land Schemes
5.2.6 Others
Abbreviations used: Symbol Description - nil n.a not available 0 data less than 0.1ha Ha hectarage Mt metric tan Note: Due to the process of rounding of numbers with decimal points to the nearest whole number, the resulted totals maybe do not add up to its individual column (and row) summation in section A, B & C of this report.
BAHAGIAN A
Part A
DATA PENTING – TANAMAN INDUSTRI, MALAYSIA, 2017
Key Data – Industrial Crops, Malaysia 2017

SEKSYEN 1 Section 1
RINGKASAN LUAS BERTANAM DAN PENGELUARAN TANAMAN INDUSTRI, MALAYSIA, 2017
Summary of Planted Area and Production of
Industrial Crops, Malaysia, 2017

STATISTIK TANAMAN INDUSTRI - 3
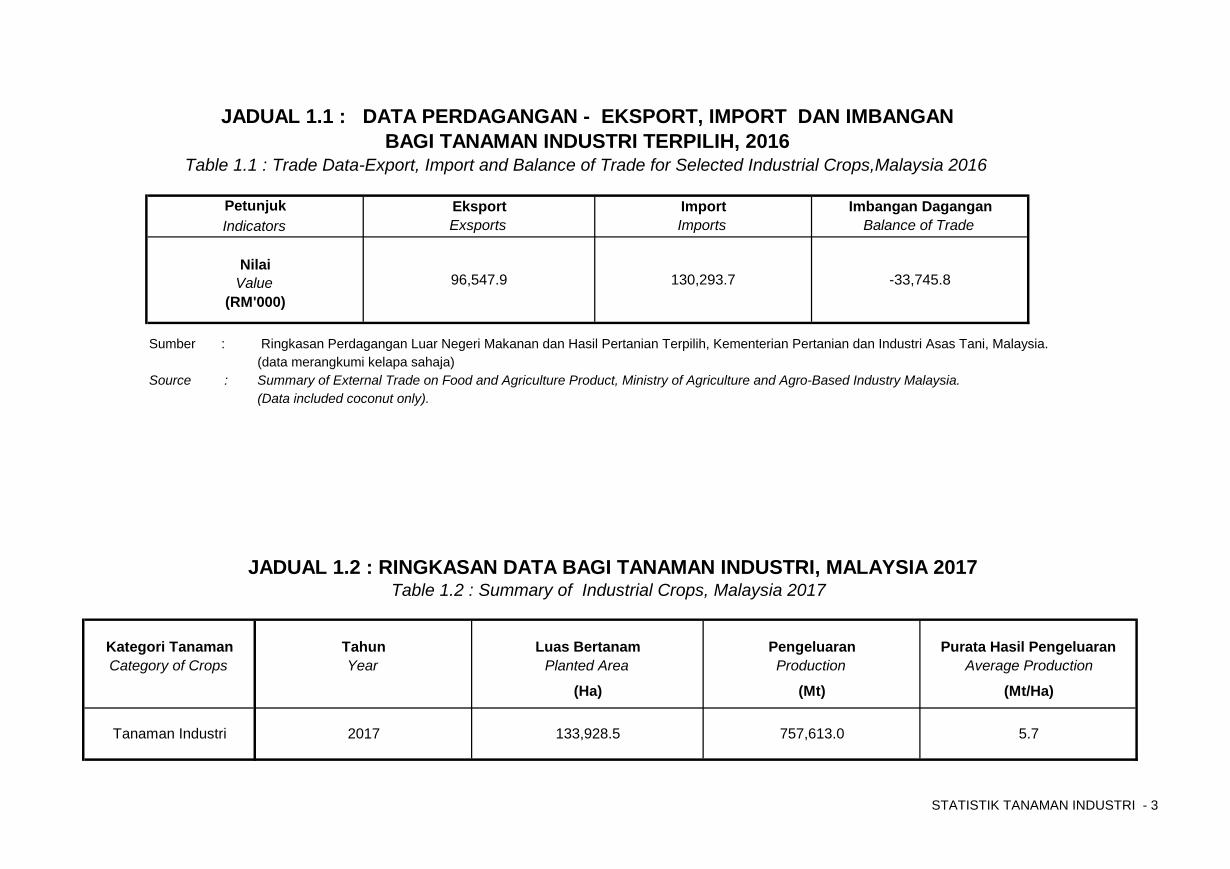
Sumber : Ringkasan Perdagangan Luar Negeri Makanan dan Hasil Pertanian Terpilih, Kementerian Pertanian dan Industri Asas Tani, Malaysia.(data merangkumi kelapa sahaja)
Source : Summary of External Trade on Food and Agriculture Product, Ministry of Agriculture and Agro-Based Industry Malaysia.(Data included coconut only).
Tanaman Industri 2017 133,928.5 757,613.0 5.7
Purata Hasil PengeluaranCategory of Crops Year Planted Area Production Average Production
(RM'000)
(Ha) (Mt)
96,547.9 130,293.7 -33,745.8Value
(Mt/Ha)
JADUAL 1.2 : RINGKASAN DATA BAGI TANAMAN INDUSTRI, MALAYSIA 2017Table 1.2 : Summary of Industrial Crops, Malaysia 2017
Kategori Tanaman Tahun Luas Bertanam Pengeluaran
JADUAL 1.1 : DATA PERDAGANGAN - EKSPORT, IMPORT DAN IMBANGAN BAGI TANAMAN INDUSTRI TERPILIH, 2016
Table 1.1 : Trade Data-Export, Import and Balance of Trade for Selected Industrial Crops,Malaysia 2016
Nilai
EksportImports
Imbangan DaganganImportBalance of TradeIndicators Exsports
Petunjuk
STATISTIK TANAMAN INDUSTRI - 4
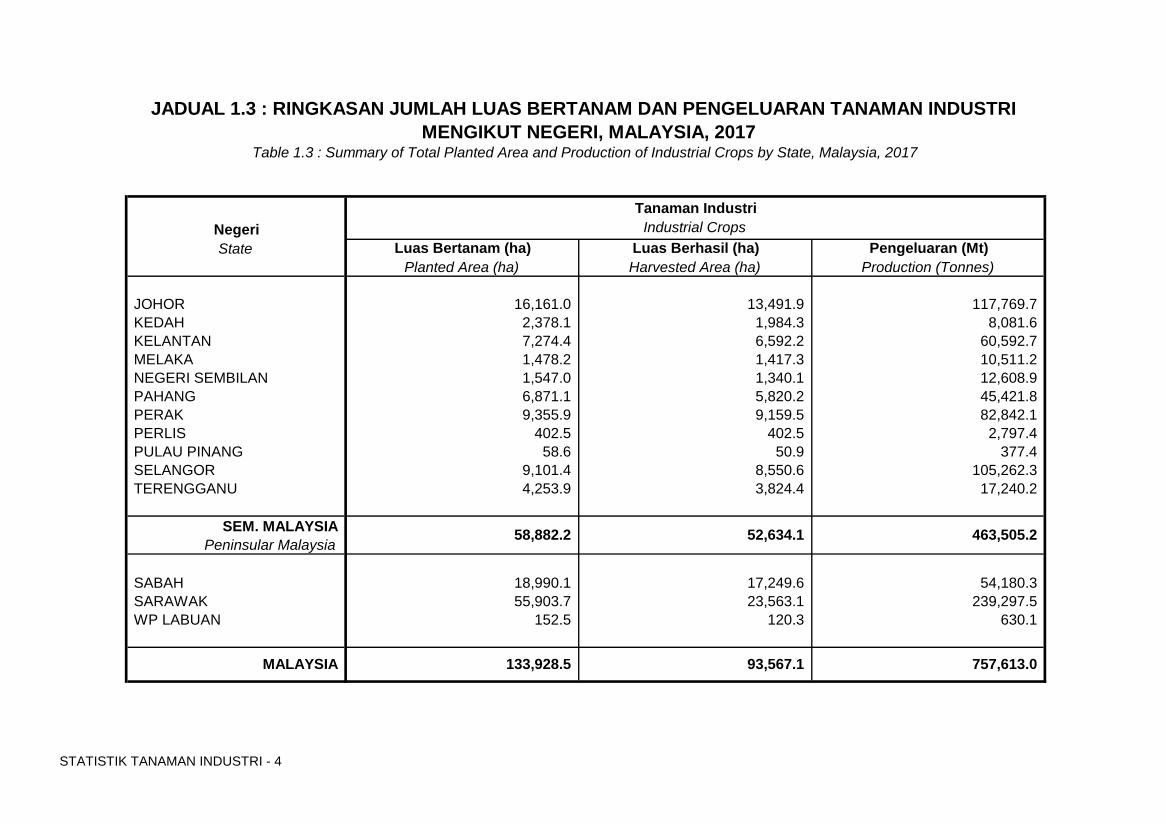
NegeriState Luas Bertanam (ha) Luas Berhasil (ha) Pengeluaran (Mt)
Planted Area (ha) Harvested Area (ha) Production (Tonnes)
JOHOR 16,161.0 13,491.9 117,769.7 KEDAH 2,378.1 1,984.3 8,081.6 KELANTAN 7,274.4 6,592.2 60,592.7 MELAKA 1,478.2 1,417.3 10,511.2 NEGERI SEMBILAN 1,547.0 1,340.1 12,608.9 PAHANG 6,871.1 5,820.2 45,421.8 PERAK 9,355.9 9,159.5 82,842.1 PERLIS 402.5 402.5 2,797.4 PULAU PINANG 58.6 50.9 377.4 SELANGOR 9,101.4 8,550.6 105,262.3 TERENGGANU 4,253.9 3,824.4 17,240.2
SEM. MALAYSIAPeninsular Malaysia
SABAH 18,990.1 17,249.6 54,180.3 SARAWAK 55,903.7 23,563.1 239,297.5 WP LABUAN 152.5 120.3 630.1
MALAYSIA 133,928.5 93,567.1 757,613.0
JADUAL 1.3 : RINGKASAN JUMLAH LUAS BERTANAM DAN PENGELUARAN TANAMAN INDUSTRI MENGIKUT NEGERI, MALAYSIA, 2017
Table 1.3 : Summary of Total Planted Area and Production of Industrial Crops by State, Malaysia, 2017
58,882.2
Tanaman IndustriIndustrial Crops
463,505.2 52,634.1
STATISTIK TANAMAN INDUSTRI - 5
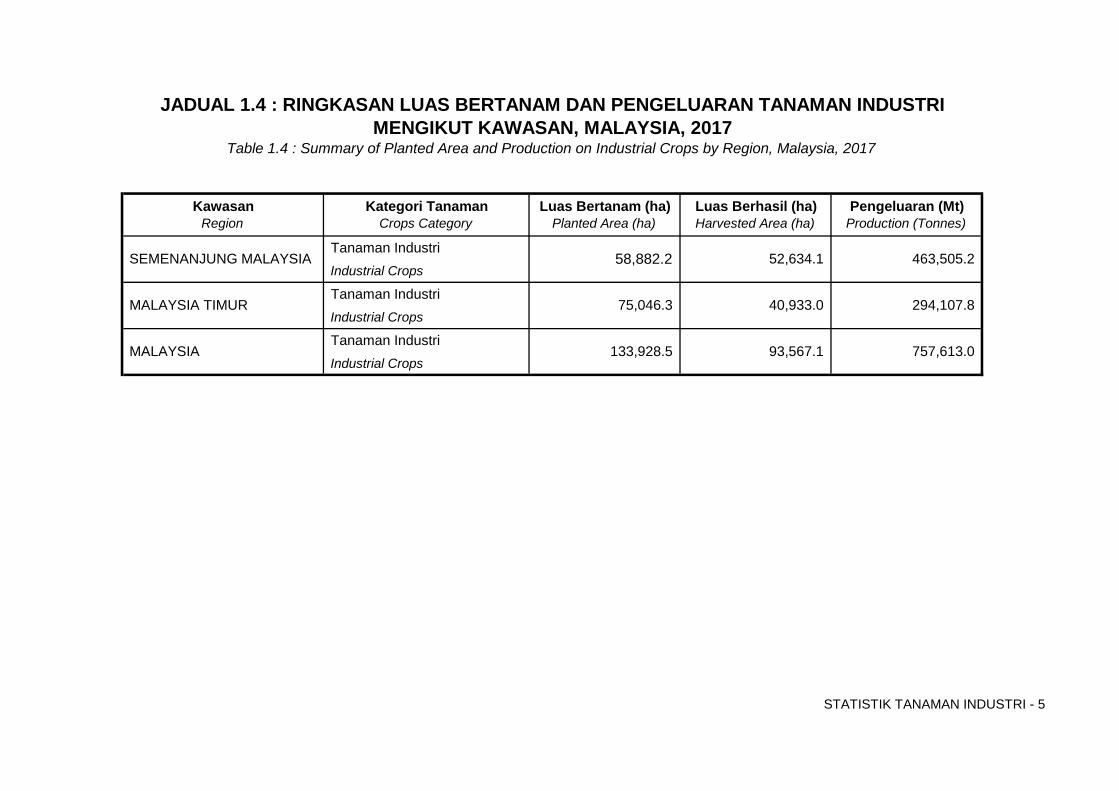
Kawasan Kategori Tanaman Luas Bertanam (ha) Luas Berhasil (ha) Pengeluaran (Mt)Region Crops Category Planted Area (ha) Harvested Area (ha) Production (Tonnes)
Tanaman IndustriIndustrial Crops
Tanaman IndustriIndustrial Crops
Tanaman IndustriIndustrial Crops
75,046.3 40,933.0
MALAYSIA
294,107.8
133,928.5 93,567.1 757,613.0
MALAYSIA TIMUR
JADUAL 1.4 : RINGKASAN LUAS BERTANAM DAN PENGELUARAN TANAMAN INDUSTRIMENGIKUT KAWASAN, MALAYSIA, 2017
Table 1.4 : Summary of Planted Area and Production on Industrial Crops by Region, Malaysia, 2017
58,882.2 52,634.1 463,505.2 SEMENANJUNG MALAYSIA

Muka surat ini sengaja dibiarkan kosong
BAHAGIAN B Part B
STATISTIK TANAMAN INDUSTRI DI BAWAH JABATAN PERTANIAN (JP), MALAYSIA, 2017
Statistics of Industrial Crops Under Department of
Agriculture (DOA), Malaysia, 2017
SEKSYEN 2
Section 2
LUAS BERTANAM DAN PENGELUARAN TANAMAN INDUSTRI MENGIKUT NEGERI, MALAYSIA, 2017
Planted Area and Production of Industrial Crops
By State, Malaysia, 2017
STATISTIK TANAMAN INDUSTRI - 9
NegeriState Luas Bertanam (ha) Luas Berhasil (ha) Pengeluaran (Mt) Luas Bertanam (ha) Luas Berhasil (ha) Pengeluaran (Mt) Luas Bertanam (ha) Luas Berhasil (ha) Pengeluaran (Mt)
Planted Area(ha) Harvested Area (ha) Production (Tonnes) Planted Area(ha) Harvested Area (ha) Production (Tonnes) Planted Area(ha) Harvested Area (ha) Production (Tonnes)
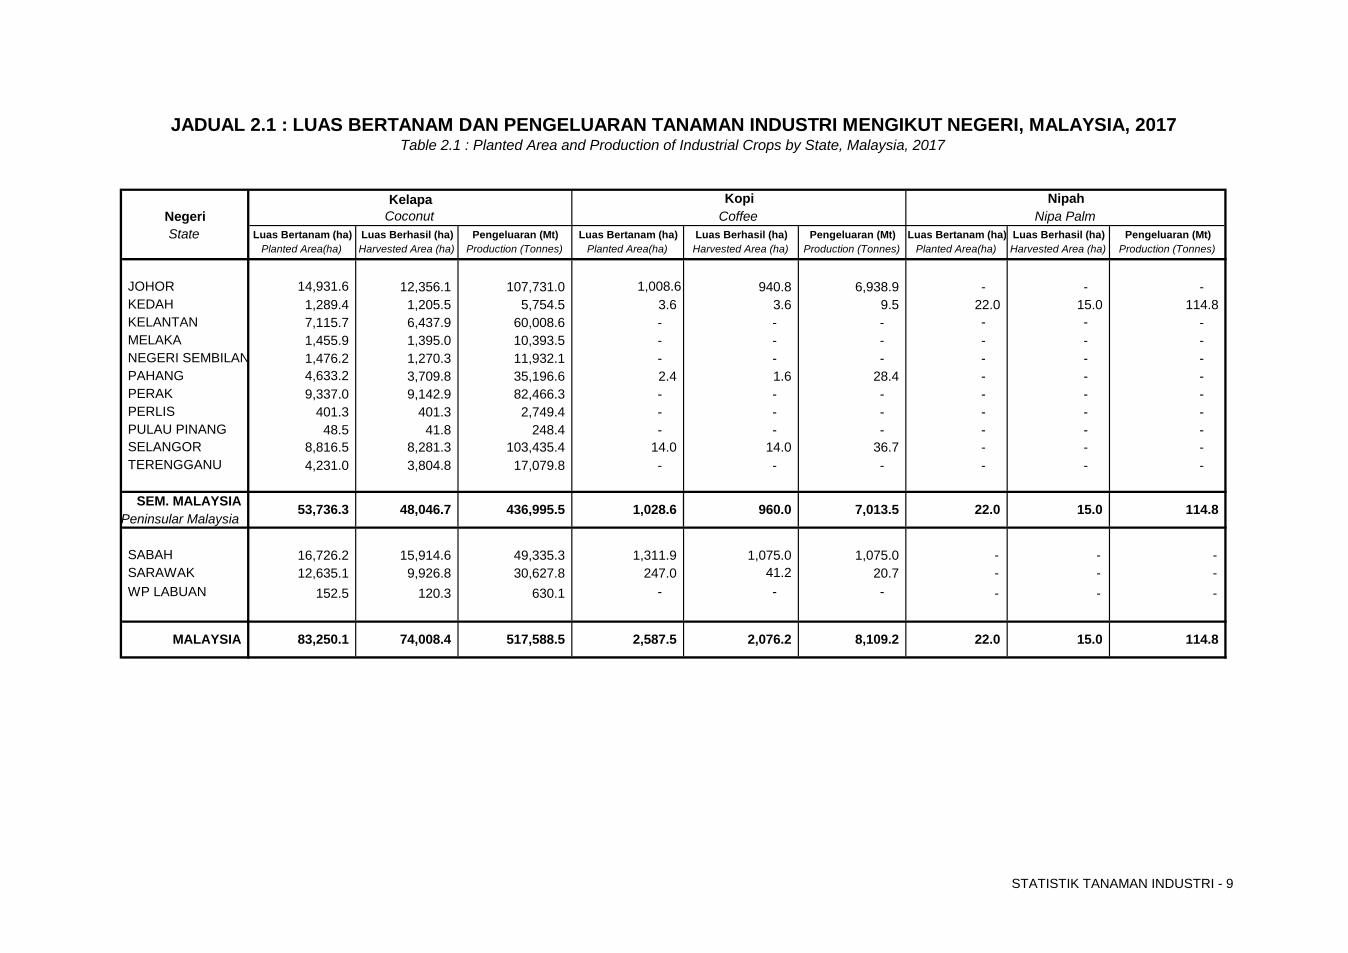
JOHOR 14,931.6 12,356.1 107,731.0 1,008.6 940.8 6,938.9 - - - KEDAH 1,289.4 1,205.5 5,754.5 3.6 3.6 9.5 22.0 15.0 114.8 KELANTAN 7,115.7 6,437.9 60,008.6 - - - - - - MELAKA 1,455.9 1,395.0 10,393.5 - - - - - - NEGERI SEMBILAN 1,476.2 1,270.3 11,932.1 - - - - - - PAHANG 4,633.2 3,709.8 35,196.6 2.4 1.6 28.4 - - - PERAK 9,337.0 9,142.9 82,466.3 - - - - - - PERLIS 401.3 401.3 2,749.4 - - - - - - PULAU PINANG 48.5 41.8 248.4 - - - - - - SELANGOR 8,816.5 8,281.3 103,435.4 14.0 14.0 36.7 - - - TERENGGANU 4,231.0 3,804.8 17,079.8 - - - - - -
SEM. MALAYSIAPeninsular Malaysia
SABAH 16,726.2 15,914.6 49,335.3 1,311.9 1,075.0 1,075.0 - - - SARAWAK 12,635.1 9,926.8 30,627.8 247.0 41.2 20.7 - - - WP LABUAN 152.5 120.3 630.1 - - - - - -
JADUAL 2.1 : LUAS BERTANAM DAN PENGELUARAN TANAMAN INDUSTRI MENGIKUT NEGERI, MALAYSIA, 2017Table 2.1 : Planted Area and Production of Industrial Crops by State, Malaysia, 2017
Kelapa Kopi Nipah
15.0 114.8
Coconut Coffee Nipa Palm
MALAYSIA 83,250.1 517,588.5
22.0 960.0 7,013.5 53,736.3 48,046.7 436,995.5 1,028.6
15.0 114.8 2,076.2 8,109.2 74,008.4 2,587.5 22.0
STATISTIK TANAMAN INDUSTRI - 10
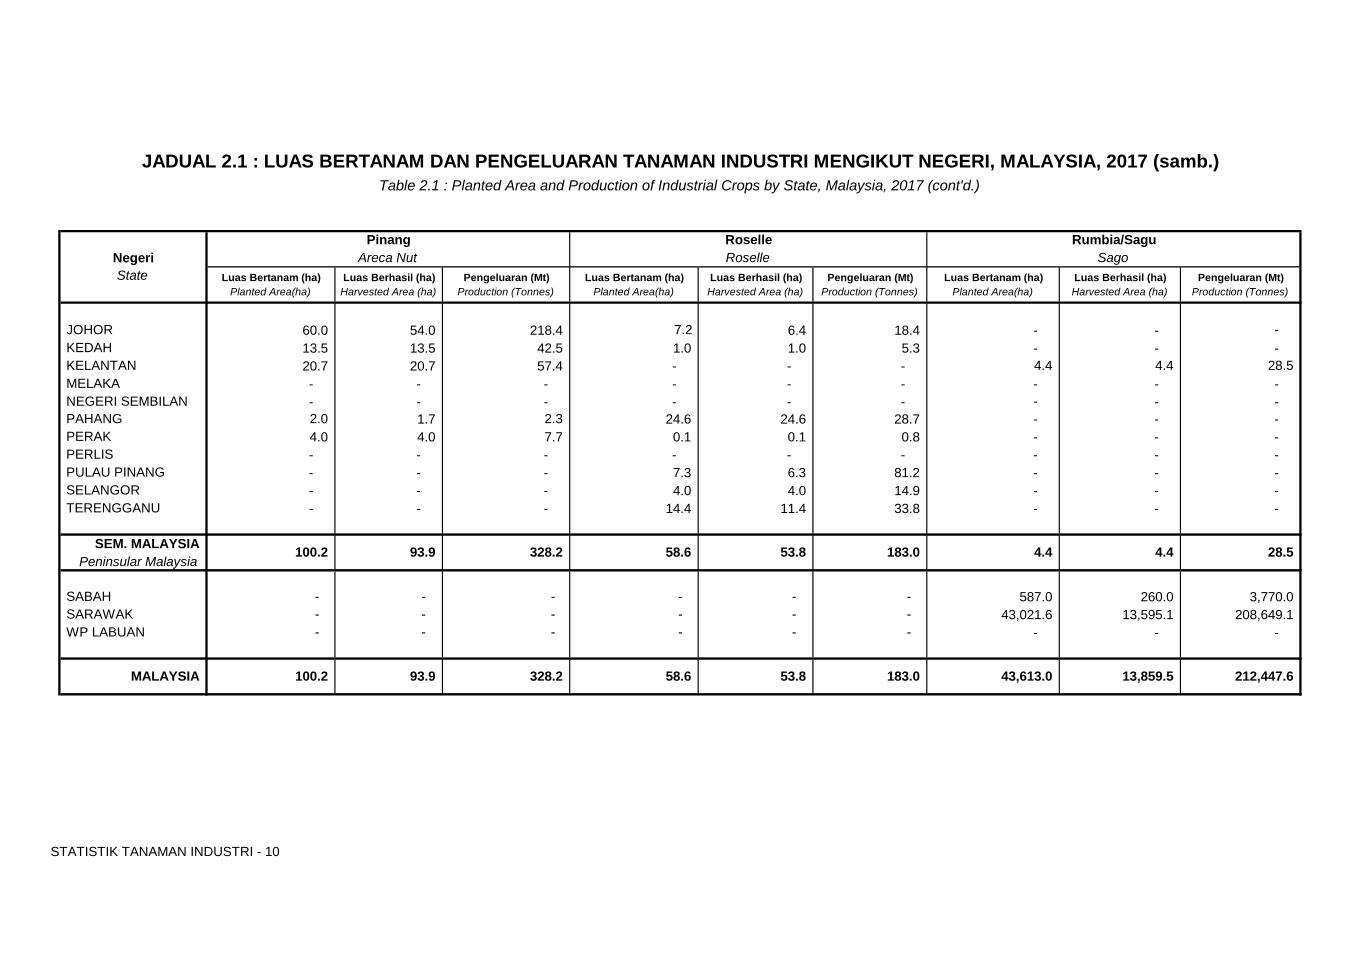
NegeriState Luas Bertanam (ha) Luas Berhasil (ha) Pengeluaran (Mt) Luas Bertanam (ha) Luas Berhasil (ha) Pengeluaran (Mt) Luas Bertanam (ha) Luas Berhasil (ha) Pengeluaran (Mt)
Planted Area(ha) Harvested Area (ha) Production (Tonnes) Planted Area(ha) Harvested Area (ha) Production (Tonnes) Planted Area(ha) Harvested Area (ha) Production (Tonnes)
JOHOR 60.0 54.0 218.4 7.2 6.4 18.4 - - - KEDAH 13.5 13.5 42.5 1.0 1.0 5.3 - - - KELANTAN 20.7 20.7 57.4 - - - 4.4 4.4 28.5 MELAKA - - - - - - - - - NEGERI SEMBILAN - - - - - - - - - PAHANG 2.0 1.7 2.3 24.6 24.6 28.7 - - - PERAK 4.0 4.0 7.7 0.1 0.1 0.8 - - - PERLIS - - - - - - - - - PULAU PINANG - - - 7.3 6.3 81.2 - - - SELANGOR - - - 4.0 4.0 14.9 - - - TERENGGANU - - - 14.4 11.4 33.8 - - -
SEM. MALAYSIAPeninsular Malaysia
SABAH - - - - - - 587.0 260.0 3,770.0 SARAWAK - - - - - - 43,021.6 13,595.1 208,649.1 WP LABUAN - - - - - - - - -
212,447.6
4.4 4.4 28.5
MALAYSIA 100.2 43,613.0 13,859.5 93.9 328.2 58.6 53.8 183.0
100.2 93.9 328.2 58.6 53.8
JADUAL 2.1 : LUAS BERTANAM DAN PENGELUARAN TANAMAN INDUSTRI MENGIKUT NEGERI, MALAYSIA, 2017 (samb.)Table 2.1 : Planted Area and Production of Industrial Crops by State, Malaysia, 2017 (cont'd.)
183.0
Pinang Roselle Rumbia/SaguAreca Nut Roselle Sago
STATISTIK TANAMAN INDUSTRI - 11
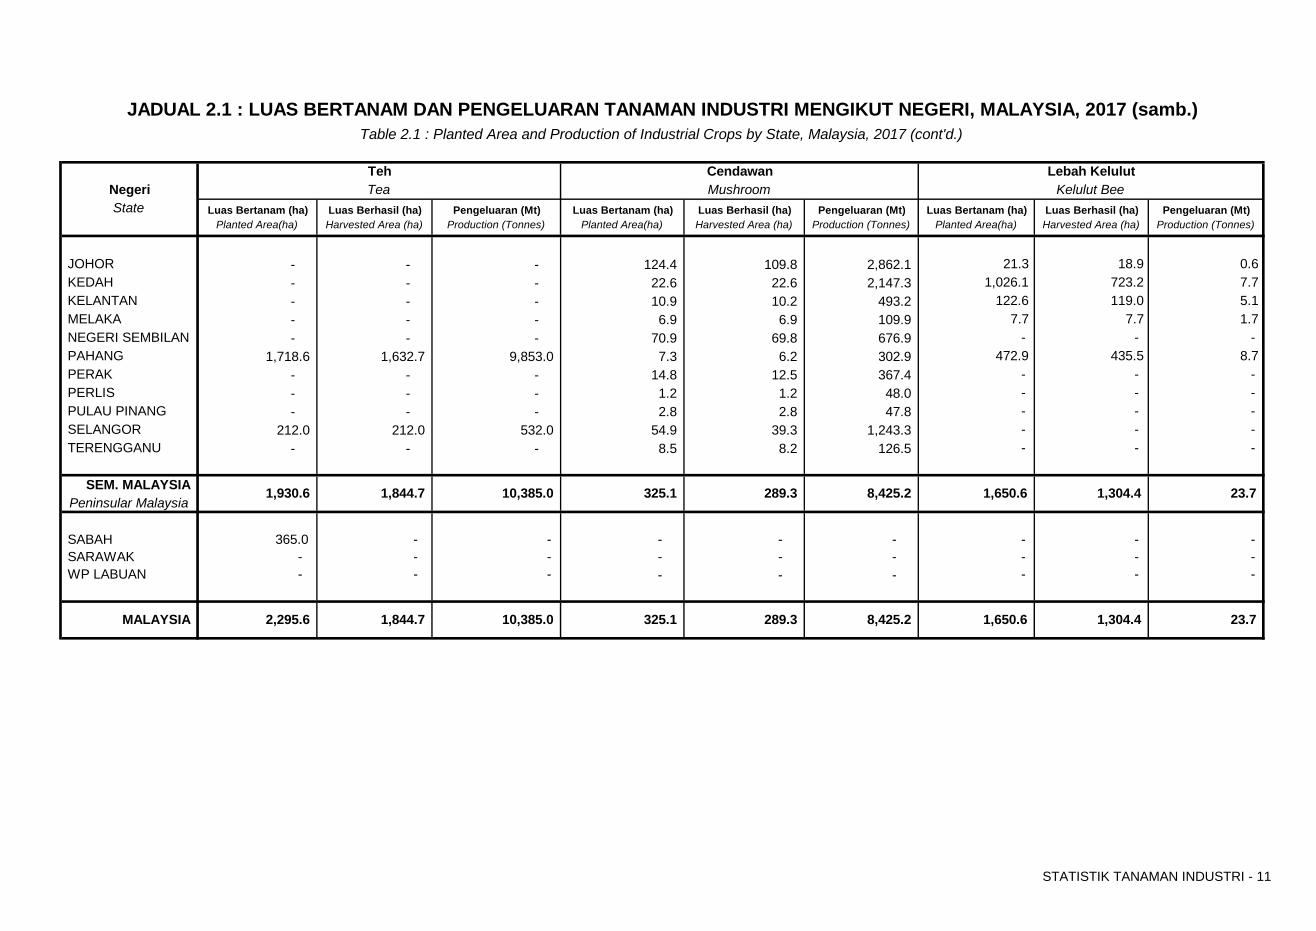
NegeriState Luas Bertanam (ha) Luas Berhasil (ha) Pengeluaran (Mt) Luas Bertanam (ha) Luas Berhasil (ha) Pengeluaran (Mt) Luas Bertanam (ha) Luas Berhasil (ha) Pengeluaran (Mt)
Planted Area(ha) Harvested Area (ha) Production (Tonnes) Planted Area(ha) Harvested Area (ha) Production (Tonnes) Planted Area(ha) Harvested Area (ha) Production (Tonnes)
JOHOR - - - 124.4 109.8 2,862.1 21.3 18.9 0.6 KEDAH - - - 22.6 22.6 2,147.3 1,026.1 723.2 7.7 KELANTAN - - - 10.9 10.2 493.2 122.6 119.0 5.1 MELAKA - - - 6.9 6.9 109.9 7.7 7.7 1.7 NEGERI SEMBILAN - - - 70.9 69.8 676.9 - - - PAHANG 1,718.6 1,632.7 9,853.0 7.3 6.2 302.9 472.9 435.5 8.7 PERAK - - - 14.8 12.5 367.4 - - - PERLIS - - - 1.2 1.2 48.0 - - - PULAU PINANG - - - 2.8 2.8 47.8 - - - SELANGOR 212.0 212.0 532.0 54.9 39.3 1,243.3 - - - TERENGGANU - - - 8.5 8.2 126.5 - - -
SEM. MALAYSIAPeninsular Malaysia
SABAH 365.0 - - - - - - - - SARAWAK - - - - - - - - - WP LABUAN - - - - - - - - -
JADUAL 2.1 : LUAS BERTANAM DAN PENGELUARAN TANAMAN INDUSTRI MENGIKUT NEGERI, MALAYSIA, 2017 (samb.)Table 2.1 : Planted Area and Production of Industrial Crops by State, Malaysia, 2017 (cont'd.)
Teh Cendawan Lebah KelulutTea Mushroom Kelulut Bee
1,930.6 1,844.7 10,385.0 325.1
23.7
23.7
MALAYSIA 2,295.6 1,844.7 10,385.0 325.1 289.3 8,425.2 1,650.6 1,304.4
289.3 8,425.2 1,650.6 1,304.4
STATISTIK TANAMAN INDUSTRI - 12
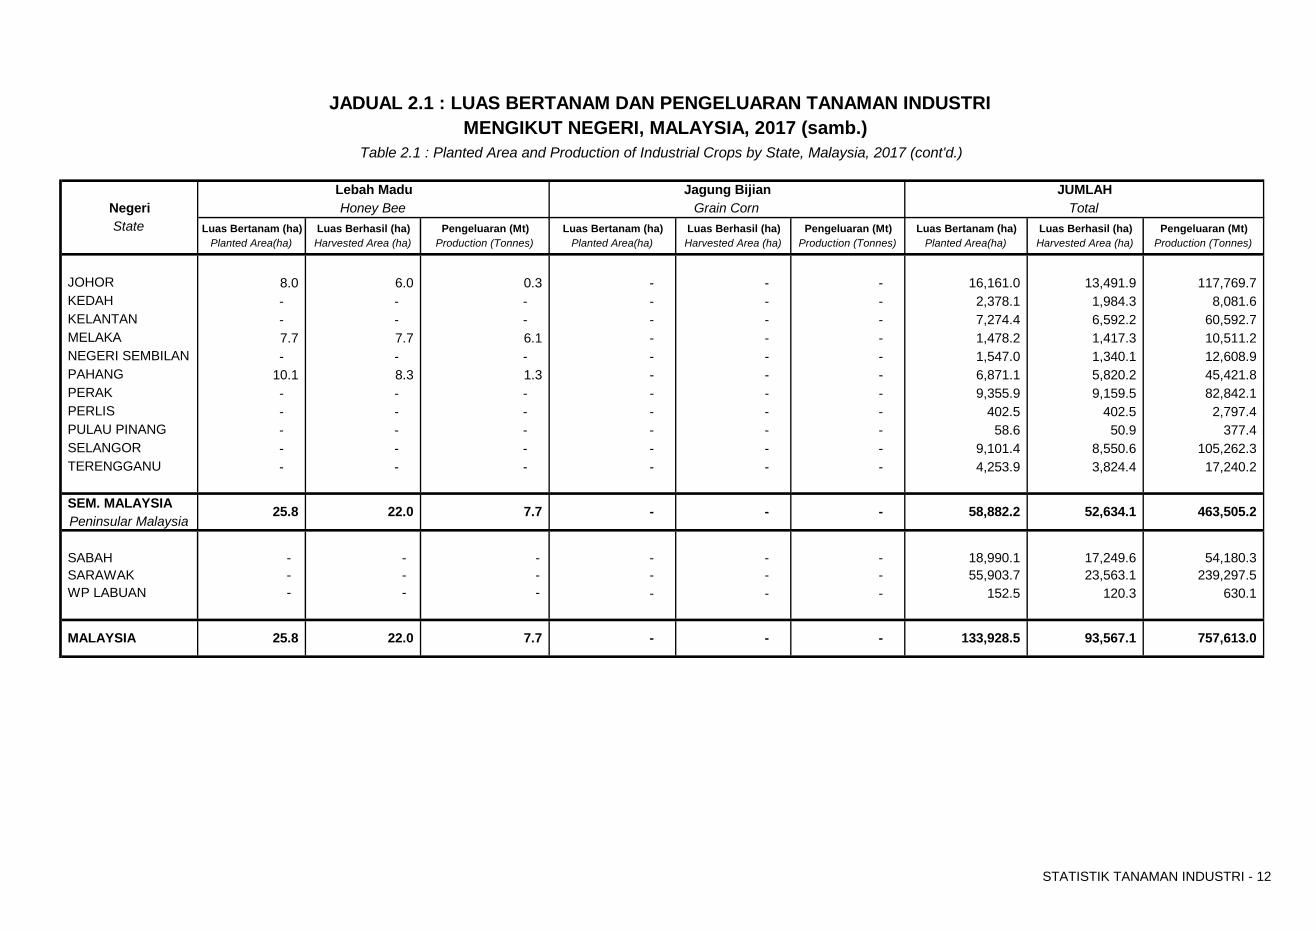
NegeriState Luas Bertanam (ha) Luas Berhasil (ha) Pengeluaran (Mt) Luas Bertanam (ha) Luas Berhasil (ha) Pengeluaran (Mt) Luas Bertanam (ha) Luas Berhasil (ha) Pengeluaran (Mt)
Planted Area(ha) Harvested Area (ha) Production (Tonnes) Planted Area(ha) Harvested Area (ha) Production (Tonnes) Planted Area(ha) Harvested Area (ha) Production (Tonnes)
JOHOR 8.0 6.0 0.3 - - - 16,161.0 13,491.9 117,769.7 KEDAH - - - - - - 2,378.1 1,984.3 8,081.6 KELANTAN - - - - - - 7,274.4 6,592.2 60,592.7 MELAKA 7.7 7.7 6.1 - - - 1,478.2 1,417.3 10,511.2 NEGERI SEMBILAN - - - - - - 1,547.0 1,340.1 12,608.9 PAHANG 10.1 8.3 1.3 - - - 6,871.1 5,820.2 45,421.8 PERAK - - - - - - 9,355.9 9,159.5 82,842.1 PERLIS - - - - - - 402.5 402.5 2,797.4 PULAU PINANG - - - - - - 58.6 50.9 377.4 SELANGOR - - - - - - 9,101.4 8,550.6 105,262.3 TERENGGANU - - - - - - 4,253.9 3,824.4 17,240.2
SEM. MALAYSIAPeninsular Malaysia
SABAH - - - - - - 18,990.1 17,249.6 54,180.3 SARAWAK - - - - - - 55,903.7 23,563.1 239,297.5 WP LABUAN - - - - - - 152.5 120.3 630.1
Lebah Madu Jagung Bijian
JADUAL 2.1 : LUAS BERTANAM DAN PENGELUARAN TANAMAN INDUSTRI MENGIKUT NEGERI, MALAYSIA, 2017 (samb.)
Table 2.1 : Planted Area and Production of Industrial Crops by State, Malaysia, 2017 (cont'd.)
Honey Bee Grain Corn
25.8 22.0 7.7 -
MALAYSIA 25.8 22.0 7.7 - - -
- -
JUMLAHTotal
58,882.2 52,634.1 463,505.2
133,928.5 93,567.1 757,613.0

Muka surat ini sengaja dibiarkan kosong
SEKSYEN 3 Section 3
LUAS BERTANAM DAN PENGELUARAN TAMANAN INDUSTRI MENGIKUT NEGERI DAN DAERAH, 2017
Planted Area and Production of Industrial Crops
By State and District, 2017

JOHOR
JOHORE
STATISTIK TANAMAN INDUSTRI - 16
Luas Bertanam (ha) Luas Berhasil (ha) Pengeluaran (Mt) Luas Bertanam (ha) Luas Berhasil (ha) Pengeluaran (Mt) Luas Bertanam (ha) Luas Berhasil (ha) Pengeluaran (Mt)Planted Area (ha) Harvested Area (ha) Production (Tonnes) Planted Area (ha) Harvested Area (ha) Production (Tonnes) Planted Area (ha) Harvested Area (ha) Production (Tonnes)
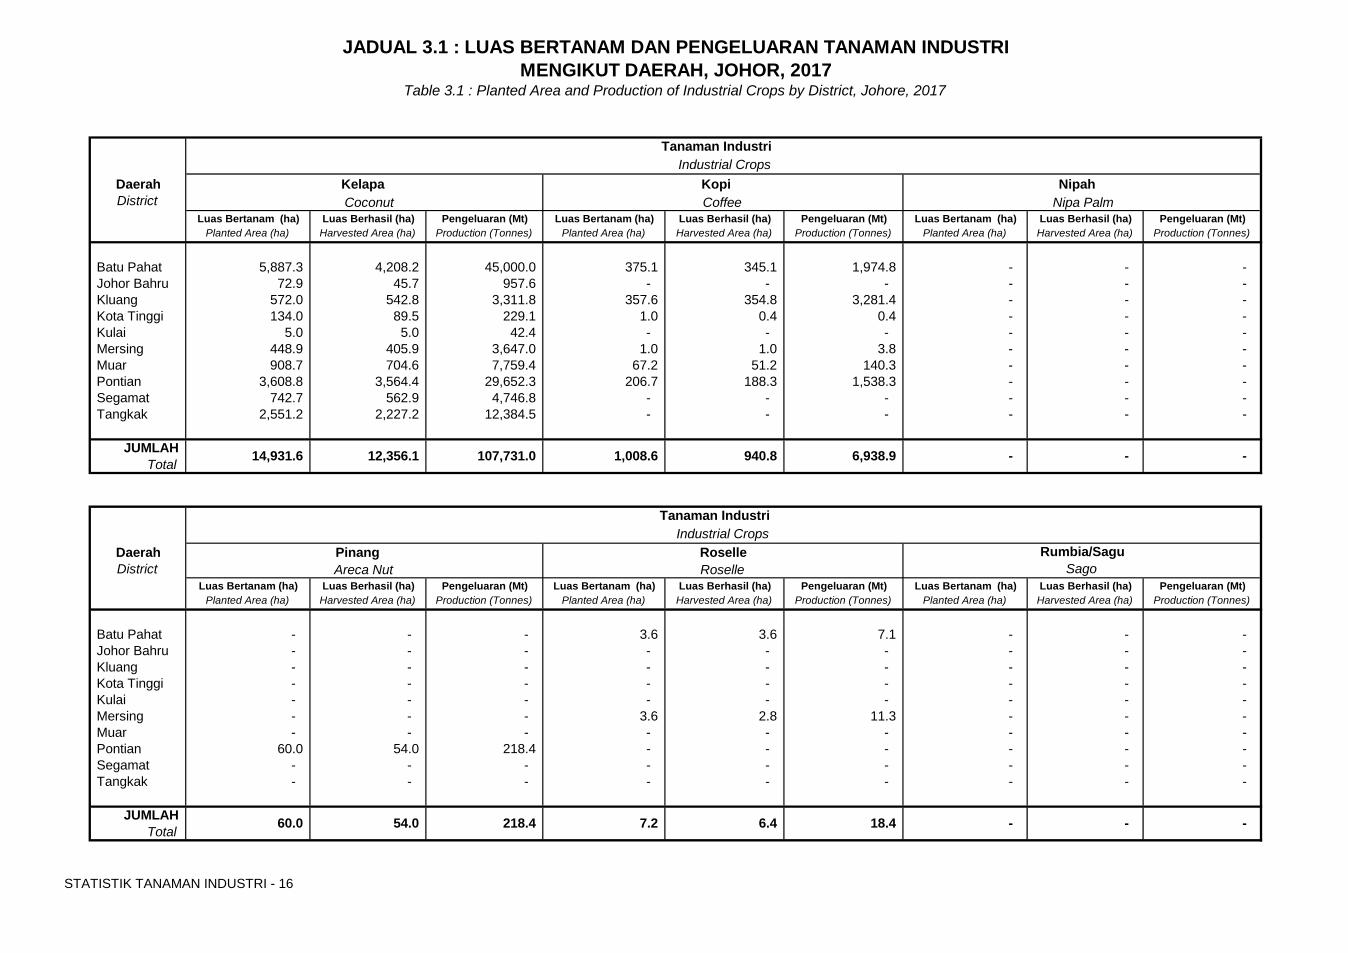
Batu Pahat 5,887.3 4,208.2 45,000.0 375.1 345.1 1,974.8 - - - Johor Bahru 72.9 45.7 957.6 - - - - - - Kluang 572.0 542.8 3,311.8 357.6 354.8 3,281.4 - - - Kota Tinggi 134.0 89.5 229.1 1.0 0.4 0.4 - - - Kulai 5.0 5.0 42.4 - - - - - - Mersing 448.9 405.9 3,647.0 1.0 1.0 3.8 - - - Muar 908.7 704.6 7,759.4 67.2 51.2 140.3 - - - Pontian 3,608.8 3,564.4 29,652.3 206.7 188.3 1,538.3 - - - Segamat 742.7 562.9 4,746.8 - - - - - - Tangkak 2,551.2 2,227.2 12,384.5 - - - - - -
JUMLAHTotal
Luas Bertanam (ha) Luas Berhasil (ha) Pengeluaran (Mt) Luas Bertanam (ha) Luas Berhasil (ha) Pengeluaran (Mt) Luas Bertanam (ha) Luas Berhasil (ha) Pengeluaran (Mt)Planted Area (ha) Harvested Area (ha) Production (Tonnes) Planted Area (ha) Harvested Area (ha) Production (Tonnes) Planted Area (ha) Harvested Area (ha) Production (Tonnes)
Batu Pahat - - - 3.6 3.6 7.1 - - - Johor Bahru - - - - - - - - - Kluang - - - - - - - - - Kota Tinggi - - - - - - - - - Kulai - - - - - - - - - Mersing - - - 3.6 2.8 11.3 - - - Muar - - - - - - - - - Pontian 60.0 54.0 218.4 - - - - - - Segamat - - - - - - - - - Tangkak - - - - - - - - -
JUMLAHTotal
Sago
-
Tanaman Industri
7.2 - 54.0
Pinang Rumbia/SaguRoselle
14,931.6
Table 3.1 : Planted Area and Production of Industrial Crops by District, Johore, 2017
Daerah
Tanaman Industri
- 60.0
Industrial Crops
Coconut
18.4 218.4 6.4
1,008.6
District
Industrial Crops
Areca Nut RoselleDaerah
JADUAL 3.1 : LUAS BERTANAM DAN PENGELUARAN TANAMAN INDUSTRI MENGIKUT DAERAH, JOHOR, 2017
940.8 6,938.9 -
Nipah Kopi Kelapa
- 12,356.1
Nipa Palm
-
CoffeeDistrict
107,731.0
STATISTIK TANAMAN INDUSTRI - 17
Luas Bertanam (ha) Luas Berhasil (ha) Pengeluaran (Mt) Luas Bertanam (ha) Luas Berhasil (ha) Pengeluaran (Mt) Luas Bertanam (ha) Luas Berhasil (ha) Pengeluaran (Mt)Planted Area (ha) Harvested Area (ha) Production (Tonnes) Planted Area (ha) Harvested Area (ha) Production (Tonnes) Planted Area (ha) Harvested Area (ha) Production (Tonnes)
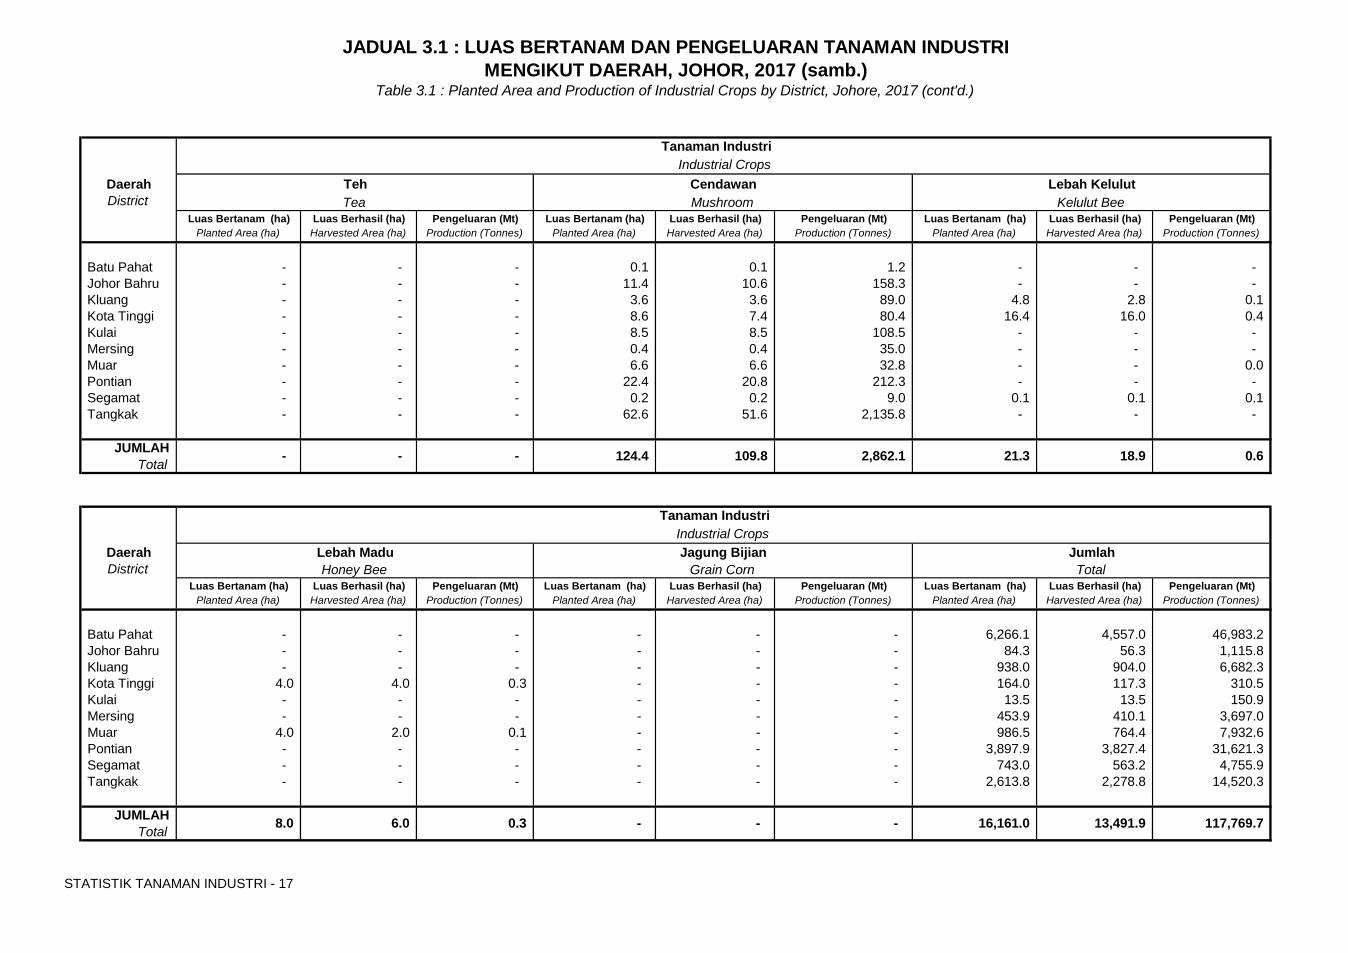
Batu Pahat - - - 0.1 0.1 1.2 - - - Johor Bahru - - - 11.4 10.6 158.3 - - - Kluang - - - 3.6 3.6 89.0 4.8 2.8 0.1 Kota Tinggi - - - 8.6 7.4 80.4 16.4 16.0 0.4 Kulai - - - 8.5 8.5 108.5 - - - Mersing - - - 0.4 0.4 35.0 - - - Muar - - - 6.6 6.6 32.8 - - 0.0 Pontian - - - 22.4 20.8 212.3 - - - Segamat - - - 0.2 0.2 9.0 0.1 0.1 0.1 Tangkak - - - 62.6 51.6 2,135.8 - - -
JUMLAHTotal
Luas Bertanam (ha) Luas Berhasil (ha) Pengeluaran (Mt) Luas Bertanam (ha) Luas Berhasil (ha) Pengeluaran (Mt) Luas Bertanam (ha) Luas Berhasil (ha) Pengeluaran (Mt)Planted Area (ha) Harvested Area (ha) Production (Tonnes) Planted Area (ha) Harvested Area (ha) Production (Tonnes) Planted Area (ha) Harvested Area (ha) Production (Tonnes)
Batu Pahat - - - - - - 6,266.1 4,557.0 46,983.2 Johor Bahru - - - - - - 84.3 56.3 1,115.8 Kluang - - - - - - 938.0 904.0 6,682.3 Kota Tinggi 4.0 4.0 0.3 - - - 164.0 117.3 310.5 Kulai - - - - - - 13.5 13.5 150.9 Mersing - - - - - - 453.9 410.1 3,697.0 Muar 4.0 2.0 0.1 - - - 986.5 764.4 7,932.6 Pontian - - - - - - 3,897.9 3,827.4 31,621.3 Segamat - - - - - - 743.0 563.2 4,755.9 Tangkak - - - - - - 2,613.8 2,278.8 14,520.3
JUMLAHTotal
JADUAL 3.1 : LUAS BERTANAM DAN PENGELUARAN TANAMAN INDUSTRI MENGIKUT DAERAH, JOHOR, 2017 (samb.)
109.8 2,862.1 18.9
Lebah KelulutCendawanTeh
21.3 -
Kelulut Bee
0.6
MushroomDistrict
- -
Table 3.1 : Planted Area and Production of Industrial Crops by District, Johore, 2017 (cont'd.)
Daerah
Tanaman Industri
13,491.9 8.0
Industrial Crops
Tea
- 0.3 -
124.4
District Honey Bee Grain CornDaerah Lebah Madu
117,769.7 - 16,161.0 6.0
Tanaman Industri Industrial Crops
JumlahJagung BijianTotal

Muka surat ini sengaja dibiarkan kosong

KEDAH
KEDAH
STATISTIK TANAMAN INDUSTRI - 20
Luas Bertanam (ha) Luas Berhasil (ha) Pengeluaran (Mt) Luas Bertanam (ha) Luas Berhasil (ha) Pengeluaran (Mt) Luas Bertanam (ha) Luas Berhasil (ha) Pengeluaran (Mt)Planted Area (ha) Harvested Area (ha) Production (Tonnes) Planted Area (ha) Harvested Area (ha) Production (Tonnes) Planted Area (ha) Harvested Area (ha) Production (Tonnes)
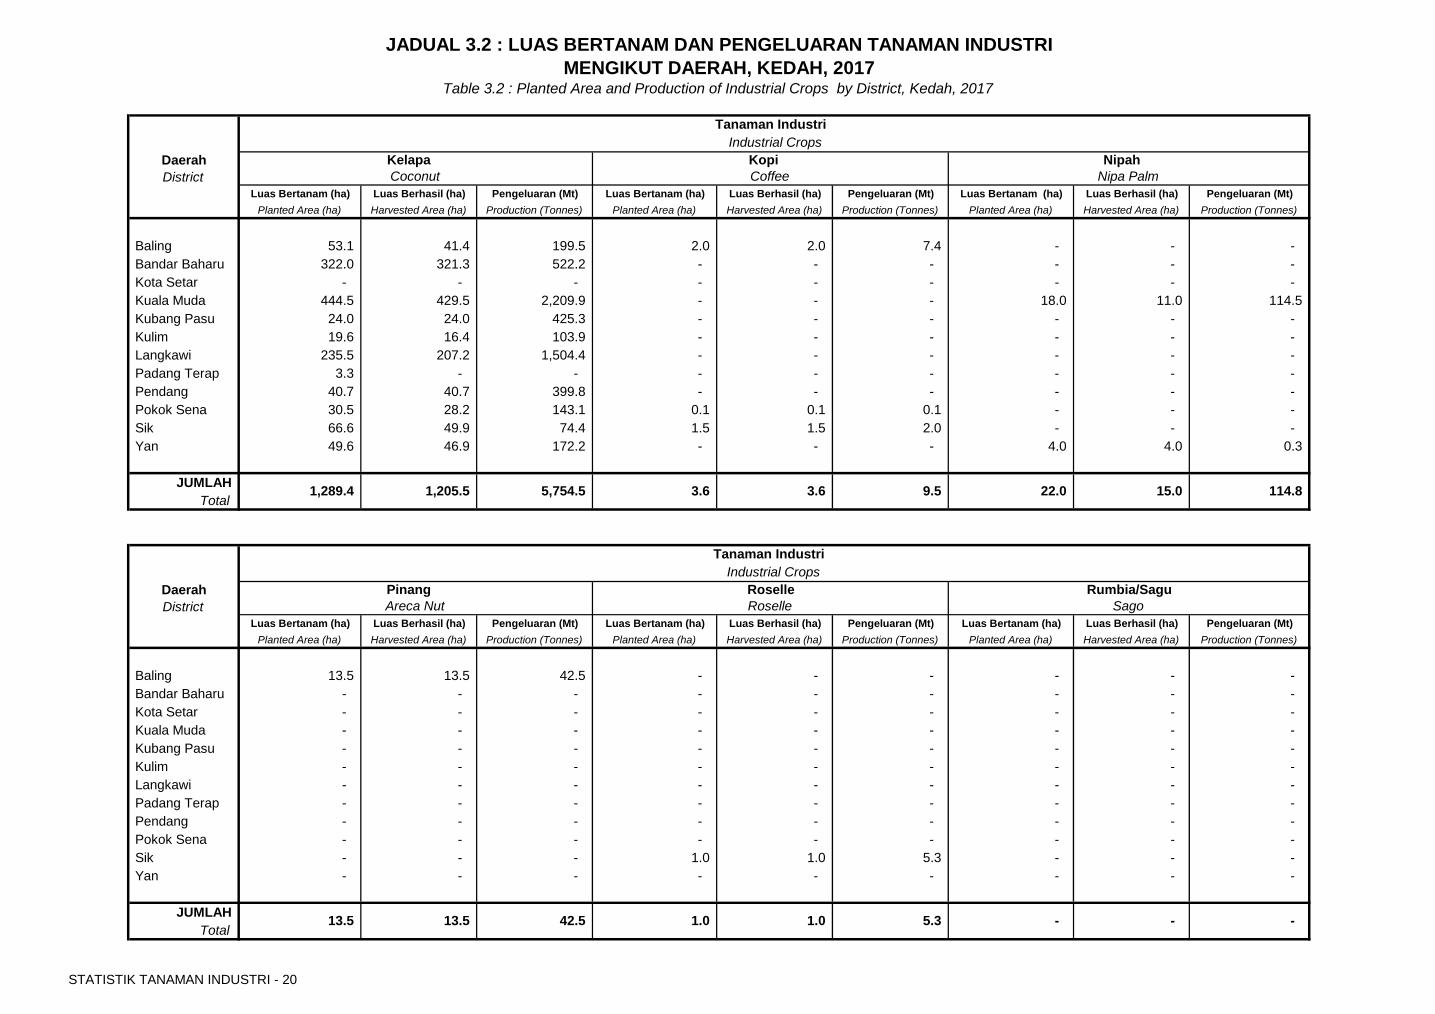
Baling 53.1 41.4 199.5 2.0 2.0 7.4 - - - Bandar Baharu 322.0 321.3 522.2 - - - - - - Kota Setar - - - - - - - - - Kuala Muda 444.5 429.5 2,209.9 - - - 18.0 11.0 114.5 Kubang Pasu 24.0 24.0 425.3 - - - - - - Kulim 19.6 16.4 103.9 - - - - - - Langkawi 235.5 207.2 1,504.4 - - - - - - Padang Terap 3.3 - - - - - - - - Pendang 40.7 40.7 399.8 - - - - - - Pokok Sena 30.5 28.2 143.1 0.1 0.1 0.1 - - - Sik 66.6 49.9 74.4 1.5 1.5 2.0 - - - Yan 49.6 46.9 172.2 - - - 4.0 4.0 0.3
JUMLAHTotal
Luas Bertanam (ha) Luas Berhasil (ha) Pengeluaran (Mt) Luas Bertanam (ha) Luas Berhasil (ha) Pengeluaran (Mt) Luas Bertanam (ha) Luas Berhasil (ha) Pengeluaran (Mt)Planted Area (ha) Harvested Area (ha) Production (Tonnes) Planted Area (ha) Harvested Area (ha) Production (Tonnes) Planted Area (ha) Harvested Area (ha) Production (Tonnes)
Baling 13.5 13.5 42.5 - - - - - - Bandar Baharu - - - - - - - - - Kota Setar - - - - - - - - - Kuala Muda - - - - - - - - - Kubang Pasu - - - - - - - - - Kulim - - - - - - - - - Langkawi - - - - - - - - - Padang Terap - - - - - - - - - Pendang - - - - - - - - - Pokok Sena - - - - - - - - - Sik - - - 1.0 1.0 5.3 - - - Yan - - - - - - - - -
JUMLAHTotal
JADUAL 3.2 : LUAS BERTANAM DAN PENGELUARAN TANAMAN INDUSTRI MENGIKUT DAERAH, KEDAH, 2017
Table 3.2 : Planted Area and Production of Industrial Crops by District, Kedah, 2017
Daerah Nipah Kelapa
Tanaman Industri
13.5
Industrial Crops
1.0
SagoAreca Nut
1,289.4 22.0
Daerah
3.6
Roselle
1,205.5
Rumbia/Sagu
-
15.0
13.5 5.3 42.5 1.0 - -
Nipa Palm
Industrial Crops
DistrictPinang
114.8
Kopi
Roselle
9.5 3.6
District
5,754.5
Coconut Coffee
Tanaman Industri
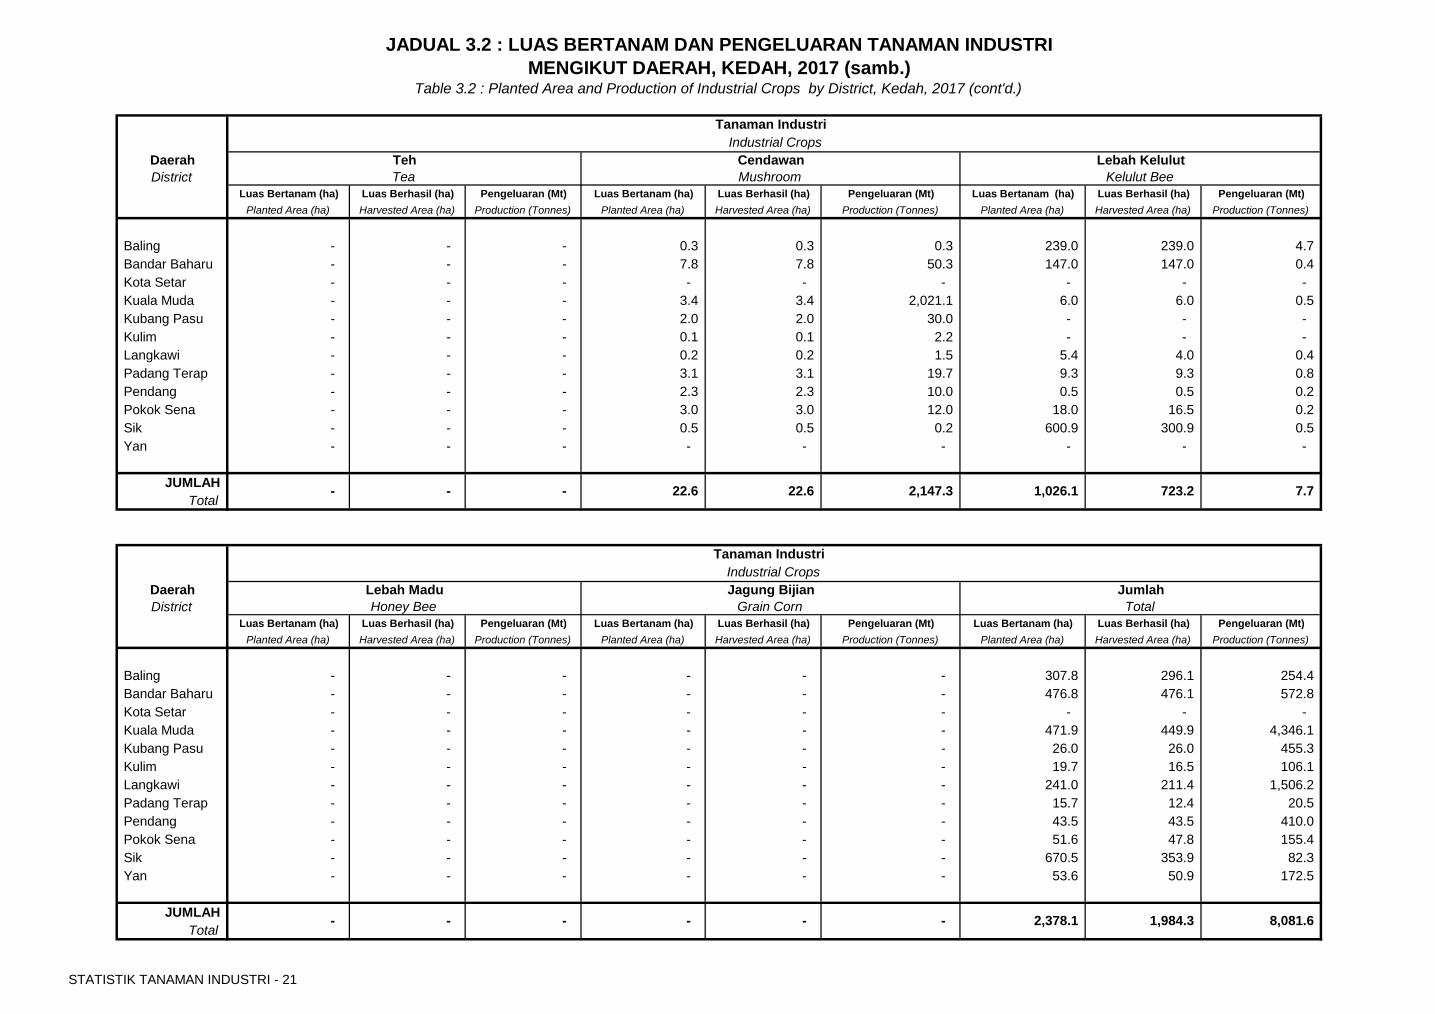
STATISTIK TANAMAN INDUSTRI - 21
Luas Bertanam (ha) Luas Berhasil (ha) Pengeluaran (Mt) Luas Bertanam (ha) Luas Berhasil (ha) Pengeluaran (Mt) Luas Bertanam (ha) Luas Berhasil (ha) Pengeluaran (Mt)Planted Area (ha) Harvested Area (ha) Production (Tonnes) Planted Area (ha) Harvested Area (ha) Production (Tonnes) Planted Area (ha) Harvested Area (ha) Production (Tonnes)
Baling - - - 0.3 0.3 0.3 239.0 239.0 4.7 Bandar Baharu - - - 7.8 7.8 50.3 147.0 147.0 0.4 Kota Setar - - - - - - - - - Kuala Muda - - - 3.4 3.4 2,021.1 6.0 6.0 0.5 Kubang Pasu - - - 2.0 2.0 30.0 - - - Kulim - - - 0.1 0.1 2.2 - - - Langkawi - - - 0.2 0.2 1.5 5.4 4.0 0.4 Padang Terap - - - 3.1 3.1 19.7 9.3 9.3 0.8 Pendang - - - 2.3 2.3 10.0 0.5 0.5 0.2 Pokok Sena - - - 3.0 3.0 12.0 18.0 16.5 0.2 Sik - - - 0.5 0.5 0.2 600.9 300.9 0.5 Yan - - - - - - - - -
JUMLAHTotal
Luas Bertanam (ha) Luas Berhasil (ha) Pengeluaran (Mt) Luas Bertanam (ha) Luas Berhasil (ha) Pengeluaran (Mt) Luas Bertanam (ha) Luas Berhasil (ha) Pengeluaran (Mt)Planted Area (ha) Harvested Area (ha) Production (Tonnes) Planted Area (ha) Harvested Area (ha) Production (Tonnes) Planted Area (ha) Harvested Area (ha) Production (Tonnes)
Baling - - - - - - 307.8 296.1 254.4 Bandar Baharu - - - - - - 476.8 476.1 572.8 Kota Setar - - - - - - - - - Kuala Muda - - - - - - 471.9 449.9 4,346.1 Kubang Pasu - - - - - - 26.0 26.0 455.3 Kulim - - - - - - 19.7 16.5 106.1 Langkawi - - - - - - 241.0 211.4 1,506.2 Padang Terap - - - - - - 15.7 12.4 20.5 Pendang - - - - - - 43.5 43.5 410.0 Pokok Sena - - - - - - 51.6 47.8 155.4 Sik - - - - - - 670.5 353.9 82.3 Yan - - - - - - 53.6 50.9 172.5
JUMLAHTotal
JADUAL 3.2 : LUAS BERTANAM DAN PENGELUARAN TANAMAN INDUSTRI MENGIKUT DAERAH, KEDAH, 2017 (samb.)
Table 3.2 : Planted Area and Production of Industrial Crops by District, Kedah, 2017 (cont'd.)
Daerah Lebah KelulutTeh
Tanaman Industri
- -
TotalHoney Bee
Industrial Crops
- 1,026.1
Daerah
22.6
Jagung Bijian
-
Jumlah
2,378.1
723.2
- - - - 1,984.3 8,081.6
Kelulut Bee
Industrial Crops
DistrictLebah Madu
7.7
Cendawan
Grain Corn
2,147.3 22.6
District
-
Tea Mushroom
Tanaman Industri

Muka surat ini sengaja dibiarkan kosong
KELANTAN
KELANTAN
STATISTIK TANAMAN INDUSTRI - 24
Luas Bertanam (ha) Luas Berhasil (ha) Pengeluaran (Mt) Luas Bertanam (ha) Luas Berhasil (ha) Pengeluaran (Mt) Luas Bertanam (ha) Luas Berhasil (ha) Pengeluaran (Mt)Planted Area (ha) Harvested Area (ha) Production (Tonnes) Planted Area (ha) Harvested Area (ha) Production (Tonnes) Planted Area (ha) Harvested Area (ha) Production (Tonnes)
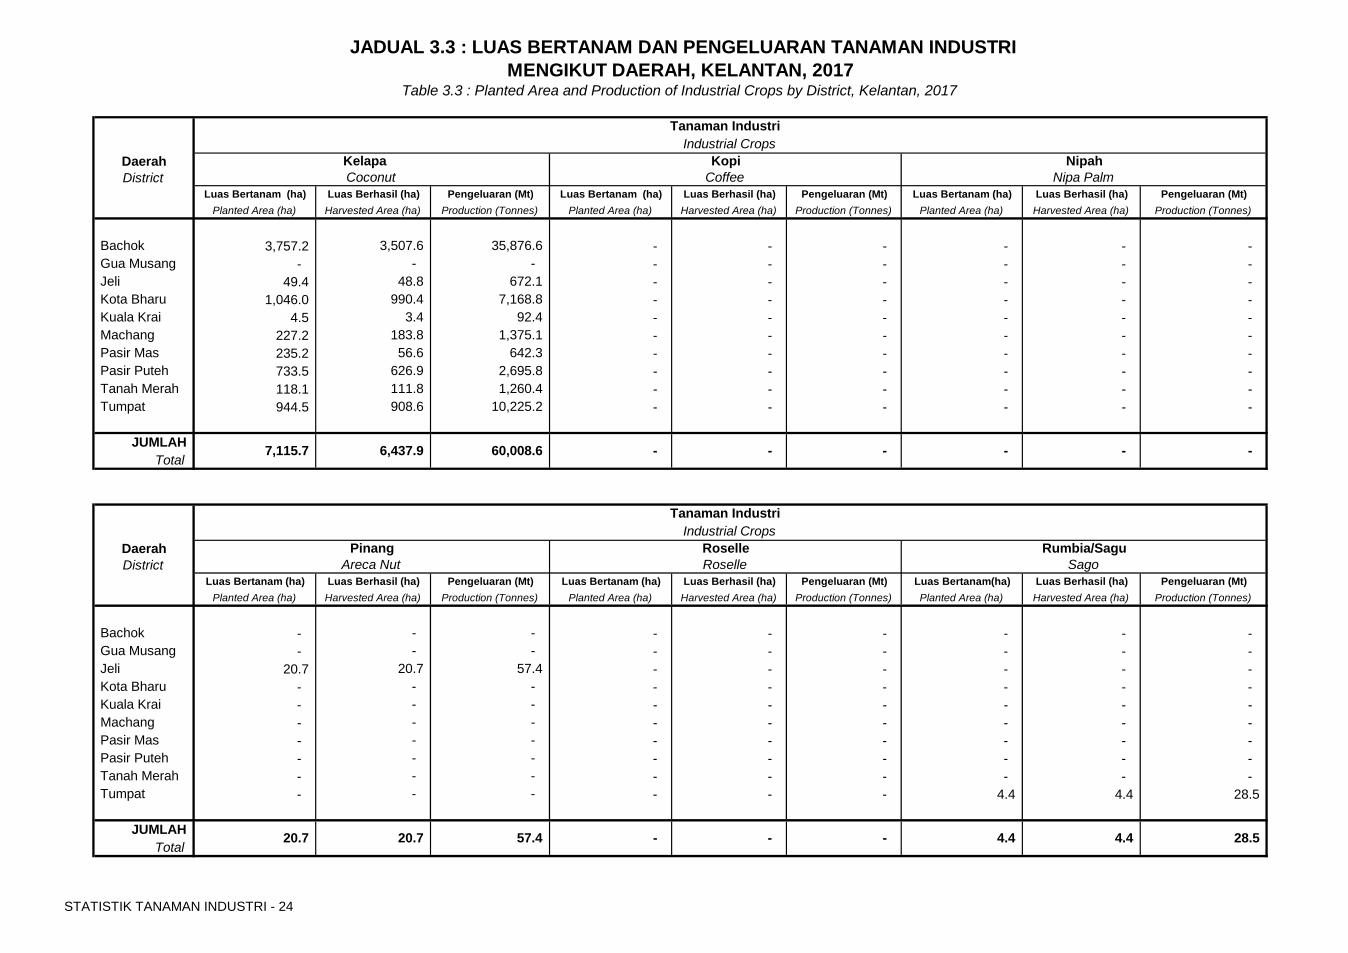
Bachok 3,757.2 3,507.6 35,876.6 - - - - - - Gua Musang - - - - - - - - - Jeli 49.4 48.8 672.1 - - - - - - Kota Bharu 1,046.0 990.4 7,168.8 - - - - - - Kuala Krai 4.5 3.4 92.4 - - - - - - Machang 227.2 183.8 1,375.1 - - - - - - Pasir Mas 235.2 56.6 642.3 - - - - - - Pasir Puteh 733.5 626.9 2,695.8 - - - - - - Tanah Merah 118.1 111.8 1,260.4 - - - - - - Tumpat 944.5 908.6 10,225.2 - - - - - -
JUMLAHTotal
Luas Bertanam (ha) Luas Berhasil (ha) Pengeluaran (Mt) Luas Bertanam (ha) Luas Berhasil (ha) Pengeluaran (Mt) Luas Bertanam(ha) Luas Berhasil (ha) Pengeluaran (Mt)Planted Area (ha) Harvested Area (ha) Production (Tonnes) Planted Area (ha) Harvested Area (ha) Production (Tonnes) Planted Area (ha) Harvested Area (ha) Production (Tonnes)
Bachok - - - - - - - - - Gua Musang - - - - - - - - - Jeli 20.7 20.7 57.4 - - - - - - Kota Bharu - - - - - - - - - Kuala Krai - - - - - - - - - Machang - - - - - - - - - Pasir Mas - - - - - - - - - Pasir Puteh - - - - - - - - - Tanah Merah - - - - - - - - - Tumpat - - - - - - 4.4 4.4 28.5
JUMLAHTotal
57.4 4.4 4.4 -
District Sago
- -
RoselleAreca Nut
20.7 28.5 20.7
Daerah
60,008.6 6,437.9 7,115.7
Tanaman Industri Industrial Crops
Pinang Rumbia/SaguRoselle
District Coconut
- - - - -
Nipa PalmCoffee
-
JADUAL 3.3 : LUAS BERTANAM DAN PENGELUARAN TANAMAN INDUSTRIMENGIKUT DAERAH, KELANTAN, 2017
Table 3.3 : Planted Area and Production of Industrial Crops by District, Kelantan, 2017
Industrial CropsTanaman Industri
Daerah NipahKopiKelapa
STATISTIK TANAMAN INDUSTRI - 25
Luas Bertanam (ha) Luas Berhasil (ha) Pengeluaran (Mt) Luas Bertanam (ha) Luas Berhasil (ha) Pengeluaran (Mt) Luas Bertanam (ha) Luas Berhasil (ha) Pengeluaran (Mt)Planted Area (ha) Harvested Area (ha) Production (Tonnes) Planted Area (ha) Harvested Area (ha) Production (Tonnes) Planted Area (ha) Harvested Area (ha) Production (Tonnes)
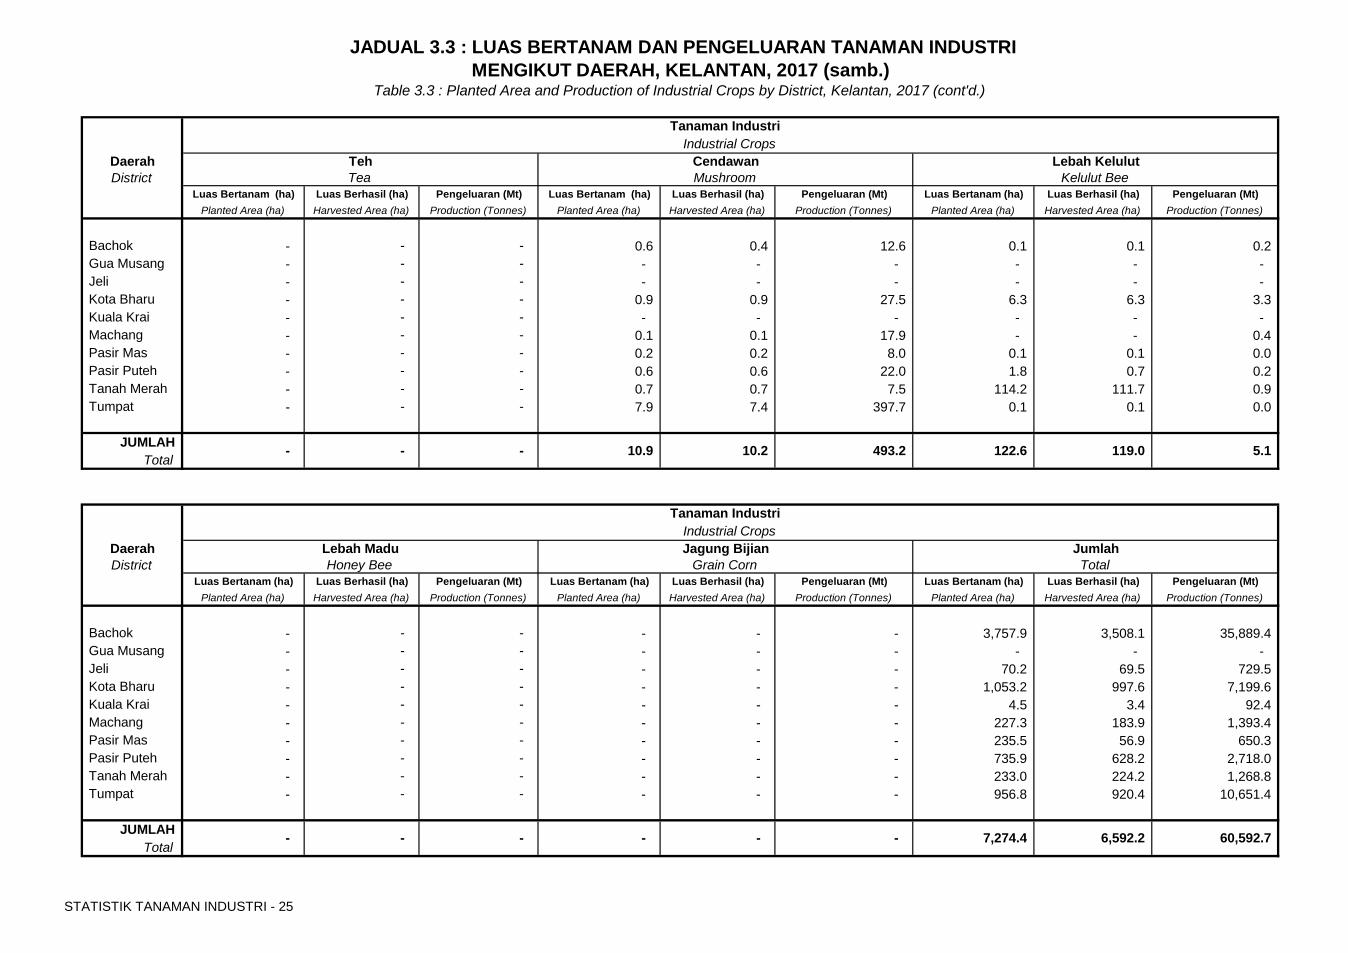
Bachok - - - 0.6 0.4 12.6 0.1 0.1 0.2 Gua Musang - - - - - - - - - Jeli - - - - - - - - - Kota Bharu - - - 0.9 0.9 27.5 6.3 6.3 3.3 Kuala Krai - - - - - - - - - Machang - - - 0.1 0.1 17.9 - - 0.4 Pasir Mas - - - 0.2 0.2 8.0 0.1 0.1 0.0 Pasir Puteh - - - 0.6 0.6 22.0 1.8 0.7 0.2 Tanah Merah - - - 0.7 0.7 7.5 114.2 111.7 0.9 Tumpat - - - 7.9 7.4 397.7 0.1 0.1 0.0
JUMLAHTotal
Luas Bertanam (ha) Luas Berhasil (ha) Pengeluaran (Mt) Luas Bertanam (ha) Luas Berhasil (ha) Pengeluaran (Mt) Luas Bertanam (ha) Luas Berhasil (ha) Pengeluaran (Mt)Planted Area (ha) Harvested Area (ha) Production (Tonnes) Planted Area (ha) Harvested Area (ha) Production (Tonnes) Planted Area (ha) Harvested Area (ha) Production (Tonnes)
Bachok - - - - - - 3,757.9 3,508.1 35,889.4 Gua Musang - - - - - - - - - Jeli - - - - - - 70.2 69.5 729.5 Kota Bharu - - - - - - 1,053.2 997.6 7,199.6 Kuala Krai - - - - - - 4.5 3.4 92.4 Machang - - - - - - 227.3 183.9 1,393.4 Pasir Mas - - - - - - 235.5 56.9 650.3 Pasir Puteh - - - - - - 735.9 628.2 2,718.0 Tanah Merah - - - - - - 233.0 224.2 1,268.8 Tumpat - - - - - - 956.8 920.4 10,651.4
JUMLAHTotal
JADUAL 3.3 : LUAS BERTANAM DAN PENGELUARAN TANAMAN INDUSTRIMENGIKUT DAERAH, KELANTAN, 2017 (samb.)
Table 3.3 : Planted Area and Production of Industrial Crops by District, Kelantan, 2017 (cont'd.)
Industrial CropsTanaman Industri
Daerah Lebah KelulutCendawanTehDistrict Tea
10.9 122.6 119.0 10.2 493.2
Kelulut BeeMushroom
5.1
Daerah
- - -
Lebah Madu
Tanaman Industri Industrial Crops
JumlahJagung Bijian
- 7,274.4 6,592.2 -
District Total
- -
Grain CornHoney Bee
- 60,592.7 -

Muka surat ini sengaja dibiarkan kosong
MELAKA
MALACCA
STATISTIK TANAMAN INDUSTRI - 28
Luas Bertanam (ha) Luas Berhasil (ha) Pengeluaran (Mt) Luas Bertanam (ha) Luas Berhasil (ha) Pengeluaran (Mt) Luas Bertanam (ha) Luas Berhasil (ha) Pengeluaran (Mt)
Planted Area (ha) Harvested Area (ha) Production (Tonnes) Planted Area (ha) Harvested Area (ha) Production (Tonnes) Planted Area (ha) Harvested Area (ha) Production (Tonnes)
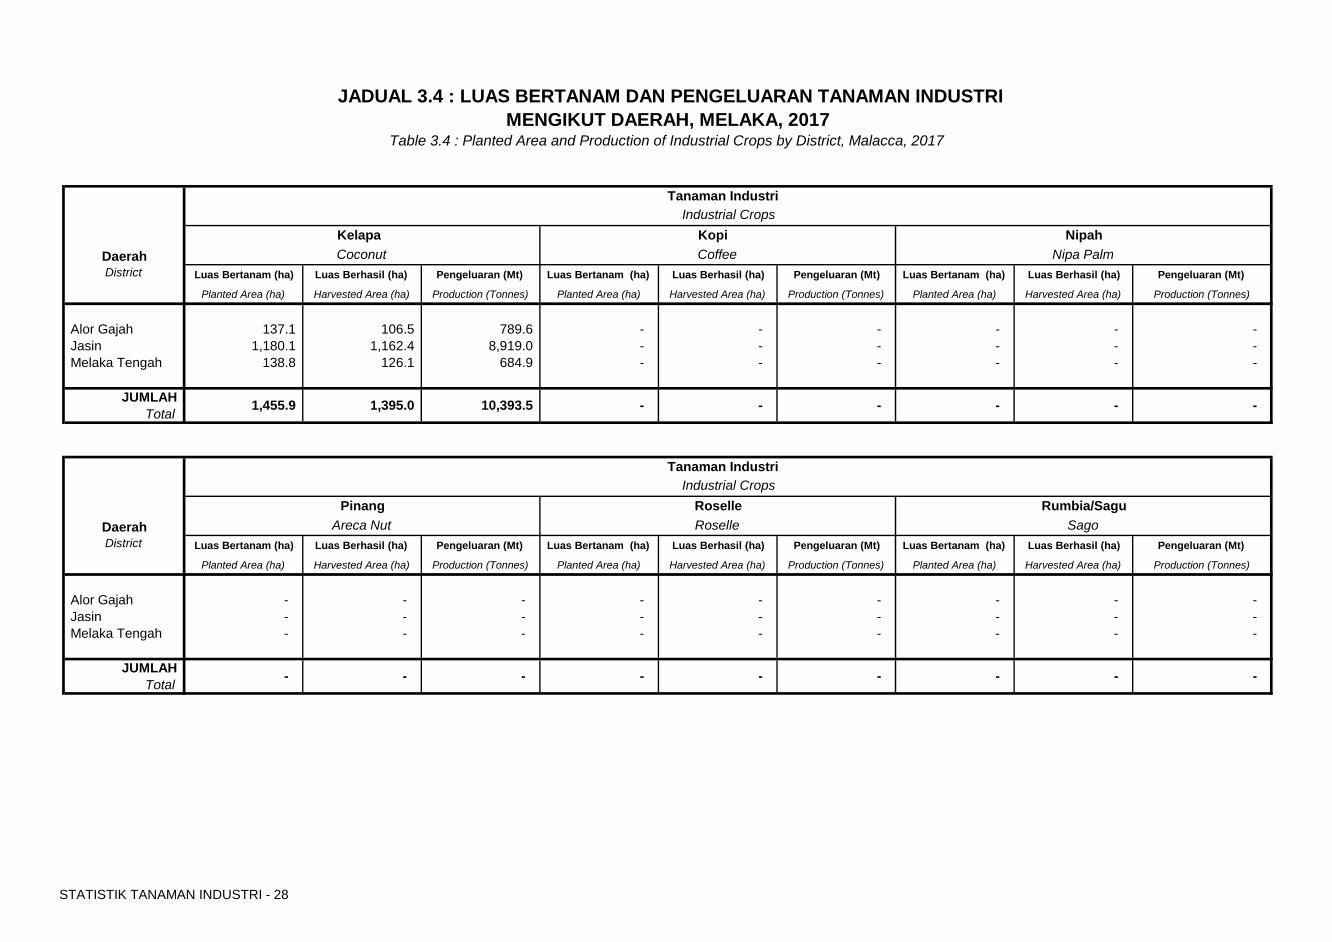
Alor Gajah 137.1 106.5 789.6 - - - - - - Jasin 1,180.1 1,162.4 8,919.0 - - - - - - Melaka Tengah 138.8 126.1 684.9 - - - - - -
JUMLAHTotal
Luas Bertanam (ha) Luas Berhasil (ha) Pengeluaran (Mt) Luas Bertanam (ha) Luas Berhasil (ha) Pengeluaran (Mt) Luas Bertanam (ha) Luas Berhasil (ha) Pengeluaran (Mt)
Planted Area (ha) Harvested Area (ha) Production (Tonnes) Planted Area (ha) Harvested Area (ha) Production (Tonnes) Planted Area (ha) Harvested Area (ha) Production (Tonnes)
Alor Gajah - - - - - - - - - Jasin - - - - - - - - - Melaka Tengah - - - - - - - - -
JUMLAHTotal
-
Rumbia/Sagu
- - - -
Areca Nut
- - - - -
DistrictDaerah
Tanaman Industri Industrial Crops
Pinang RoselleSagoRoselle
JADUAL 3.4 : LUAS BERTANAM DAN PENGELUARAN TANAMAN INDUSTRIMENGIKUT DAERAH, MELAKA, 2017
Table 3.4 : Planted Area and Production of Industrial Crops by District, Malacca, 2017
Daerah
Tanaman Industri Industrial Crops
Kopi Coffee
Kelapa Coconut
NipahNipa Palm
District
- - - 10,393.5 1,395.0 - - 1,455.9
STATISTIK TANAMAN INDUSTRI - 29
Luas Bertanam (ha) Luas Berhasil (ha) Pengeluaran (Mt) Luas Bertanam (ha) Luas Berhasil (ha) Pengeluaran (Mt) Luas Bertanam (ha) Luas Berhasil (ha) Pengeluaran (Mt)
Planted Area (ha) Harvested Area (ha) Production (Tonnes) Planted Area (ha) Harvested Area (ha) Production (Tonnes) Planted Area (ha) Harvested Area (ha) Production (Tonnes)
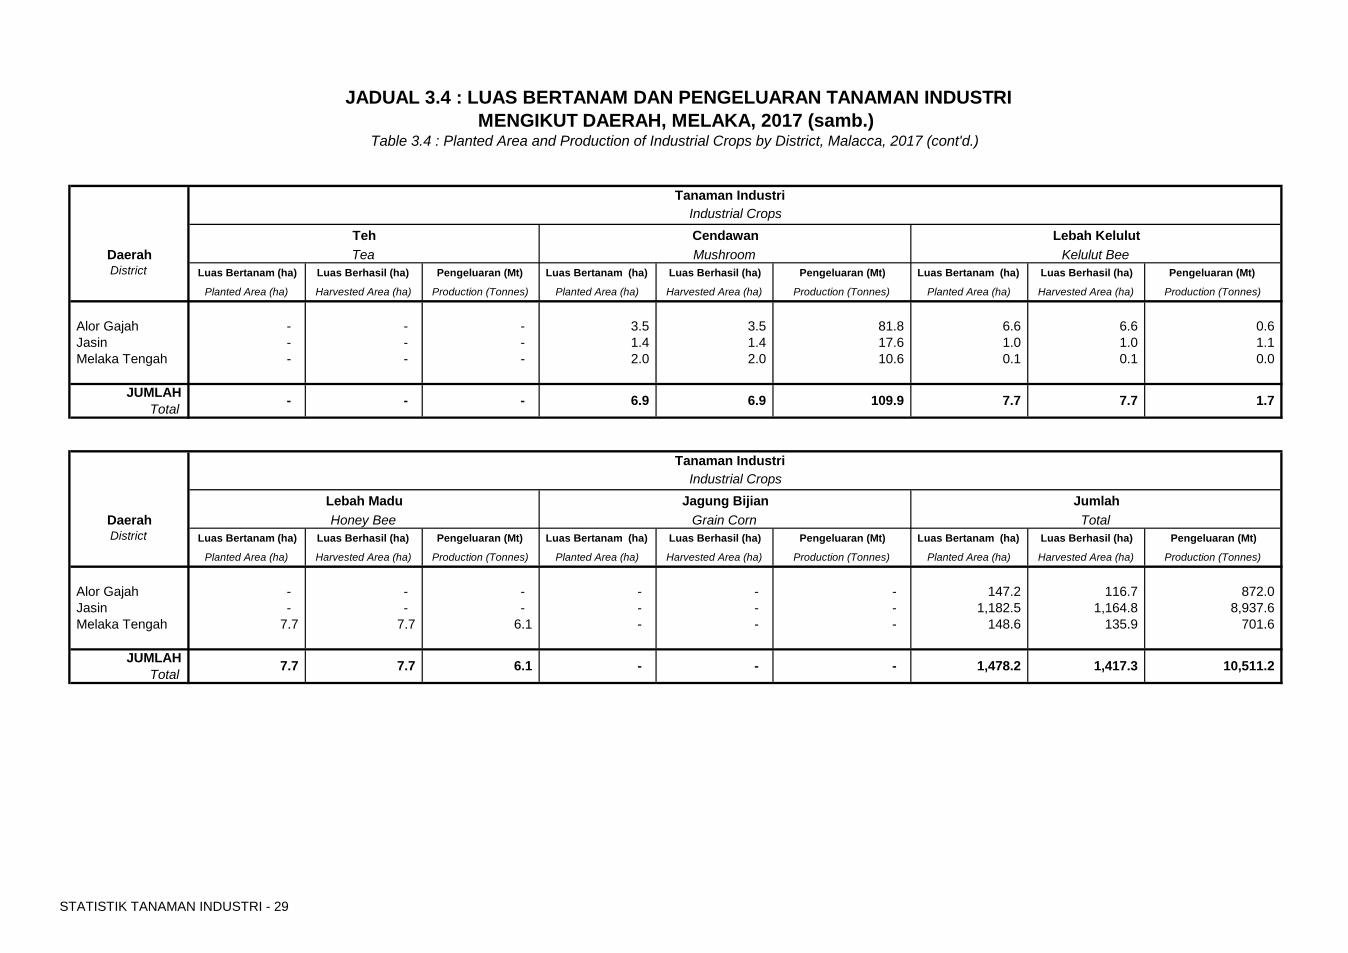
Alor Gajah - - - 3.5 3.5 81.8 6.6 6.6 0.6 Jasin - - - 1.4 1.4 17.6 1.0 1.0 1.1 Melaka Tengah - - - 2.0 2.0 10.6 0.1 0.1 0.0
JUMLAHTotal
Luas Bertanam (ha) Luas Berhasil (ha) Pengeluaran (Mt) Luas Bertanam (ha) Luas Berhasil (ha) Pengeluaran (Mt) Luas Bertanam (ha) Luas Berhasil (ha) Pengeluaran (Mt)
Planted Area (ha) Harvested Area (ha) Production (Tonnes) Planted Area (ha) Harvested Area (ha) Production (Tonnes) Planted Area (ha) Harvested Area (ha) Production (Tonnes)
Alor Gajah - - - - - - 147.2 116.7 872.0 Jasin - - - - - - 1,182.5 1,164.8 8,937.6 Melaka Tengah 7.7 7.7 6.1 - - - 148.6 135.9 701.6
JUMLAHTotal
1.7
Jumlah
1,417.3 6.1 7.7 7.7
Honey Bee
- 10,511.2 - - 1,478.2
Tanaman Industri Industrial Crops
DistrictDaerah
Lebah Madu Jagung BijianTotalGrain Corn
JADUAL 3.4 : LUAS BERTANAM DAN PENGELUARAN TANAMAN INDUSTRIMENGIKUT DAERAH, MELAKA, 2017 (samb.)
Table 3.4 : Planted Area and Production of Industrial Crops by District, Malacca, 2017 (cont'd.)
Daerah
Tanaman Industri Industrial Crops CendawanMushroom
TehTea
Lebah KelulutKelulut Bee
District
7.7 109.9 7.7 - - 6.9 6.9 -

Muka surat ini sengaja dibiarkan kosong
NEGERI SEMBILAN
NEGERI SEMBILAN
STATISTIK TANAMAN INDUSTRI - 32
Luas Bertanam (ha) Luas Berhasil (ha) Pengeluaran (Mt) Luas Bertanam (ha) Luas Berhasil (ha) Pengeluaran (Mt) Luas Bertanam (ha) Luas Berhasil (ha) Pengeluaran (Mt)Planted Area (ha) Harvested Area (ha) Production (Tonnes) Planted Area (ha) Harvested Area (ha) Production (Tonnes) Planted Area (ha) Harvested Area (ha) Production (Tonnes)
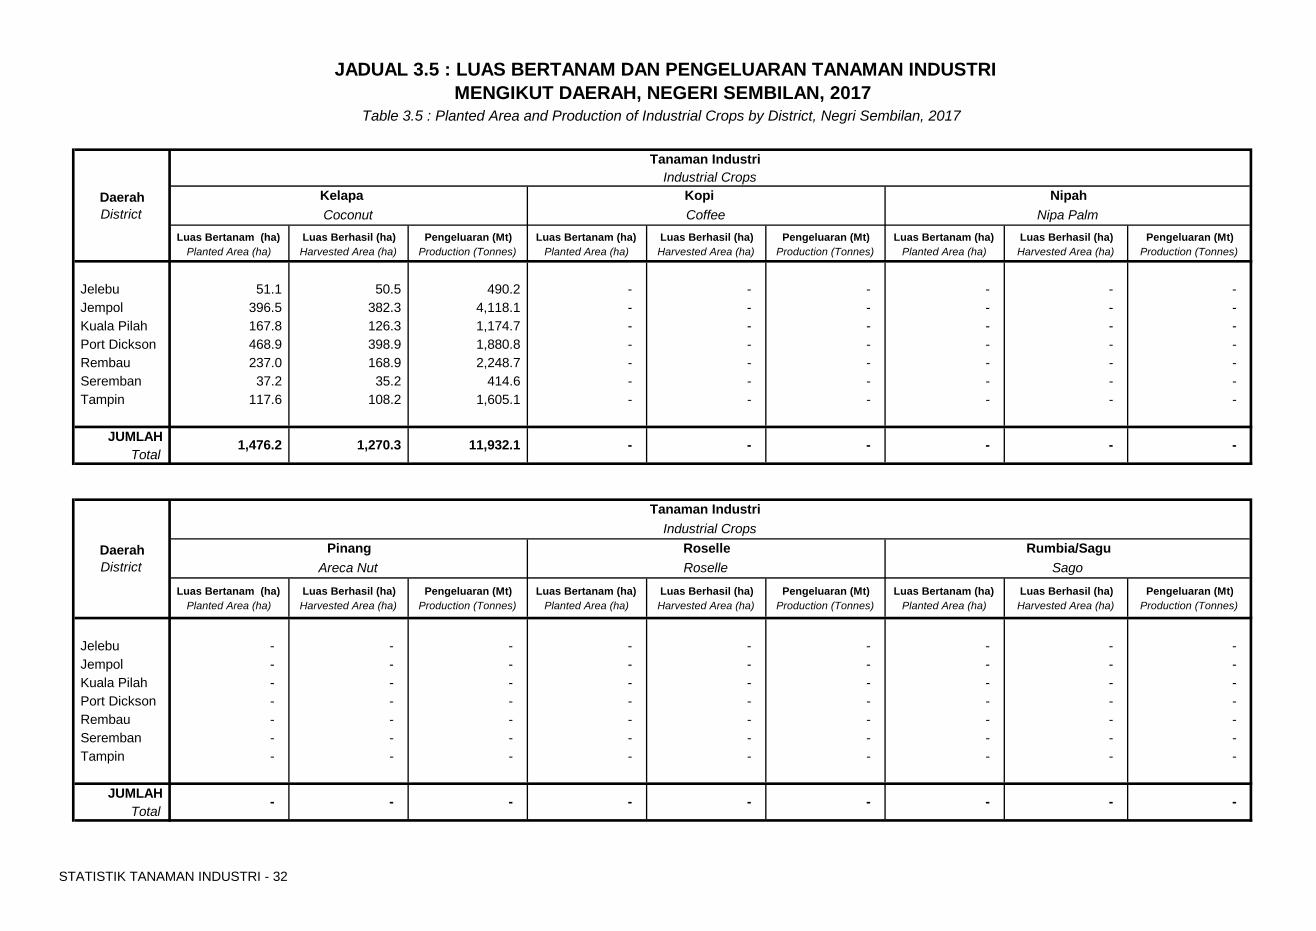
Jelebu 51.1 50.5 490.2 - - - - - - Jempol 396.5 382.3 4,118.1 - - - - - - Kuala Pilah 167.8 126.3 1,174.7 - - - - - - Port Dickson 468.9 398.9 1,880.8 - - - - - - Rembau 237.0 168.9 2,248.7 - - - - - - Seremban 37.2 35.2 414.6 - - - - - - Tampin 117.6 108.2 1,605.1 - - - - - -
JUMLAHTotal
Luas Bertanam (ha) Luas Berhasil (ha) Pengeluaran (Mt) Luas Bertanam (ha) Luas Berhasil (ha) Pengeluaran (Mt) Luas Bertanam (ha) Luas Berhasil (ha) Pengeluaran (Mt)Planted Area (ha) Harvested Area (ha) Production (Tonnes) Planted Area (ha) Harvested Area (ha) Production (Tonnes) Planted Area (ha) Harvested Area (ha) Production (Tonnes)
Jelebu - - - - - - - - - Jempol - - - - - - - - - Kuala Pilah - - - - - - - - - Port Dickson - - - - - - - - - Rembau - - - - - - - - - Seremban - - - - - - - - - Tampin - - - - - - - - -
JUMLAHTotal
Kopi
- -
Roselle
-
Sago
-
Coffee
-
JADUAL 3.5 : LUAS BERTANAM DAN PENGELUARAN TANAMAN INDUSTRIMENGIKUT DAERAH, NEGERI SEMBILAN, 2017
Table 3.5 : Planted Area and Production of Industrial Crops by District, Negri Sembilan, 2017
Nipah
Tanaman Industri
-
-
Nipa Palm
-
Roselle
Daerah Kelapa Industrial Crops
- -
District
1,476.2 1,270.3 11,932.1
Daerah
Coconut
Tanaman Industri
PinangIndustrial Crops
Rumbia/Sagu
-
District Areca Nut
- - - -
STATISTIK TANAMAN INDUSTRI - 33
Luas Bertanam (ha) Luas Berhasil (ha) Pengeluaran (Mt) Luas Bertanam (ha) Luas Berhasil (ha) Pengeluaran (Mt) Luas Bertanam (ha) Luas Berhasil (ha) Pengeluaran (Mt)Planted Area (ha) Harvested Area (ha) Production (Tonnes) Planted Area (ha) Harvested Area (ha) Production (Tonnes) Planted Area (ha) Harvested Area (ha) Production (Tonnes)
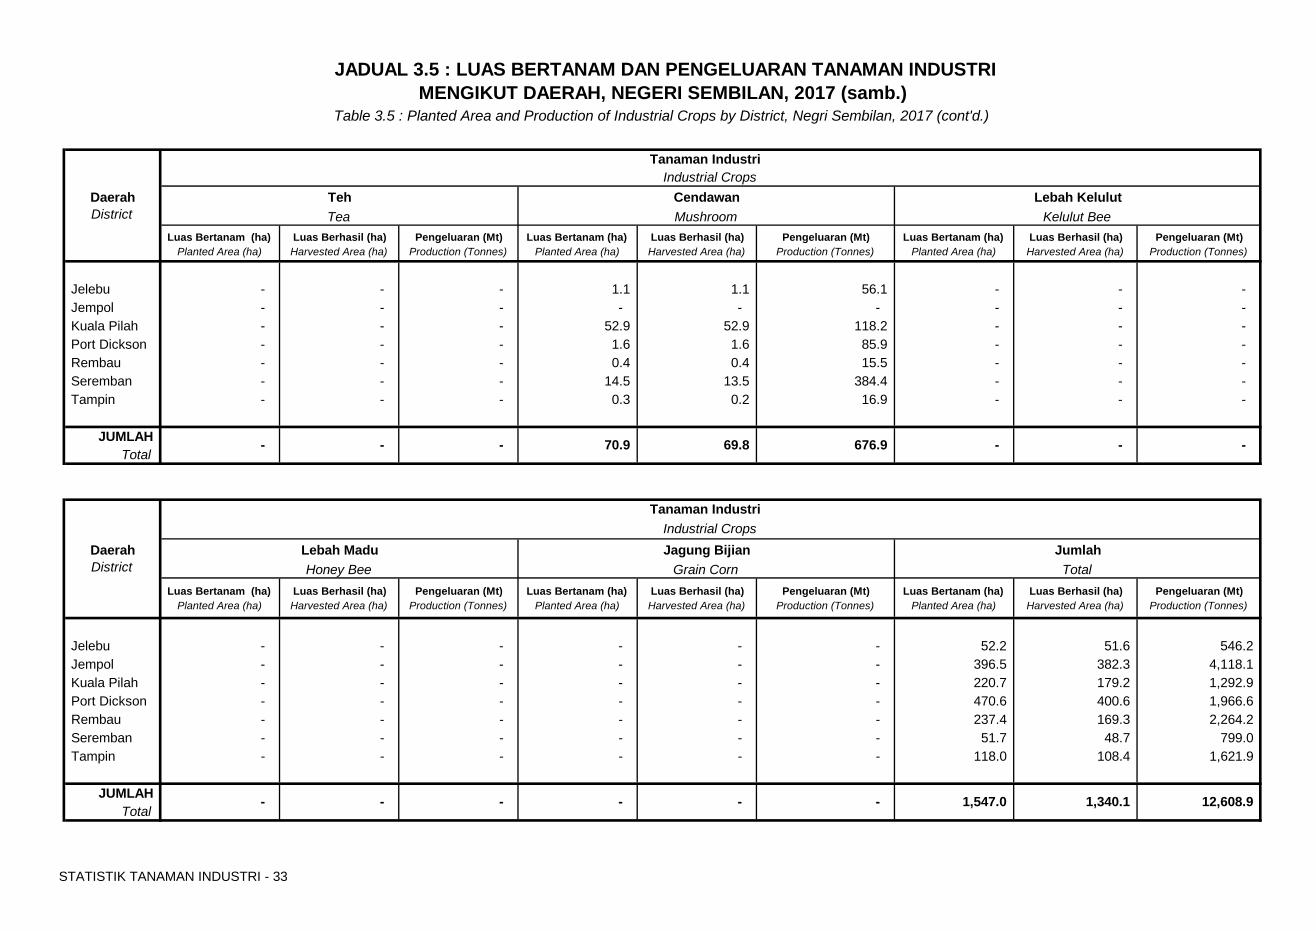
Jelebu - - - 1.1 1.1 56.1 - - - Jempol - - - - - - - - - Kuala Pilah - - - 52.9 52.9 118.2 - - - Port Dickson - - - 1.6 1.6 85.9 - - - Rembau - - - 0.4 0.4 15.5 - - - Seremban - - - 14.5 13.5 384.4 - - - Tampin - - - 0.3 0.2 16.9 - - -
JUMLAHTotal
Luas Bertanam (ha) Luas Berhasil (ha) Pengeluaran (Mt) Luas Bertanam (ha) Luas Berhasil (ha) Pengeluaran (Mt) Luas Bertanam (ha) Luas Berhasil (ha) Pengeluaran (Mt)Planted Area (ha) Harvested Area (ha) Production (Tonnes) Planted Area (ha) Harvested Area (ha) Production (Tonnes) Planted Area (ha) Harvested Area (ha) Production (Tonnes)
Jelebu - - - - - - 52.2 51.6 546.2 Jempol - - - - - - 396.5 382.3 4,118.1 Kuala Pilah - - - - - - 220.7 179.2 1,292.9 Port Dickson - - - - - - 470.6 400.6 1,966.6 Rembau - - - - - - 237.4 169.3 2,264.2 Seremban - - - - - - 51.7 48.7 799.0 Tampin - - - - - - 118.0 108.4 1,621.9
JUMLAHTotal
District Honey Bee
- - - - -
District
- - -
Daerah
Tea
Lebah Madu
Tanaman Industri Industrial Crops
-
JADUAL 3.5 : LUAS BERTANAM DAN PENGELUARAN TANAMAN INDUSTRIMENGIKUT DAERAH, NEGERI SEMBILAN, 2017 (samb.)
Table 3.5 : Planted Area and Production of Industrial Crops by District, Negri Sembilan, 2017 (cont'd.)
Lebah Kelulut
Tanaman Industri Industrial Crops
Daerah Teh
1,547.0
Cendawan
- 70.9
Grain Corn Total
676.9
Mushroom
Jumlah
1,340.1 12,608.9
69.8
Kelulut Bee
-
Jagung Bijian
-

Muka surat ini sengaja dibiarkan kosong
PAHANG
PAHANG
STATISTIK TANAMAN INDUSTRI - 36
Luas Bertanam (ha) Luas Berhasil (ha) Pengeluaran (Mt) Luas Bertanam (ha) Luas Berhasil (ha) Pengeluaran (Mt) Luas Bertanam (ha) Luas Berhasil (ha) Pengeluaran (Mt) Planted Area(ha) Harvested Area (ha) Production (Tonnes) Planted Area(ha) Harvested Area (ha) Production (Tonnes) Planted Area(ha) Harvested Area (ha) Production (Tonnes)
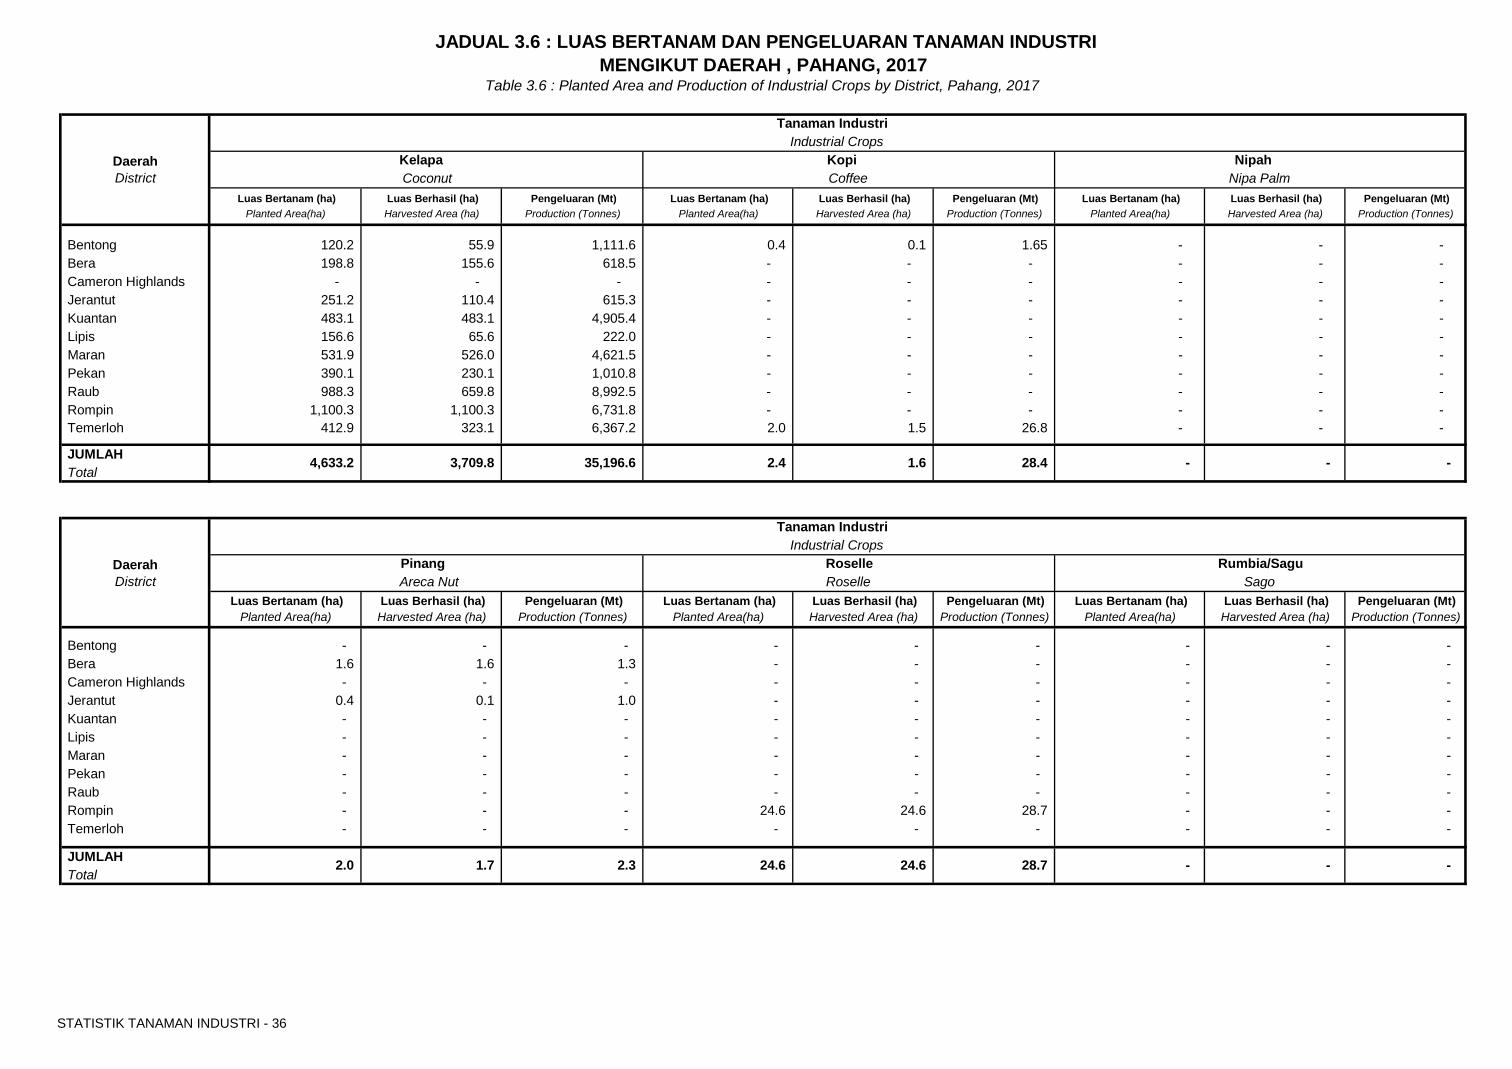
Bentong 120.2 55.9 1,111.6 0.4 0.1 1.65 - - - Bera 198.8 155.6 618.5 - - - - - - Cameron Highlands - - - - - - - - - Jerantut 251.2 110.4 615.3 - - - - - - Kuantan 483.1 483.1 4,905.4 - - - - - - Lipis 156.6 65.6 222.0 - - - - - - Maran 531.9 526.0 4,621.5 - - - - - - Pekan 390.1 230.1 1,010.8 - - - - - - Raub 988.3 659.8 8,992.5 - - - - - - Rompin 1,100.3 1,100.3 6,731.8 - - - - - - Temerloh 412.9 323.1 6,367.2 2.0 1.5 26.8 - - -
JUMLAHTotal
Luas Bertanam (ha) Luas Berhasil (ha) Pengeluaran (Mt) Luas Bertanam (ha) Luas Berhasil (ha) Pengeluaran (Mt) Luas Bertanam (ha) Luas Berhasil (ha) Pengeluaran (Mt) Planted Area(ha) Harvested Area (ha) Production (Tonnes) Planted Area(ha) Harvested Area (ha) Production (Tonnes) Planted Area(ha) Harvested Area (ha) Production (Tonnes)
Bentong - - - - - - - - - Bera 1.6 1.6 1.3 - - - - - - Cameron Highlands - - - - - - - - - Jerantut 0.4 0.1 1.0 - - - - - - Kuantan - - - - - - - - - Lipis - - - - - - - - - Maran - - - - - - - - - Pekan - - - - - - - - - Raub - - - - - - - - - Rompin - - - 24.6 24.6 28.7 - - - Temerloh - - - - - - - - -
JUMLAHTotal
24.6
1.6
- 2.3 - 1.7 - 24.6
-
Kopi Nipah Kelapa
2.0
Areca Nut Roselle
35,196.6
Pinang
4,633.2
Tanaman Industri
28.7
-
District
Sago
Nipa Palm
3,709.8 - 28.4
Daerah Roselle Rumbia/Sagu
Coconut Coffee
Industrial Crops
District
2.4
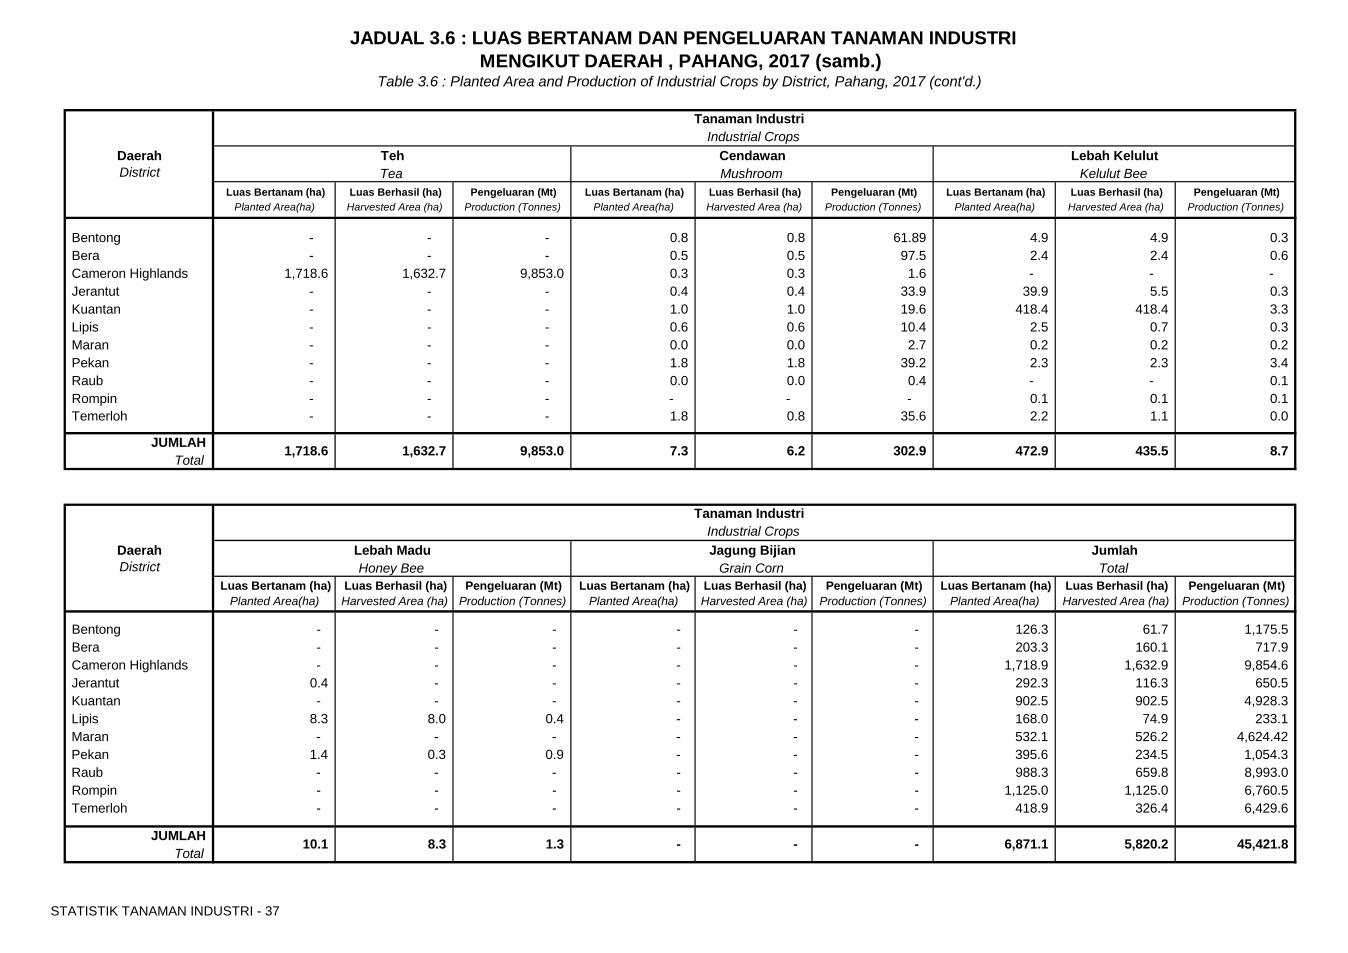
JADUAL 3.6 : LUAS BERTANAM DAN PENGELUARAN TANAMAN INDUSTRIMENGIKUT DAERAH , PAHANG, 2017
Table 3.6 : Planted Area and Production of Industrial Crops by District, Pahang, 2017
Daerah
Tanaman Industri Industrial Crops
STATISTIK TANAMAN INDUSTRI - 37
Luas Bertanam (ha) Luas Berhasil (ha) Pengeluaran (Mt) Luas Bertanam (ha) Luas Berhasil (ha) Pengeluaran (Mt) Luas Bertanam (ha) Luas Berhasil (ha) Pengeluaran (Mt) Planted Area(ha) Harvested Area (ha) Production (Tonnes) Planted Area(ha) Harvested Area (ha) Production (Tonnes) Planted Area(ha) Harvested Area (ha) Production (Tonnes)
Bentong - - - 0.8 0.8 61.89 4.9 4.9 0.3 Bera - - - 0.5 0.5 97.5 2.4 2.4 0.6 Cameron Highlands 1,718.6 1,632.7 9,853.0 0.3 0.3 1.6 - - - Jerantut - - - 0.4 0.4 33.9 39.9 5.5 0.3 Kuantan - - - 1.0 1.0 19.6 418.4 418.4 3.3 Lipis - - - 0.6 0.6 10.4 2.5 0.7 0.3 Maran - - - 0.0 0.0 2.7 0.2 0.2 0.2 Pekan - - - 1.8 1.8 39.2 2.3 2.3 3.4 Raub - - - 0.0 0.0 0.4 - - 0.1 Rompin - - - - - - 0.1 0.1 0.1 Temerloh - - - 1.8 0.8 35.6 2.2 1.1 0.0
JUMLAHTotal
Luas Bertanam (ha) Luas Berhasil (ha) Pengeluaran (Mt) Luas Bertanam (ha) Luas Berhasil (ha) Pengeluaran (Mt) Luas Bertanam (ha) Luas Berhasil (ha) Pengeluaran (Mt) Planted Area(ha) Harvested Area (ha) Production (Tonnes) Planted Area(ha) Harvested Area (ha) Production (Tonnes) Planted Area(ha) Harvested Area (ha) Production (Tonnes)
Bentong - - - - - - 126.3 61.7 1,175.5 Bera - - - - - - 203.3 160.1 717.9 Cameron Highlands - - - - - - 1,718.9 1,632.9 9,854.6 Jerantut 0.4 - - - - - 292.3 116.3 650.5 Kuantan - - - - - - 902.5 902.5 4,928.3 Lipis 8.3 8.0 0.4 - - - 168.0 74.9 233.1 Maran - - - - - - 532.1 526.2 4,624.42 Pekan 1.4 0.3 0.9 - - - 395.6 234.5 1,054.3 Raub - - - - - - 988.3 659.8 8,993.0 Rompin - - - - - - 1,125.0 1,125.0 6,760.5 Temerloh - - - - - - 418.9 326.4 6,429.6
JUMLAHTotal
Lebah Madu
1,718.6
- -
6.2
Tanaman Industri Industrial Crops
10.1
Honey Bee Grain Corn
45,421.8 1.3 5,820.2 8.3 6,871.1 -
District
Total
Kelulut Bee
1,632.7 472.9 302.9
Daerah Jagung Bijian Jumlah
Tea Mushroom
District
7.3 435.5 8.7 9,853.0
JADUAL 3.6 : LUAS BERTANAM DAN PENGELUARAN TANAMAN INDUSTRIMENGIKUT DAERAH , PAHANG, 2017 (samb.)
Table 3.6 : Planted Area and Production of Industrial Crops by District, Pahang, 2017 (cont'd.)
Daerah
Tanaman Industri Industrial Crops
Cendawan Lebah KelulutTeh

Muka surat ini sengaja dibiarkan kosong

PERAK
PERAK
STATISTIK TANAMAN INDUSTRI - 40
Luas Bertanam (ha) Luas Berhasil (ha) Pengeluaran (Mt) Luas Bertanam (ha)Luas Berhasil (ha) Pengeluaran (Mt) Luas Bertanam (ha) Luas Berhasil (ha) Pengeluaran (Mt)Planted Area(ha) Harvested Area (ha)Production (Tonnes) Planted Area(ha) Harvested Area (ha)Production (Tonnes) Planted Area(ha) Harvested Area (ha) Production (Tonnes)
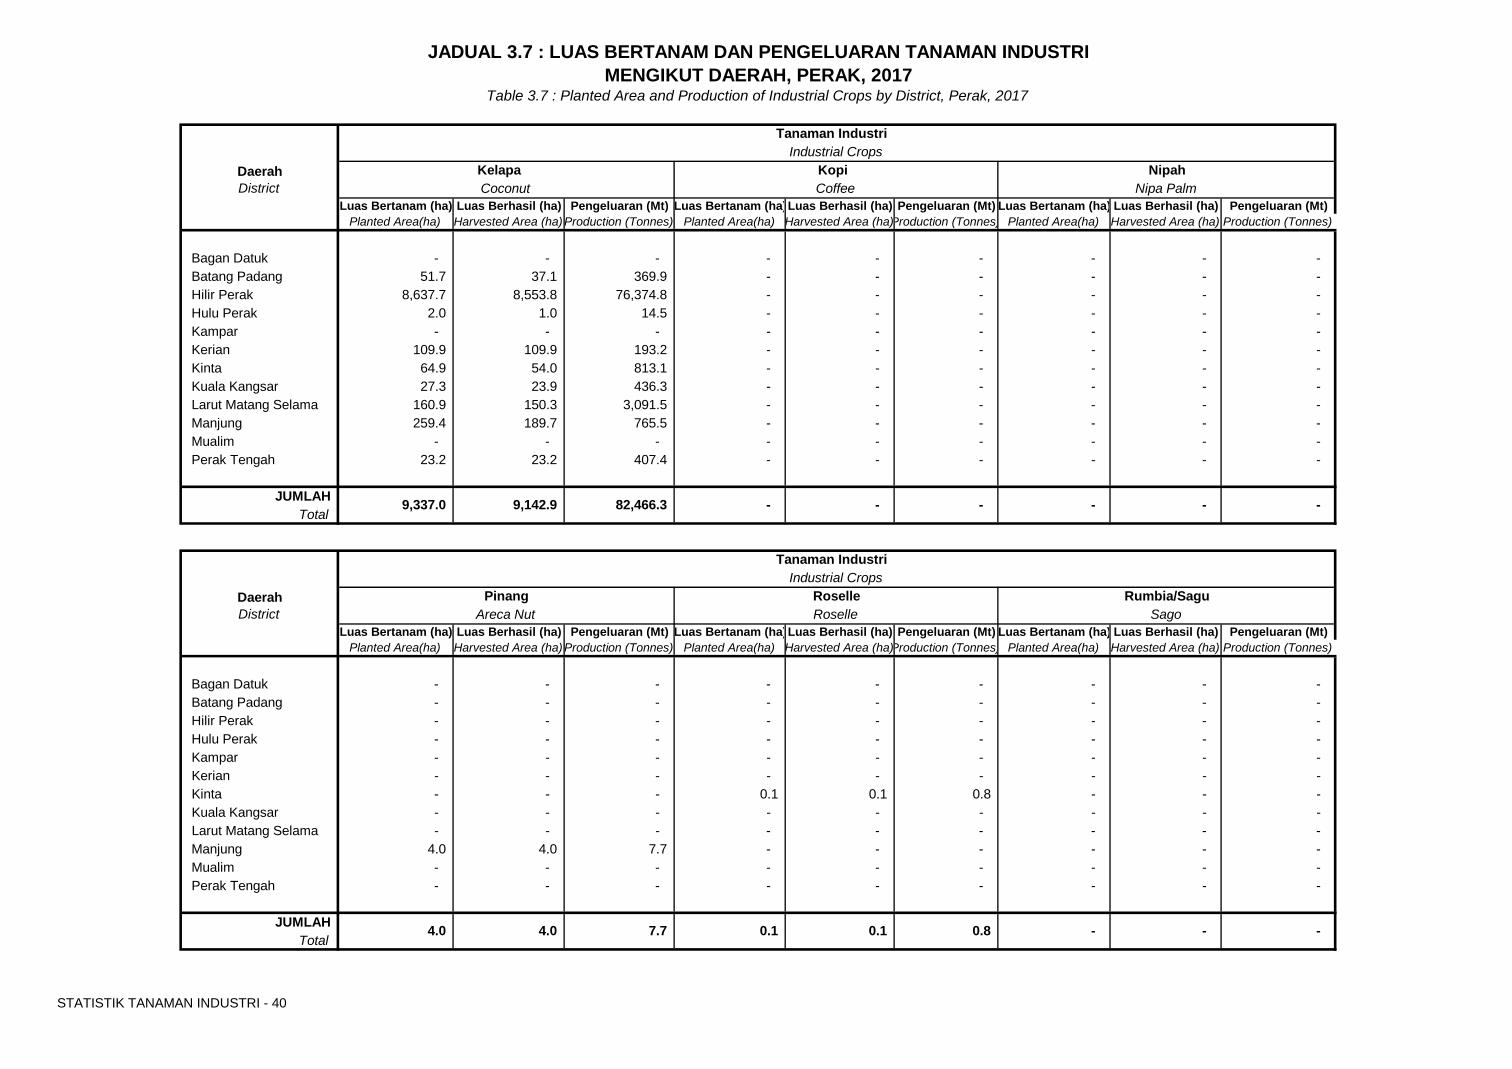
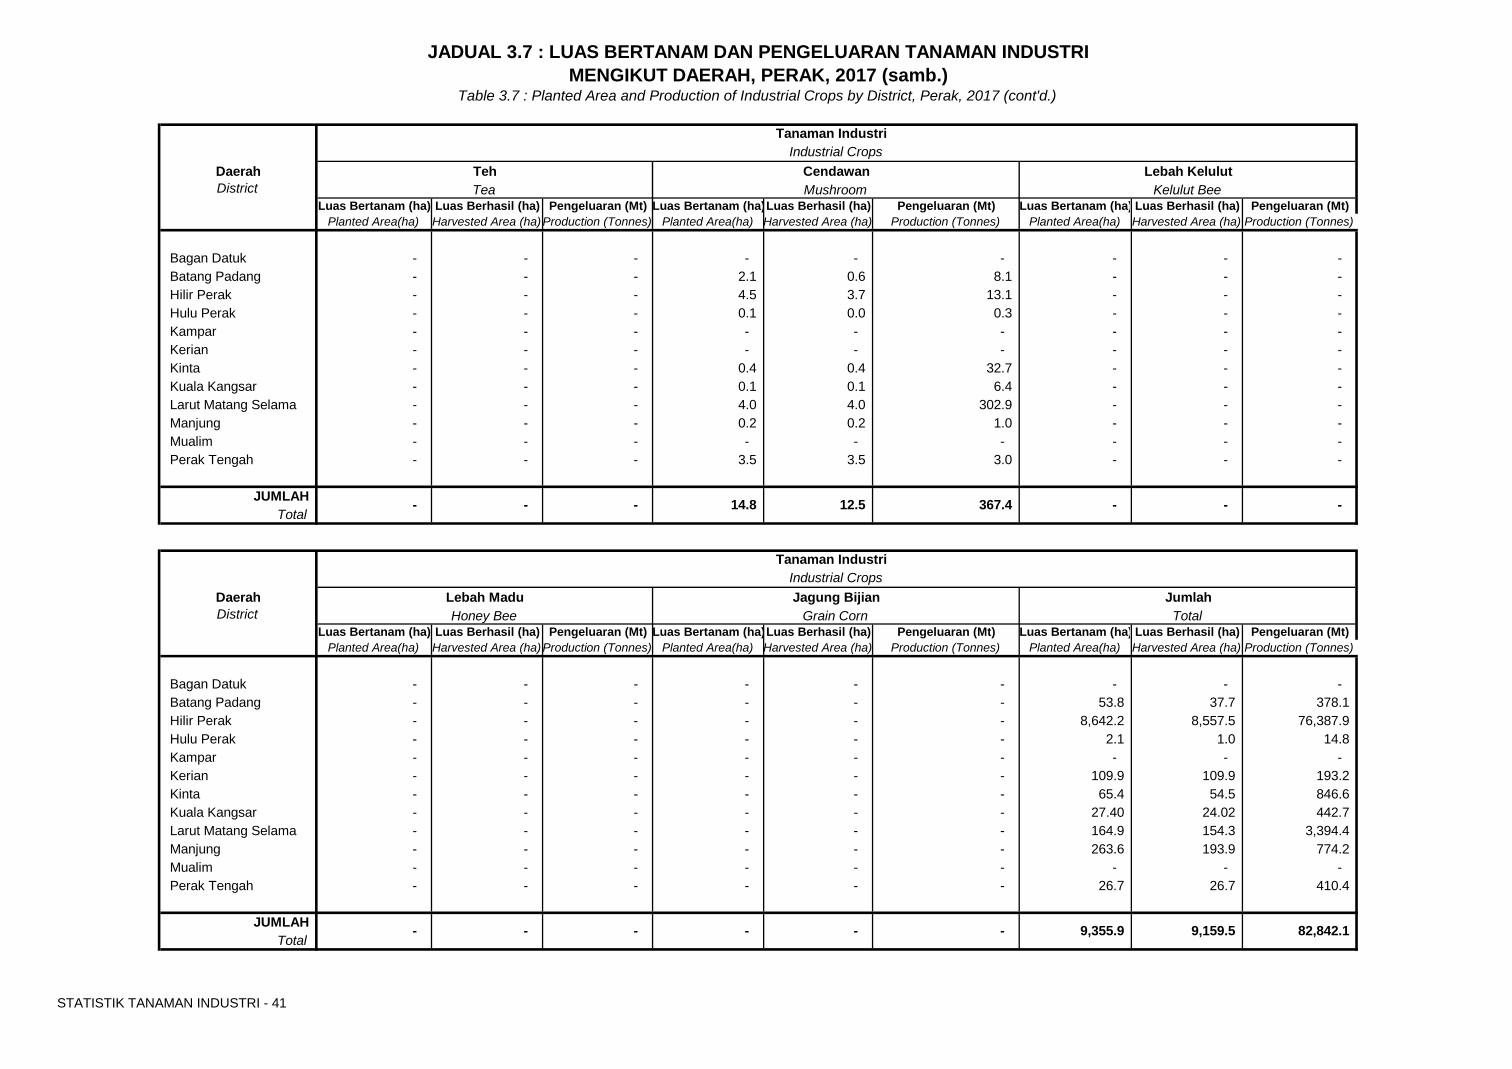
Bagan Datuk - - - - - - - - - Batang Padang 51.7 37.1 369.9 - - - - - - Hilir Perak 8,637.7 8,553.8 76,374.8 - - - - - - Hulu Perak 2.0 1.0 14.5 - - - - - - Kampar - - - - - - - - - Kerian 109.9 109.9 193.2 - - - - - - Kinta 64.9 54.0 813.1 - - - - - - Kuala Kangsar 27.3 23.9 436.3 - - - - - - Larut Matang Selama 160.9 150.3 3,091.5 - - - - - - Manjung 259.4 189.7 765.5 - - - - - - Mualim - - - - - - - - - Perak Tengah 23.2 23.2 407.4 - - - - - -
JUMLAHTotal
Luas Bertanam (ha) Luas Berhasil (ha) Pengeluaran (Mt) Luas Bertanam (ha)Luas Berhasil (ha) Pengeluaran (Mt) Luas Bertanam (ha) Luas Berhasil (ha) Pengeluaran (Mt)Planted Area(ha) Harvested Area (ha)Production (Tonnes) Planted Area(ha) Harvested Area (ha)Production (Tonnes) Planted Area(ha) Harvested Area (ha) Production (Tonnes)
Bagan Datuk - - - - - - - - - Batang Padang - - - - - - - - - Hilir Perak - - - - - - - - - Hulu Perak - - - - - - - - - Kampar - - - - - - - - - Kerian - - - - - - - - - Kinta - - - 0.1 0.1 0.8 - - - Kuala Kangsar - - - - - - - - - Larut Matang Selama - - - - - - - - - Manjung 4.0 4.0 7.7 - - - - - - Mualim - - - - - - - - - Perak Tengah - - - - - - - - -
JUMLAHTotal
Sago
- 7.7
District
- 0.1
Areca Nut
0.8 4.0 -
Roselle
4.0 0.1
Rumbia/Sagu
Tanaman Industri Industrial Crops
PinangDaerah Roselle
Tanaman Industri
NipahCoffee
-
JADUAL 3.7 : LUAS BERTANAM DAN PENGELUARAN TANAMAN INDUSTRI MENGIKUT DAERAH, PERAK, 2017
Table 3.7 : Planted Area and Production of Industrial Crops by District, Perak, 2017
DaerahIndustrial Crops
DistrictKopi
Nipa Palm
- 82,466.3
Kelapa
9,142.9 9,337.0 - - -
Coconut
-
STATISTIK TANAMAN INDUSTRI - 41
Luas Bertanam (ha) Luas Berhasil (ha) Pengeluaran (Mt) Luas Bertanam (ha)Luas Berhasil (ha) Pengeluaran (Mt) Luas Bertanam (ha) Luas Berhasil (ha) Pengeluaran (Mt)Planted Area(ha) Harvested Area (ha)Production (Tonnes) Planted Area(ha) Harvested Area (ha) Production (Tonnes) Planted Area(ha) Harvested Area (ha) Production (Tonnes)
Bagan Datuk - - - - - - - - - Batang Padang - - - 2.1 0.6 8.1 - - - Hilir Perak - - - 4.5 3.7 13.1 - - - Hulu Perak - - - 0.1 0.0 0.3 - - - Kampar - - - - - - - - - Kerian - - - - - - - - - Kinta - - - 0.4 0.4 32.7 - - - Kuala Kangsar - - - 0.1 0.1 6.4 - - - Larut Matang Selama - - - 4.0 4.0 302.9 - - - Manjung - - - 0.2 0.2 1.0 - - - Mualim - - - - - - - - - Perak Tengah - - - 3.5 3.5 3.0 - - -
JUMLAHTotal
Luas Bertanam (ha) Luas Berhasil (ha) Pengeluaran (Mt) Luas Bertanam (ha)Luas Berhasil (ha) Pengeluaran (Mt) Luas Bertanam (ha) Luas Berhasil (ha) Pengeluaran (Mt)Planted Area(ha) Harvested Area (ha)Production (Tonnes) Planted Area(ha) Harvested Area (ha) Production (Tonnes) Planted Area(ha) Harvested Area (ha) Production (Tonnes)
Bagan Datuk - - - - - - - - - Batang Padang - - - - - - 53.8 37.7 378.1 Hilir Perak - - - - - - 8,642.2 8,557.5 76,387.9 Hulu Perak - - - - - - 2.1 1.0 14.8 Kampar - - - - - - - - - Kerian - - - - - - 109.9 109.9 193.2 Kinta - - - - - - 65.4 54.5 846.6 Kuala Kangsar - - - - - - 27.40 24.02 442.7 Larut Matang Selama - - - - - - 164.9 154.3 3,394.4 Manjung - - - - - - 263.6 193.9 774.2 Mualim - - - - - - - - - Perak Tengah - - - - - - 26.7 26.7 410.4
JUMLAHTotal
Total
9,159.5 -
District
82,842.1 -
Honey Bee
- - 9,355.9
Grain Corn
- -
JumlahLebah MaduDaerah Jagung Bijian
Tanaman Industri Industrial Crops
Tanaman Industri
Lebah KelulutMushroom
14.8
JADUAL 3.7 : LUAS BERTANAM DAN PENGELUARAN TANAMAN INDUSTRI MENGIKUT DAERAH, PERAK, 2017 (samb.)
Table 3.7 : Planted Area and Production of Industrial Crops by District, Perak, 2017 (cont'd.)
DaerahIndustrial Crops
DistrictCendawan
Kelulut Bee
367.4 -
Teh
- - - - -
Tea
12.5

Muka surat ini sengaja dibiarkan kosong
PERLIS
PERLIS
STATISTIK TANAMAN INDUSTRI - 44
Luas Bertanam (ha) Luas Berhasil (ha) Pengeluaran (Mt) Luas Bertanam (ha) Luas Berhasil (ha) Pengeluaran (Mt) Luas Bertanam (ha) Luas Berhasil (ha) Pengeluaran (Mt)Planted Area(ha) Harvested Area (ha) Production (Tonnes) Planted Area(ha) Harvested Area (ha) Production (Tonnes) Planted Area(ha) Harvested Area (ha) Production (Tonnes)
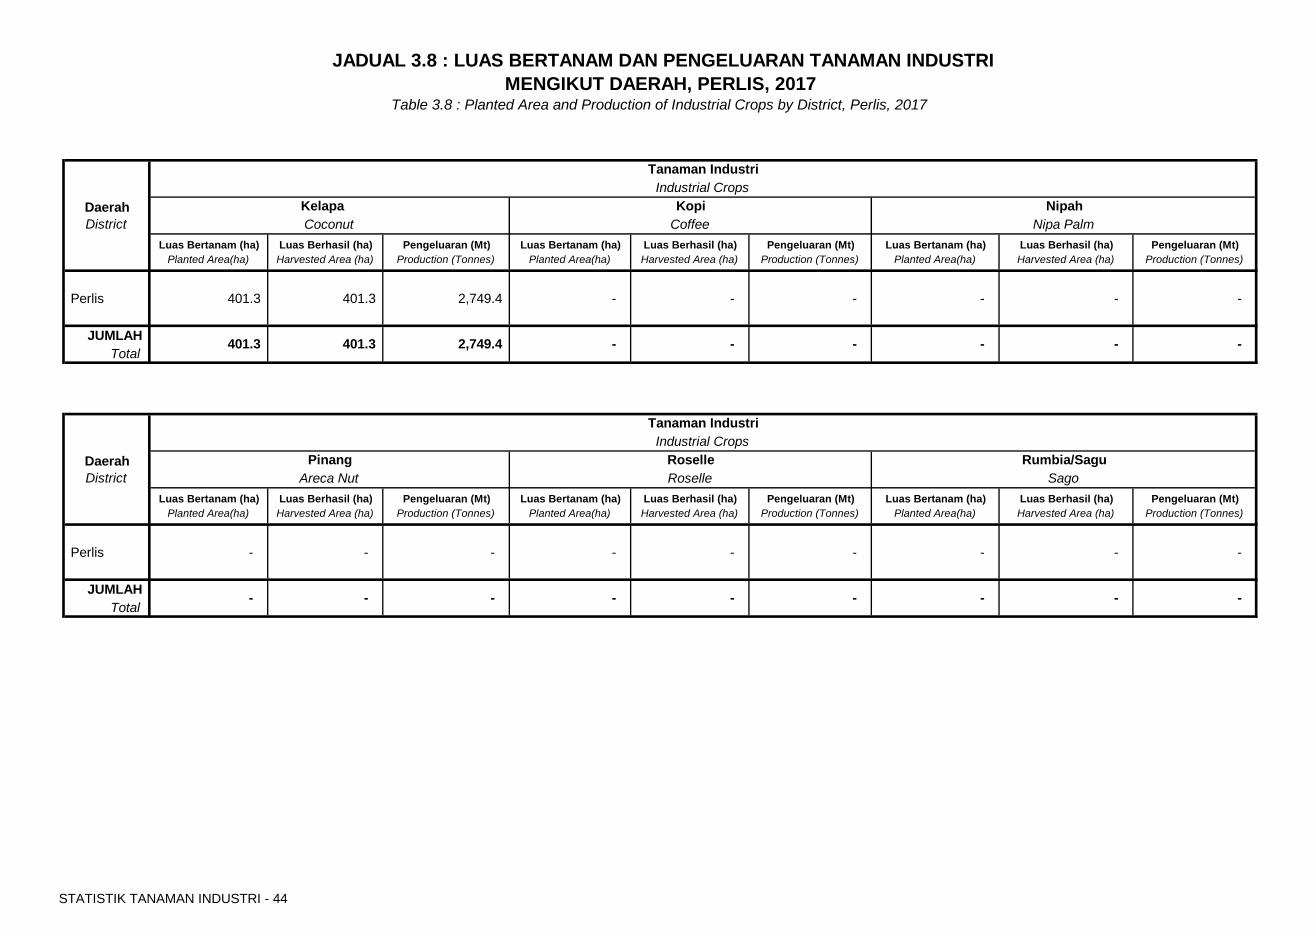
Perlis 401.3 401.3 2,749.4 - - - - - -
JUMLAHTotal
Luas Bertanam (ha) Luas Berhasil (ha) Pengeluaran (Mt) Luas Bertanam (ha) Luas Berhasil (ha) Pengeluaran (Mt) Luas Bertanam (ha) Luas Berhasil (ha) Pengeluaran (Mt)Planted Area(ha) Harvested Area (ha) Production (Tonnes) Planted Area(ha) Harvested Area (ha) Production (Tonnes) Planted Area(ha) Harvested Area (ha) Production (Tonnes)
Perlis - - - - - - - - -
JUMLAHTotal
JADUAL 3.8 : LUAS BERTANAM DAN PENGELUARAN TANAMAN INDUSTRI
Daerah
401.3 -
MENGIKUT DAERAH, PERLIS, 2017Table 3.8 : Planted Area and Production of Industrial Crops by District, Perlis, 2017
NipahNipa PalmCoconut Coffee
Industrial CropsPinang
District
-
Daerah Kopi
-
- -
District Areca Nut Sago
- -
Rumbia/Sagu
- -
Roselle
Tanaman IndustriIndustrial Crops
Kelapa
-
Roselle
Tanaman Industri
- 401.3 2,749.4
- - - -
STATISTIK TANAMAN INDUSTRI - 45
Luas Bertanam (ha) Luas Berhasil (ha) Pengeluaran (Mt) Luas Bertanam (ha) Luas Berhasil (ha) Pengeluaran (Mt) Luas Bertanam (ha) Luas Berhasil (ha) Pengeluaran (Mt)Planted Area(ha) Harvested Area (ha) Production (Tonnes) Planted Area(ha) Harvested Area (ha) Production (Tonnes) Planted Area(ha) Harvested Area (ha) Production (Tonnes)
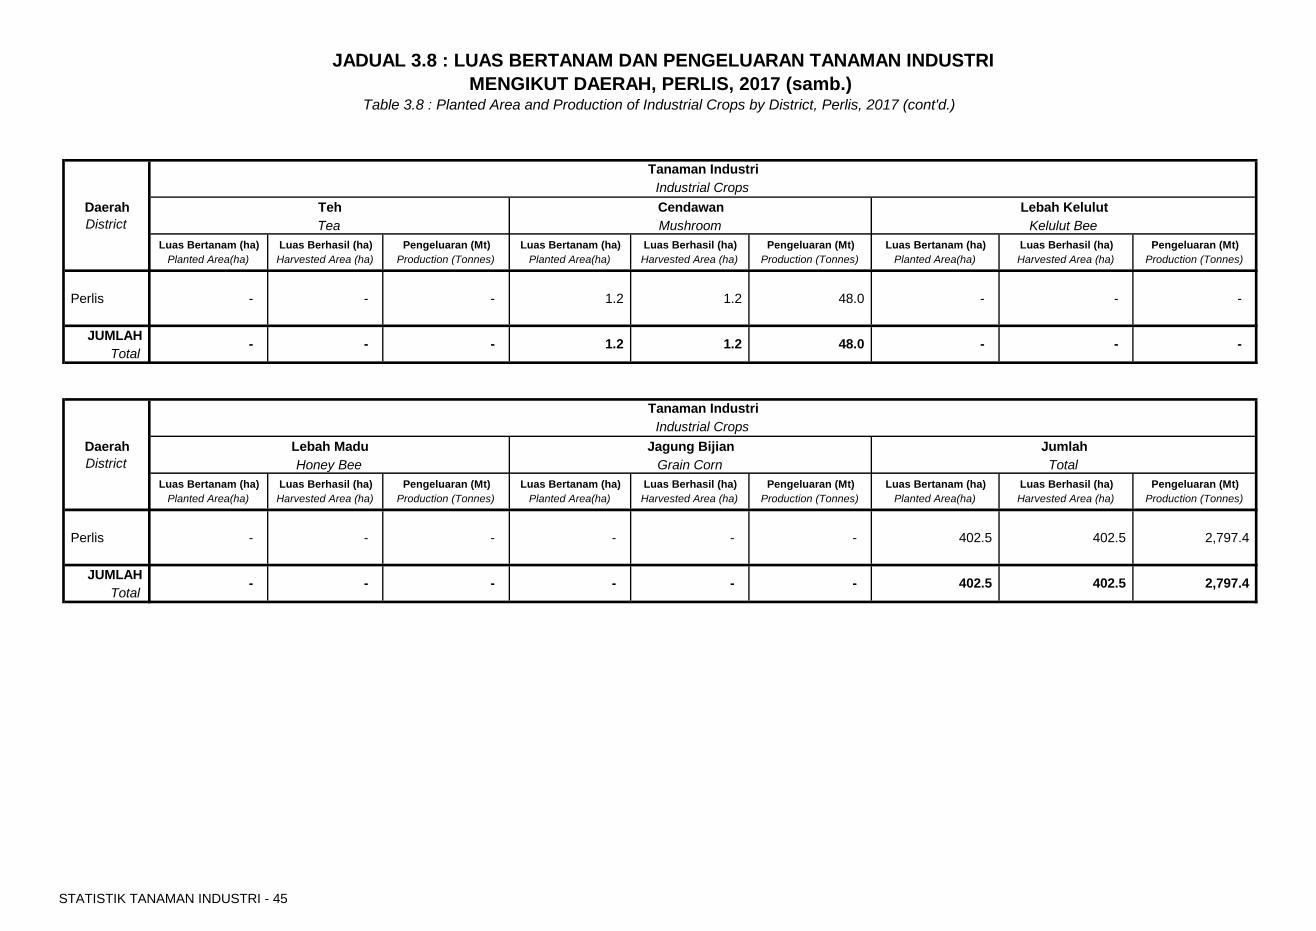
Perlis - - - 1.2 1.2 48.0 - - -
JUMLAHTotal
Luas Bertanam (ha) Luas Berhasil (ha) Pengeluaran (Mt) Luas Bertanam (ha) Luas Berhasil (ha) Pengeluaran (Mt) Luas Bertanam (ha) Luas Berhasil (ha) Pengeluaran (Mt)Planted Area(ha) Harvested Area (ha) Production (Tonnes) Planted Area(ha) Harvested Area (ha) Production (Tonnes) Planted Area(ha) Harvested Area (ha) Production (Tonnes)
Perlis - - - - - - 402.5 402.5 2,797.4
JUMLAHTotal
Daerah
- -
District Honey Bee Total
JADUAL 3.8 : LUAS BERTANAM DAN PENGELUARAN TANAMAN INDUSTRI
Daerah
- 1.2
MENGIKUT DAERAH, PERLIS, 2017 (samb.)Table 3.8 : Planted Area and Production of Industrial Crops by District, Perlis, 2017 (cont'd.)
Lebah KelulutKelulut BeeTea Mushroom
Lebah Madu
District
1.2
Industrial Crops
2,797.4 -
Jagung Bijian
402.5 402.5
Cendawan
Tanaman IndustriIndustrial Crops
Teh
-
Grain Corn
48.0 - -
- - - -
-
Jumlah
Tanaman Industri

Muka surat ini sengaja dibiarkan kosong
PULAU PINANG
PENANG
STATISTIK TANAMAN INDUSTRI - 48
Luas Bertanam (ha) Luas Berhasil (ha) Pengeluaran (Mt) Luas Bertanam (ha) Luas Berhasil (ha) Pengeluaran (Mt) Luas Bertanam (ha) Luas Berhasil (ha) Pengeluaran (Mt)Planted Area (ha) Harvested Area (ha) Production (Tonnes) Planted Area (ha) Harvested Area (ha) Production (Tonnes) Planted Area (ha) Harvested Area (ha) Production (Tonnes)
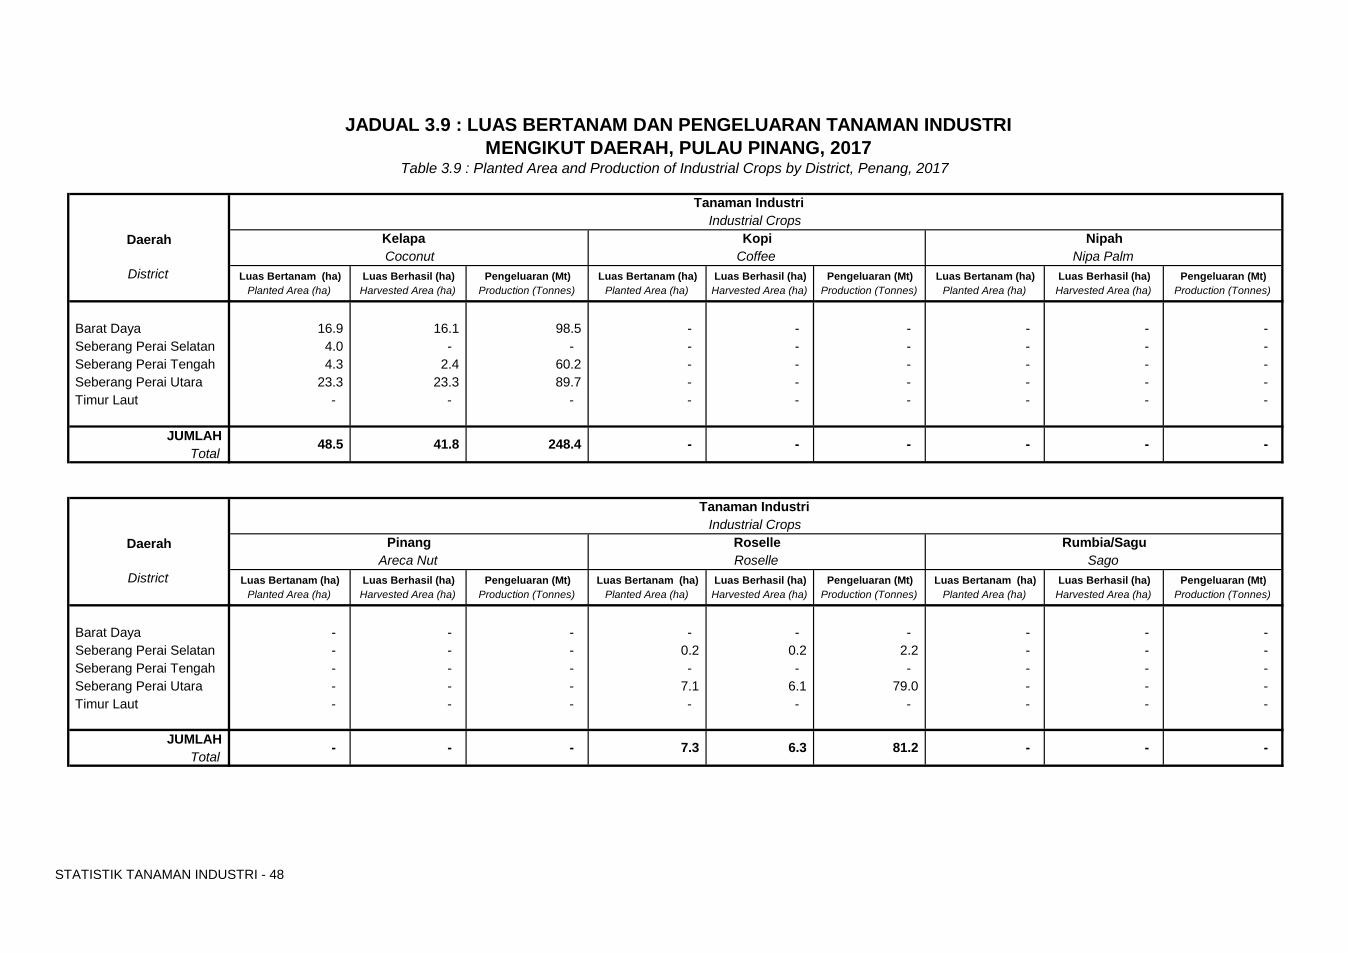
Barat Daya 16.9 16.1 98.5 - - - - - - Seberang Perai Selatan 4.0 - - - - - - - - Seberang Perai Tengah 4.3 2.4 60.2 - - - - - - Seberang Perai Utara 23.3 23.3 89.7 - - - - - - Timur Laut - - - - - - - - -
JUMLAHTotal
Luas Bertanam (ha) Luas Berhasil (ha) Pengeluaran (Mt) Luas Bertanam (ha) Luas Berhasil (ha) Pengeluaran (Mt) Luas Bertanam (ha) Luas Berhasil (ha) Pengeluaran (Mt)Planted Area (ha) Harvested Area (ha) Production (Tonnes) Planted Area (ha) Harvested Area (ha) Production (Tonnes) Planted Area (ha) Harvested Area (ha) Production (Tonnes)
Barat Daya - - - - - - - - - Seberang Perai Selatan - - - 0.2 0.2 2.2 - - - Seberang Perai Tengah - - - - - - - - - Seberang Perai Utara - - - 7.1 6.1 79.0 - - - Timur Laut - - - - - - - - -
JUMLAHTotal
- 48.5
- -
-
Rumbia/SaguRoselle
Tanaman Industri
41.8
JADUAL 3.9 : LUAS BERTANAM DAN PENGELUARAN TANAMAN INDUSTRI MENGIKUT DAERAH, PULAU PINANG, 2017
Table 3.9 : Planted Area and Production of Industrial Crops by District, Penang, 2017
Pinang
District
- -
KopiIndustrial Crops
DaerahIndustrial Crops
Daerah
248.4
Roselle
-
Nipa Palm
Tanaman Industri
Areca Nut
- -
District
Coconut
6.3 - 81.2 7.3
NipahKelapa Coffee
-
-
Sago
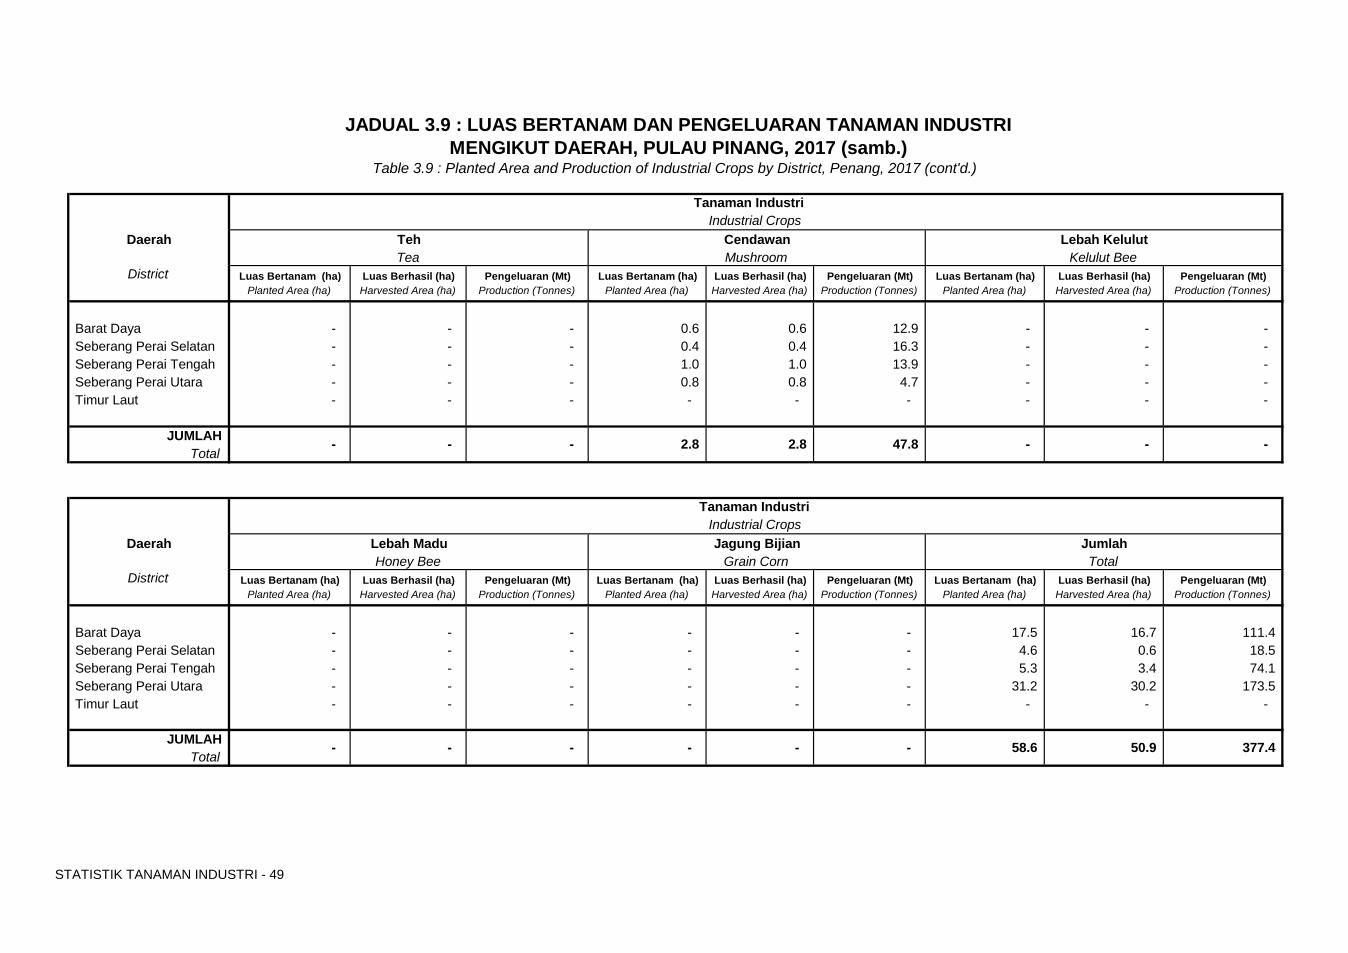
STATISTIK TANAMAN INDUSTRI - 49
Luas Bertanam (ha) Luas Berhasil (ha) Pengeluaran (Mt) Luas Bertanam (ha) Luas Berhasil (ha) Pengeluaran (Mt) Luas Bertanam (ha) Luas Berhasil (ha) Pengeluaran (Mt)Planted Area (ha) Harvested Area (ha) Production (Tonnes) Planted Area (ha) Harvested Area (ha) Production (Tonnes) Planted Area (ha) Harvested Area (ha) Production (Tonnes)
Barat Daya - - - 0.6 0.6 12.9 - - - Seberang Perai Selatan - - - 0.4 0.4 16.3 - - - Seberang Perai Tengah - - - 1.0 1.0 13.9 - - - Seberang Perai Utara - - - 0.8 0.8 4.7 - - - Timur Laut - - - - - - - - -
JUMLAHTotal
Luas Bertanam (ha) Luas Berhasil (ha) Pengeluaran (Mt) Luas Bertanam (ha) Luas Berhasil (ha) Pengeluaran (Mt) Luas Bertanam (ha) Luas Berhasil (ha) Pengeluaran (Mt)Planted Area (ha) Harvested Area (ha) Production (Tonnes) Planted Area (ha) Harvested Area (ha) Production (Tonnes) Planted Area (ha) Harvested Area (ha) Production (Tonnes)
Barat Daya - - - - - - 17.5 16.7 111.4 Seberang Perai Selatan - - - - - - 4.6 0.6 18.5 Seberang Perai Tengah - - - - - - 5.3 3.4 74.1 Seberang Perai Utara - - - - - - 31.2 30.2 173.5 Timur Laut - - - - - - - - -
JUMLAHTotal
JADUAL 3.9 : LUAS BERTANAM DAN PENGELUARAN TANAMAN INDUSTRI MENGIKUT DAERAH, PULAU PINANG, 2017 (samb.)
Table 3.9 : Planted Area and Production of Industrial Crops by District, Penang, 2017 (cont'd.)
Lebah Madu
District
2.8 -
CendawanIndustrial Crops
Daerah
Daerah
-
Jagung Bijian
47.8
Kelulut Bee
Tanaman Industri
District
Tea
- - - -
-
- -
2.8
Grain Corn
-
Honey Bee
Tanaman Industri
Lebah KelulutTehMushroom
377.4
-
Total
-
Jumlah
58.6 50.9
Industrial Crops

Muka surat ini sengaja dibiarkan kosong
SELANGOR
SELANGOR
STATISTIK TANAMAN INDUSTRI - 52
Luas Bertanam (ha) Luas Berhasil (ha) Pengeluaran (Mt) Luas Bertanam (ha) Luas Berhasil (ha) Pengeluaran (Mt) Luas Bertanam (ha) Luas Berhasil (ha) Pengeluaran (Mt)Planted Area (ha) Harvested Area (ha) Production (Tonnes) Planted Area (ha) Harvested Area (ha) Production (Tonnes) Planted Area (ha) Harvested Area (ha) Production (Tonnes)
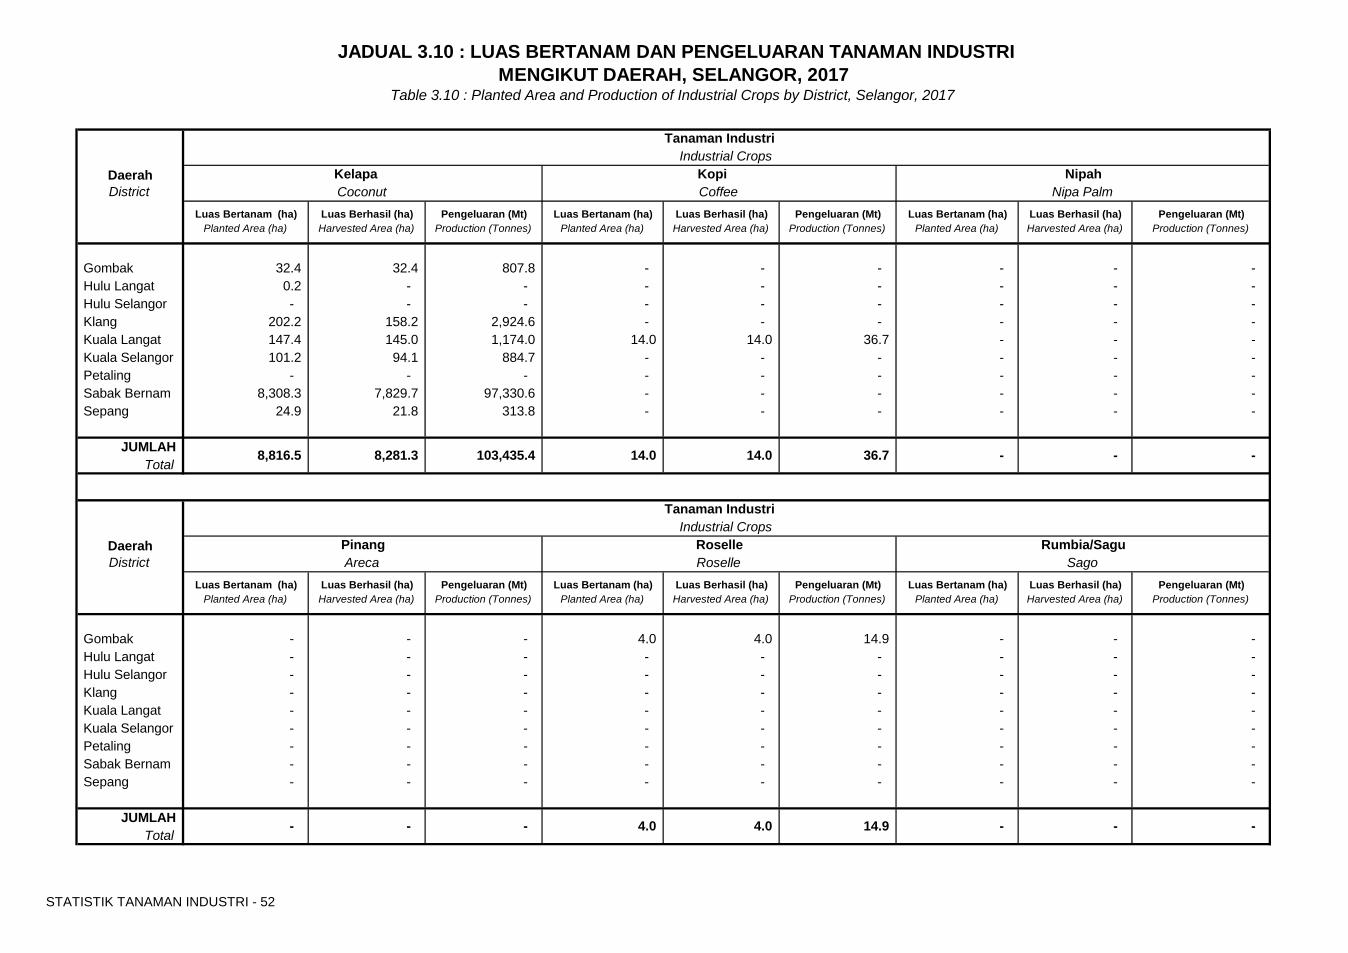
Gombak 32.4 32.4 807.8 - - - - - - Hulu Langat 0.2 - - - - - - - - Hulu Selangor - - - - - - - - - Klang 202.2 158.2 2,924.6 - - - - - - Kuala Langat 147.4 145.0 1,174.0 14.0 14.0 36.7 - - - Kuala Selangor 101.2 94.1 884.7 - - - - - - Petaling - - - - - - - - - Sabak Bernam 8,308.3 7,829.7 97,330.6 - - - - - - Sepang 24.9 21.8 313.8 - - - - - -
JUMLAHTotal
Luas Bertanam (ha) Luas Berhasil (ha) Pengeluaran (Mt) Luas Bertanam (ha) Luas Berhasil (ha) Pengeluaran (Mt) Luas Bertanam (ha) Luas Berhasil (ha) Pengeluaran (Mt)Planted Area (ha) Harvested Area (ha) Production (Tonnes) Planted Area (ha) Harvested Area (ha) Production (Tonnes) Planted Area (ha) Harvested Area (ha) Production (Tonnes)
Gombak - - - 4.0 4.0 14.9 - - - Hulu Langat - - - - - - - - - Hulu Selangor - - - - - - - - - Klang - - - - - - - - - Kuala Langat - - - - - - - - - Kuala Selangor - - - - - - - - - Petaling - - - - - - - - - Sabak Bernam - - - - - - - - - Sepang - - - - - - - - -
JUMLAHTotal
Daerah
-
RoselleDistrict
- - 4.0
Roselle
Tanaman Industri
- 4.0
Industrial Crops
Areca
-
Rumbia/Sagu
14.9 -
JADUAL 3.10 : LUAS BERTANAM DAN PENGELUARAN TANAMAN INDUSTRIMENGIKUT DAERAH, SELANGOR, 2017
Table 3.10 : Planted Area and Production of Industrial Crops by District, Selangor, 2017
36.7 14.0 -
Industrial Crops
CoconutDaerah Kelapa District
8,816.5
Tanaman Industri
8,281.3 -
Kopi NipahCoffee
SagoPinang
-
Nipa Palm
14.0 103,435.4
STATISTIK TANAMAN INDUSTRI - 53
Luas Bertanam (ha) Luas Berhasil (ha) Pengeluaran (Mt) Luas Bertanam (ha) Luas Berhasil (ha) Pengeluaran (Mt) Luas Bertanam (ha) Luas Berhasil (ha) Pengeluaran (Mt)Planted Area (ha) Harvested Area (ha) Production (Tonnes) Planted Area (ha) Harvested Area (ha) Production (Tonnes) Planted Area (ha) Harvested Area (ha) Production (Tonnes)
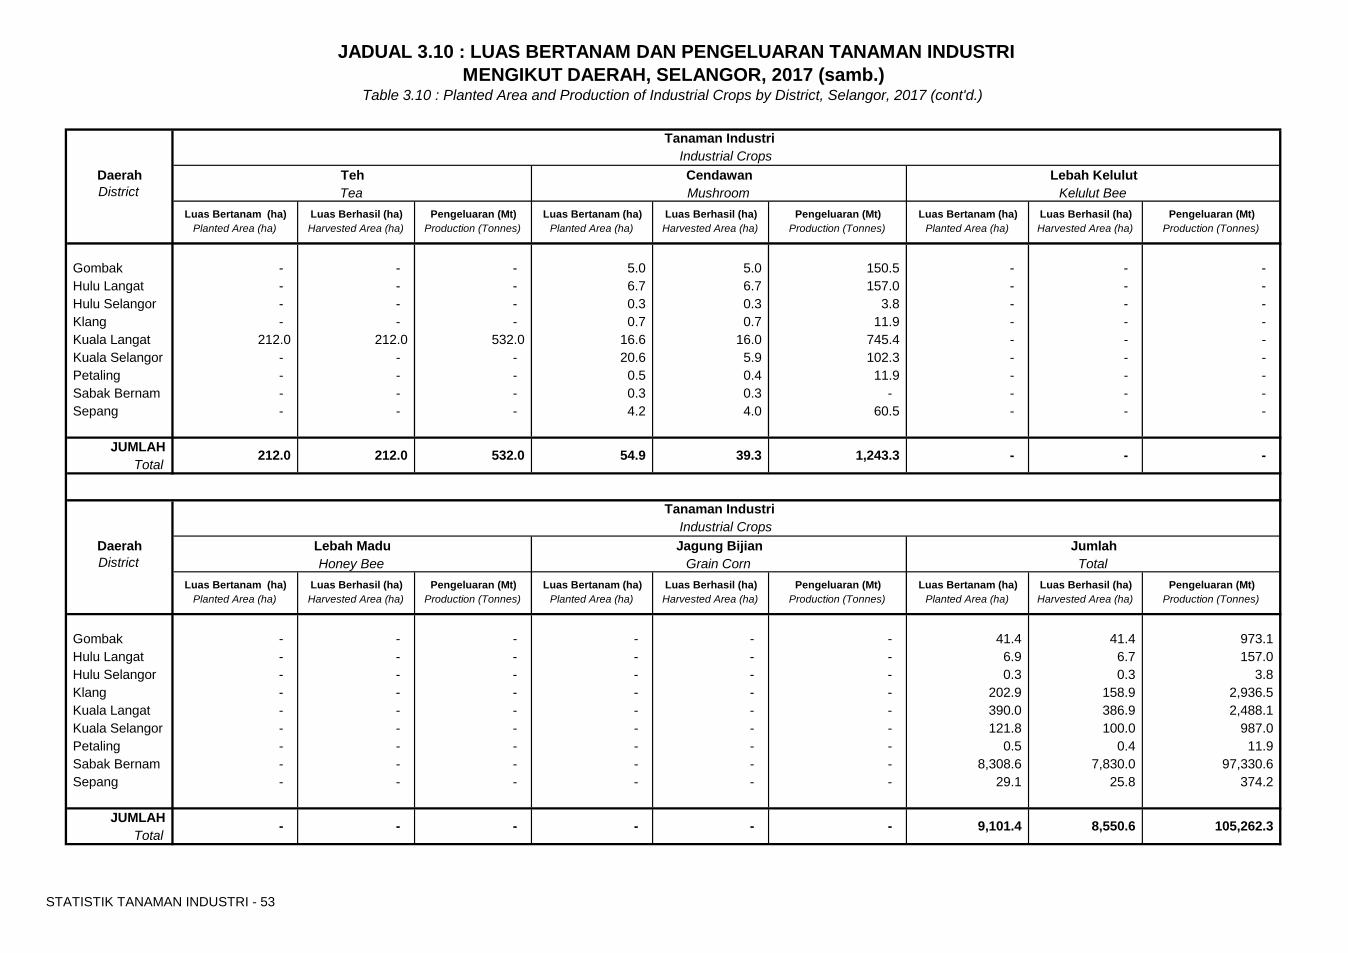
Gombak - - - 5.0 5.0 150.5 - - - Hulu Langat - - - 6.7 6.7 157.0 - - - Hulu Selangor - - - 0.3 0.3 3.8 - - - Klang - - - 0.7 0.7 11.9 - - - Kuala Langat 212.0 212.0 532.0 16.6 16.0 745.4 - - - Kuala Selangor - - - 20.6 5.9 102.3 - - - Petaling - - - 0.5 0.4 11.9 - - - Sabak Bernam - - - 0.3 0.3 - - - - Sepang - - - 4.2 4.0 60.5 - - -
JUMLAHTotal
Luas Bertanam (ha) Luas Berhasil (ha) Pengeluaran (Mt) Luas Bertanam (ha) Luas Berhasil (ha) Pengeluaran (Mt) Luas Bertanam (ha) Luas Berhasil (ha) Pengeluaran (Mt)Planted Area (ha) Harvested Area (ha) Production (Tonnes) Planted Area (ha) Harvested Area (ha) Production (Tonnes) Planted Area (ha) Harvested Area (ha) Production (Tonnes)
Gombak - - - - - - 41.4 41.4 973.1 Hulu Langat - - - - - - 6.9 6.7 157.0 Hulu Selangor - - - - - - 0.3 0.3 3.8 Klang - - - - - - 202.9 158.9 2,936.5 Kuala Langat - - - - - - 390.0 386.9 2,488.1 Kuala Selangor - - - - - - 121.8 100.0 987.0 Petaling - - - - - - 0.5 0.4 11.9 Sabak Bernam - - - - - - 8,308.6 7,830.0 97,330.6 Sepang - - - - - - 29.1 25.8 374.2
JUMLAHTotal
Lebah KelulutMushroom
TotalLebah Madu
-
Kelulut Bee
39.3 532.0
Tanaman Industri Industrial Crops
JADUAL 3.10 : LUAS BERTANAM DAN PENGELUARAN TANAMAN INDUSTRIMENGIKUT DAERAH, SELANGOR, 2017 (samb.)
Table 3.10 : Planted Area and Production of Industrial Crops by District, Selangor, 2017 (cont'd.)
1,243.3 54.9 -
Industrial Crops
TeaDaerah TehDistrict
212.0
Tanaman Industri
212.0 -
Cendawan
105,262.3
Jumlah
-
Daerah
-
Grain CornDistrict
9,101.4 - -
Jagung Bijian
- -
Honey Bee
8,550.6

Muka surat ini sengaja dibiarkan kosong
TERENGGANU
TERENGGANU
STATISTIK TANAMAN INDUSTRI - 56
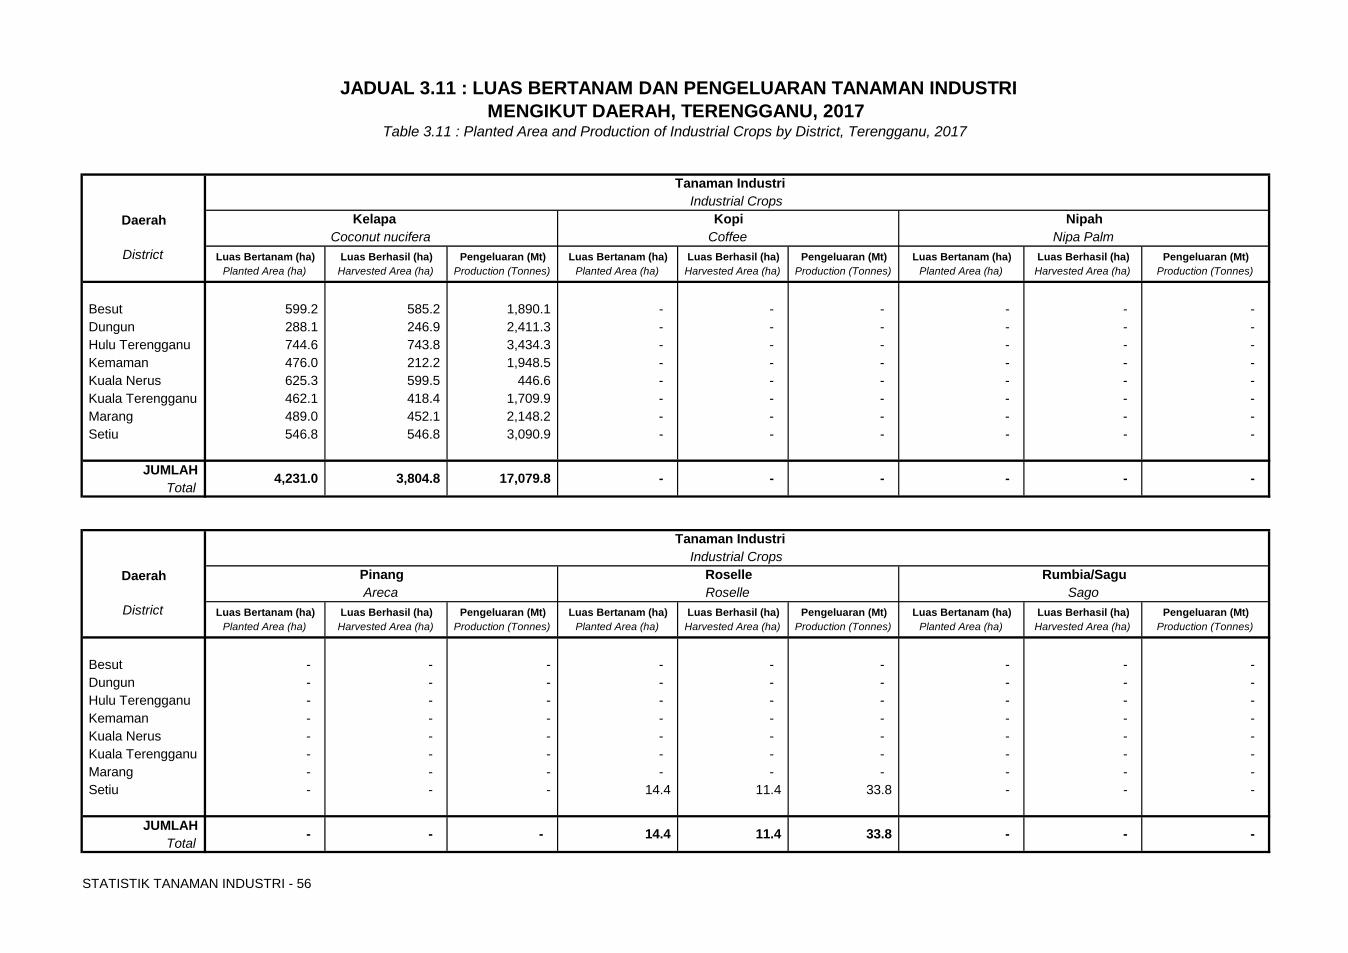
Luas Bertanam (ha) Luas Berhasil (ha) Pengeluaran (Mt) Luas Bertanam (ha) Luas Berhasil (ha) Pengeluaran (Mt) Luas Bertanam (ha) Luas Berhasil (ha) Pengeluaran (Mt)Planted Area (ha) Harvested Area (ha) Production (Tonnes) Planted Area (ha) Harvested Area (ha) Production (Tonnes) Planted Area (ha) Harvested Area (ha) Production (Tonnes)
Besut 599.2 585.2 1,890.1 - - - - - - Dungun 288.1 246.9 2,411.3 - - - - - - Hulu Terengganu 744.6 743.8 3,434.3 - - - - - - Kemaman 476.0 212.2 1,948.5 - - - - - - Kuala Nerus 625.3 599.5 446.6 - - - - - - Kuala Terengganu 462.1 418.4 1,709.9 - - - - - - Marang 489.0 452.1 2,148.2 - - - - - - Setiu 546.8 546.8 3,090.9 - - - - - -
JUMLAHTotal
Luas Bertanam (ha) Luas Berhasil (ha) Pengeluaran (Mt) Luas Bertanam (ha) Luas Berhasil (ha) Pengeluaran (Mt) Luas Bertanam (ha) Luas Berhasil (ha) Pengeluaran (Mt)Planted Area (ha) Harvested Area (ha) Production (Tonnes) Planted Area (ha) Harvested Area (ha) Production (Tonnes) Planted Area (ha) Harvested Area (ha) Production (Tonnes)
Besut - - - - - - - - - Dungun - - - - - - - - - Hulu Terengganu - - - - - - - - - Kemaman - - - - - - - - - Kuala Nerus - - - - - - - - - Kuala Terengganu - - - - - - - - - Marang - - - - - - - - - Setiu - - - 14.4 11.4 33.8 - - -
JUMLAHTotal
33.8 -
District
- - - 14.4 11.4 -
Nipa Palm
- - -
-
Sago
4,231.0
Coffee
- - - 3,804.8 17,079.8
District
Kelapa Nipah
JADUAL 3.11 : LUAS BERTANAM DAN PENGELUARAN TANAMAN INDUSTRIMENGIKUT DAERAH, TERENGGANU, 2017
Table 3.11 : Planted Area and Production of Industrial Crops by District, Terengganu, 2017
Tanaman Industri
DaerahIndustrial Crops
KopiCoconut nucifera
Areca RoselleDaerah
Tanaman Industri Industrial Crops
Pinang Roselle Rumbia/Sagu
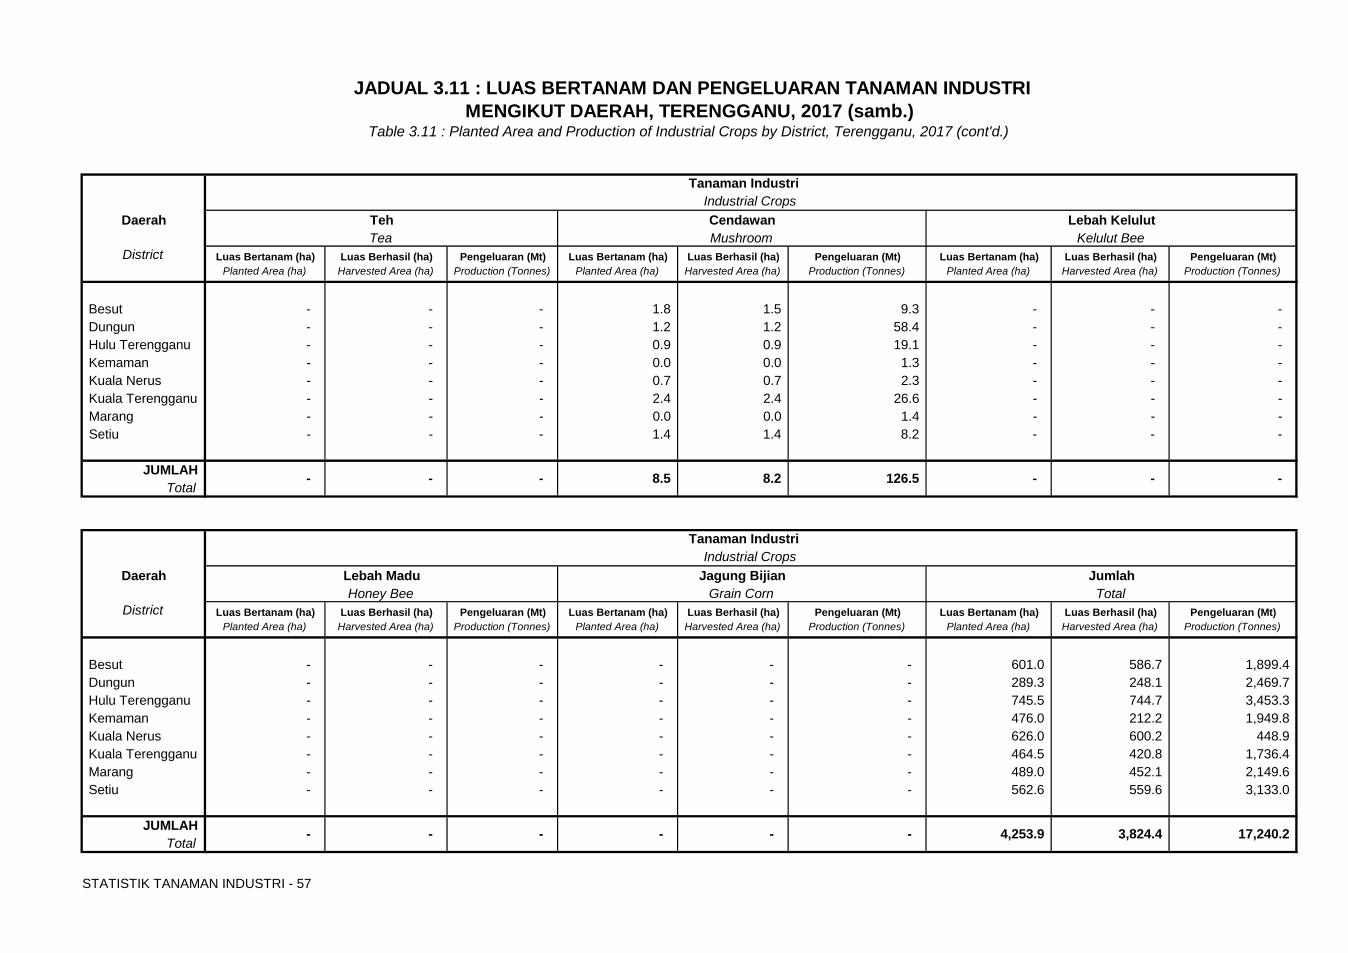
STATISTIK TANAMAN INDUSTRI - 57
Luas Bertanam (ha) Luas Berhasil (ha) Pengeluaran (Mt) Luas Bertanam (ha) Luas Berhasil (ha) Pengeluaran (Mt) Luas Bertanam (ha) Luas Berhasil (ha) Pengeluaran (Mt)Planted Area (ha) Harvested Area (ha) Production (Tonnes) Planted Area (ha) Harvested Area (ha) Production (Tonnes) Planted Area (ha) Harvested Area (ha) Production (Tonnes)
Besut - - - 1.8 1.5 9.3 - - - Dungun - - - 1.2 1.2 58.4 - - - Hulu Terengganu - - - 0.9 0.9 19.1 - - - Kemaman - - - 0.0 0.0 1.3 - - - Kuala Nerus - - - 0.7 0.7 2.3 - - - Kuala Terengganu - - - 2.4 2.4 26.6 - - - Marang - - - 0.0 0.0 1.4 - - - Setiu - - - 1.4 1.4 8.2 - - -
JUMLAHTotal
Luas Bertanam (ha) Luas Berhasil (ha) Pengeluaran (Mt) Luas Bertanam (ha) Luas Berhasil (ha) Pengeluaran (Mt) Luas Bertanam (ha) Luas Berhasil (ha) Pengeluaran (Mt)Planted Area (ha) Harvested Area (ha) Production (Tonnes) Planted Area (ha) Harvested Area (ha) Production (Tonnes) Planted Area (ha) Harvested Area (ha) Production (Tonnes)
Besut - - - - - - 601.0 586.7 1,899.4 Dungun - - - - - - 289.3 248.1 2,469.7 Hulu Terengganu - - - - - - 745.5 744.7 3,453.3 Kemaman - - - - - - 476.0 212.2 1,949.8 Kuala Nerus - - - - - - 626.0 600.2 448.9 Kuala Terengganu - - - - - - 464.5 420.8 1,736.4 Marang - - - - - - 489.0 452.1 2,149.6 Setiu - - - - - - 562.6 559.6 3,133.0
JUMLAHTotal
- 4,253.9
District
- - - - - 3,824.4
Kelulut Bee
- - -
17,240.2
TotalJumlah
Tanaman Industri Industrial Crops
-
Mushroom
8.5 8.2 126.5 - -
District
Teh Lebah Kelulut
JADUAL 3.11 : LUAS BERTANAM DAN PENGELUARAN TANAMAN INDUSTRIMENGIKUT DAERAH, TERENGGANU, 2017 (samb.)
Table 3.11 : Planted Area and Production of Industrial Crops by District, Terengganu, 2017 (cont'd.)
Tanaman Industri
DaerahIndustrial CropsCendawan
Tea
Honey Bee Grain CornDaerah Lebah Madu Jagung Bijian

Muka surat ini sengaja dibiarkan kosong
SABAH
SABAH
STATISTIK TANAMAN INDUSTRI - 60
Luas Bertanam (ha) Luas Berhasil (ha) Pengeluaran (Mt) Luas Bertanam (ha) Luas Berhasil (ha) Pengeluaran (Mt) Luas Bertanam (ha) Luas Berhasil (ha) Pengeluaran (Mt) Planted Area (ha) Harvested Area (ha) Production (Tonnes) Planted Area (ha) Harvested Area (ha) Production
Planted Area (ha) Harvested Area (ha) Production (Tonnes)
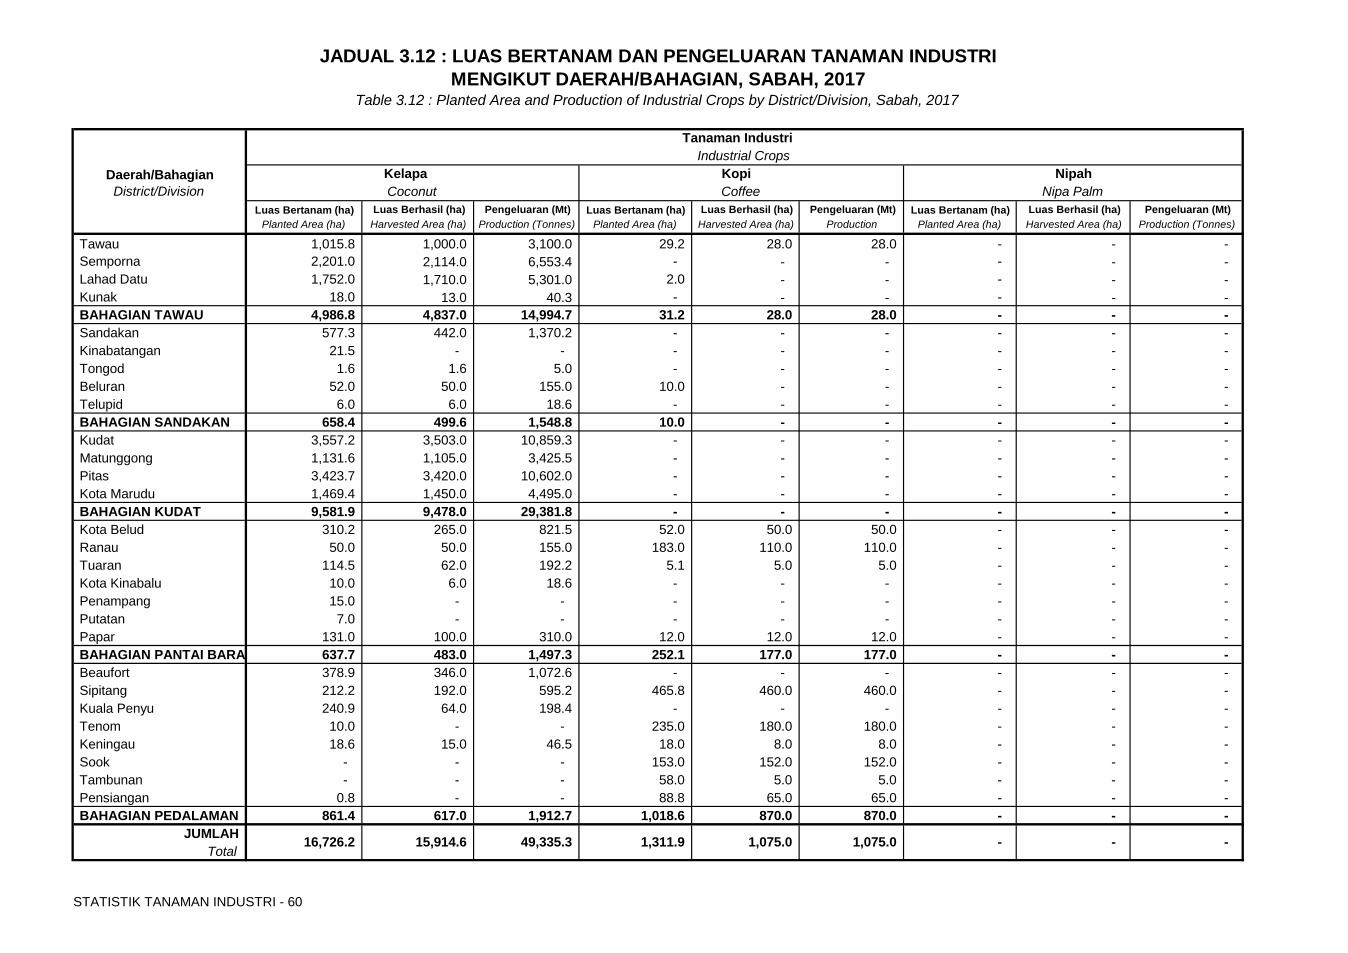
Tawau 1,015.8 1,000.0 3,100.0 29.2 28.0 28.0 - - - Semporna 2,201.0 2,114.0 6,553.4 - - - - - - Lahad Datu 1,752.0 1,710.0 5,301.0 2.0 - - - - - Kunak 18.0 13.0 40.3 - - - - - - BAHAGIAN TAWAU 4,986.8 4,837.0 14,994.7 31.2 28.0 28.0 - - - Sandakan 577.3 442.0 1,370.2 - - - - - - Kinabatangan 21.5 - - - - - - - - Tongod 1.6 1.6 5.0 - - - - - - Beluran 52.0 50.0 155.0 10.0 - - - - - Telupid 6.0 6.0 18.6 - - - - - - BAHAGIAN SANDAKAN 658.4 499.6 1,548.8 10.0 - - - - - Kudat 3,557.2 3,503.0 10,859.3 - - - - - - Matunggong 1,131.6 1,105.0 3,425.5 - - - - - - Pitas 3,423.7 3,420.0 10,602.0 - - - - - - Kota Marudu 1,469.4 1,450.0 4,495.0 - - - - - - BAHAGIAN KUDAT 9,581.9 9,478.0 29,381.8 - - - - - - Kota Belud 310.2 265.0 821.5 52.0 50.0 50.0 - - - Ranau 50.0 50.0 155.0 183.0 110.0 110.0 - - - Tuaran 114.5 62.0 192.2 5.1 5.0 5.0 - - - Kota Kinabalu 10.0 6.0 18.6 - - - - - - Penampang 15.0 - - - - - - - - Putatan 7.0 - - - - - - - - Papar 131.0 100.0 310.0 12.0 12.0 12.0 - - - BAHAGIAN PANTAI BARA 637.7 483.0 1,497.3 252.1 177.0 177.0 - - - Beaufort 378.9 346.0 1,072.6 - - - - - - Sipitang 212.2 192.0 595.2 465.8 460.0 460.0 - - - Kuala Penyu 240.9 64.0 198.4 - - - - - - Tenom 10.0 - - 235.0 180.0 180.0 - - - Keningau 18.6 15.0 46.5 18.0 8.0 8.0 - - - Sook - - - 153.0 152.0 152.0 - - - Tambunan - - - 58.0 5.0 5.0 - - - Pensiangan 0.8 - - 88.8 65.0 65.0 - - - BAHAGIAN PEDALAMAN 861.4 617.0 1,912.7 1,018.6 870.0 870.0 - - -
JUMLAHTotal
Nipa Palm
15,914.6 1,311.9 1,075.0 1,075.0 -
JADUAL 3.12 : LUAS BERTANAM DAN PENGELUARAN TANAMAN INDUSTRI MENGIKUT DAERAH/BAHAGIAN, SABAH, 2017
Table 3.12 : Planted Area and Production of Industrial Crops by District/Division, Sabah, 2017
16,726.2
District/Division CoconutDaerah/Bahagian Kopi
49,335.3
Coffee
Tanaman Industri Industrial Crops
NipahKelapa
- -
STATISTIK TANAMAN INDUSTRI - 61
Luas Bertanam (ha) Luas Berhasil (ha) Pengeluaran (Mt) Luas Bertanam (ha) Luas Berhasil (ha) Pengeluaran (Mt) Luas Bertanam (ha) Luas Berhasil (ha) Pengeluaran (Mt) Planted Area (ha) Harvested Area (ha) Production (Tonnes) Planted Area (ha) Harvested Area (ha) Production
(Tonnes) Planted Area (ha) Harvested Area (ha) Production (Tonnes)
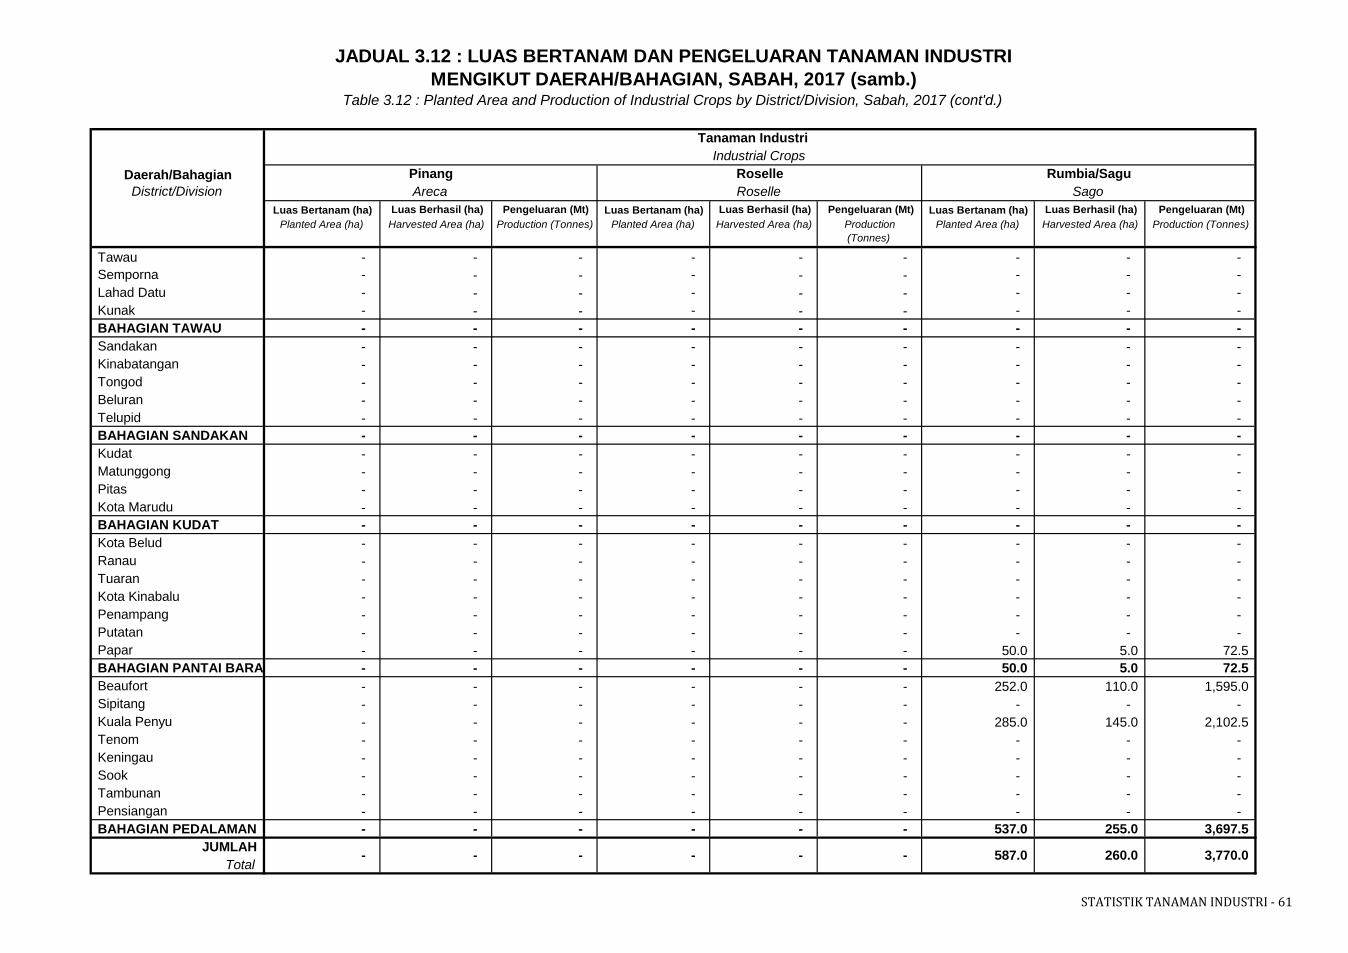
Tawau - - - - - - - - - Semporna - - - - - - - - - Lahad Datu - - - - - - - - - Kunak - - - - - - - - - BAHAGIAN TAWAU - - - - - - - - - Sandakan - - - - - - - - - Kinabatangan - - - - - - - - - Tongod - - - - - - - - - Beluran - - - - - - - - - Telupid - - - - - - - - - BAHAGIAN SANDAKAN - - - - - - - - - Kudat - - - - - - - - - Matunggong - - - - - - - - - Pitas - - - - - - - - - Kota Marudu - - - - - - - - - BAHAGIAN KUDAT - - - - - - - - - Kota Belud - - - - - - - - - Ranau - - - - - - - - - Tuaran - - - - - - - - - Kota Kinabalu - - - - - - - - - Penampang - - - - - - - - - Putatan - - - - - - - - - Papar - - - - - - 50.0 5.0 72.5 BAHAGIAN PANTAI BARA - - - - - - 50.0 5.0 72.5 Beaufort - - - - - - 252.0 110.0 1,595.0 Sipitang - - - - - - - - - Kuala Penyu - - - - - - 285.0 145.0 2,102.5 Tenom - - - - - - - - - Keningau - - - - - - - - - Sook - - - - - - - - - Tambunan - - - - - - - - - Pensiangan - - - - - - - - - BAHAGIAN PEDALAMAN - - - - - - 537.0 255.0 3,697.5
JUMLAHTotal
- - -
Pinang RoselleRoselle
JADUAL 3.12 : LUAS BERTANAM DAN PENGELUARAN TANAMAN INDUSTRI MENGIKUT DAERAH/BAHAGIAN, SABAH, 2017 (samb.)
Table 3.12 : Planted Area and Production of Industrial Crops by District/Division, Sabah, 2017 (cont'd.)
- - 3,770.0
Industrial CropsRumbia/Sagu
587.0
Areca
Tanaman Industri
-
District/DivisionDaerah/Bahagian
Sago
260.0
STATISTIK TANAMAN INDUSTRI - 62
Luas Bertanam (ha) Luas Berhasil (ha) Pengeluaran (Mt) Luas Bertanam (ha)
(ha) Pengeluaran (Mt) Luas Bertanam (ha) Luas Berhasil (ha) Pengeluaran (Mt) Planted Area (ha) Harvested Area
Production
Planted Area (ha) Harvested Area
Production
Planted Area (ha) Harvested Area (ha) Production (Tonnes)
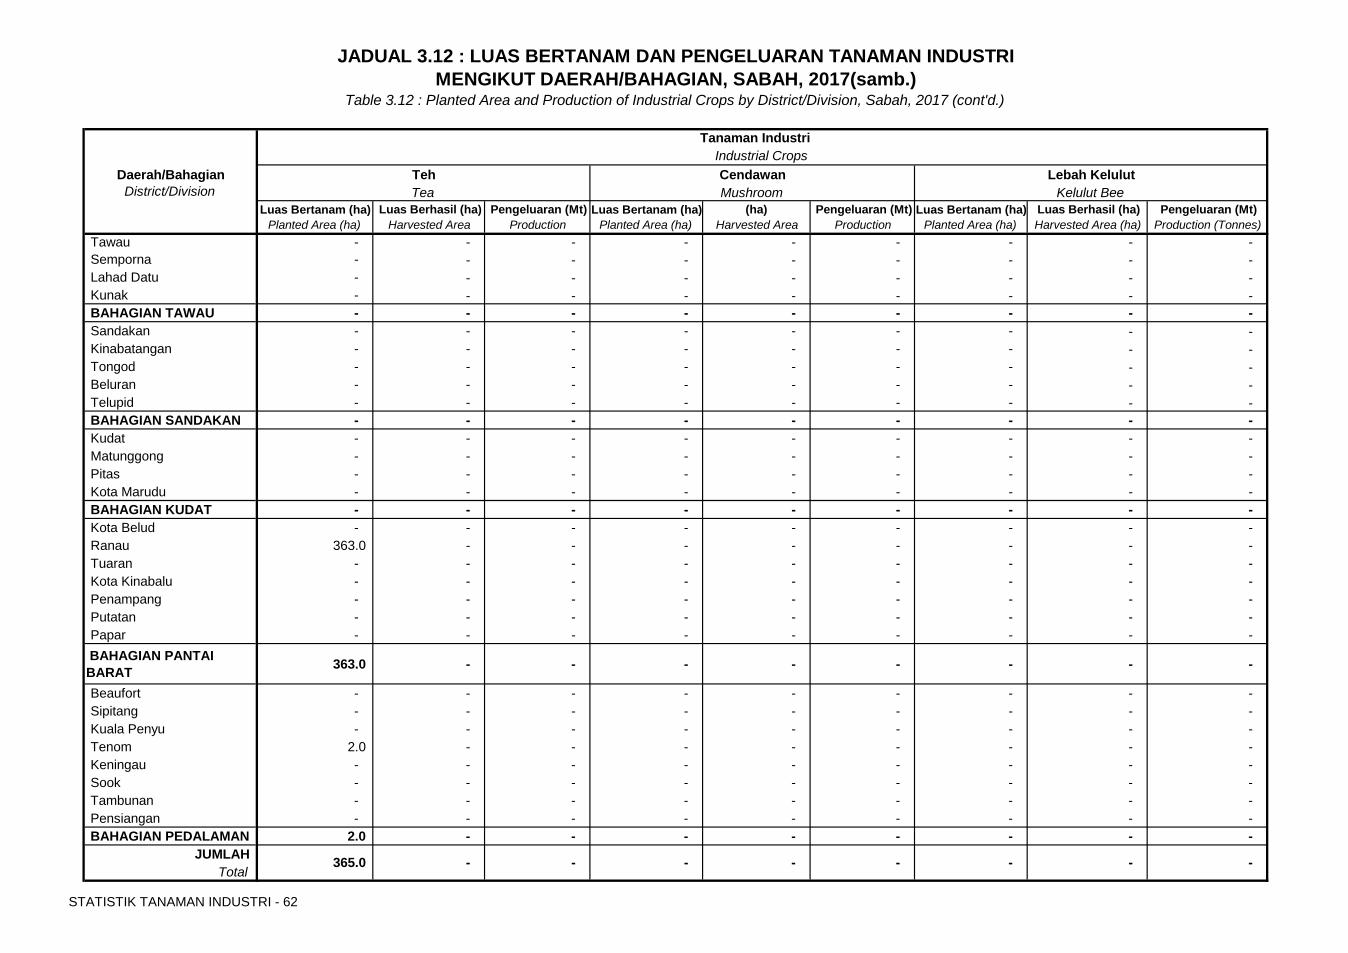
Tawau - - - - - - - - - Semporna - - - - - - - - - Lahad Datu - - - - - - - - - Kunak - - - - - - - - - BAHAGIAN TAWAU - - - - - - - - - Sandakan - - - - - - - - - Kinabatangan - - - - - - - - - Tongod - - - - - - - - - Beluran - - - - - - - - - Telupid - - - - - - - - - BAHAGIAN SANDAKAN - - - - - - - - - Kudat - - - - - - - - - Matunggong - - - - - - - - - Pitas - - - - - - - - - Kota Marudu - - - - - - - - - BAHAGIAN KUDAT - - - - - - - - - Kota Belud - - - - - - - - - Ranau 363.0 - - - - - - - - Tuaran - - - - - - - - - Kota Kinabalu - - - - - - - - - Penampang - - - - - - - - - Putatan - - - - - - - - - Papar - - - - - - - - -
BAHAGIAN PANTAI BARAT 363.0 - - - - - - - -
Beaufort - - - - - - - - - Sipitang - - - - - - - - - Kuala Penyu - - - - - - - - - Tenom 2.0 - - - - - - - - Keningau - - - - - - - - - Sook - - - - - - - - - Tambunan - - - - - - - - - Pensiangan - - - - - - - - - BAHAGIAN PEDALAMAN 2.0 - - - - - - - -
JUMLAHTotal
- - - -
Cendawan Lebah Kelulut
-
Mushroom
365.0 - - -
District/Division Tea
JADUAL 3.12 : LUAS BERTANAM DAN PENGELUARAN TANAMAN INDUSTRI
Kelulut BeeDaerah/Bahagian
Tanaman Industri Industrial Crops
Teh
MENGIKUT DAERAH/BAHAGIAN, SABAH, 2017(samb.)Table 3.12 : Planted Area and Production of Industrial Crops by District/Division, Sabah, 2017 (cont'd.)
STATISTIK TANAMAN INDUSTRI - 63
Luas Bertanam (ha) Luas Berhasil (ha) Pengeluaran (Mt) Luas Bertanam (ha)
(ha) Pengeluaran (Mt) Luas Bertanam (ha) Luas Berhasil (ha) Pengeluaran (Mt) Planted Area (ha) Harvested Area
Production
Planted Area (ha) Harvested Area
Production
Planted Area (ha) Harvested Area (ha) Production (Tonnes)
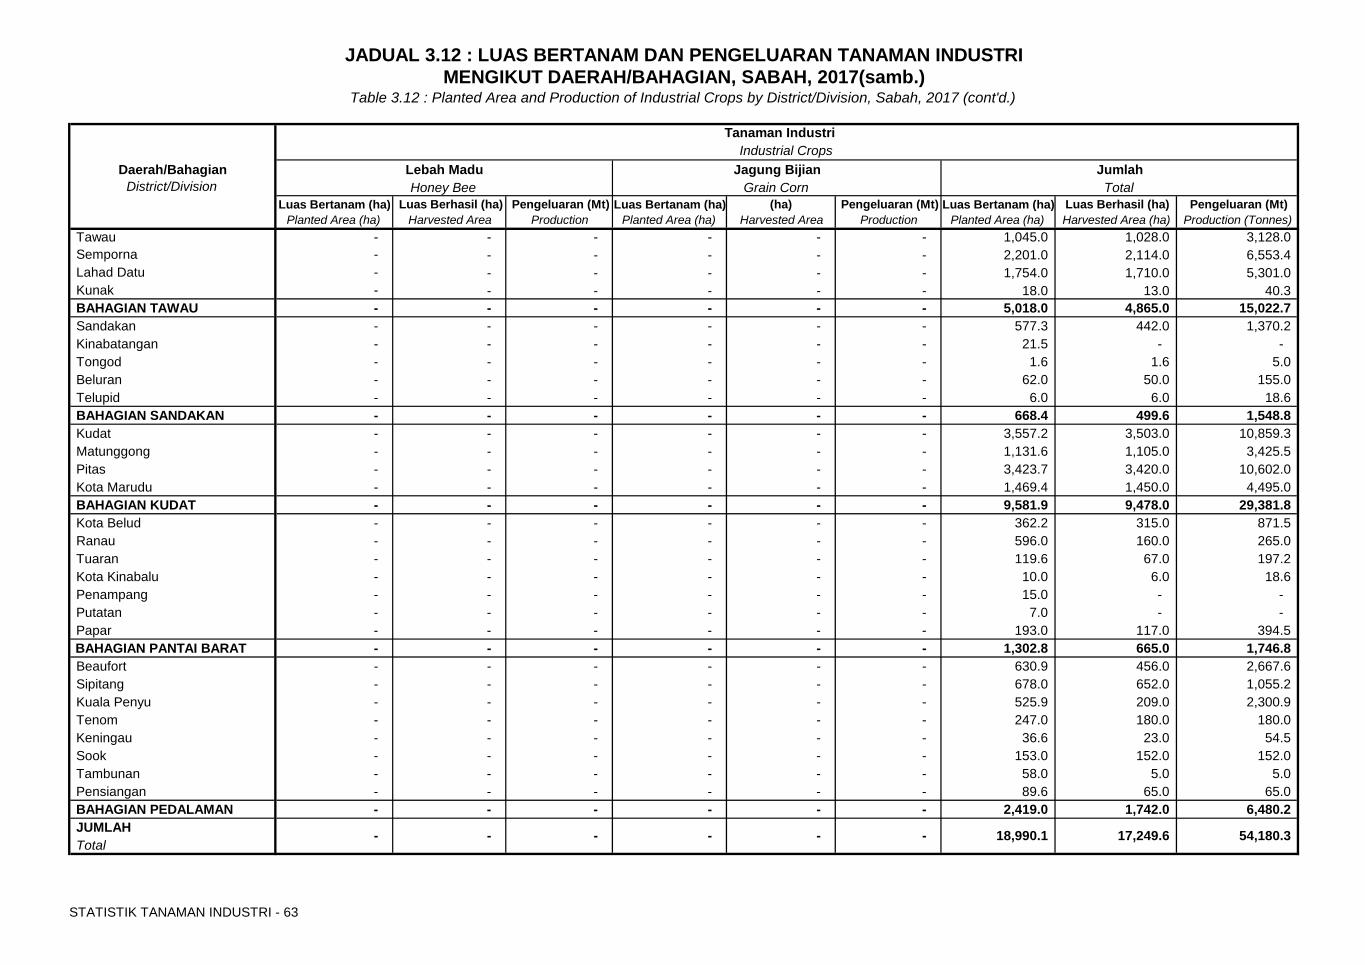
Tawau - - - - - - 1,045.0 1,028.0 3,128.0 Semporna - - - - - - 2,201.0 2,114.0 6,553.4 Lahad Datu - - - - - - 1,754.0 1,710.0 5,301.0 Kunak - - - - - - 18.0 13.0 40.3 BAHAGIAN TAWAU - - - - - - 5,018.0 4,865.0 15,022.7 Sandakan - - - - - - 577.3 442.0 1,370.2 Kinabatangan - - - - - - 21.5 - - Tongod - - - - - - 1.6 1.6 5.0 Beluran - - - - - - 62.0 50.0 155.0 Telupid - - - - - - 6.0 6.0 18.6 BAHAGIAN SANDAKAN - - - - - - 668.4 499.6 1,548.8 Kudat - - - - - - 3,557.2 3,503.0 10,859.3 Matunggong - - - - - - 1,131.6 1,105.0 3,425.5 Pitas - - - - - - 3,423.7 3,420.0 10,602.0 Kota Marudu - - - - - - 1,469.4 1,450.0 4,495.0 BAHAGIAN KUDAT - - - - - - 9,581.9 9,478.0 29,381.8 Kota Belud - - - - - - 362.2 315.0 871.5 Ranau - - - - - - 596.0 160.0 265.0 Tuaran - - - - - - 119.6 67.0 197.2 Kota Kinabalu - - - - - - 10.0 6.0 18.6 Penampang - - - - - - 15.0 - - Putatan - - - - - - 7.0 - - Papar - - - - - - 193.0 117.0 394.5
BAHAGIAN PANTAI BARAT - - - - - - 1,302.8 665.0 1,746.8 Beaufort - - - - - - 630.9 456.0 2,667.6 Sipitang - - - - - - 678.0 652.0 1,055.2 Kuala Penyu - - - - - - 525.9 209.0 2,300.9 Tenom - - - - - - 247.0 180.0 180.0 Keningau - - - - - - 36.6 23.0 54.5 Sook - - - - - - 153.0 152.0 152.0 Tambunan - - - - - - 58.0 5.0 5.0 Pensiangan - - - - - - 89.6 65.0 65.0 BAHAGIAN PEDALAMAN - - - - - - 2,419.0 1,742.0 6,480.2 JUMLAHTotal
Daerah/Bahagian Lebah Madu
Tanaman Industri Industrial Crops
JADUAL 3.12 : LUAS BERTANAM DAN PENGELUARAN TANAMAN INDUSTRI MENGIKUT DAERAH/BAHAGIAN, SABAH, 2017(samb.)
Table 3.12 : Planted Area and Production of Industrial Crops by District/Division, Sabah, 2017 (cont'd.)
- - - -
District/Division Honey Bee
- 18,990.1 54,180.3 -
Jagung Bijian Jumlah
17,249.6
Grain Corn Total

Muka surat ini sengaja dibiarkan kosong
SARAWAK
SARAWAK
STATISTIK TANAMAN INDUSTRI - 66
Luas Bertanam (ha) Luas Berhasil (ha) Pengeluaran (Mt) Luas Bertanam (ha) Luas Berhasil (ha) Pengeluaran (Mt) Luas Bertanam (ha) Luas Berhasil (ha) Pengeluaran (Mt)Planted Area (ha) Harvested Area (ha) Production (Tonnes) Planted Area (ha) Harvested Area (ha) Production (Tonnes) Planted Area (ha) Harvested Area (ha) Production (Tonnes)
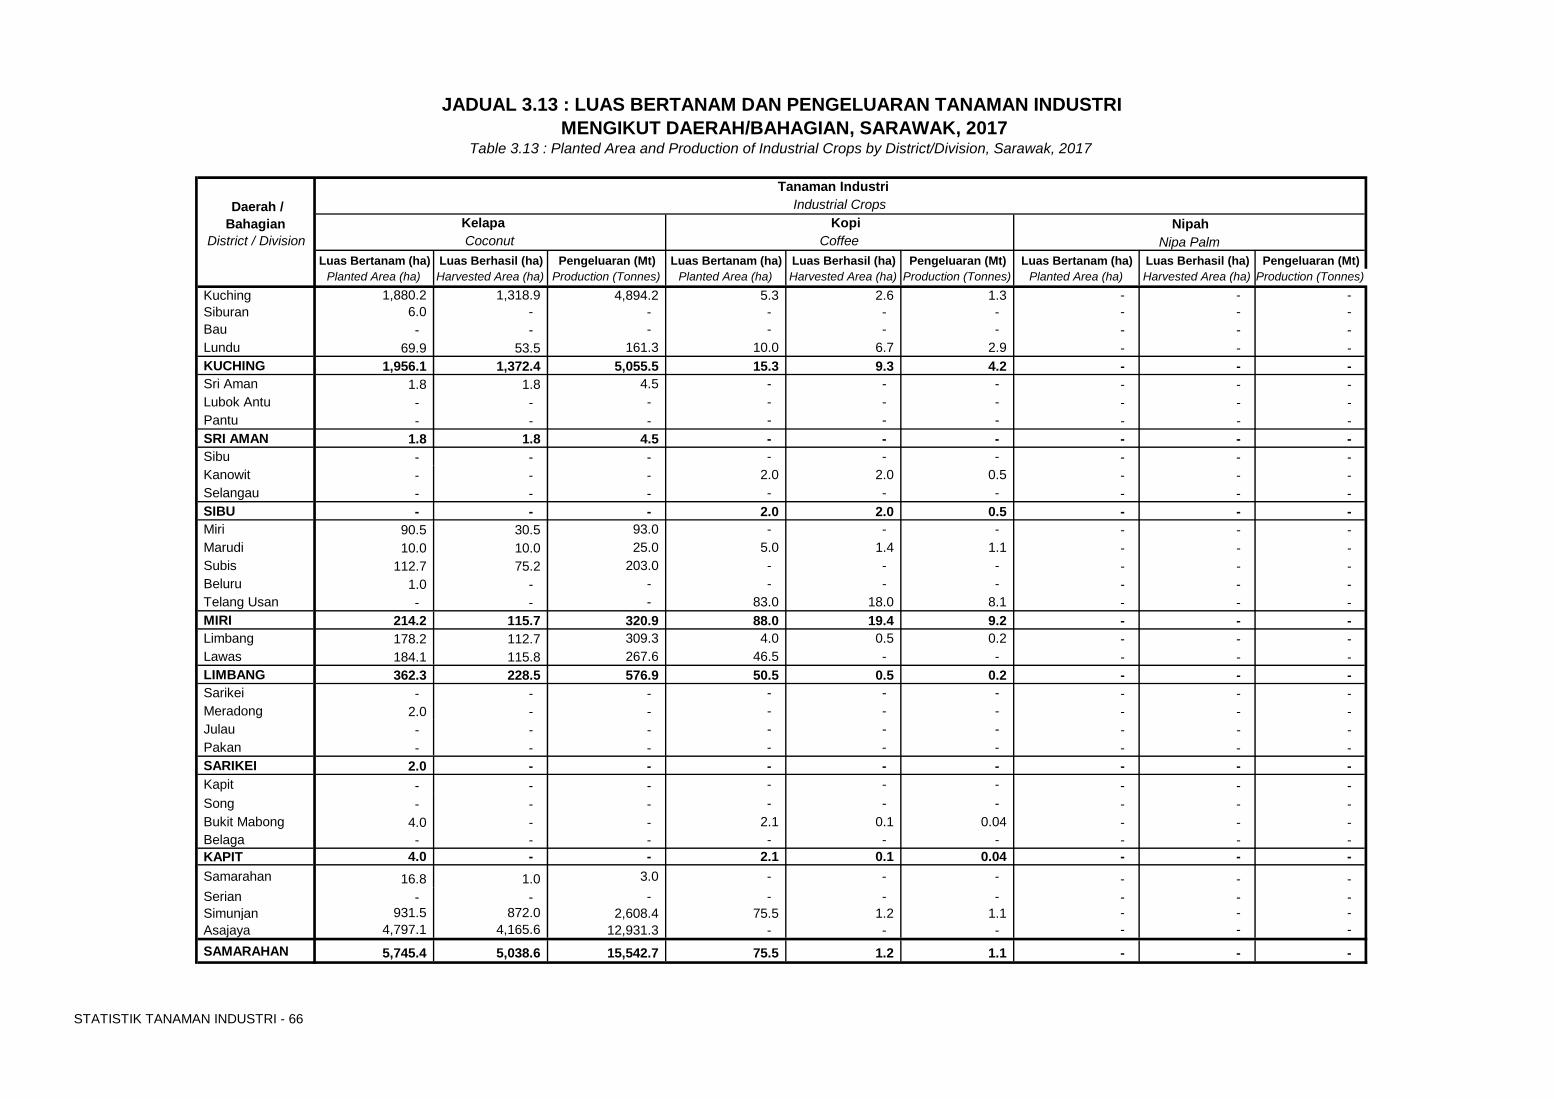
Kuching 1,880.2 1,318.9 4,894.2 5.3 2.6 1.3 - - - Siburan 6.0 - - - - - - - - Bau - - - - - - - - - Lundu 69.9 53.5 161.3 10.0 6.7 2.9 - - - KUCHING 1,956.1 1,372.4 5,055.5 15.3 9.3 4.2 - - - Sri Aman 1.8 1.8 4.5 - - - - - - Lubok Antu - - - - - - - - - Pantu - - - - - - - - - SRI AMAN 1.8 1.8 4.5 - - - - - - Sibu - - - - - - - - - Kanowit - - - 2.0 2.0 0.5 - - - Selangau - - - - - - - - - SIBU - - - 2.0 2.0 0.5 - - - Miri 90.5 30.5 93.0 - - - - - - Marudi 10.0 10.0 25.0 5.0 1.4 1.1 - - - Subis 112.7 75.2 203.0 - - - - - - Beluru 1.0 - - - - - - - - Telang Usan - - - 83.0 18.0 8.1 - - - MIRI 214.2 115.7 320.9 88.0 19.4 9.2 - - - Limbang 178.2 112.7 309.3 4.0 0.5 0.2 - - - Lawas 184.1 115.8 267.6 46.5 - - - - - LIMBANG 362.3 228.5 576.9 50.5 0.5 0.2 - - - Sarikei - - - - - - - - - Meradong 2.0 - - - - - - - - Julau - - - - - - - - - Pakan - - - - - - - - - SARIKEI 2.0 - - - - - - - - Kapit - - - - - - - - - Song - - - - - - - - - Bukit Mabong 4.0 - - 2.1 0.1 0.04 - - - Belaga - - - - - - - - - KAPIT 4.0 - - 2.1 0.1 0.04 - - - Samarahan 16.8 1.0 3.0 - - - - - - Serian - - - - - - - - - Simunjan 931.5 872.0 2,608.4 75.5 1.2 1.1 - - - Asajaya 4,797.1 4,165.6 12,931.3 - - - - - - SAMARAHAN 5,745.4 5,038.6 15,542.7 75.5 1.2 1.1 - - -
JADUAL 3.13 : LUAS BERTANAM DAN PENGELUARAN TANAMAN INDUSTRI MENGIKUT DAERAH/BAHAGIAN, SARAWAK, 2017
Table 3.13 : Planted Area and Production of Industrial Crops by District/Division, Sarawak, 2017
Coconut Coffee
Tanaman Industri
District / Division Nipah
Nipa Palm
Daerah / Bahagian
Industrial CropsKelapa Kopi
STATISTIK TANAMAN INDUSTRI - 67
Luas Bertanam (ha) Luas Berhasil (ha) Pengeluaran (Mt) Luas Bertanam (ha) Luas Berhasil (ha) Pengeluaran (Mt) Luas Bertanam (ha) Luas Berhasil (ha) Pengeluaran (Mt)Planted Area (ha) Harvested Area (ha) Production (Tonnes) Planted Area (ha) Harvested Area (ha) Production (Tonnes) Planted Area (ha) Harvested Area (ha) Production (Tonnes)
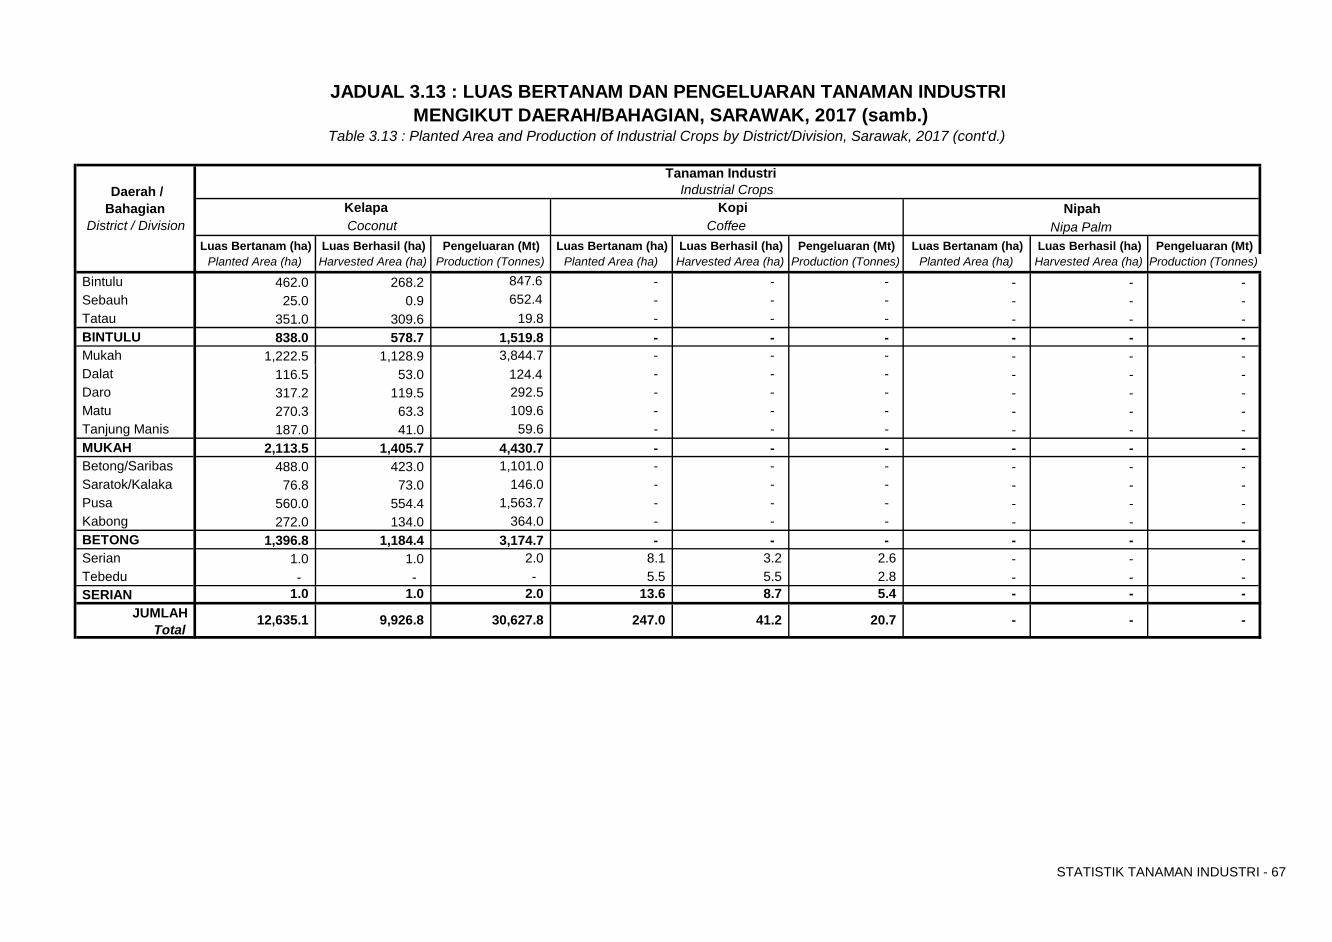
Bintulu 462.0 268.2 847.6 - - - - - - Sebauh 25.0 0.9 652.4 - - - - - - Tatau 351.0 309.6 19.8 - - - - - - BINTULU 838.0 578.7 1,519.8 - - - - - - Mukah 1,222.5 1,128.9 3,844.7 - - - - - - Dalat 116.5 53.0 124.4 - - - - - - Daro 317.2 119.5 292.5 - - - - - - Matu 270.3 63.3 109.6 - - - - - - Tanjung Manis 187.0 41.0 59.6 - - - - - - MUKAH 2,113.5 1,405.7 4,430.7 - - - - - - Betong/Saribas 488.0 423.0 1,101.0 - - - - - - Saratok/Kalaka 76.8 73.0 146.0 - - - - - - Pusa 560.0 554.4 1,563.7 - - - - - - Kabong 272.0 134.0 364.0 - - - - - - BETONG 1,396.8 1,184.4 3,174.7 - - - - - - Serian 1.0 1.0 2.0 8.1 3.2 2.6 - - - Tebedu - - - 5.5 5.5 2.8 - - - SERIAN 1.0 1.0 2.0 13.6 8.7 5.4 - - -
JUMLAHTotal
MENGIKUT DAERAH/BAHAGIAN, SARAWAK, 2017 (samb.)
12,635.1 247.0
JADUAL 3.13 : LUAS BERTANAM DAN PENGELUARAN TANAMAN INDUSTRI
District / Division Nipah
Nipa PalmCoconut Kopi
Table 3.13 : Planted Area and Production of Industrial Crops by District/Division, Sarawak, 2017 (cont'd.)
Daerah / Bahagian
9,926.8 30,627.8 - -
Industrial CropsKelapa
20.7
Tanaman Industri
- 41.2
Coffee
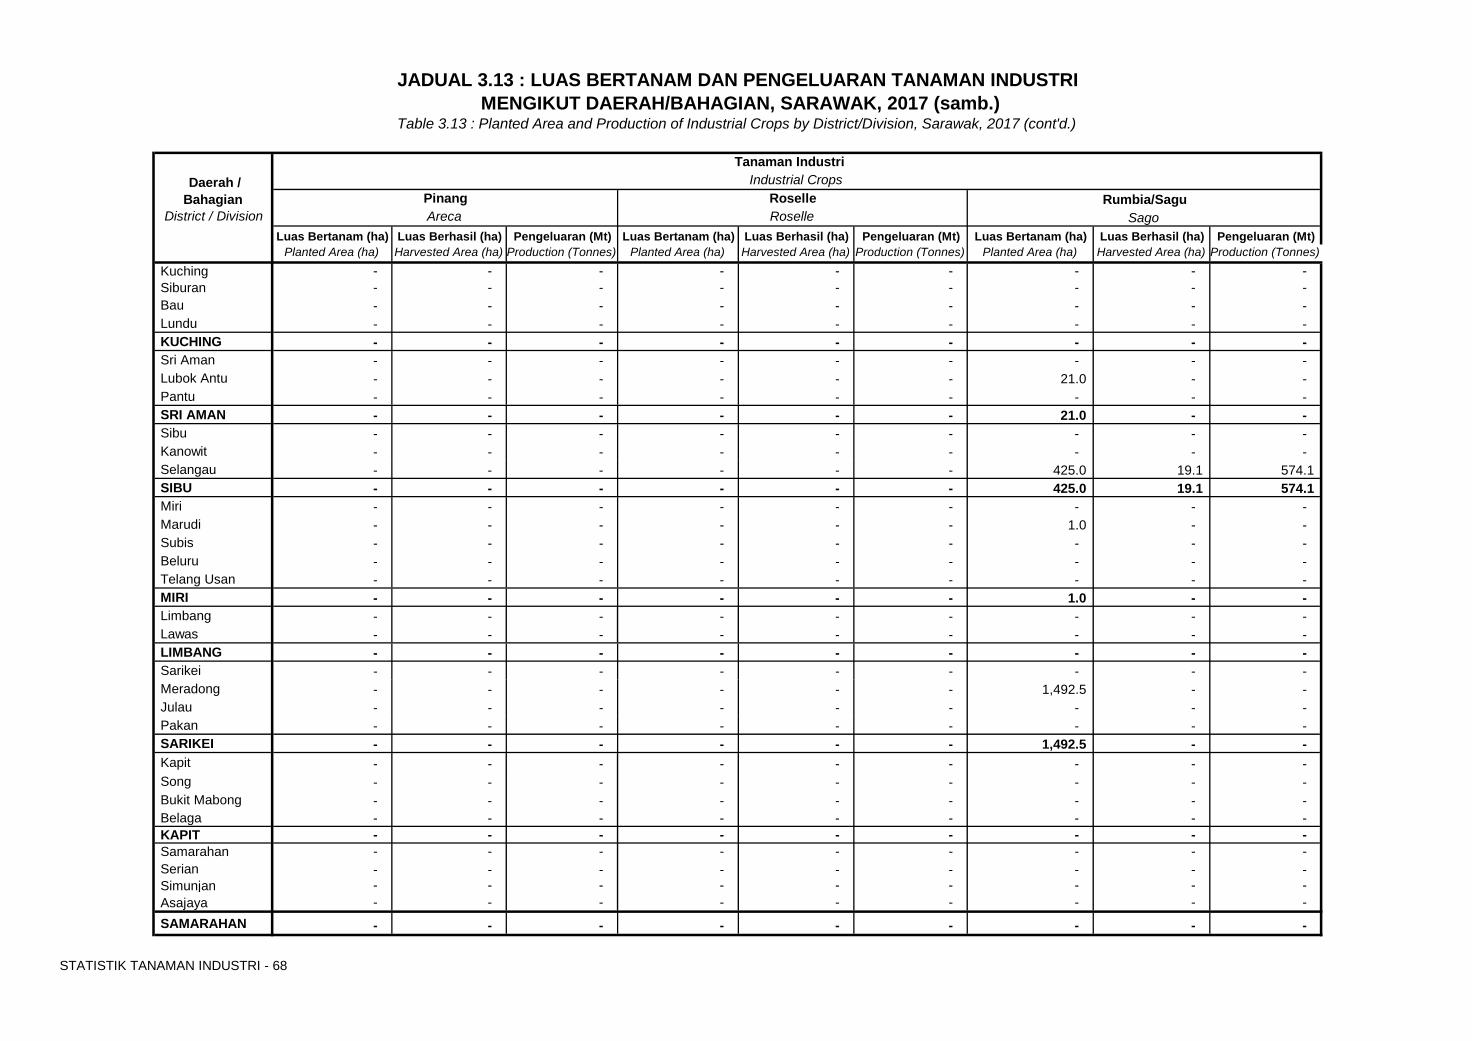
STATISTIK TANAMAN INDUSTRI - 68
Luas Bertanam (ha) Luas Berhasil (ha) Pengeluaran (Mt) Luas Bertanam (ha) Luas Berhasil (ha) Pengeluaran (Mt) Luas Bertanam (ha) Luas Berhasil (ha) Pengeluaran (Mt)Planted Area (ha) Harvested Area (ha) Production (Tonnes) Planted Area (ha) Harvested Area (ha) Production (Tonnes) Planted Area (ha) Harvested Area (ha) Production (Tonnes)
Kuching - - - - - - - - - Siburan - - - - - - - - - Bau - - - - - - - - - Lundu - - - - - - - - - KUCHING - - - - - - - - - Sri Aman - - - - - - - - - Lubok Antu - - - - - - 21.0 - - Pantu - - - - - - - - - SRI AMAN - - - - - - 21.0 - - Sibu - - - - - - - - - Kanowit - - - - - - - - - Selangau - - - - - - 425.0 19.1 574.1 SIBU - - - - - - 425.0 19.1 574.1 Miri - - - - - - - - - Marudi - - - - - - 1.0 - - Subis - - - - - - - - - Beluru - - - - - - - - - Telang Usan - - - - - - - - - MIRI - - - - - - 1.0 - - Limbang - - - - - - - - - Lawas - - - - - - - - - LIMBANG - - - - - - - - - Sarikei - - - - - - - - - Meradong - - - - - - 1,492.5 - - Julau - - - - - - - - - Pakan - - - - - - - - - SARIKEI - - - - - - 1,492.5 - - Kapit - - - - - - - - - Song - - - - - - - - - Bukit Mabong - - - - - - - - - Belaga - - - - - - - - - KAPIT - - - - - - - - - Samarahan - - - - - - - - - Serian - - - - - - - - - Simunjan - - - - - - - - - Asajaya - - - - - - - - - SAMARAHAN - - - - - - - - -
Table 3.13 : Planted Area and Production of Industrial Crops by District/Division, Sarawak, 2017 (cont'd.)
JADUAL 3.13 : LUAS BERTANAM DAN PENGELUARAN TANAMAN INDUSTRI MENGIKUT DAERAH/BAHAGIAN, SARAWAK, 2017 (samb.)
Daerah / Bahagian
Tanaman Industri
District / Division Areca Roselle Sago
Industrial CropsPinang Roselle Rumbia/Sagu
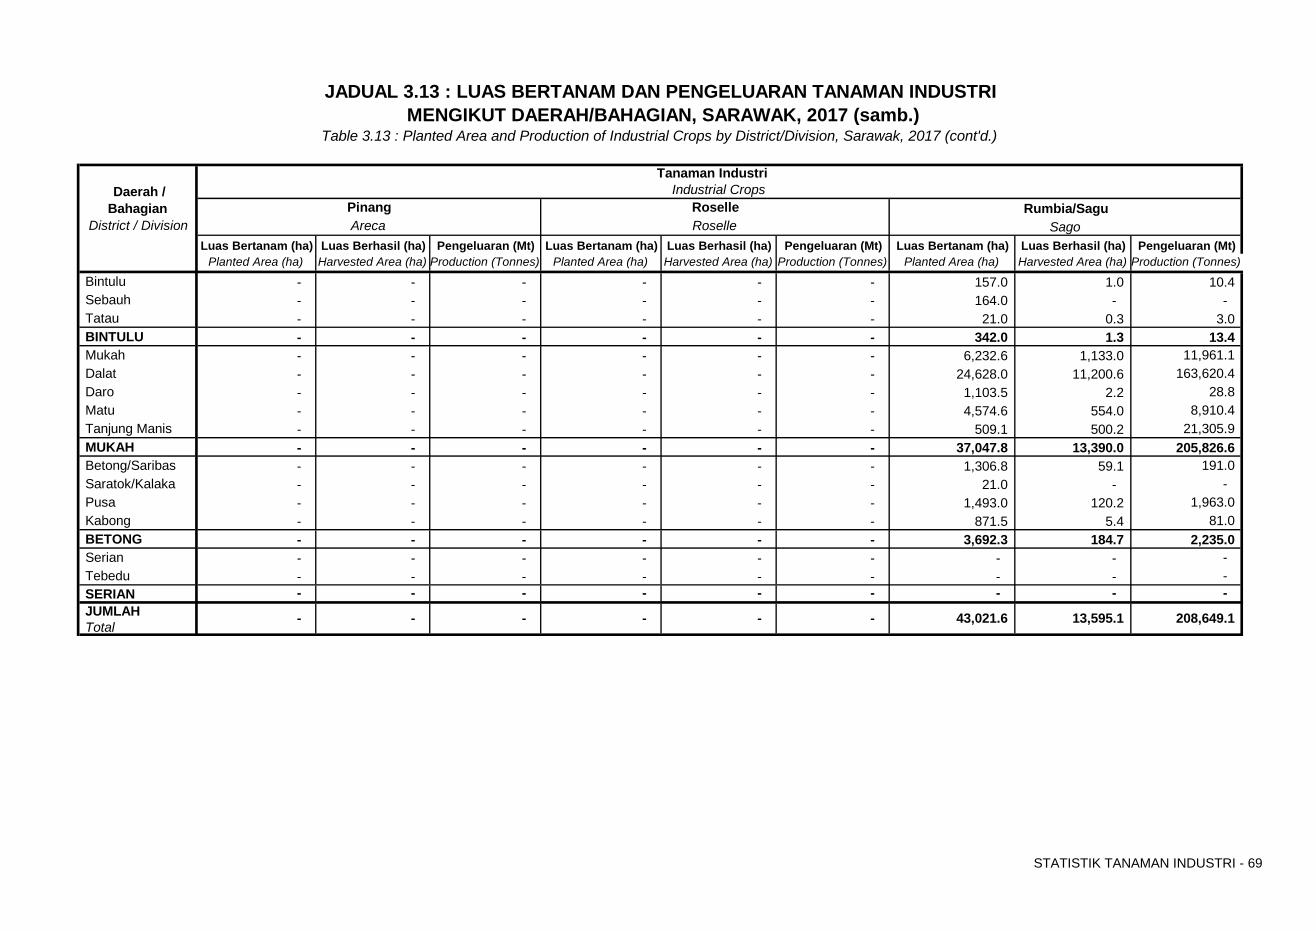
STATISTIK TANAMAN INDUSTRI - 69
Luas Bertanam (ha) Luas Berhasil (ha) Pengeluaran (Mt) Luas Bertanam (ha) Luas Berhasil (ha) Pengeluaran (Mt) Luas Bertanam (ha) Luas Berhasil (ha) Pengeluaran (Mt)Planted Area (ha) Harvested Area (ha) Production (Tonnes) Planted Area (ha) Harvested Area (ha) Production (Tonnes) Planted Area (ha) Harvested Area (ha) Production (Tonnes)
Bintulu - - - - - - 157.0 1.0 10.4 Sebauh - - - - - - 164.0 - - Tatau - - - - - - 21.0 0.3 3.0 BINTULU - - - - - - 342.0 1.3 13.4 Mukah - - - - - - 6,232.6 1,133.0 11,961.1 Dalat - - - - - - 24,628.0 11,200.6 163,620.4 Daro - - - - - - 1,103.5 2.2 28.8 Matu - - - - - - 4,574.6 554.0 8,910.4 Tanjung Manis - - - - - - 509.1 500.2 21,305.9 MUKAH - - - - - - 37,047.8 13,390.0 205,826.6 Betong/Saribas - - - - - - 1,306.8 59.1 191.0 Saratok/Kalaka - - - - - - 21.0 - - Pusa - - - - - - 1,493.0 120.2 1,963.0 Kabong - - - - - - 871.5 5.4 81.0 BETONG - - - - - - 3,692.3 184.7 2,235.0 Serian - - - - - - - - - Tebedu - - - - - - - - - SERIAN - - - - - - - - - JUMLAHTotal
43,021.6 -
Areca Roselle
- -
Rumbia/Sagu District / Division Sago
13,595.1
JADUAL 3.13 : LUAS BERTANAM DAN PENGELUARAN TANAMAN INDUSTRI MENGIKUT DAERAH/BAHAGIAN, SARAWAK, 2017 (samb.)
Table 3.13 : Planted Area and Production of Industrial Crops by District/Division, Sarawak, 2017 (cont'd.)
Daerah / Bahagian
Tanaman Industri
- -
RoselleIndustrial Crops
Pinang
208,649.1 -
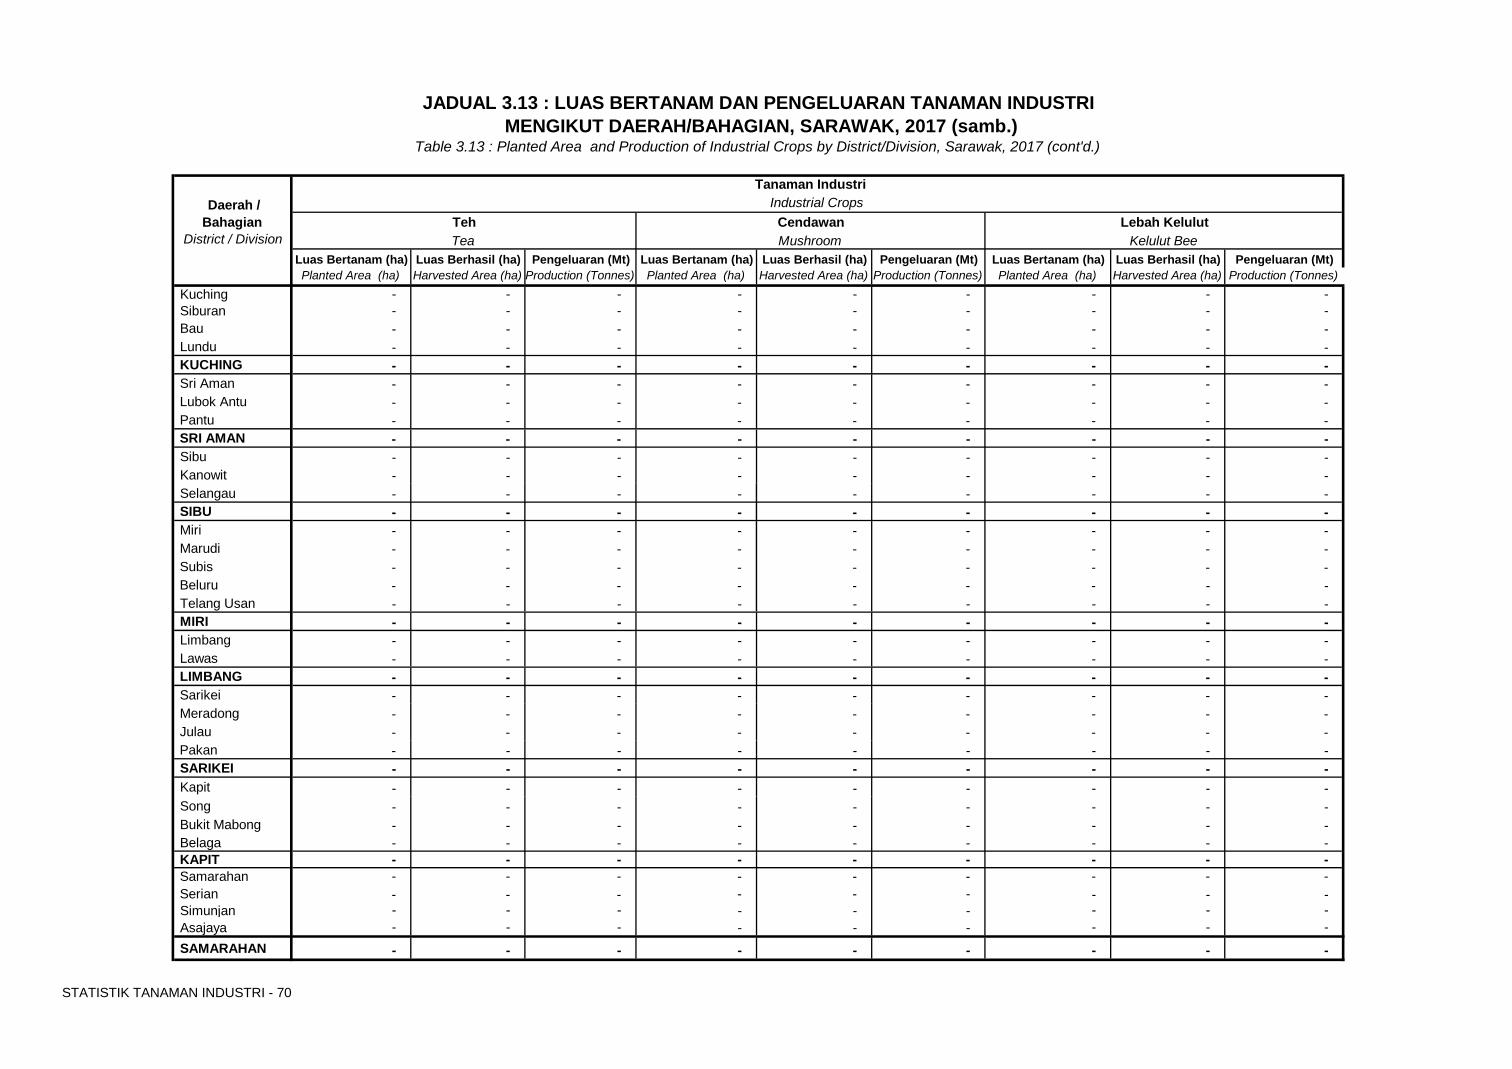
STATISTIK TANAMAN INDUSTRI - 70
Luas Bertanam (ha) Luas Berhasil (ha) Pengeluaran (Mt) Luas Bertanam (ha) Luas Berhasil (ha) Pengeluaran (Mt) Luas Bertanam (ha) Luas Berhasil (ha) Pengeluaran (Mt)Planted Area (ha) Harvested Area (ha) Production (Tonnes) Planted Area (ha) Harvested Area (ha) Production (Tonnes) Planted Area (ha) Harvested Area (ha) Production (Tonnes)
Kuching - - - - - - - - - Siburan - - - - - - - - - Bau - - - - - - - - - Lundu - - - - - - - - - KUCHING - - - - - - - - - Sri Aman - - - - - - - - - Lubok Antu - - - - - - - - - Pantu - - - - - - - - - SRI AMAN - - - - - - - - - Sibu - - - - - - - - - Kanowit - - - - - - - - - Selangau - - - - - - - - - SIBU - - - - - - - - - Miri - - - - - - - - - Marudi - - - - - - - - - Subis - - - - - - - - - Beluru - - - - - - - - - Telang Usan - - - - - - - - - MIRI - - - - - - - - - Limbang - - - - - - - - - Lawas - - - - - - - - - LIMBANG - - - - - - - - - Sarikei - - - - - - - - - Meradong - - - - - - - - - Julau - - - - - - - - - Pakan - - - - - - - - - SARIKEI - - - - - - - - - Kapit - - - - - - - - - Song - - - - - - - - - Bukit Mabong - - - - - - - - - Belaga - - - - - - - - - KAPIT - - - - - - - - - Samarahan - - - - - - - - - Serian - - - - - - - - - Simunjan - - - - - - - - - Asajaya - - - - - - - - - SAMARAHAN - - - - - - - - -
District / Division Tea Mushroom Kelulut Bee
Table 3.13 : Planted Area and Production of Industrial Crops by District/Division, Sarawak, 2017 (cont'd.)
JADUAL 3.13 : LUAS BERTANAM DAN PENGELUARAN TANAMAN INDUSTRI MENGIKUT DAERAH/BAHAGIAN, SARAWAK, 2017 (samb.)
Industrial CropsTeh Cendawan Lebah Kelulut
Daerah / Bahagian
Tanaman Industri
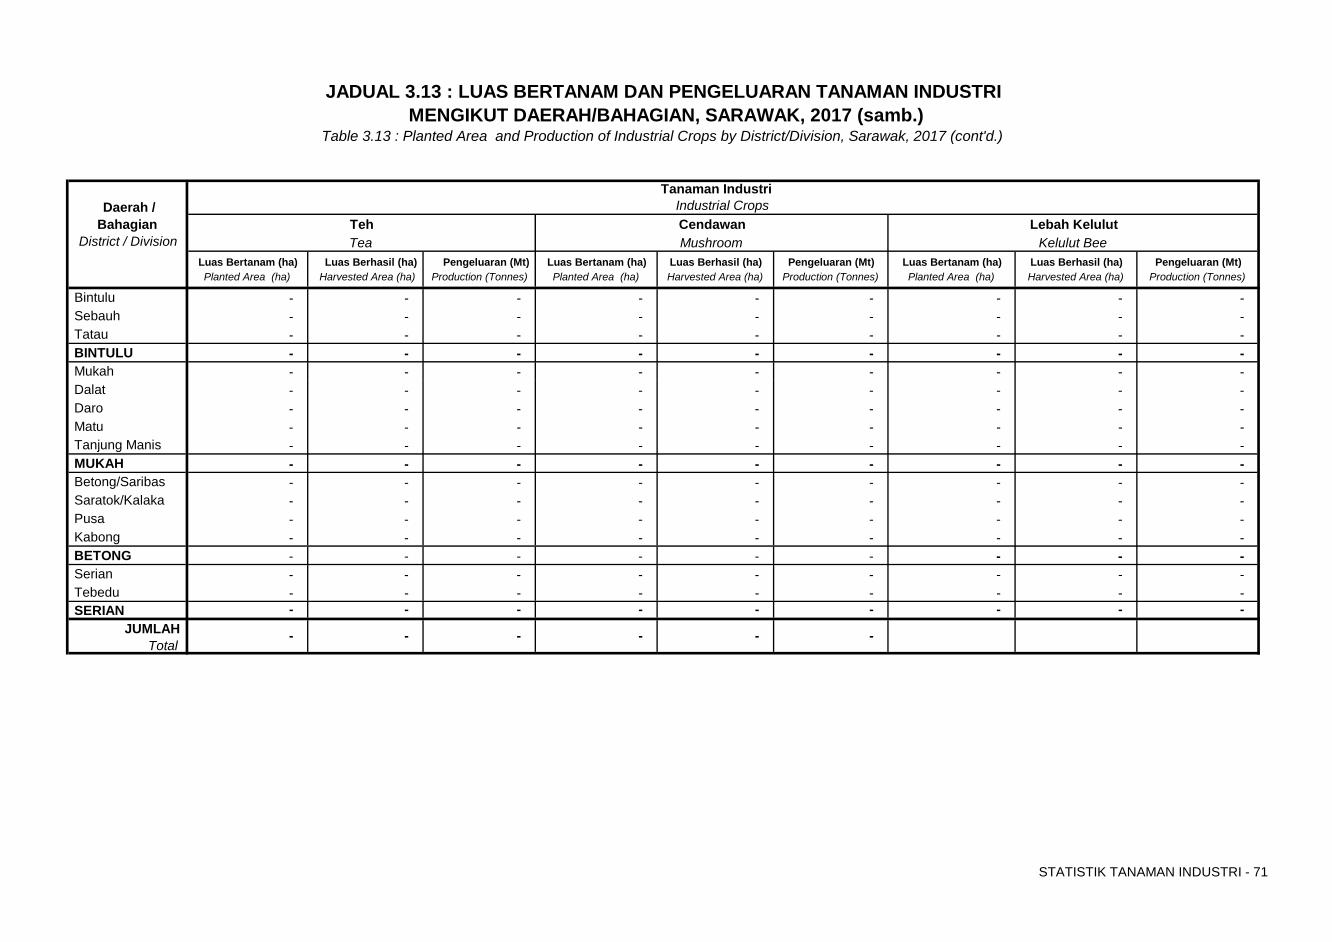
STATISTIK TANAMAN INDUSTRI - 71
Luas Bertanam (ha) Luas Berhasil (ha) Pengeluaran (Mt) Luas Bertanam (ha) Luas Berhasil (ha) Pengeluaran (Mt) Luas Bertanam (ha) Luas Berhasil (ha) Pengeluaran (Mt)Planted Area (ha) Harvested Area (ha) Production (Tonnes) Planted Area (ha) Harvested Area (ha) Production (Tonnes) Planted Area (ha) Harvested Area (ha) Production (Tonnes)
Bintulu - - - - - - - - - Sebauh - - - - - - - - - Tatau - - - - - - - - - BINTULU - - - - - - - - - Mukah - - - - - - - - - Dalat - - - - - - - - - Daro - - - - - - - - - Matu - - - - - - - - - Tanjung Manis - - - - - - - - - MUKAH - - - - - - - - - Betong/Saribas - - - - - - - - - Saratok/Kalaka - - - - - - - - - Pusa - - - - - - - - - Kabong - - - - - - - - - BETONG - - - - - - - - - Serian - - - - - - - - - Tebedu - - - - - - - - - SERIAN - - - - - - - - -
JUMLAHTotal
Kelulut Bee
Table 3.13 : Planted Area and Production of Industrial Crops by District/Division, Sarawak, 2017 (cont'd.)
- - - -
District / Division Tea Mushroom
- -
JADUAL 3.13 : LUAS BERTANAM DAN PENGELUARAN TANAMAN INDUSTRI MENGIKUT DAERAH/BAHAGIAN, SARAWAK, 2017 (samb.)
Industrial CropsTeh Cendawan Lebah Kelulut
Daerah / Bahagian
Tanaman Industri
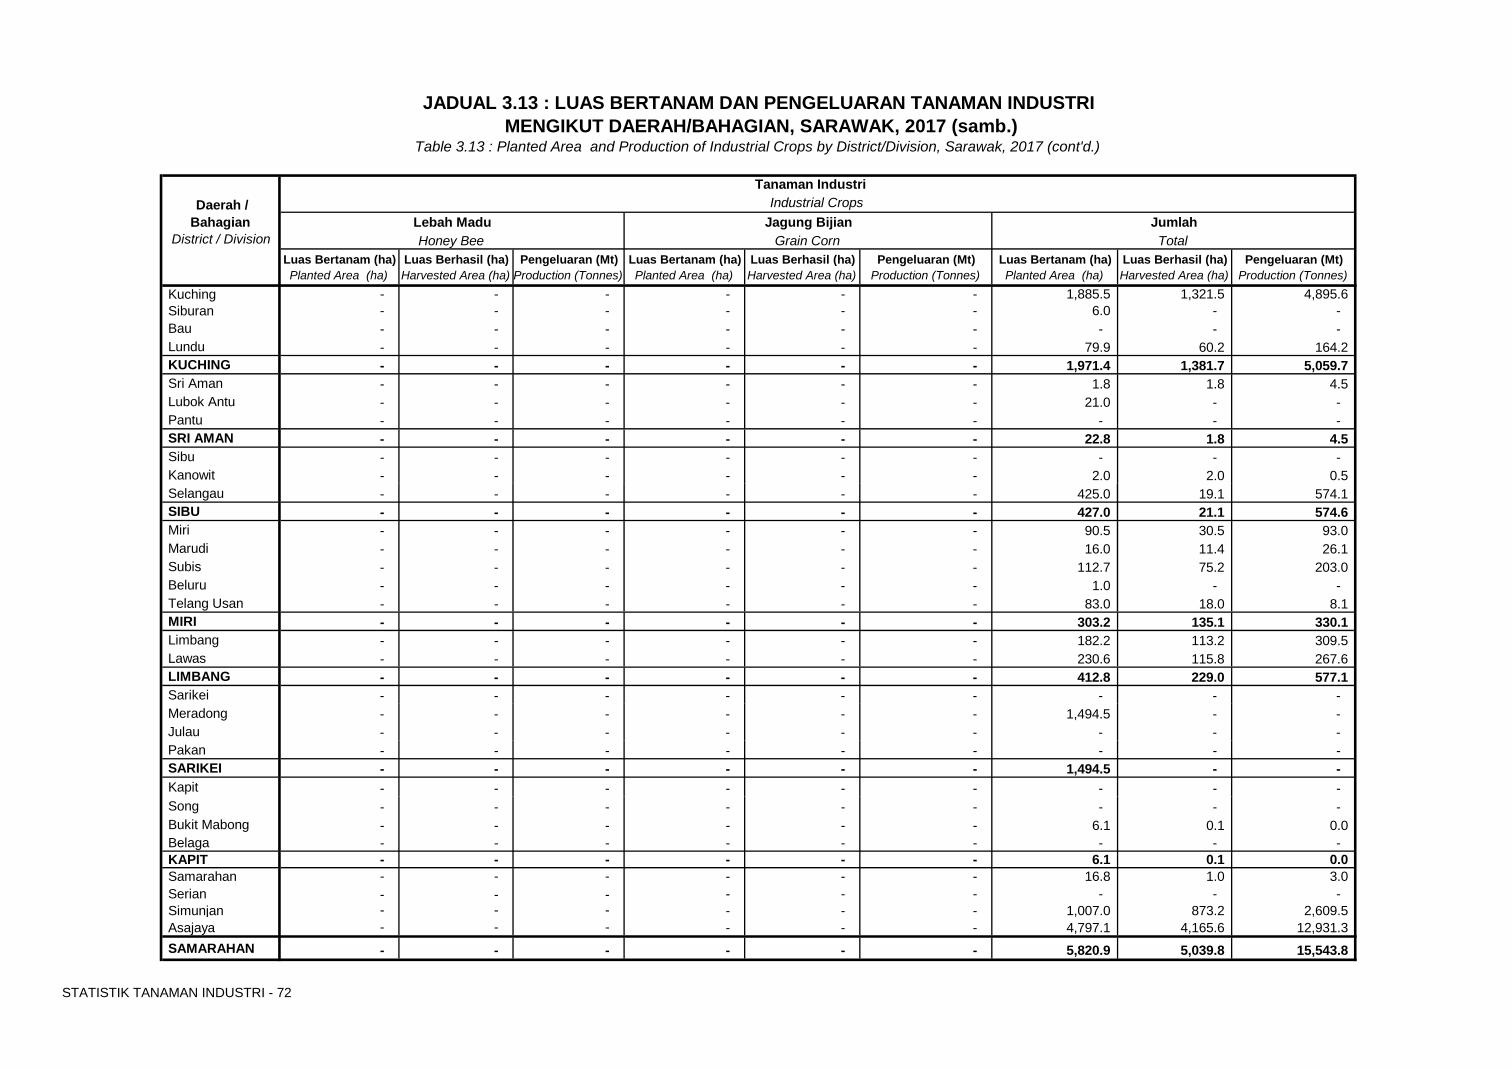
STATISTIK TANAMAN INDUSTRI - 72
Luas Bertanam (ha) Luas Berhasil (ha) Pengeluaran (Mt) Luas Bertanam (ha) Luas Berhasil (ha) Pengeluaran (Mt) Luas Bertanam (ha) Luas Berhasil (ha) Pengeluaran (Mt)Planted Area (ha) Harvested Area (ha) Production (Tonnes) Planted Area (ha) Harvested Area (ha) Production (Tonnes) Planted Area (ha) Harvested Area (ha) Production (Tonnes)
Kuching - - - - - - 1,885.5 1,321.5 4,895.6 Siburan - - - - - - 6.0 - - Bau - - - - - - - - - Lundu - - - - - - 79.9 60.2 164.2 KUCHING - - - - - - 1,971.4 1,381.7 5,059.7 Sri Aman - - - - - - 1.8 1.8 4.5 Lubok Antu - - - - - - 21.0 - - Pantu - - - - - - - - - SRI AMAN - - - - - - 22.8 1.8 4.5 Sibu - - - - - - - - - Kanowit - - - - - - 2.0 2.0 0.5 Selangau - - - - - - 425.0 19.1 574.1 SIBU - - - - - - 427.0 21.1 574.6 Miri - - - - - - 90.5 30.5 93.0 Marudi - - - - - - 16.0 11.4 26.1 Subis - - - - - - 112.7 75.2 203.0 Beluru - - - - - - 1.0 - - Telang Usan - - - - - - 83.0 18.0 8.1 MIRI - - - - - - 303.2 135.1 330.1 Limbang - - - - - - 182.2 113.2 309.5 Lawas - - - - - - 230.6 115.8 267.6 LIMBANG - - - - - - 412.8 229.0 577.1 Sarikei - - - - - - - - - Meradong - - - - - - 1,494.5 - - Julau - - - - - - - - - Pakan - - - - - - - - - SARIKEI - - - - - - 1,494.5 - - Kapit - - - - - - - - - Song - - - - - - - - - Bukit Mabong - - - - - - 6.1 0.1 0.0 Belaga - - - - - - - - - KAPIT - - - - - - 6.1 0.1 0.0 Samarahan - - - - - - 16.8 1.0 3.0 Serian - - - - - - - - - Simunjan - - - - - - 1,007.0 873.2 2,609.5 Asajaya - - - - - - 4,797.1 4,165.6 12,931.3 SAMARAHAN - - - - - - 5,820.9 5,039.8 15,543.8
Table 3.13 : Planted Area and Production of Industrial Crops by District/Division, Sarawak, 2017 (cont'd.)
District / Division Honey Bee Grain Corn
JADUAL 3.13 : LUAS BERTANAM DAN PENGELUARAN TANAMAN INDUSTRI MENGIKUT DAERAH/BAHAGIAN, SARAWAK, 2017 (samb.)
TotalLebah Madu Jagung Bijian Jumlah
Daerah / Bahagian
Tanaman Industri Industrial Crops
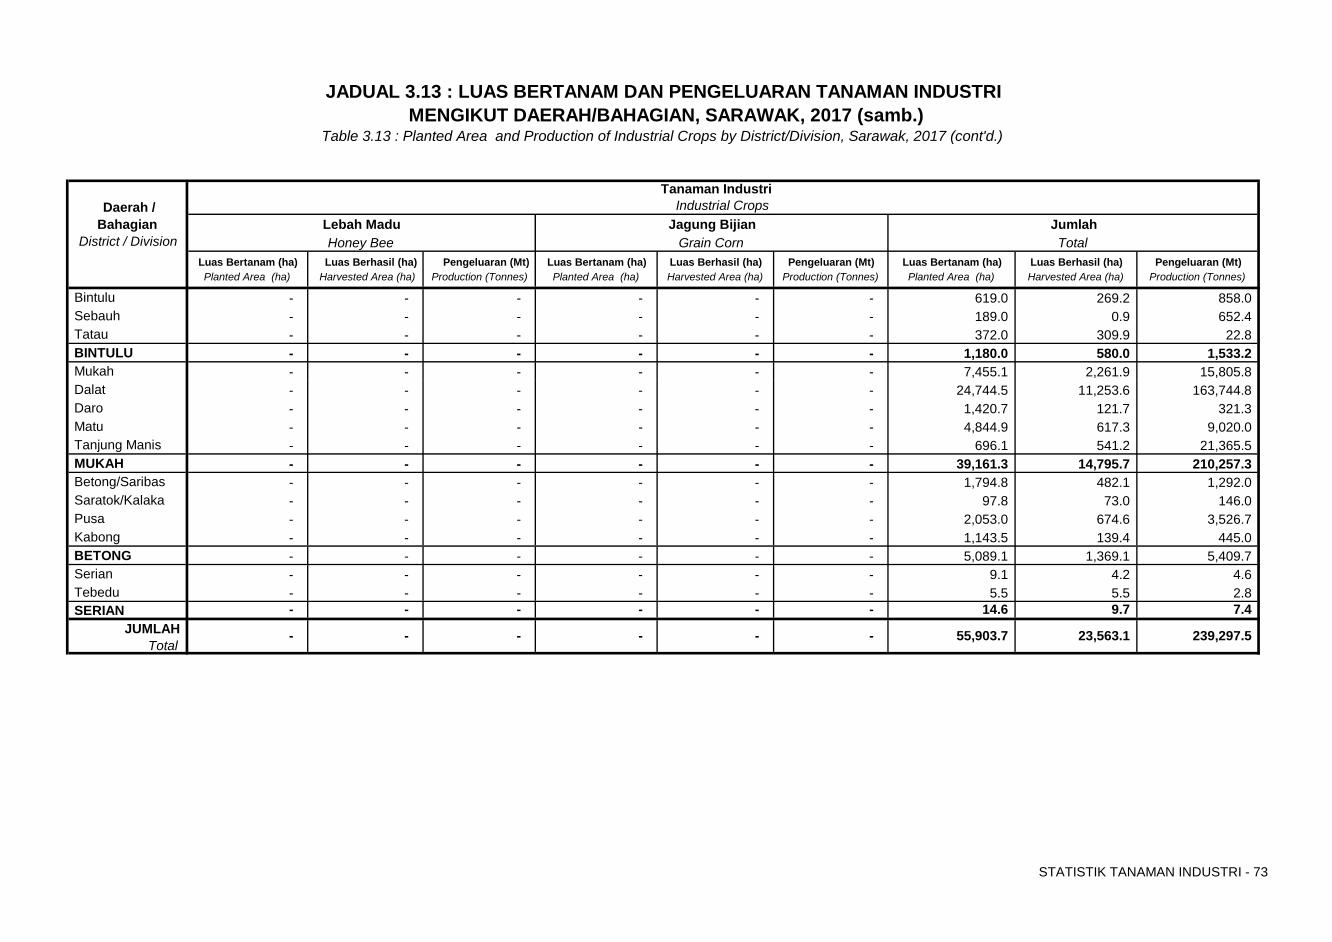
STATISTIK TANAMAN INDUSTRI - 73
Luas Bertanam (ha) Luas Berhasil (ha) Pengeluaran (Mt) Luas Bertanam (ha) Luas Berhasil (ha) Pengeluaran (Mt) Luas Bertanam (ha) Luas Berhasil (ha) Pengeluaran (Mt)Planted Area (ha) Harvested Area (ha) Production (Tonnes) Planted Area (ha) Harvested Area (ha) Production (Tonnes) Planted Area (ha) Harvested Area (ha) Production (Tonnes)
Bintulu - - - - - - 619.0 269.2 858.0 Sebauh - - - - - - 189.0 0.9 652.4 Tatau - - - - - - 372.0 309.9 22.8 BINTULU - - - - - - 1,180.0 580.0 1,533.2 Mukah - - - - - - 7,455.1 2,261.9 15,805.8 Dalat - - - - - - 24,744.5 11,253.6 163,744.8 Daro - - - - - - 1,420.7 121.7 321.3 Matu - - - - - - 4,844.9 617.3 9,020.0 Tanjung Manis - - - - - - 696.1 541.2 21,365.5 MUKAH - - - - - - 39,161.3 14,795.7 210,257.3 Betong/Saribas - - - - - - 1,794.8 482.1 1,292.0 Saratok/Kalaka - - - - - - 97.8 73.0 146.0 Pusa - - - - - - 2,053.0 674.6 3,526.7 Kabong - - - - - - 1,143.5 139.4 445.0 BETONG - - - - - - 5,089.1 1,369.1 5,409.7 Serian - - - - - - 9.1 4.2 4.6 Tebedu - - - - - - 5.5 5.5 2.8 SERIAN - - - - - - 14.6 9.7 7.4
JUMLAHTotal
- - - -
Tanaman Industri Industrial Crops
239,297.5 - 55,903.7 - 23,563.1
Lebah Madu Jagung Bijian Jumlah
JADUAL 3.13 : LUAS BERTANAM DAN PENGELUARAN TANAMAN INDUSTRI MENGIKUT DAERAH/BAHAGIAN, SARAWAK, 2017 (samb.)
Table 3.13 : Planted Area and Production of Industrial Crops by District/Division, Sarawak, 2017 (cont'd.)
Daerah / Bahagian
District / Division Honey Bee Grain Corn Total

Muka surat ini sengaja dibiarkan kosong
W.P LABUAN
FEDERAL TERRITORY OF LABUAN
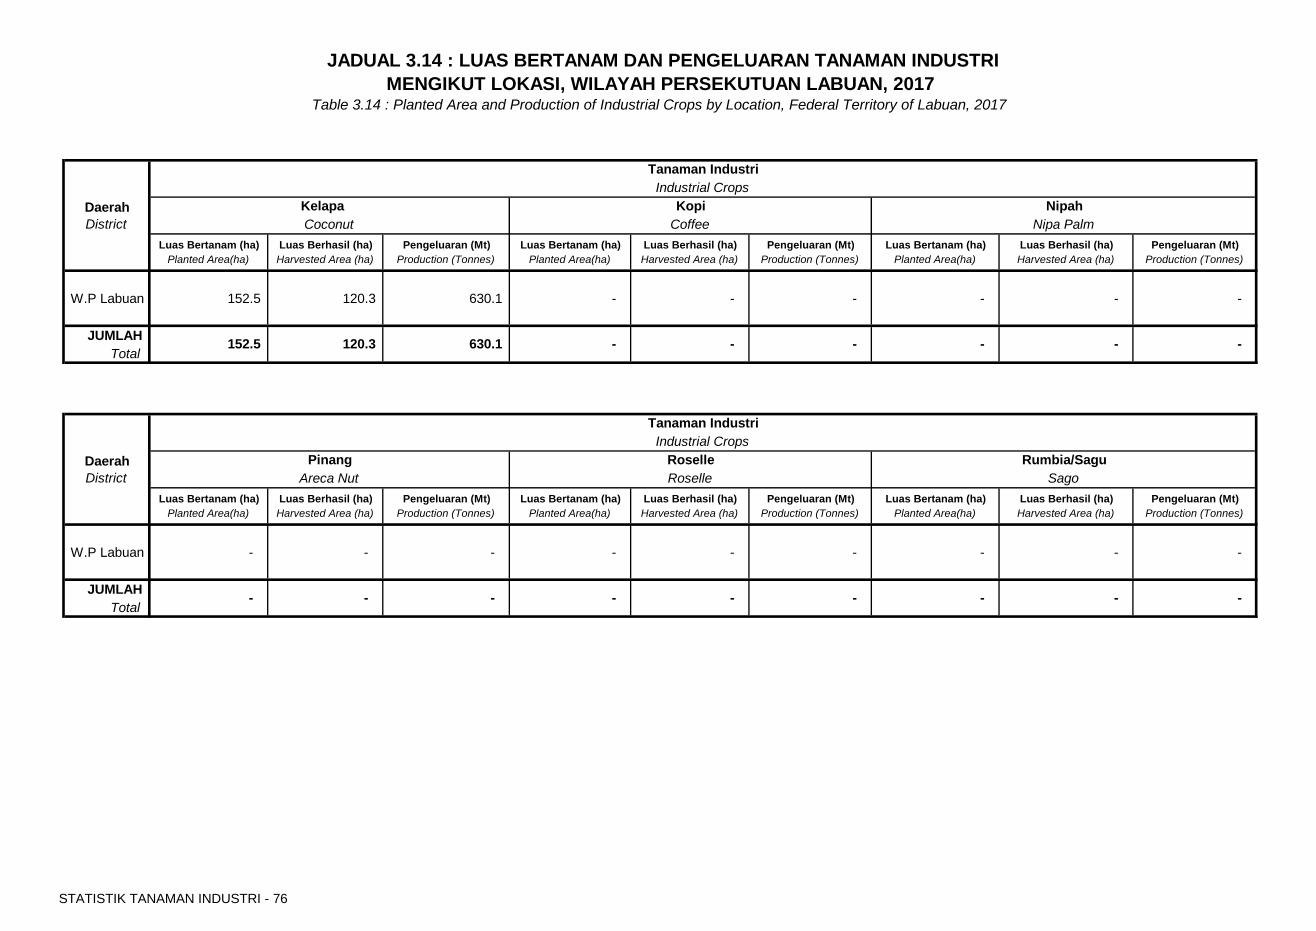
STATISTIK TANAMAN INDUSTRI - 76
Luas Bertanam (ha) Luas Berhasil (ha) Pengeluaran (Mt) Luas Bertanam (ha) Luas Berhasil (ha) Pengeluaran (Mt) Luas Bertanam (ha) Luas Berhasil (ha) Pengeluaran (Mt)Planted Area(ha) Harvested Area (ha) Production (Tonnes) Planted Area(ha) Harvested Area (ha) Production (Tonnes) Planted Area(ha) Harvested Area (ha) Production (Tonnes)
W.P Labuan 152.5 120.3 630.1 - - - - - -
JUMLAHTotal
Luas Bertanam (ha) Luas Berhasil (ha) Pengeluaran (Mt) Luas Bertanam (ha) Luas Berhasil (ha) Pengeluaran (Mt) Luas Bertanam (ha) Luas Berhasil (ha) Pengeluaran (Mt)Planted Area(ha) Harvested Area (ha) Production (Tonnes) Planted Area(ha) Harvested Area (ha) Production (Tonnes) Planted Area(ha) Harvested Area (ha) Production (Tonnes)
W.P Labuan - - - - - - - - -
JUMLAHTotal
-
-
- -
152.5 630.1
- - -
JADUAL 3.14 : LUAS BERTANAM DAN PENGELUARAN TANAMAN INDUSTRI
Daerah
120.3 -
MENGIKUT LOKASI, WILAYAH PERSEKUTUAN LABUAN, 2017 Table 3.14 : Planted Area and Production of Industrial Crops by Location, Federal Territory of Labuan, 2017
NipahNipa PalmCoconut Coffee
Industrial CropsPinang
District
- -
Rumbia/Sagu
Daerah Kopi
- -
RoselleDistrict Areca Nut Sago
-
Tanaman IndustriIndustrial Crops
Kelapa
-
Roselle
Tanaman Industri
-
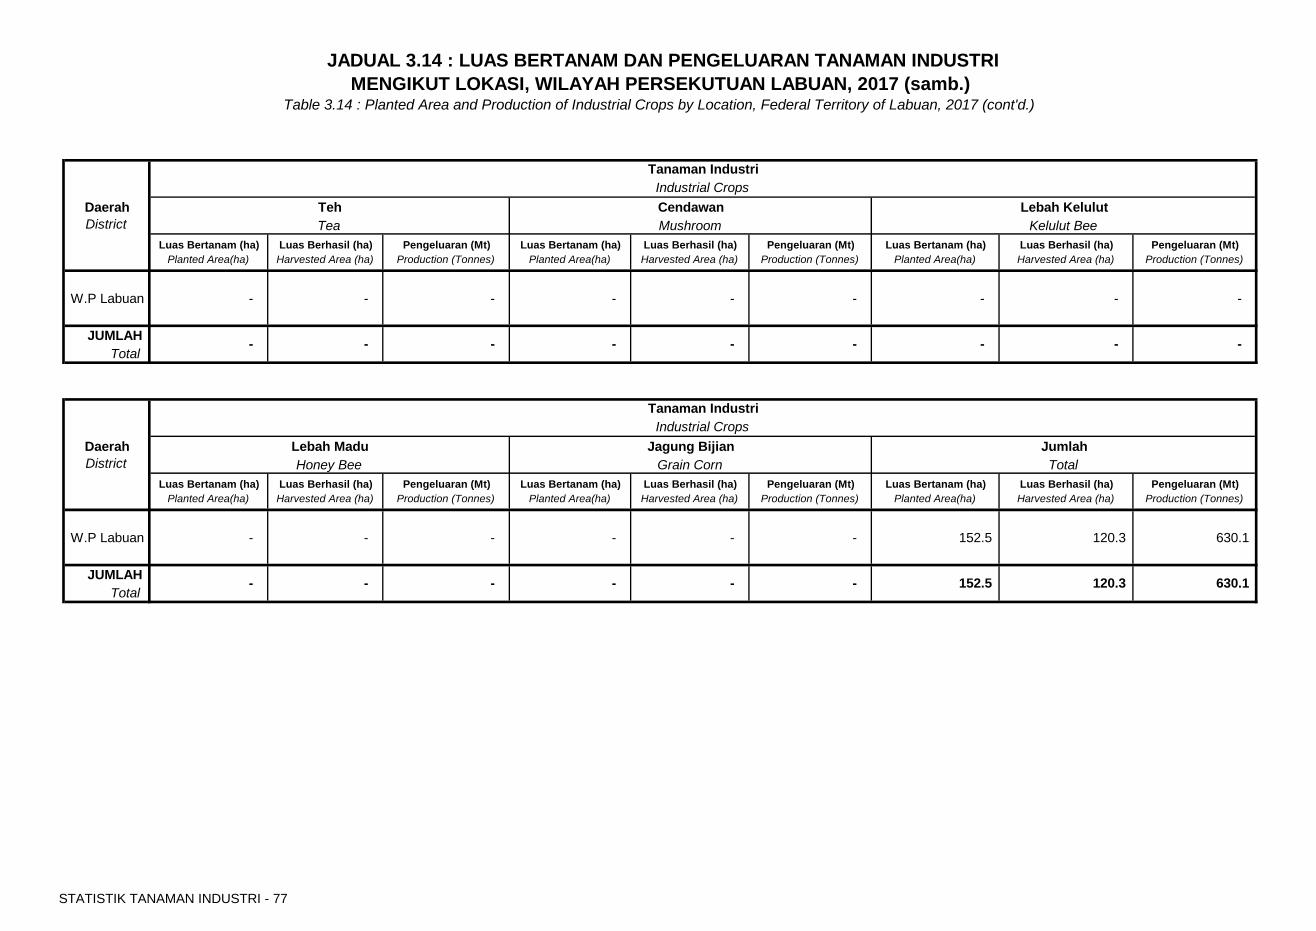
STATISTIK TANAMAN INDUSTRI - 77
Luas Bertanam (ha) Luas Berhasil (ha) Pengeluaran (Mt) Luas Bertanam (ha) Luas Berhasil (ha) Pengeluaran (Mt) Luas Bertanam (ha) Luas Berhasil (ha) Pengeluaran (Mt)Planted Area(ha) Harvested Area (ha) Production (Tonnes) Planted Area(ha) Harvested Area (ha) Production (Tonnes) Planted Area(ha) Harvested Area (ha) Production (Tonnes)
W.P Labuan - - - - - - - - -
JUMLAHTotal
Luas Bertanam (ha) Luas Berhasil (ha) Pengeluaran (Mt) Luas Bertanam (ha) Luas Berhasil (ha) Pengeluaran (Mt) Luas Bertanam (ha) Luas Berhasil (ha) Pengeluaran (Mt)Planted Area(ha) Harvested Area (ha) Production (Tonnes) Planted Area(ha) Harvested Area (ha) Production (Tonnes) Planted Area(ha) Harvested Area (ha) Production (Tonnes)
W.P Labuan - - - - - - 152.5 120.3 630.1
JUMLAHTotal
Daerah
Tanaman IndustriIndustrial Crops
630.1 -
Jagung BijianDistrict Honey Bee Total
Cendawan
Tanaman IndustriIndustrial Crops
Teh
-
Grain Corn
-
JADUAL 3.14 : LUAS BERTANAM DAN PENGELUARAN TANAMAN INDUSTRI
Daerah
- -
MENGIKUT LOKASI, WILAYAH PERSEKUTUAN LABUAN, 2017 (samb.)Table 3.14 : Planted Area and Production of Industrial Crops by Location, Federal Territory of Labuan, 2017 (cont'd.)
Lebah KelulutKelulut BeeTea Mushroom
Lebah Madu
District
- -
Jumlah
-
-
-
152.5 120.3
- -
- - -

Muka surat ini sengaja dibiarkan kosong
SEKSYEN 4 Section 4
LUAS BERTANAM DAN PENGELUARAN TANAMAN INDUSTRI MENGIKUT JENIS PENGURUSAN, MALAYSIA, 2017
Planted Area and Production of Industrial Crops by Type
of Management, Malaysia, 2017
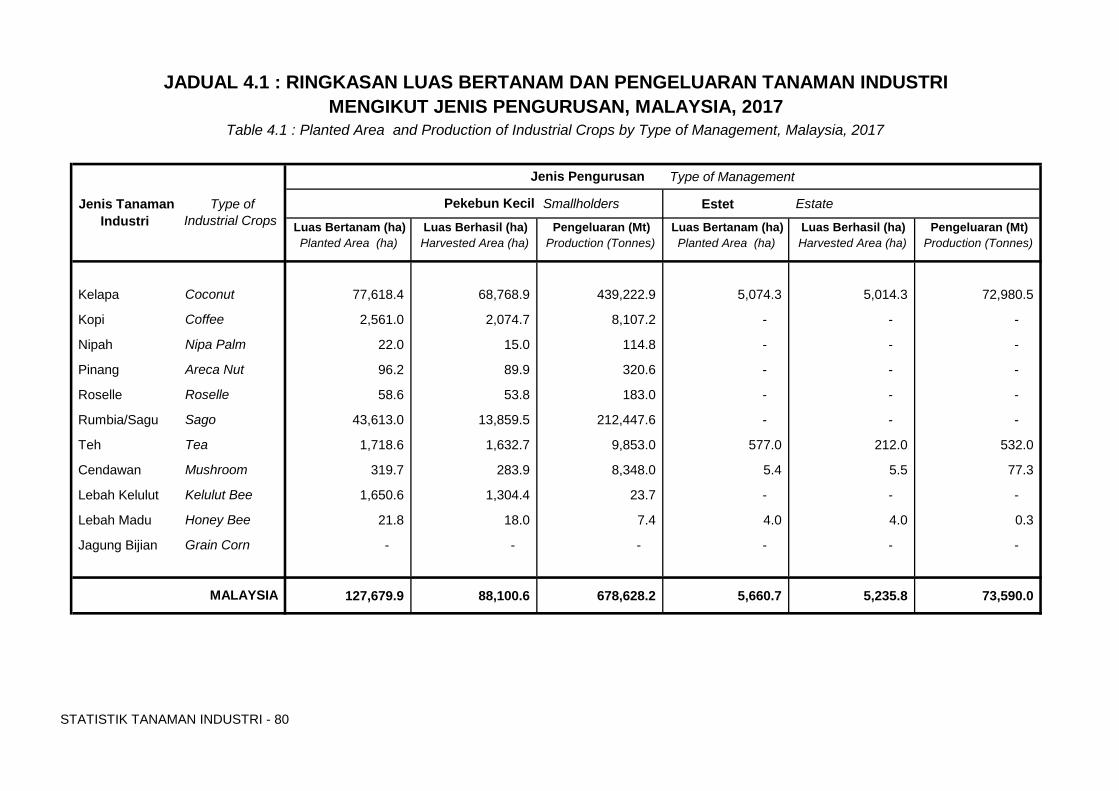
STATISTIK TANAMAN INDUSTRI - 80
Type of Management
Smallholders Estet Estate
Luas Bertanam (ha) Luas Berhasil (ha) Pengeluaran (Mt) Luas Bertanam (ha) Luas Berhasil (ha) Pengeluaran (Mt) Planted Area (ha) Harvested Area (ha) Production (Tonnes) Planted Area (ha) Harvested Area (ha) Production (Tonnes)
Kelapa Coconut 77,618.4 68,768.9 439,222.9 5,074.3 5,014.3 72,980.5
Kopi Coffee 2,561.0 2,074.7 8,107.2 - - -
Nipah Nipa Palm 22.0 15.0 114.8 - - -
Pinang Areca Nut 96.2 89.9 320.6 - - -
Roselle Roselle 58.6 53.8 183.0 - - -
Rumbia/Sagu Sago 43,613.0 13,859.5 212,447.6 - - -
Teh Tea 1,718.6 1,632.7 9,853.0 577.0 212.0 532.0
Cendawan Mushroom 319.7 283.9 8,348.0 5.4 5.5 77.3
Lebah Kelulut Kelulut Bee 1,650.6 1,304.4 23.7 - - -
Lebah Madu Honey Bee 21.8 18.0 7.4 4.0 4.0 0.3
Jagung Bijian Grain Corn - - - - - -
127,679.9 88,100.6 678,628.2 5,660.7 5,235.8 73,590.0 MALAYSIA
JADUAL 4.1 : RINGKASAN LUAS BERTANAM DAN PENGELUARAN TANAMAN INDUSTRIMENGIKUT JENIS PENGURUSAN, MALAYSIA, 2017
Table 4.1 : Planted Area and Production of Industrial Crops by Type of Management, Malaysia, 2017
Jenis Tanaman Industri
Type of Industrial Crops
Jenis Pengurusan
Pekebun Kecil
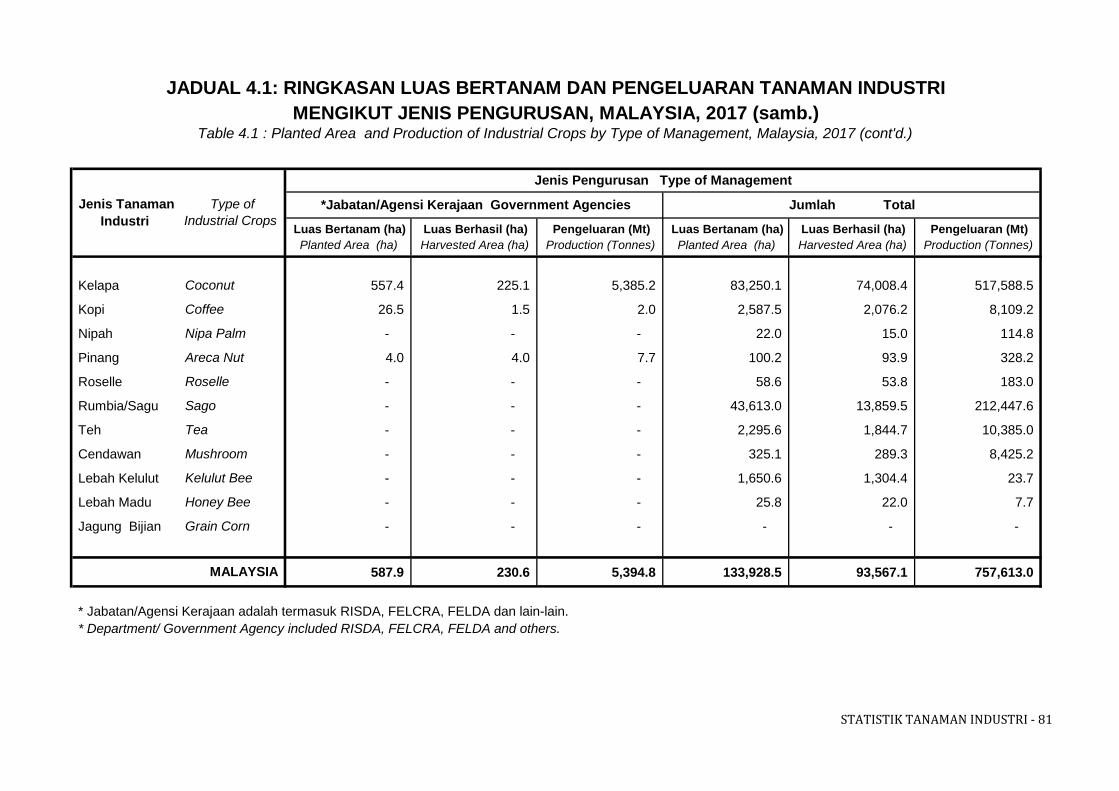
STATISTIK TANAMAN INDUSTRI - 81
Luas Bertanam (ha) Luas Berhasil (ha) Pengeluaran (Mt) Luas Bertanam (ha) Luas Berhasil (ha) Pengeluaran (Mt) Planted Area (ha) Harvested Area (ha) Production (Tonnes) Planted Area (ha) Harvested Area (ha) Production (Tonnes)
Kelapa Coconut 557.4 225.1 5,385.2 83,250.1 74,008.4 517,588.5
Kopi Coffee 26.5 1.5 2.0 2,587.5 2,076.2 8,109.2
Nipah Nipa Palm - - - 22.0 15.0 114.8
Pinang Areca Nut 4.0 4.0 7.7 100.2 93.9 328.2
Roselle Roselle - - - 58.6 53.8 183.0
Rumbia/Sagu Sago - - - 43,613.0 13,859.5 212,447.6
Teh Tea - - - 2,295.6 1,844.7 10,385.0
Cendawan Mushroom - - - 325.1 289.3 8,425.2
Lebah Kelulut Kelulut Bee - - - 1,650.6 1,304.4 23.7
Lebah Madu Honey Bee - - - 25.8 22.0 7.7
Jagung Bijian Grain Corn - - - - - -
587.9 230.6 5,394.8 133,928.5 93,567.1 757,613.0
* Jabatan/Agensi Kerajaan adalah termasuk RISDA, FELCRA, FELDA dan lain-lain.* Department/ Government Agency included RISDA, FELCRA, FELDA and others.
JADUAL 4.1: RINGKASAN LUAS BERTANAM DAN PENGELUARAN TANAMAN INDUSTRIMENGIKUT JENIS PENGURUSAN, MALAYSIA, 2017 (samb.)
Table 4.1 : Planted Area and Production of Industrial Crops by Type of Management, Malaysia, 2017 (cont'd.)
Jenis Tanaman Industri
Type of Industrial Crops
Jenis Pengurusan Type of Management
MALAYSIA
*Jabatan/Agensi Kerajaan Government Agencies Jumlah Total
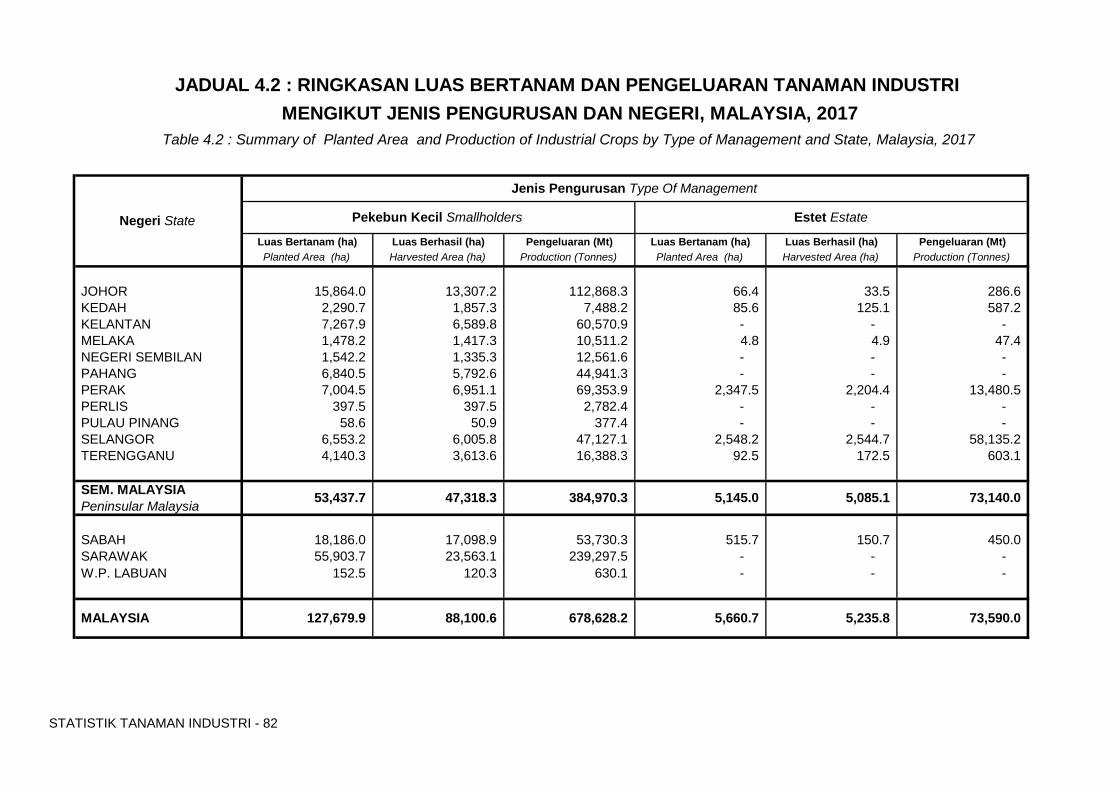
STATISTIK TANAMAN INDUSTRI - 82
Luas Bertanam (ha) Luas Berhasil (ha) Pengeluaran (Mt) Luas Bertanam (ha) Luas Berhasil (ha) Pengeluaran (Mt)Planted Area (ha) Harvested Area (ha) Production (Tonnes) Planted Area (ha) Harvested Area (ha) Production (Tonnes)
JOHOR 15,864.0 13,307.2 112,868.3 66.4 33.5 286.6 KEDAH 2,290.7 1,857.3 7,488.2 85.6 125.1 587.2 KELANTAN 7,267.9 6,589.8 60,570.9 - - - MELAKA 1,478.2 1,417.3 10,511.2 4.8 4.9 47.4 NEGERI SEMBILAN 1,542.2 1,335.3 12,561.6 - - - PAHANG 6,840.5 5,792.6 44,941.3 - - - PERAK 7,004.5 6,951.1 69,353.9 2,347.5 2,204.4 13,480.5 PERLIS 397.5 397.5 2,782.4 - - - PULAU PINANG 58.6 50.9 377.4 - - - SELANGOR 6,553.2 6,005.8 47,127.1 2,548.2 2,544.7 58,135.2 TERENGGANU 4,140.3 3,613.6 16,388.3 92.5 172.5 603.1
SEM. MALAYSIAPeninsular Malaysia
SABAH 18,186.0 17,098.9 53,730.3 515.7 150.7 450.0 SARAWAK 55,903.7 23,563.1 239,297.5 - - - W.P. LABUAN 152.5 120.3 630.1 - - -
MALAYSIA
73,140.0
73,590.0 127,679.9
384,970.3 5,145.0 47,318.3
88,100.6 5,235.8 678,628.2 5,660.7
53,437.7
Negeri State Pekebun Kecil Smallholders Estet Estate
JADUAL 4.2 : RINGKASAN LUAS BERTANAM DAN PENGELUARAN TANAMAN INDUSTRI
5,085.1
Jenis Pengurusan Type Of Management
Table 4.2 : Summary of Planted Area and Production of Industrial Crops by Type of Management and State, Malaysia, 2017
MENGIKUT JENIS PENGURUSAN DAN NEGERI, MALAYSIA, 2017
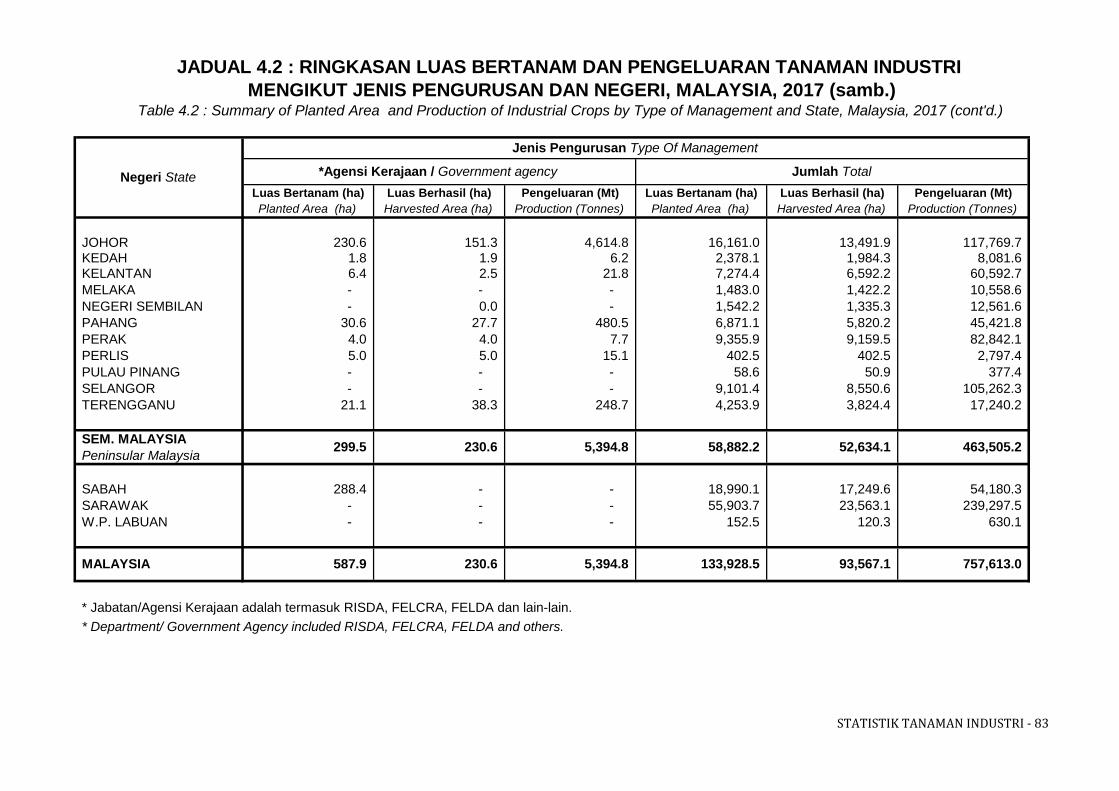
STATISTIK TANAMAN INDUSTRI - 83
Luas Bertanam (ha) Luas Berhasil (ha) Pengeluaran (Mt) Luas Bertanam (ha) Luas Berhasil (ha) Pengeluaran (Mt)Planted Area (ha) Harvested Area (ha) Production (Tonnes) Planted Area (ha) Harvested Area (ha) Production (Tonnes)
JOHOR 230.6 151.3 4,614.8 16,161.0 13,491.9 117,769.7 KEDAH 1.8 1.9 6.2 2,378.1 1,984.3 8,081.6 KELANTAN 6.4 2.5 21.8 7,274.4 6,592.2 60,592.7 MELAKA - - - 1,483.0 1,422.2 10,558.6 NEGERI SEMBILAN - 0.0 - 1,542.2 1,335.3 12,561.6 PAHANG 30.6 27.7 480.5 6,871.1 5,820.2 45,421.8 PERAK 4.0 4.0 7.7 9,355.9 9,159.5 82,842.1 PERLIS 5.0 5.0 15.1 402.5 402.5 2,797.4 PULAU PINANG - - - 58.6 50.9 377.4 SELANGOR - - - 9,101.4 8,550.6 105,262.3 TERENGGANU 21.1 38.3 248.7 4,253.9 3,824.4 17,240.2
SEM. MALAYSIAPeninsular Malaysia
SABAH 288.4 - - 18,990.1 17,249.6 54,180.3 SARAWAK - - - 55,903.7 23,563.1 239,297.5 W.P. LABUAN - - - 152.5 120.3 630.1
* Jabatan/Agensi Kerajaan adalah termasuk RISDA, FELCRA, FELDA dan lain-lain.* Department/ Government Agency included RISDA, FELCRA, FELDA and others.
5,394.8
299.5 230.6 5,394.8
JADUAL 4.2 : RINGKASAN LUAS BERTANAM DAN PENGELUARAN TANAMAN INDUSTRI
58,882.2
133,928.5 93,567.1
MENGIKUT JENIS PENGURUSAN DAN NEGERI, MALAYSIA, 2017 (samb.)
Negeri State
Jenis Pengurusan Type Of Management
*Agensi Kerajaan / Government agency Jumlah Total
Table 4.2 : Summary of Planted Area and Production of Industrial Crops by Type of Management and State, Malaysia, 2017 (cont'd.)
757,613.0
52,634.1 463,505.2
MALAYSIA 587.9 230.6
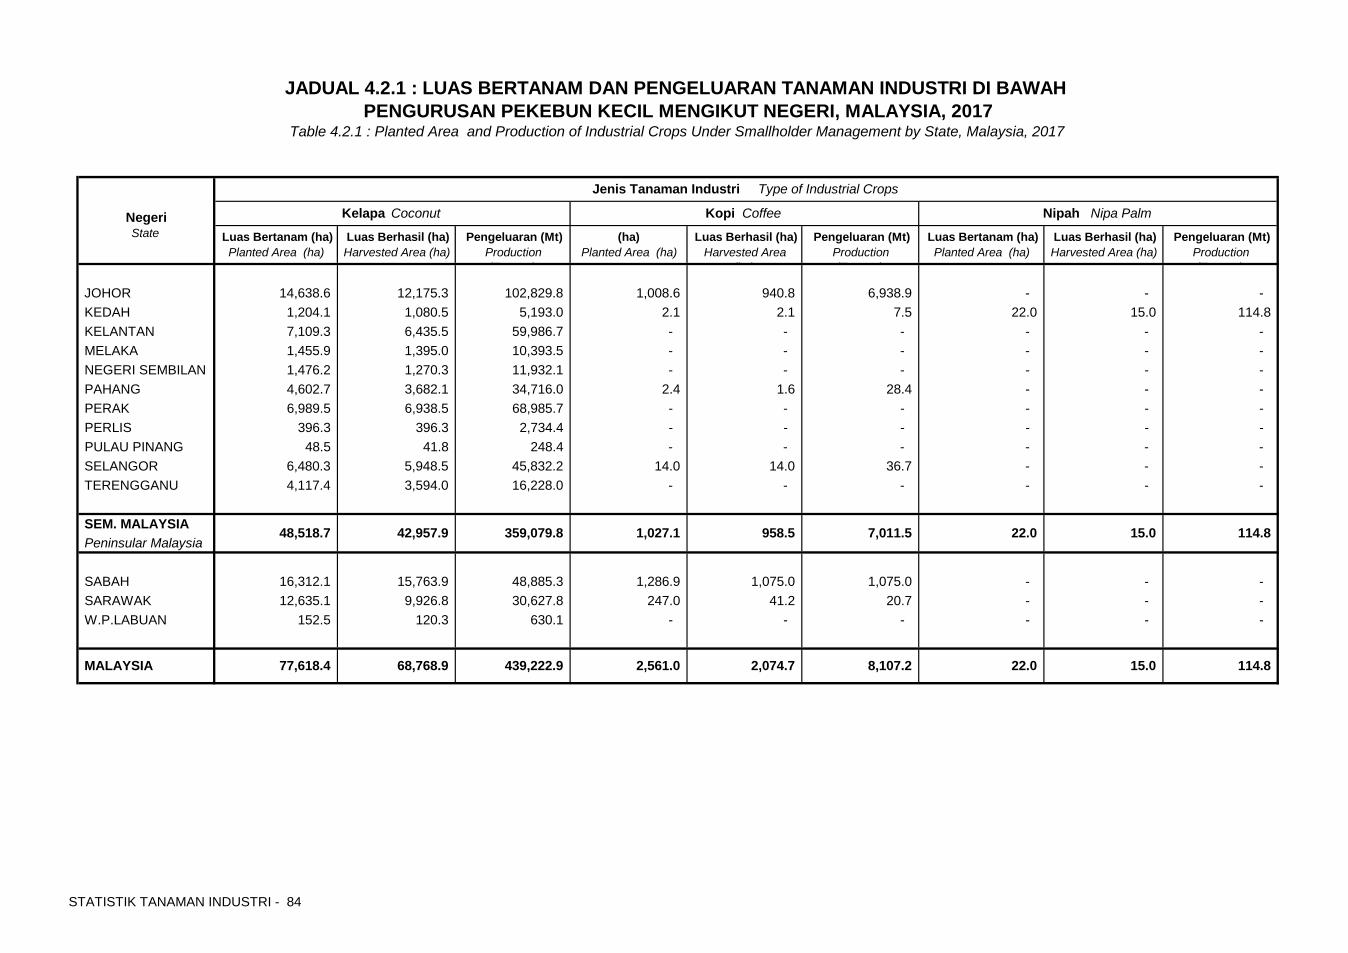
STATISTIK TANAMAN INDUSTRI - 84
Luas Bertanam (ha) Luas Berhasil (ha) Pengeluaran (Mt)
(ha) Luas Berhasil (ha) Pengeluaran (Mt) Luas Bertanam (ha) Luas Berhasil (ha) Pengeluaran (Mt) Planted Area (ha) Harvested Area (ha) Production
(T ) Planted Area (ha) Harvested Area
(h ) Production (T )
Planted Area (ha) Harvested Area (ha) Production (T )
JOHOR 14,638.6 12,175.3 102,829.8 1,008.6 940.8 6,938.9 - - - KEDAH 1,204.1 1,080.5 5,193.0 2.1 2.1 7.5 22.0 15.0 114.8 KELANTAN 7,109.3 6,435.5 59,986.7 - - - - - - MELAKA 1,455.9 1,395.0 10,393.5 - - - - - - NEGERI SEMBILAN 1,476.2 1,270.3 11,932.1 - - - - - - PAHANG 4,602.7 3,682.1 34,716.0 2.4 1.6 28.4 - - - PERAK 6,989.5 6,938.5 68,985.7 - - - - - - PERLIS 396.3 396.3 2,734.4 - - - - - - PULAU PINANG 48.5 41.8 248.4 - - - - - - SELANGOR 6,480.3 5,948.5 45,832.2 14.0 14.0 36.7 - - - TERENGGANU 4,117.4 3,594.0 16,228.0 - - - - - -
SEM. MALAYSIAPeninsular Malaysia
SABAH 16,312.1 15,763.9 48,885.3 1,286.9 1,075.0 1,075.0 - - - SARAWAK 12,635.1 9,926.8 30,627.8 247.0 41.2 20.7 - - - W.P.LABUAN 152.5 120.3 630.1 - - - - - -
StateKopi Coffee
22.0 7,011.5 42,957.9
JADUAL 4.2.1 : LUAS BERTANAM DAN PENGELUARAN TANAMAN INDUSTRI DI BAWAH PENGURUSAN PEKEBUN KECIL MENGIKUT NEGERI, MALAYSIA, 2017
Table 4.2.1 : Planted Area and Production of Industrial Crops Under Smallholder Management by State, Malaysia, 2017
Kelapa Coconut Nipah Nipa Palm
Jenis Tanaman Industri Type of Industrial Crops
Negeri
114.8 958.5 1,027.1
77,618.4 2,074.7
15.0 48,518.7 359,079.8
MALAYSIA 8,107.2 114.8 15.0 22.0 2,561.0 439,222.9 68,768.9
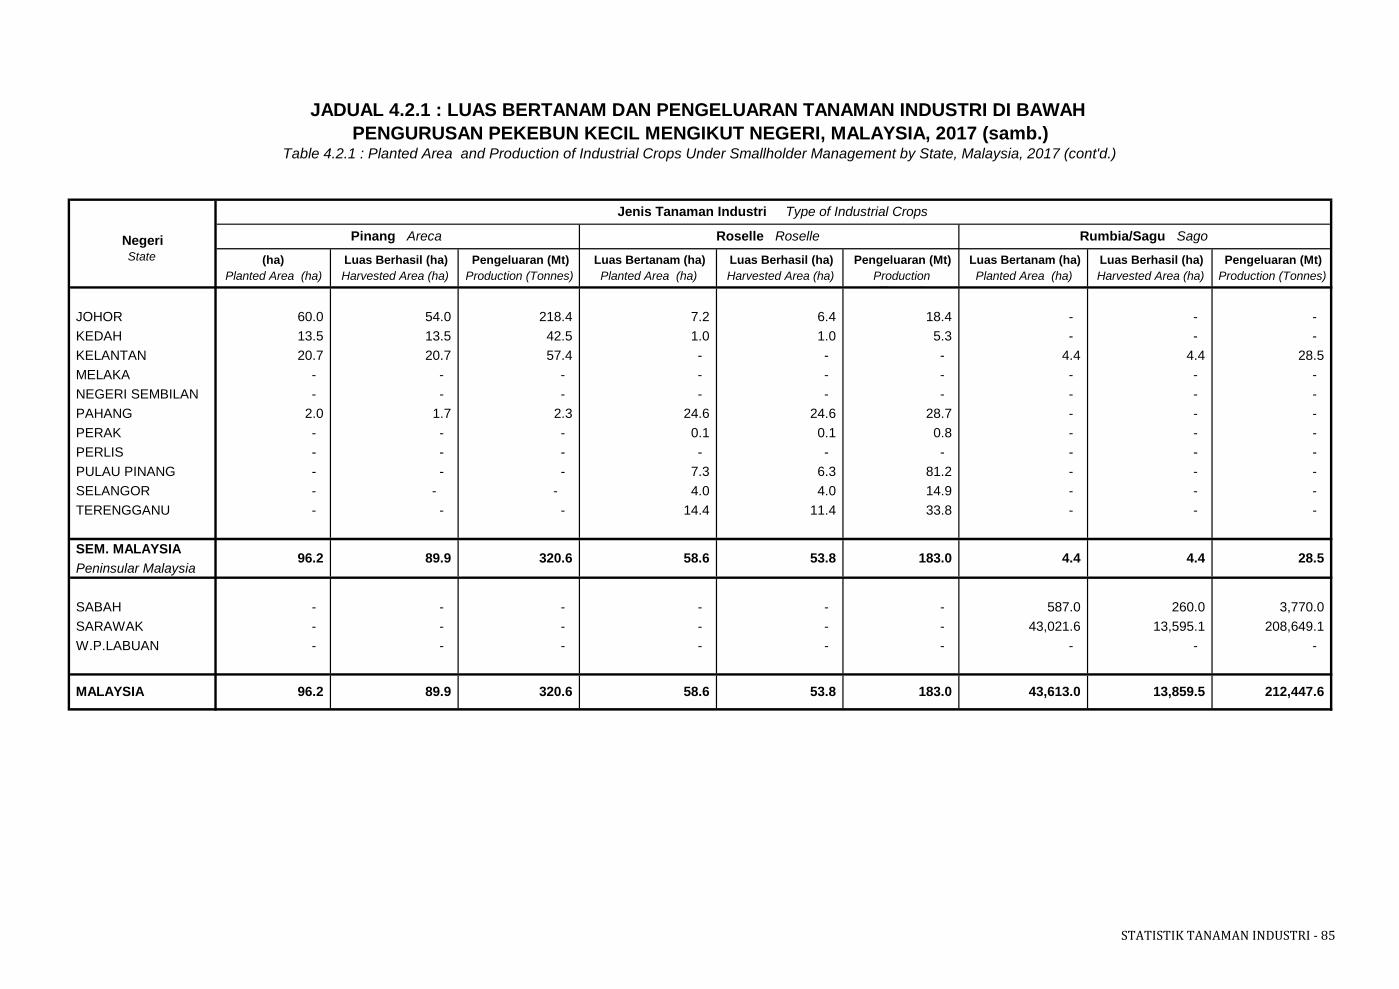
STATISTIK TANAMAN INDUSTRI - 85
(ha) Luas Berhasil (ha) Pengeluaran (Mt) Luas Bertanam (ha) Luas Berhasil (ha) Pengeluaran (Mt) Luas Bertanam (ha) Luas Berhasil (ha) Pengeluaran (Mt)
Planted Area (ha) Harvested Area (ha) Production (Tonnes) Planted Area (ha) Harvested Area (ha) Production (T )
Planted Area (ha) Harvested Area (ha) Production (Tonnes)
JOHOR 60.0 54.0 218.4 7.2 6.4 18.4 - - - KEDAH 13.5 13.5 42.5 1.0 1.0 5.3 - - - KELANTAN 20.7 20.7 57.4 - - - 4.4 4.4 28.5 MELAKA - - - - - - - - - NEGERI SEMBILAN - - - - - - - - - PAHANG 2.0 1.7 2.3 24.6 24.6 28.7 - - - PERAK - - - 0.1 0.1 0.8 - - - PERLIS - - - - - - - - - PULAU PINANG - - - 7.3 6.3 81.2 - - - SELANGOR - - - 4.0 4.0 14.9 - - - TERENGGANU - - - 14.4 11.4 33.8 - - -
SEM. MALAYSIAPeninsular Malaysia
SABAH - - - - - - 587.0 260.0 3,770.0 SARAWAK - - - - - - 43,021.6 13,595.1 208,649.1 W.P.LABUAN - - - - - - - - -
212,447.6
NegeriState
Roselle Roselle
Jenis Tanaman Industri Type of Industrial Crops
Pinang Areca
28.5
MALAYSIA 320.6
4.4
43,613.0 53.8
JADUAL 4.2.1 : LUAS BERTANAM DAN PENGELUARAN TANAMAN INDUSTRI DI BAWAH PENGURUSAN PEKEBUN KECIL MENGIKUT NEGERI, MALAYSIA, 2017 (samb.)
Table 4.2.1 : Planted Area and Production of Industrial Crops Under Smallholder Management by State, Malaysia, 2017 (cont'd.)
Rumbia/Sagu Sago
13,859.5
89.9 96.2 320.6
89.9 96.2
4.4 58.6 53.8 183.0
58.6 183.0
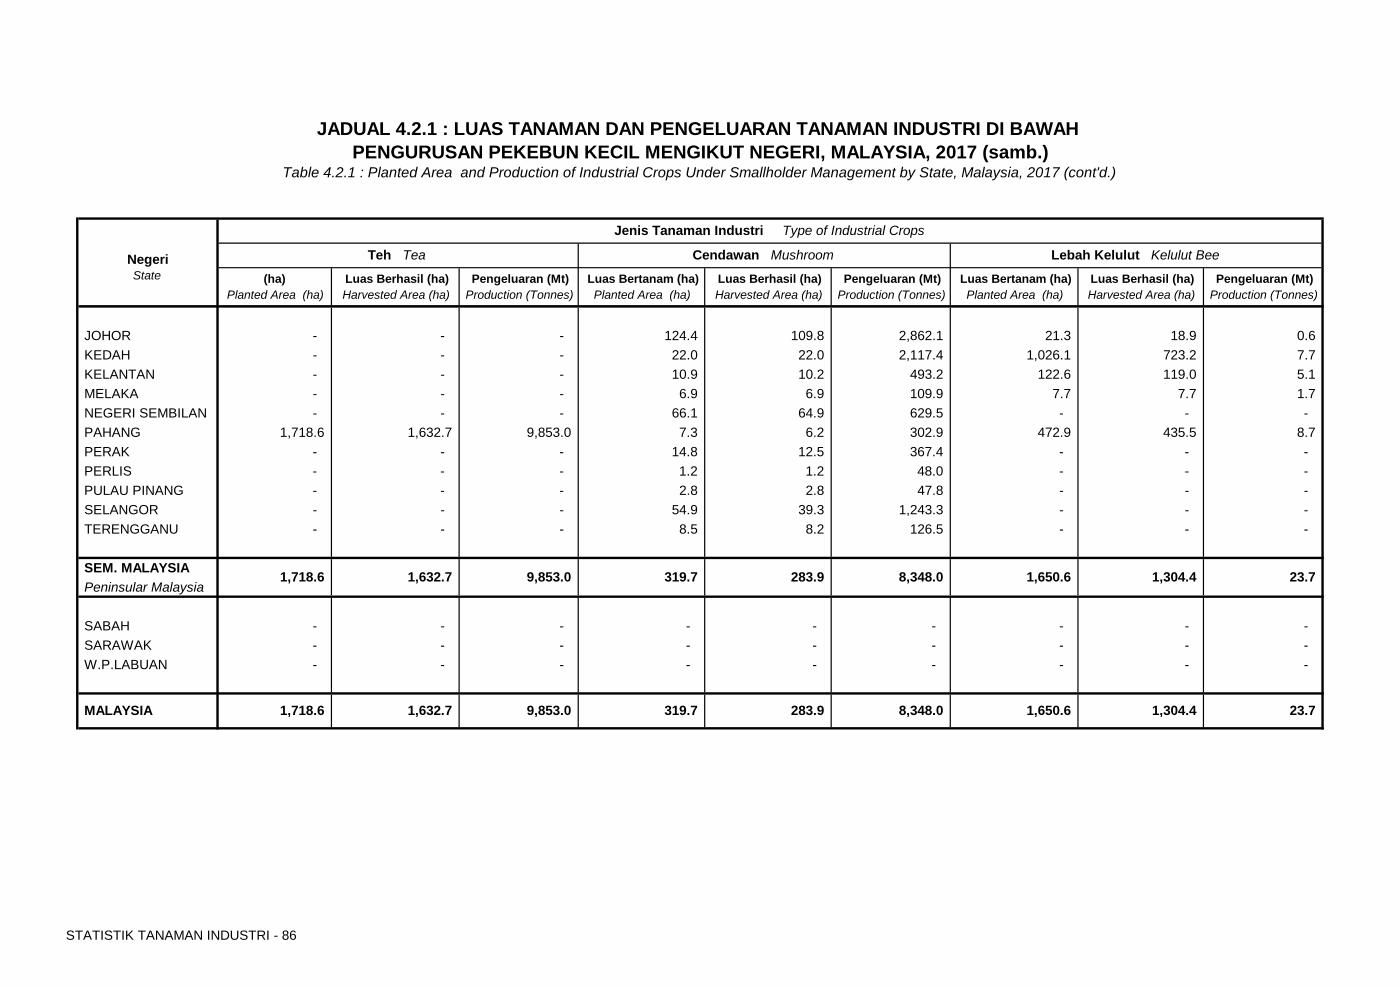
STATISTIK TANAMAN INDUSTRI - 86
(ha) Luas Berhasil (ha) Pengeluaran (Mt) Luas Bertanam (ha) Luas Berhasil (ha) Pengeluaran (Mt) Luas Bertanam (ha) Luas Berhasil (ha) Pengeluaran (Mt)
Planted Area (ha) Harvested Area (ha) Production (Tonnes) Planted Area (ha) Harvested Area (ha) Production (Tonnes) Planted Area (ha) Harvested Area (ha) Production (Tonnes)
JOHOR - - - 124.4 109.8 2,862.1 21.3 18.9 0.6 KEDAH - - - 22.0 22.0 2,117.4 1,026.1 723.2 7.7 KELANTAN - - - 10.9 10.2 493.2 122.6 119.0 5.1 MELAKA - - - 6.9 6.9 109.9 7.7 7.7 1.7 NEGERI SEMBILAN - - - 66.1 64.9 629.5 - - - PAHANG 1,718.6 1,632.7 9,853.0 7.3 6.2 302.9 472.9 435.5 8.7 PERAK - - - 14.8 12.5 367.4 - - - PERLIS - - - 1.2 1.2 48.0 - - - PULAU PINANG - - - 2.8 2.8 47.8 - - - SELANGOR - - - 54.9 39.3 1,243.3 - - - TERENGGANU - - - 8.5 8.2 126.5 - - -
SEM. MALAYSIAPeninsular Malaysia
SABAH - - - - - - - - - SARAWAK - - - - - - - - - W.P.LABUAN - - - - - - - - -
MALAYSIA 1,718.6
NegeriState
9,853.0 319.7 1,632.7
Teh Tea Cendawan Mushroom
23.7 1,304.4
283.9 8,348.0 1,650.6
283.9 8,348.0 1,650.6
JADUAL 4.2.1 : LUAS TANAMAN DAN PENGELUARAN TANAMAN INDUSTRI DI BAWAH PENGURUSAN PEKEBUN KECIL MENGIKUT NEGERI, MALAYSIA, 2017 (samb.)
Table 4.2.1 : Planted Area and Production of Industrial Crops Under Smallholder Management by State, Malaysia, 2017 (cont'd.)
1,718.6 1,632.7 9,853.0 319.7 1,304.4 23.7
Jenis Tanaman Industri Type of Industrial Crops
Lebah Kelulut Kelulut Bee
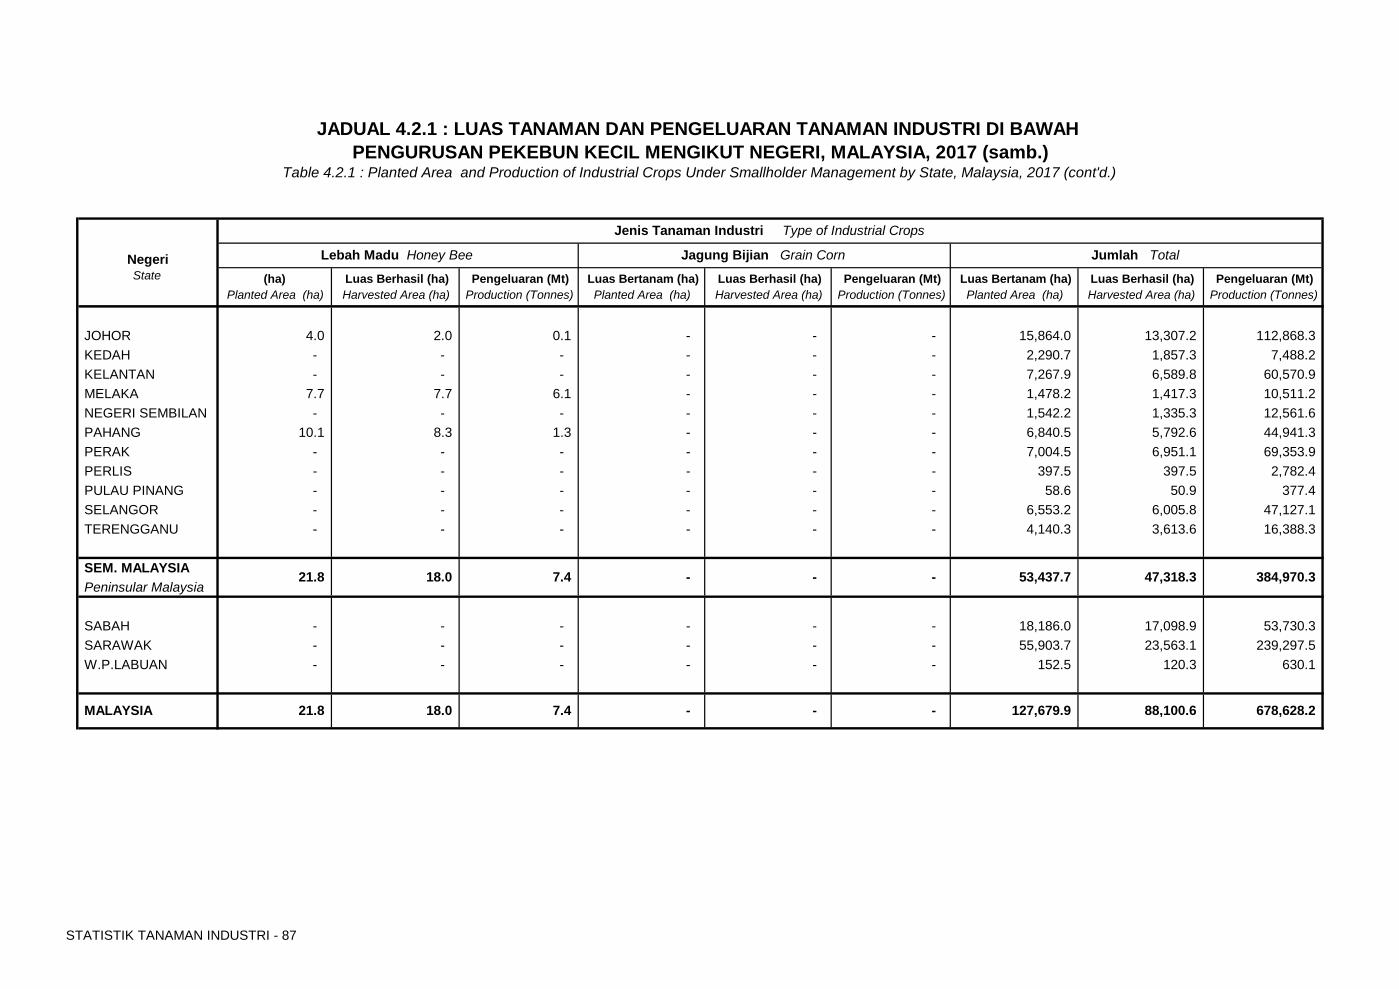
STATISTIK TANAMAN INDUSTRI - 87
(ha) Luas Berhasil (ha) Pengeluaran (Mt) Luas Bertanam (ha) Luas Berhasil (ha) Pengeluaran (Mt) Luas Bertanam (ha) Luas Berhasil (ha) Pengeluaran (Mt)
Planted Area (ha) Harvested Area (ha) Production (Tonnes) Planted Area (ha) Harvested Area (ha) Production (Tonnes) Planted Area (ha) Harvested Area (ha) Production (Tonnes)
JOHOR 4.0 2.0 0.1 - - - 15,864.0 13,307.2 112,868.3 KEDAH - - - - - - 2,290.7 1,857.3 7,488.2 KELANTAN - - - - - - 7,267.9 6,589.8 60,570.9 MELAKA 7.7 7.7 6.1 - - - 1,478.2 1,417.3 10,511.2 NEGERI SEMBILAN - - - - - - 1,542.2 1,335.3 12,561.6 PAHANG 10.1 8.3 1.3 - - - 6,840.5 5,792.6 44,941.3 PERAK - - - - - - 7,004.5 6,951.1 69,353.9 PERLIS - - - - - - 397.5 397.5 2,782.4 PULAU PINANG - - - - - - 58.6 50.9 377.4 SELANGOR - - - - - - 6,553.2 6,005.8 47,127.1 TERENGGANU - - - - - - 4,140.3 3,613.6 16,388.3
SEM. MALAYSIAPeninsular Malaysia
SABAH - - - - - - 18,186.0 17,098.9 53,730.3 SARAWAK - - - - - - 55,903.7 23,563.1 239,297.5 W.P.LABUAN - - - - - - 152.5 120.3 630.1
JADUAL 4.2.1 : LUAS TANAMAN DAN PENGELUARAN TANAMAN INDUSTRI DI BAWAH PENGURUSAN PEKEBUN KECIL MENGIKUT NEGERI, MALAYSIA, 2017 (samb.)
Table 4.2.1 : Planted Area and Production of Industrial Crops Under Smallholder Management by State, Malaysia, 2017 (cont'd.)
NegeriState
Jenis Tanaman Industri Type of Industrial Crops
Jumlah TotalLebah Madu Honey Bee Jagung Bijian Grain Corn
21.8 18.0 7.4 -
MALAYSIA 21.8 678,628.2 88,100.6
- - 53,437.7
- - 127,679.9
47,318.3 384,970.3
7.4 - 18.0
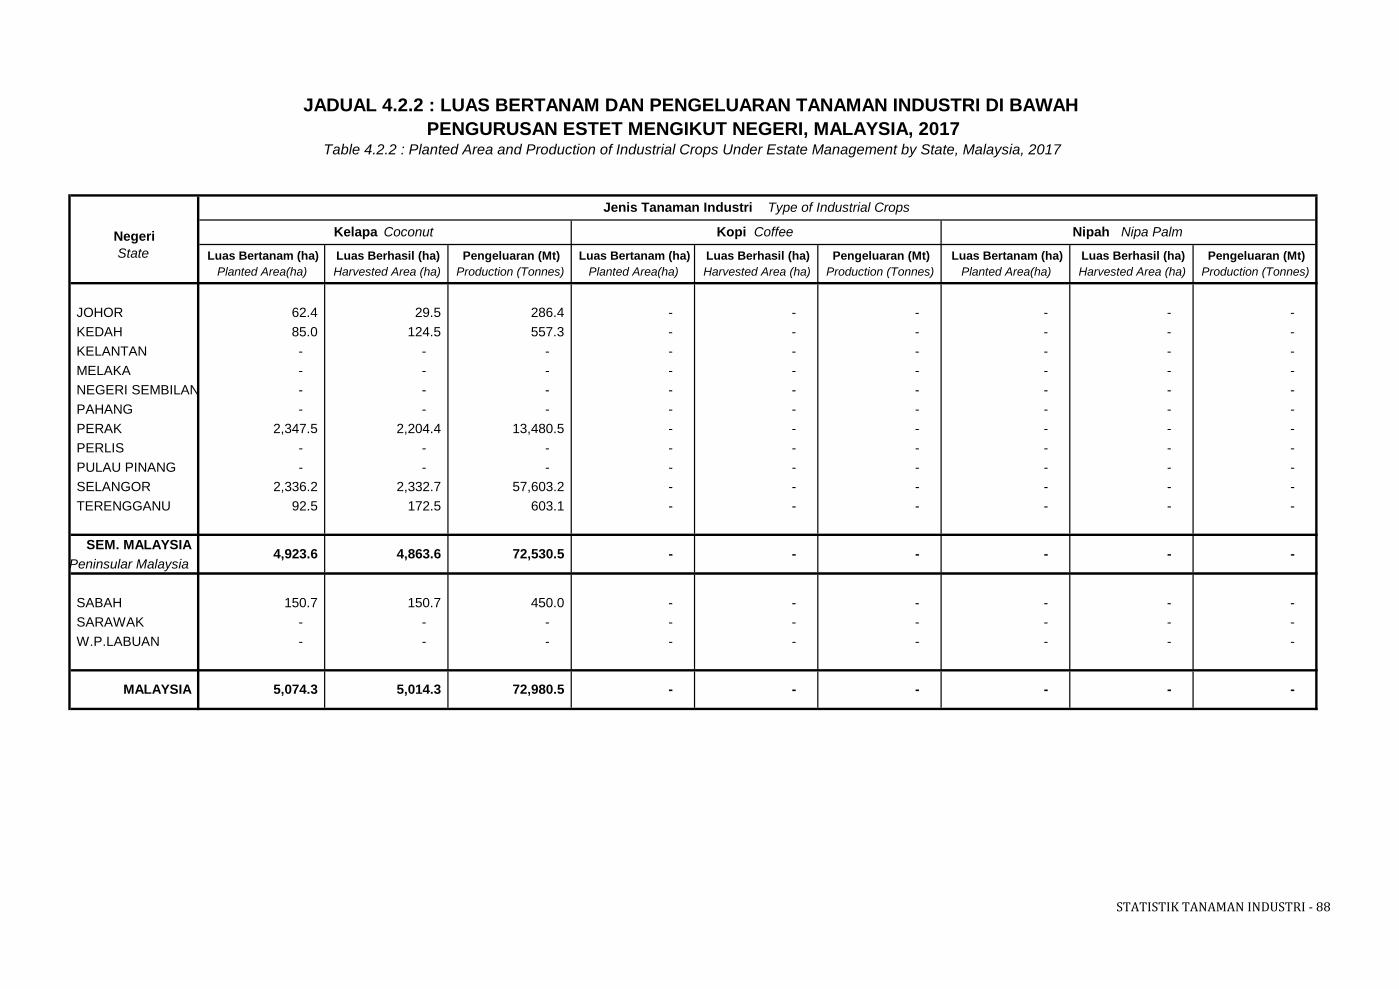
STATISTIK TANAMAN INDUSTRI - 88
NegeriState Luas Bertanam (ha) Luas Berhasil (ha) Pengeluaran (Mt) Luas Bertanam (ha) Luas Berhasil (ha) Pengeluaran (Mt) Luas Bertanam (ha) Luas Berhasil (ha) Pengeluaran (Mt)
Planted Area(ha) Harvested Area (ha) Production (Tonnes) Planted Area(ha) Harvested Area (ha) Production (Tonnes) Planted Area(ha) Harvested Area (ha) Production (Tonnes)
JOHOR 62.4 29.5 286.4 - - - - - - KEDAH 85.0 124.5 557.3 - - - - - - KELANTAN - - - - - - - - - MELAKA - - - - - - - - - NEGERI SEMBILAN - - - - - - - - - PAHANG - - - - - - - - - PERAK 2,347.5 2,204.4 13,480.5 - - - - - - PERLIS - - - - - - - - - PULAU PINANG - - - - - - - - - SELANGOR 2,336.2 2,332.7 57,603.2 - - - - - - TERENGGANU 92.5 172.5 603.1 - - - - - -
SEM. MALAYSIAPeninsular Malaysia
SABAH 150.7 150.7 450.0 - - - - - - SARAWAK - - - - - - - - - W.P.LABUAN - - - - - - - - -
- - -
-
- - -
- - - - -
MALAYSIA 5,074.3 5,014.3 72,980.5
4,923.6 4,863.6 72,530.5
JADUAL 4.2.2 : LUAS BERTANAM DAN PENGELUARAN TANAMAN INDUSTRI DI BAWAH PENGURUSAN ESTET MENGIKUT NEGERI, MALAYSIA, 2017
Table 4.2.2 : Planted Area and Production of Industrial Crops Under Estate Management by State, Malaysia, 2017
Kelapa Coconut
Jenis Tanaman Industri Type of Industrial Crops
Nipah Nipa PalmKopi Coffee
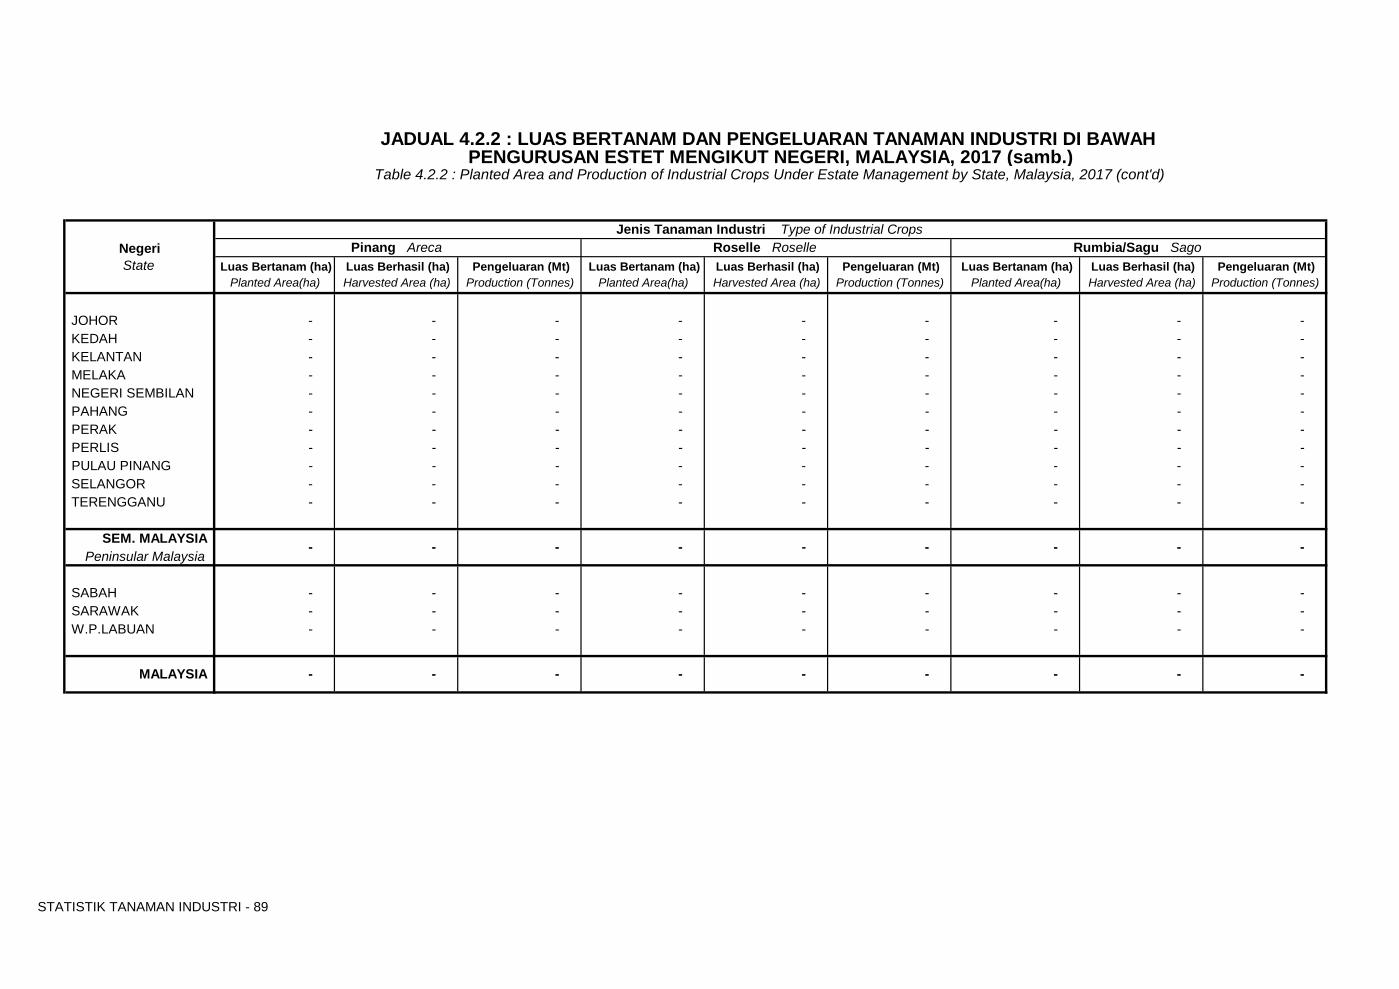
STATISTIK TANAMAN INDUSTRI - 89
NegeriState Luas Bertanam (ha) Luas Berhasil (ha) Pengeluaran (Mt) Luas Bertanam (ha) Luas Berhasil (ha) Pengeluaran (Mt) Luas Bertanam (ha) Luas Berhasil (ha) Pengeluaran (Mt)
Planted Area(ha) Harvested Area (ha) Production (Tonnes) Planted Area(ha) Harvested Area (ha) Production (Tonnes) Planted Area(ha) Harvested Area (ha) Production (Tonnes)
JOHOR - - - - - - - - - KEDAH - - - - - - - - - KELANTAN - - - - - - - - - MELAKA - - - - - - - - - NEGERI SEMBILAN - - - - - - - - - PAHANG - - - - - - - - - PERAK - - - - - - - - - PERLIS - - - - - - - - - PULAU PINANG - - - - - - - - - SELANGOR - - - - - - - - - TERENGGANU - - - - - - - - -
SEM. MALAYSIAPeninsular Malaysia
SABAH - - - - - - - - - SARAWAK - - - - - - - - - W.P.LABUAN - - - - - - - - -
-
JADUAL 4.2.2 : LUAS BERTANAM DAN PENGELUARAN TANAMAN INDUSTRI DI BAWAH PENGURUSAN ESTET MENGIKUT NEGERI, MALAYSIA, 2017 (samb.)
Table 4.2.2 : Planted Area and Production of Industrial Crops Under Estate Management by State, Malaysia, 2017 (cont'd)
Jenis Tanaman Industri Type of Industrial CropsPinang Areca Roselle Roselle Rumbia/Sagu Sago
- -
- MALAYSIA
- -
- - - - - - - -
- - - -
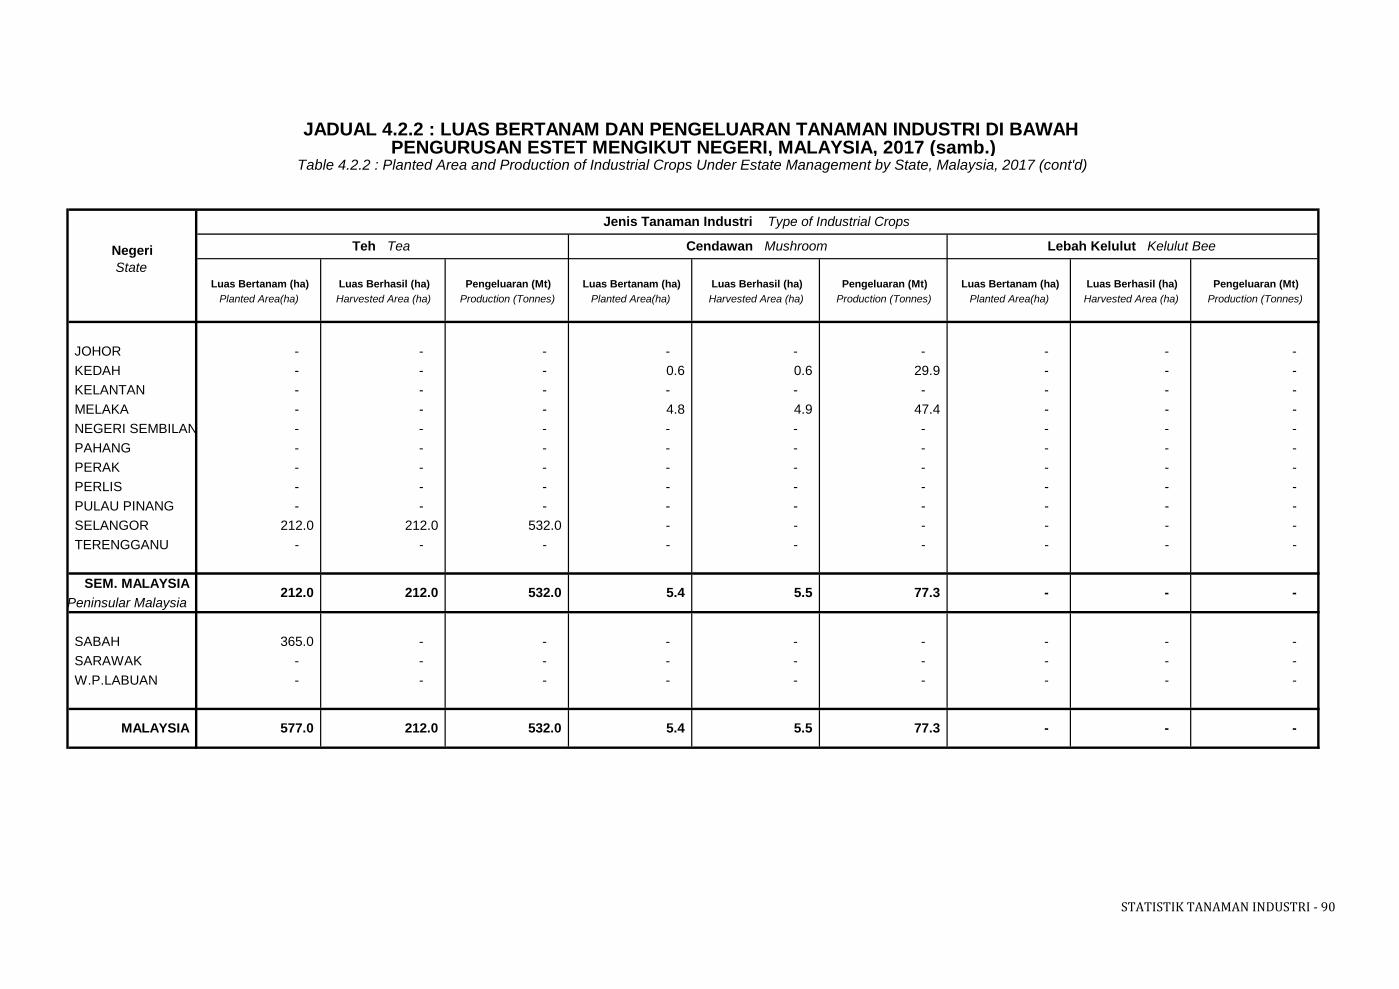
STATISTIK TANAMAN INDUSTRI - 90
NegeriState
Luas Bertanam (ha) Luas Berhasil (ha) Pengeluaran (Mt) Luas Bertanam (ha) Luas Berhasil (ha) Pengeluaran (Mt) Luas Bertanam (ha) Luas Berhasil (ha) Pengeluaran (Mt) Planted Area(ha) Harvested Area (ha) Production (Tonnes) Planted Area(ha) Harvested Area (ha) Production (Tonnes) Planted Area(ha) Harvested Area (ha) Production (Tonnes)
JOHOR - - - - - - - - - KEDAH - - - 0.6 0.6 29.9 - - - KELANTAN - - - - - - - - - MELAKA - - - 4.8 4.9 47.4 - - - NEGERI SEMBILAN - - - - - - - - - PAHANG - - - - - - - - - PERAK - - - - - - - - - PERLIS - - - - - - - - - PULAU PINANG - - - - - - - - - SELANGOR 212.0 212.0 532.0 - - - - - - TERENGGANU - - - - - - - - -
SEM. MALAYSIAPeninsular Malaysia
SABAH 365.0 - - - - - - - - SARAWAK - - - - - - - - - W.P.LABUAN - - - - - - - - -
Teh Tea Cendawan Mushroom Lebah Kelulut Kelulut Bee
212.0 212.0 532.0 5.4 5.5
JADUAL 4.2.2 : LUAS BERTANAM DAN PENGELUARAN TANAMAN INDUSTRI DI BAWAH PENGURUSAN ESTET MENGIKUT NEGERI, MALAYSIA, 2017 (samb.)
Table 4.2.2 : Planted Area and Production of Industrial Crops Under Estate Management by State, Malaysia, 2017 (cont'd)
Jenis Tanaman Industri Type of Industrial Crops
MALAYSIA 577.0 212.0
-
5.5 77.3 532.0
77.3 - -
- - 5.4 -
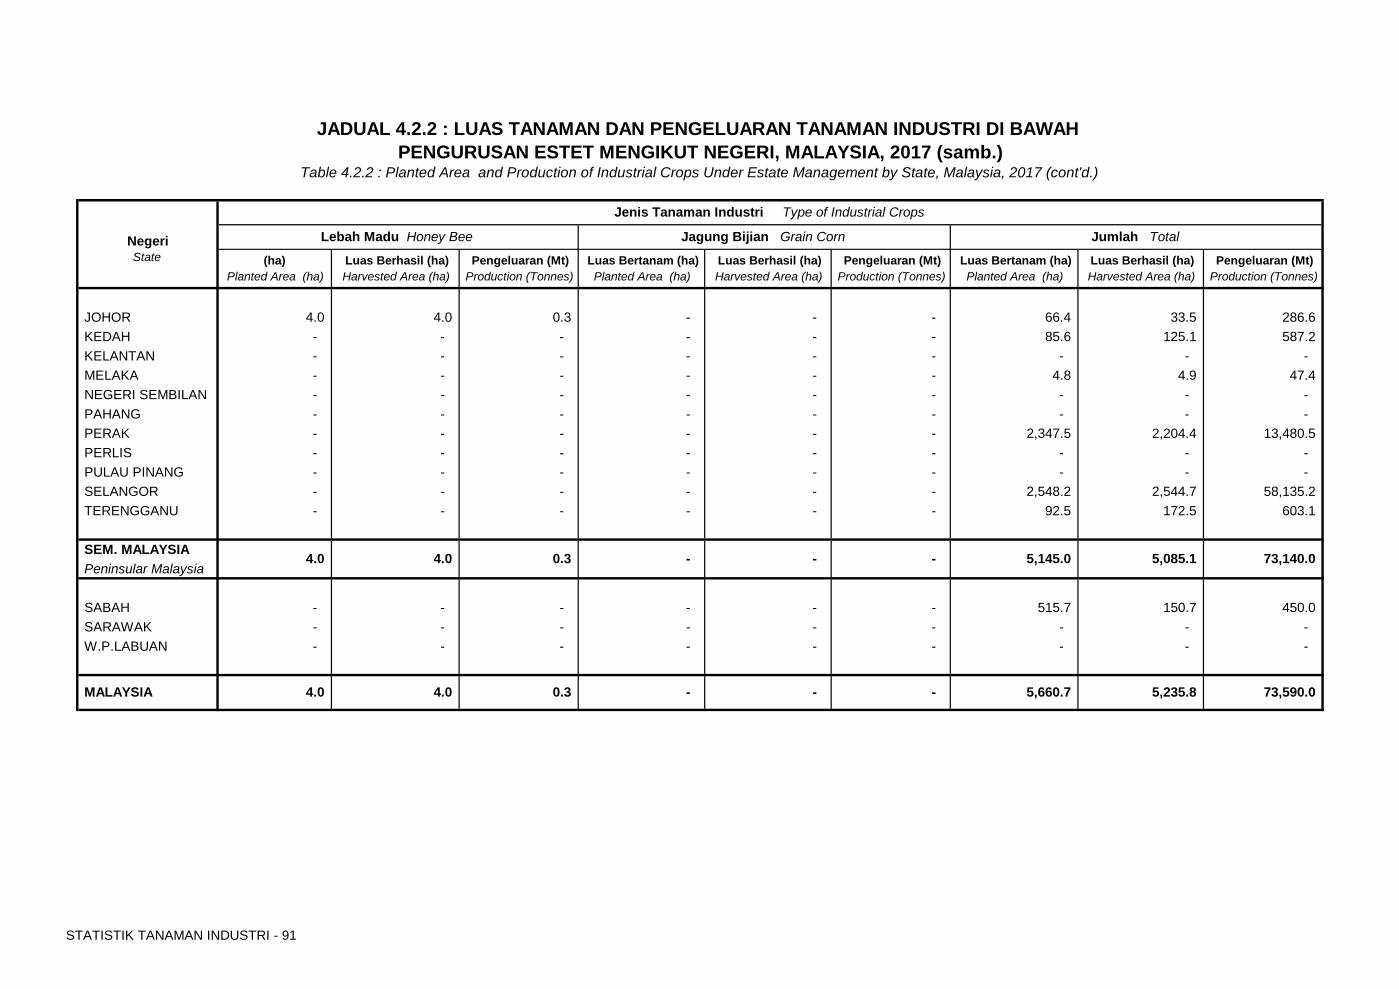
STATISTIK TANAMAN INDUSTRI - 91
(ha) Luas Berhasil (ha) Pengeluaran (Mt) Luas Bertanam (ha) Luas Berhasil (ha) Pengeluaran (Mt) Luas Bertanam (ha) Luas Berhasil (ha) Pengeluaran (Mt)
Planted Area (ha) Harvested Area (ha) Production (Tonnes) Planted Area (ha) Harvested Area (ha) Production (Tonnes) Planted Area (ha) Harvested Area (ha) Production (Tonnes)
JOHOR 4.0 4.0 0.3 - - - 66.4 33.5 286.6 KEDAH - - - - - - 85.6 125.1 587.2 KELANTAN - - - - - - - - - MELAKA - - - - - - 4.8 4.9 47.4 NEGERI SEMBILAN - - - - - - - - - PAHANG - - - - - - - - - PERAK - - - - - - 2,347.5 2,204.4 13,480.5 PERLIS - - - - - - - - - PULAU PINANG - - - - - - - - - SELANGOR - - - - - - 2,548.2 2,544.7 58,135.2 TERENGGANU - - - - - - 92.5 172.5 603.1
SEM. MALAYSIAPeninsular Malaysia
SABAH - - - - - - 515.7 150.7 450.0 SARAWAK - - - - - - - - - W.P.LABUAN - - - - - - - - -
JADUAL 4.2.2 : LUAS TANAMAN DAN PENGELUARAN TANAMAN INDUSTRI DI BAWAH PENGURUSAN ESTET MENGIKUT NEGERI, MALAYSIA, 2017 (samb.)
Table 4.2.2 : Planted Area and Production of Industrial Crops Under Estate Management by State, Malaysia, 2017 (cont'd.)
Jenis Tanaman Industri Type of Industrial Crops
Jumlah Total
73,590.0 5,235.8
- - 5,145.0
- - 5,660.7
5,085.1 73,140.0
MALAYSIA 4.0
NegeriState
0.3 - 4.0
Lebah Madu Honey Bee Jagung Bijian Grain Corn
4.0 4.0 0.3 -
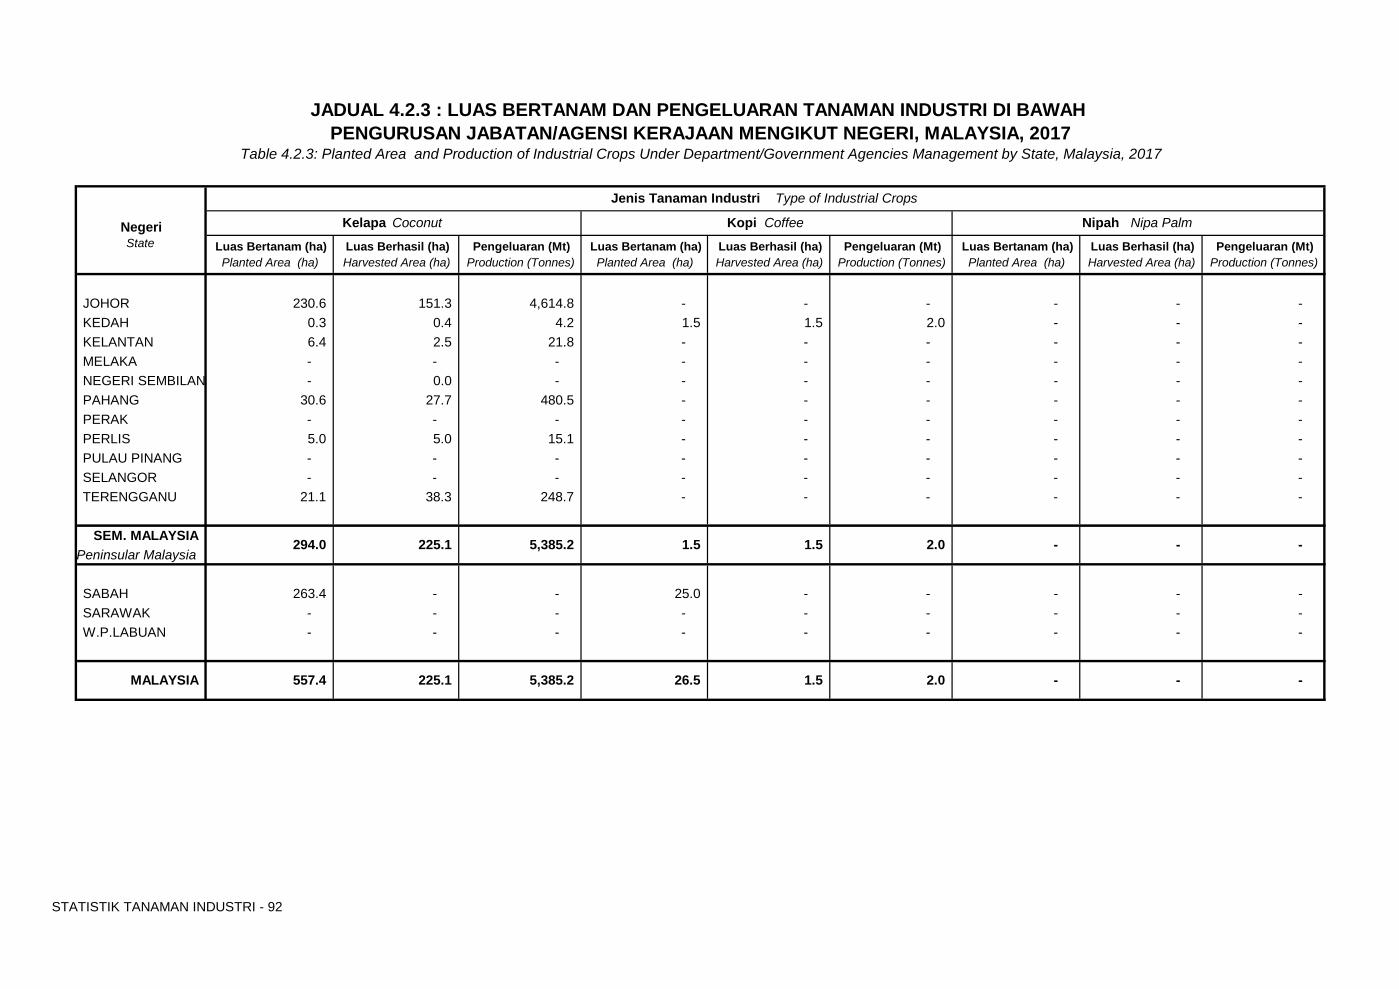
STATISTIK TANAMAN INDUSTRI - 92
Luas Bertanam (ha) Luas Berhasil (ha) Pengeluaran (Mt) Luas Bertanam (ha) Luas Berhasil (ha) Pengeluaran (Mt) Luas Bertanam (ha) Luas Berhasil (ha) Pengeluaran (Mt) Planted Area (ha) Harvested Area (ha) Production (Tonnes) Planted Area (ha) Harvested Area (ha) Production (Tonnes) Planted Area (ha) Harvested Area (ha) Production (Tonnes)
JOHOR 230.6 151.3 4,614.8 - - - - - - KEDAH 0.3 0.4 4.2 1.5 1.5 2.0 - - - KELANTAN 6.4 2.5 21.8 - - - - - - MELAKA - - - - - - - - - NEGERI SEMBILAN - 0.0 - - - - - - - PAHANG 30.6 27.7 480.5 - - - - - - PERAK - - - - - - - - - PERLIS 5.0 5.0 15.1 - - - - - - PULAU PINANG - - - - - - - - - SELANGOR - - - - - - - - - TERENGGANU 21.1 38.3 248.7 - - - - - -
SEM. MALAYSIAPeninsular Malaysia
SABAH 263.4 - - 25.0 - - - - - SARAWAK - - - - - - - - - W.P.LABUAN - - - - - - - - -
Jenis Tanaman Industri Type of Industrial Crops
- -
26.5
JADUAL 4.2.3 : LUAS BERTANAM DAN PENGELUARAN TANAMAN INDUSTRI DI BAWAH PENGURUSAN JABATAN/AGENSI KERAJAAN MENGIKUT NEGERI, MALAYSIA, 2017
Table 4.2.3: Planted Area and Production of Industrial Crops Under Department/Government Agencies Management by State, Malaysia, 2017
Negeri Kelapa Coconut Kopi Coffee Nipah Nipa Palm
2.0
-
- - MALAYSIA 557.4 225.1 5,385.2 -
2.0 1.5
1.5
State
294.0 225.1 5,385.2 1.5
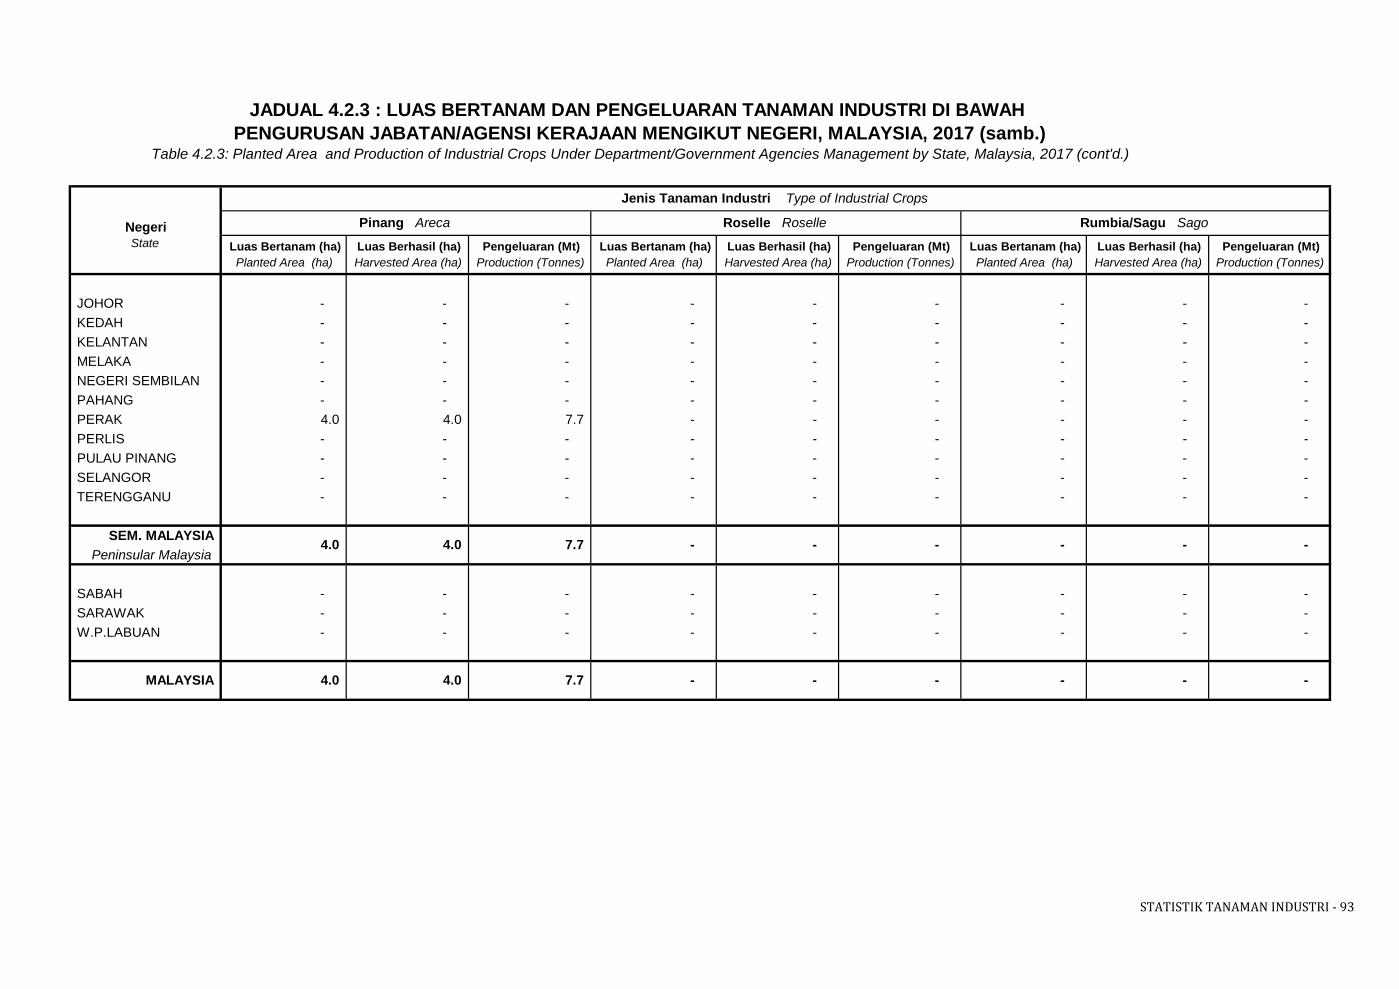
STATISTIK TANAMAN INDUSTRI - 93
Luas Bertanam (ha) Luas Berhasil (ha) Pengeluaran (Mt) Luas Bertanam (ha) Luas Berhasil (ha) Pengeluaran (Mt) Luas Bertanam (ha) Luas Berhasil (ha) Pengeluaran (Mt) Planted Area (ha) Harvested Area (ha) Production (Tonnes) Planted Area (ha) Harvested Area (ha) Production (Tonnes) Planted Area (ha) Harvested Area (ha) Production (Tonnes)
JOHOR - - - - - - - - - KEDAH - - - - - - - - - KELANTAN - - - - - - - - - MELAKA - - - - - - - - - NEGERI SEMBILAN - - - - - - - - - PAHANG - - - - - - - - - PERAK 4.0 4.0 7.7 - - - - - - PERLIS - - - - - - - - - PULAU PINANG - - - - - - - - - SELANGOR - - - - - - - - - TERENGGANU - - - - - - - - -
SEM. MALAYSIAPeninsular Malaysia
SABAH - - - - - - - - - SARAWAK - - - - - - - - - W.P.LABUAN - - - - - - - - -
State
Jenis Tanaman Industri Type of Industrial Crops
JADUAL 4.2.3 : LUAS BERTANAM DAN PENGELUARAN TANAMAN INDUSTRI DI BAWAH PENGURUSAN JABATAN/AGENSI KERAJAAN MENGIKUT NEGERI, MALAYSIA, 2017 (samb.)
Table 4.2.3: Planted Area and Production of Industrial Crops Under Department/Government Agencies Management by State, Malaysia, 2017 (cont'd.)
Negeri Pinang Areca Roselle Roselle
7.7
- -
MALAYSIA 4.0
4.0 4.0 7.7
- 4.0 -
-
Rumbia/Sagu Sago
-
- - - -
- -
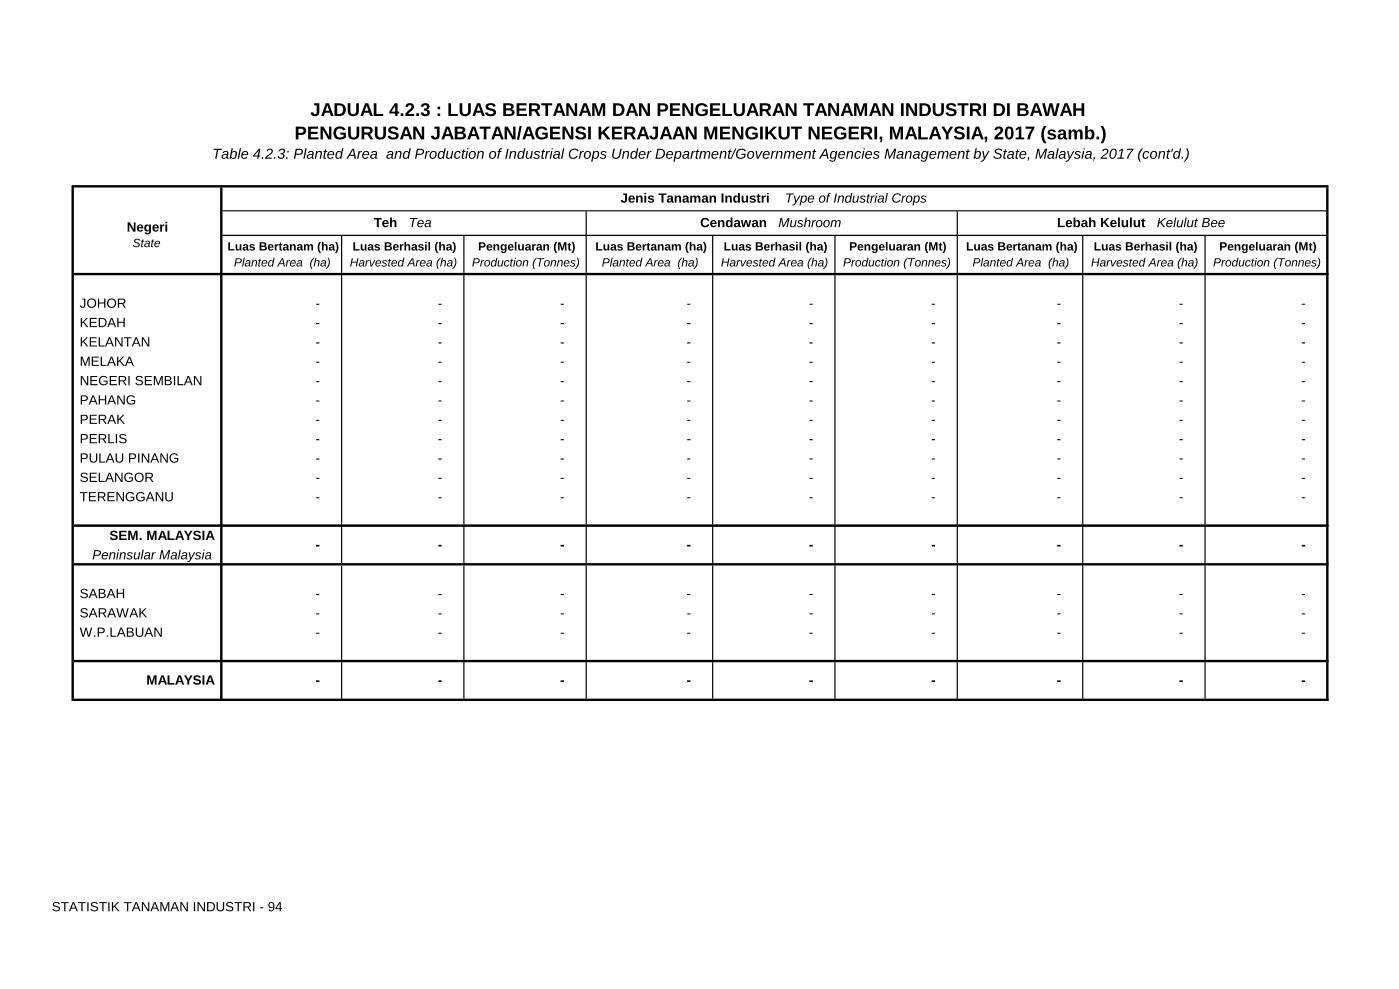
STATISTIK TANAMAN INDUSTRI - 94
Luas Bertanam (ha) Luas Berhasil (ha) Pengeluaran (Mt) Luas Bertanam (ha) Luas Berhasil (ha) Pengeluaran (Mt) Luas Bertanam (ha) Luas Berhasil (ha) Pengeluaran (Mt) Planted Area (ha) Harvested Area (ha) Production (Tonnes) Planted Area (ha) Harvested Area (ha) Production (Tonnes) Planted Area (ha) Harvested Area (ha) Production (Tonnes)
JOHOR - - - - - - - - - KEDAH - - - - - - - - - KELANTAN - - - - - - - - - MELAKA - - - - - - - - - NEGERI SEMBILAN - - - - - - - - - PAHANG - - - - - - - - - PERAK - - - - - - - - - PERLIS - - - - - - - - - PULAU PINANG - - - - - - - - - SELANGOR - - - - - - - - - TERENGGANU - - - - - - - - -
SEM. MALAYSIAPeninsular Malaysia
SABAH - - - - - - - - - SARAWAK - - - - - - - - - W.P.LABUAN - - - - - - - - -
State
- - - -
MALAYSIA - -
- -
- - - - - -
- - -
-
JADUAL 4.2.3 : LUAS BERTANAM DAN PENGELUARAN TANAMAN INDUSTRI DI BAWAH PENGURUSAN JABATAN/AGENSI KERAJAAN MENGIKUT NEGERI, MALAYSIA, 2017 (samb.)
Table 4.2.3: Planted Area and Production of Industrial Crops Under Department/Government Agencies Management by State, Malaysia, 2017 (cont'd.)
Negeri
Jenis Tanaman Industri Type of Industrial Crops
Teh Tea Cendawan Mushroom Lebah Kelulut Kelulut Bee
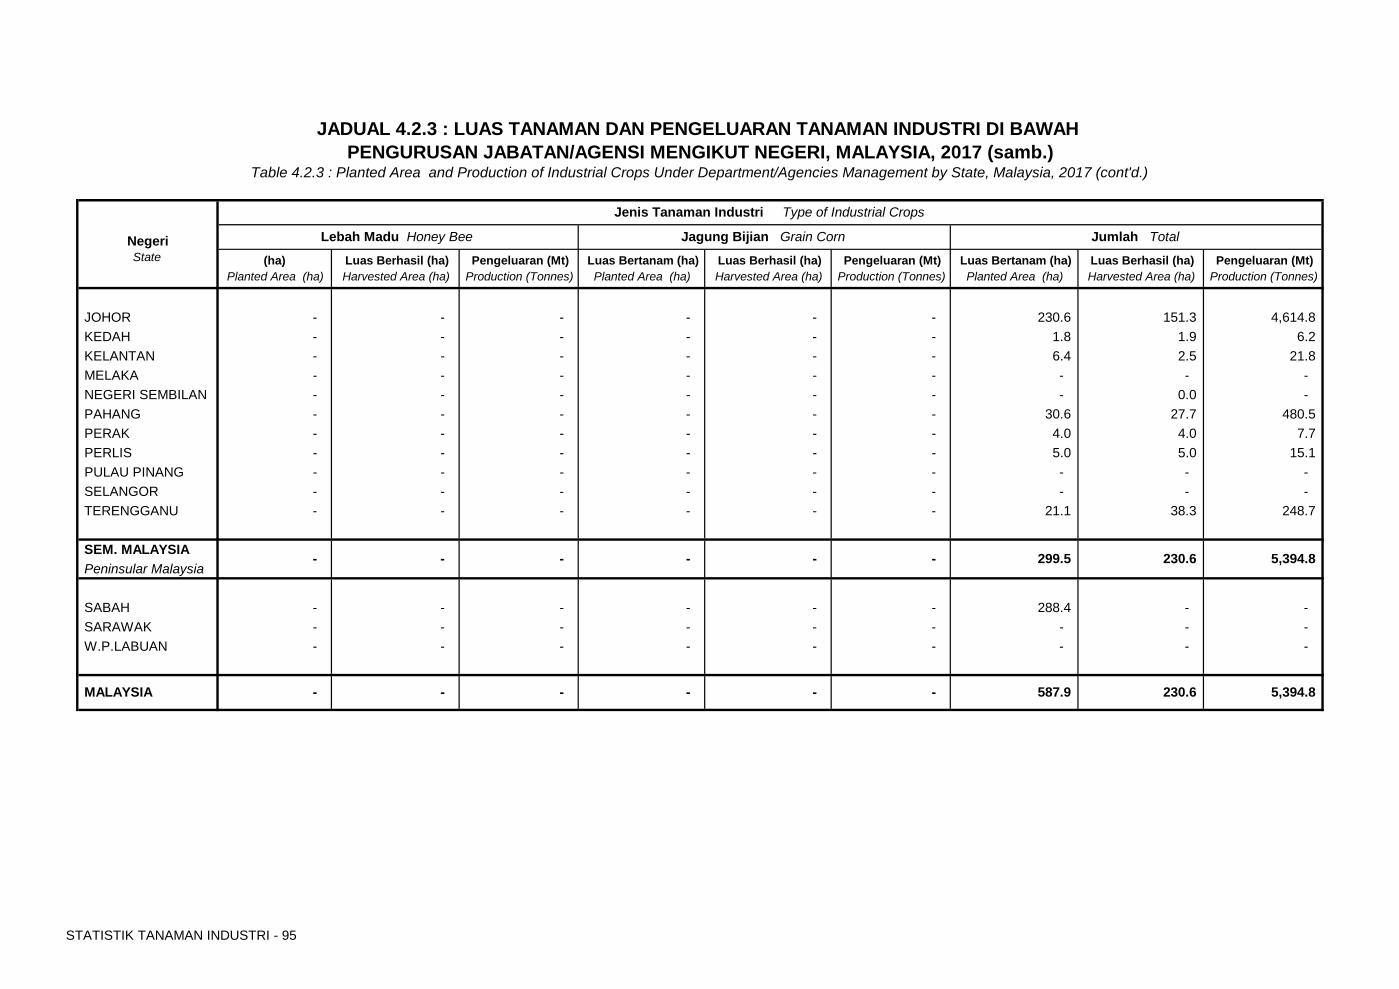
STATISTIK TANAMAN INDUSTRI - 95
(ha) Luas Berhasil (ha) Pengeluaran (Mt) Luas Bertanam (ha) Luas Berhasil (ha) Pengeluaran (Mt) Luas Bertanam (ha) Luas Berhasil (ha) Pengeluaran (Mt)
Planted Area (ha) Harvested Area (ha) Production (Tonnes) Planted Area (ha) Harvested Area (ha) Production (Tonnes) Planted Area (ha) Harvested Area (ha) Production (Tonnes)
JOHOR - - - - - - 230.6 151.3 4,614.8 KEDAH - - - - - - 1.8 1.9 6.2 KELANTAN - - - - - - 6.4 2.5 21.8 MELAKA - - - - - - - - - NEGERI SEMBILAN - - - - - - - 0.0 - PAHANG - - - - - - 30.6 27.7 480.5 PERAK - - - - - - 4.0 4.0 7.7 PERLIS - - - - - - 5.0 5.0 15.1 PULAU PINANG - - - - - - - - - SELANGOR - - - - - - - - - TERENGGANU - - - - - - 21.1 38.3 248.7
SEM. MALAYSIAPeninsular Malaysia
SABAH - - - - - - 288.4 - - SARAWAK - - - - - - - - - W.P.LABUAN - - - - - - - - -
JADUAL 4.2.3 : LUAS TANAMAN DAN PENGELUARAN TANAMAN INDUSTRI DI BAWAH PENGURUSAN JABATAN/AGENSI MENGIKUT NEGERI, MALAYSIA, 2017 (samb.)
Table 4.2.3 : Planted Area and Production of Industrial Crops Under Department/Agencies Management by State, Malaysia, 2017 (cont'd.)
NegeriState
Jenis Tanaman Industri Type of Industrial Crops
Jumlah TotalLebah Madu Honey Bee Jagung Bijian Grain Corn
- - - -
MALAYSIA - 5,394.8 230.6
- - 299.5
- - 587.9
230.6 5,394.8
- - -

Muka surat ini sengaja dibiarkan kosong
SEKSYEN 5 Section 5
LUAS BERTANAM DAN PENGELUARAN TANAMAN INDUSTRI
MENGIKUT TANAMAN, JENIS PENGURUSAN DAN NEGERI, MALAYSIA, 2017
Planted Area and Production of Industrial Crops by Crops, Type of
Management and State, Malaysia, 2017
KELAPA
COCONUT
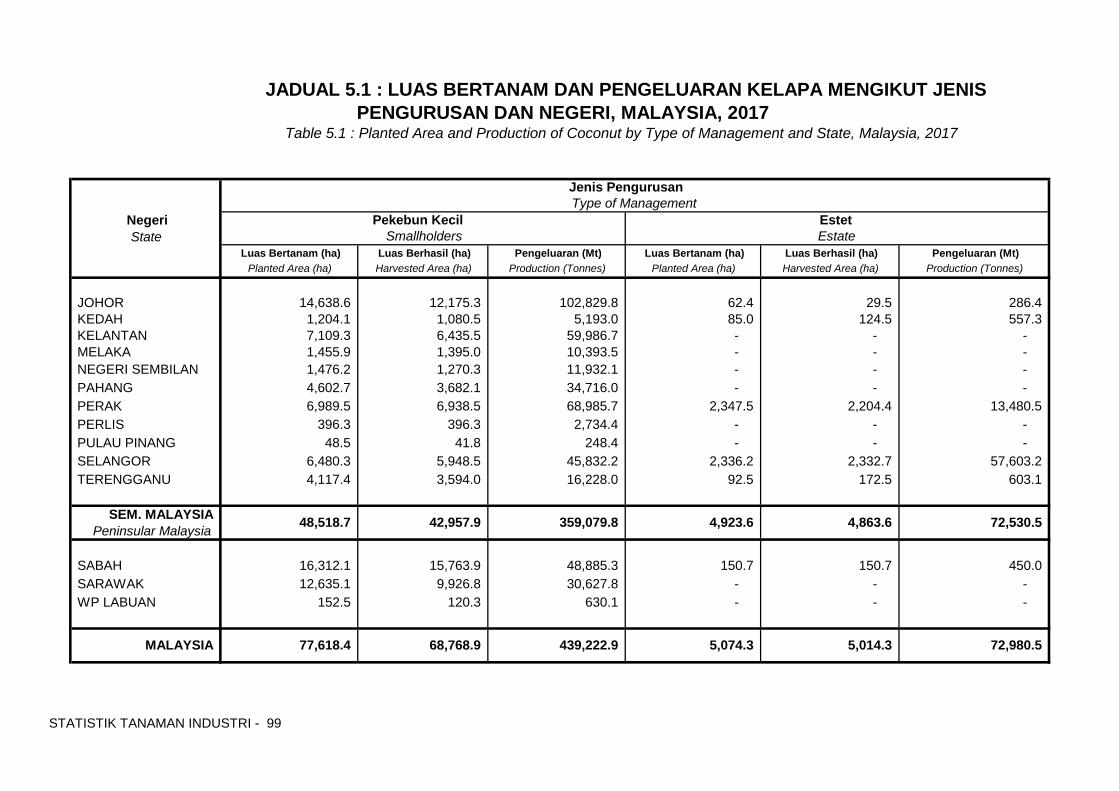
STATISTIK TANAMAN INDUSTRI - 99
State Luas Bertanam (ha) Luas Berhasil (ha) Pengeluaran (Mt) Luas Bertanam (ha) Luas Berhasil (ha) Pengeluaran (Mt)
Planted Area (ha) Harvested Area (ha) Production (Tonnes) Planted Area (ha) Harvested Area (ha) Production (Tonnes)
JOHOR 14,638.6 12,175.3 102,829.8 62.4 29.5 286.4 KEDAH 1,204.1 1,080.5 5,193.0 85.0 124.5 557.3 KELANTAN 7,109.3 6,435.5 59,986.7 - - - MELAKA 1,455.9 1,395.0 10,393.5 - - - NEGERI SEMBILAN 1,476.2 1,270.3 11,932.1 - - - PAHANG 4,602.7 3,682.1 34,716.0 - - - PERAK 6,989.5 6,938.5 68,985.7 2,347.5 2,204.4 13,480.5 PERLIS 396.3 396.3 2,734.4 - - - PULAU PINANG 48.5 41.8 248.4 - - - SELANGOR 6,480.3 5,948.5 45,832.2 2,336.2 2,332.7 57,603.2 TERENGGANU 4,117.4 3,594.0 16,228.0 92.5 172.5 603.1
SEM. MALAYSIAPeninsular Malaysia
SABAH 16,312.1 15,763.9 48,885.3 150.7 150.7 450.0 SARAWAK 12,635.1 9,926.8 30,627.8 - - - WP LABUAN 152.5 120.3 630.1 - - -
5,014.3 MALAYSIA 77,618.4 68,768.9 5,074.3 439,222.9 72,980.5
72,530.5
Smallholders Estate
359,079.8 48,518.7 4,923.6 42,957.9 4,863.6
JADUAL 5.1 : LUAS BERTANAM DAN PENGELUARAN KELAPA MENGIKUT JENIS PENGURUSAN DAN NEGERI, MALAYSIA, 2017
Table 5.1 : Planted Area and Production of Coconut by Type of Management and State, Malaysia, 2017
Negeri
Jenis Pengurusan Type of Management
Pekebun Kecil Estet
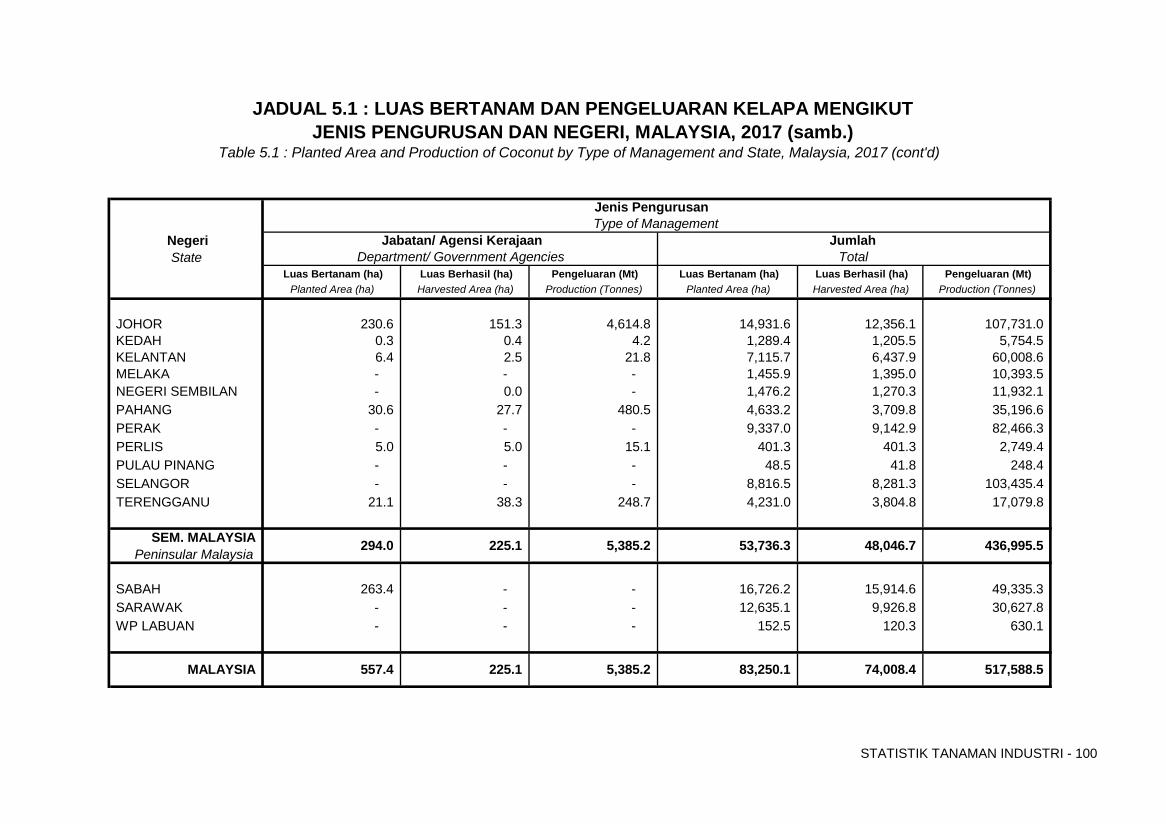
STATISTIK TANAMAN INDUSTRI - 100
State Luas Bertanam (ha) Luas Berhasil (ha) Pengeluaran (Mt) Luas Bertanam (ha) Luas Berhasil (ha) Pengeluaran (Mt)
Planted Area (ha) Harvested Area (ha) Production (Tonnes) Planted Area (ha) Harvested Area (ha) Production (Tonnes)
JOHOR 230.6 151.3 4,614.8 14,931.6 12,356.1 107,731.0 KEDAH 0.3 0.4 4.2 1,289.4 1,205.5 5,754.5 KELANTAN 6.4 2.5 21.8 7,115.7 6,437.9 60,008.6 MELAKA - - - 1,455.9 1,395.0 10,393.5 NEGERI SEMBILAN - 0.0 - 1,476.2 1,270.3 11,932.1 PAHANG 30.6 27.7 480.5 4,633.2 3,709.8 35,196.6 PERAK - - - 9,337.0 9,142.9 82,466.3 PERLIS 5.0 5.0 15.1 401.3 401.3 2,749.4 PULAU PINANG - - - 48.5 41.8 248.4 SELANGOR - - - 8,816.5 8,281.3 103,435.4 TERENGGANU 21.1 38.3 248.7 4,231.0 3,804.8 17,079.8
SEM. MALAYSIAPeninsular Malaysia
SABAH 263.4 - - 16,726.2 15,914.6 49,335.3 SARAWAK - - - 12,635.1 9,926.8 30,627.8 WP LABUAN - - - 152.5 120.3 630.1
JADUAL 5.1 : LUAS BERTANAM DAN PENGELUARAN KELAPA MENGIKUT JENIS PENGURUSAN DAN NEGERI, MALAYSIA, 2017 (samb.)
Table 5.1 : Planted Area and Production of Coconut by Type of Management and State, Malaysia, 2017 (cont'd)
436,995.5 53,736.3 225.1 294.0
Total
Type of ManagementJumlah Jabatan/ Agensi Kerajaan
MALAYSIA
Jenis Pengurusan
557.4 517,588.5 83,250.1 74,008.4
5,385.2 48,046.7
Department/ Government Agencies Negeri
5,385.2 225.1

Muka surat ini sengaja dibiarkan kosong
KOPI
COFFEE
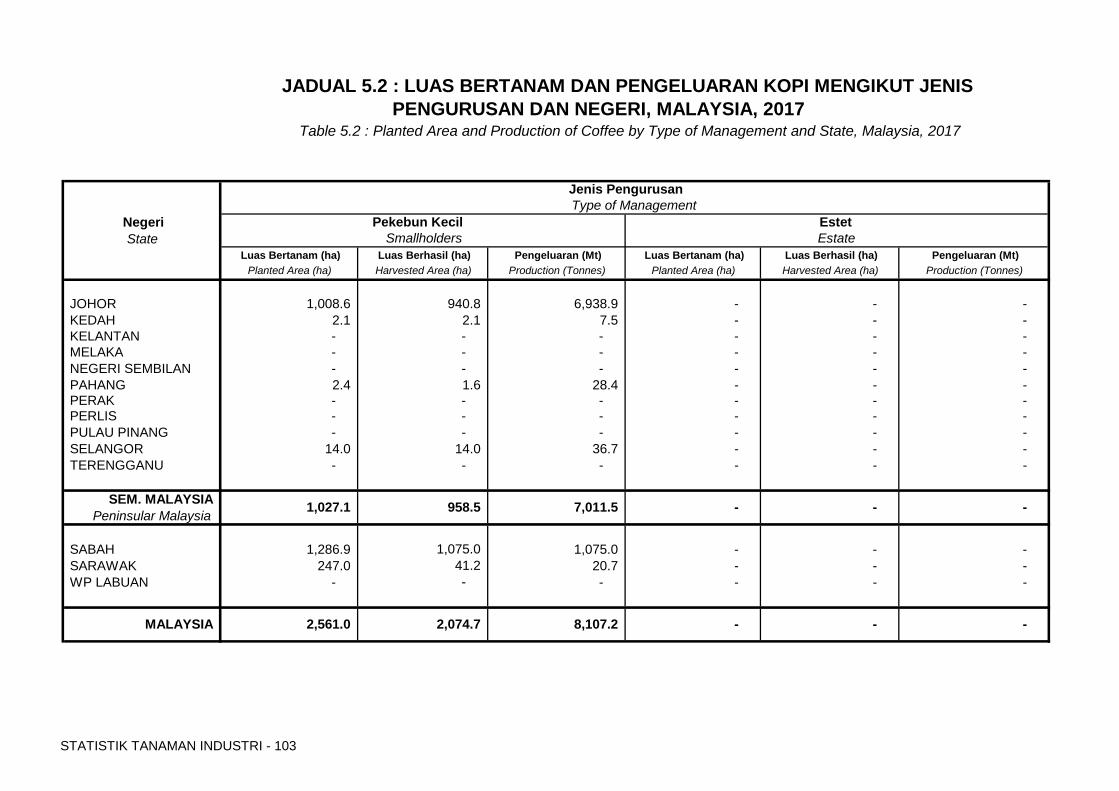
STATISTIK TANAMAN INDUSTRI - 103
State Luas Bertanam (ha) Luas Berhasil (ha) Pengeluaran (Mt) Luas Bertanam (ha) Luas Berhasil (ha) Pengeluaran (Mt)
Planted Area (ha) Harvested Area (ha) Production (Tonnes) Planted Area (ha) Harvested Area (ha) Production (Tonnes)
JOHOR 1,008.6 940.8 6,938.9 - - - KEDAH 2.1 2.1 7.5 - - - KELANTAN - - - - - - MELAKA - - - - - - NEGERI SEMBILAN - - - - - - PAHANG 2.4 1.6 28.4 - - - PERAK - - - - - - PERLIS - - - - - - PULAU PINANG - - - - - - SELANGOR 14.0 14.0 36.7 - - - TERENGGANU - - - - - -
SEM. MALAYSIAPeninsular Malaysia
SABAH 1,286.9 1,075.0 1,075.0 - - - SARAWAK 247.0 41.2 20.7 - - - WP LABUAN - - - - - -
JADUAL 5.2 : LUAS BERTANAM DAN PENGELUARAN KOPI MENGIKUT JENIS
-
Pekebun Kecil Negeri Estet
PENGURUSAN DAN NEGERI, MALAYSIA, 2017
Jenis Pengurusan
Table 5.2 : Planted Area and Production of Coffee by Type of Management and State, Malaysia, 2017
Type of Management
2,561.0
Smallholders Estate
MALAYSIA
- 1,027.1 -
2,074.7
958.5 7,011.5
- -
-
8,107.2
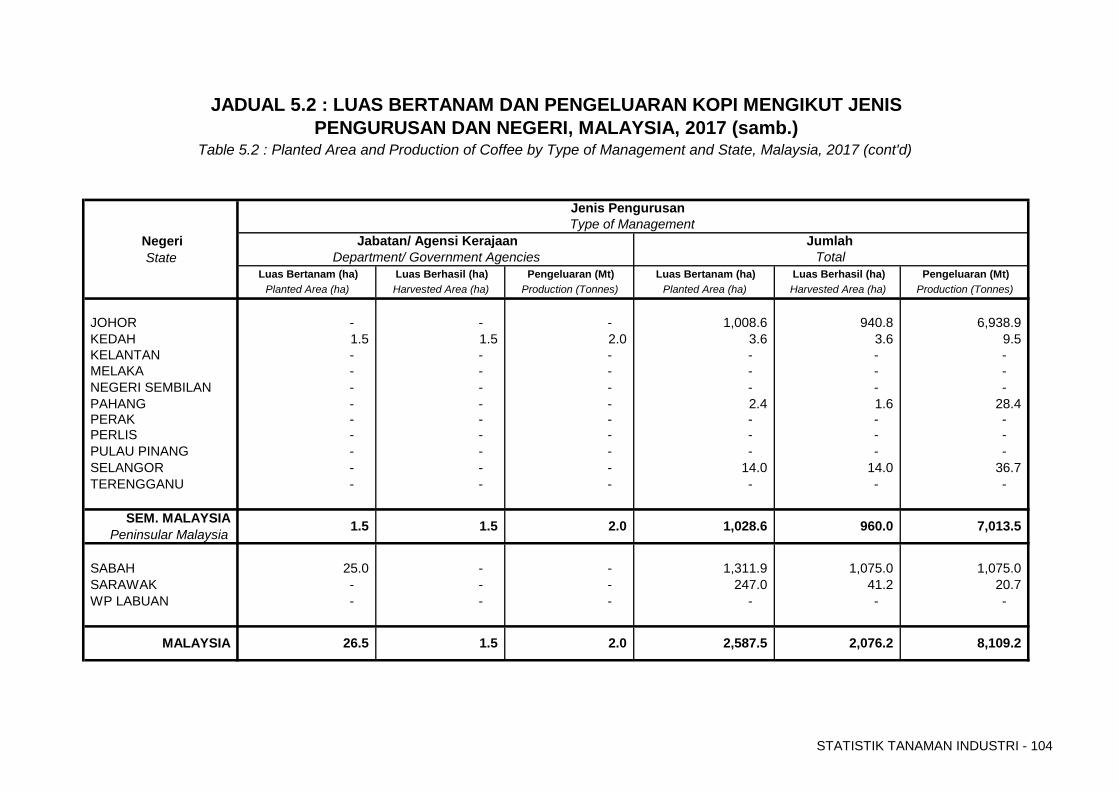
STATISTIK TANAMAN INDUSTRI - 104
State Luas Bertanam (ha) Luas Berhasil (ha) Pengeluaran (Mt) Luas Bertanam (ha) Luas Berhasil (ha) Pengeluaran (Mt)
Planted Area (ha) Harvested Area (ha) Production (Tonnes) Planted Area (ha) Harvested Area (ha) Production (Tonnes)
JOHOR - - - 1,008.6 940.8 6,938.9 KEDAH 1.5 1.5 2.0 3.6 3.6 9.5 KELANTAN - - - - - - MELAKA - - - - - - NEGERI SEMBILAN - - - - - - PAHANG - - - 2.4 1.6 28.4 PERAK - - - - - - PERLIS - - - - - - PULAU PINANG - - - - - - SELANGOR - - - 14.0 14.0 36.7 TERENGGANU - - - - - -
SEM. MALAYSIAPeninsular Malaysia
SABAH 25.0 - - 1,311.9 1,075.0 1,075.0 SARAWAK - - - 247.0 41.2 20.7 WP LABUAN - - - - - -
MALAYSIA
1.5
Jumlah
1.5
Department/ Government Agencies Jabatan/ Agensi Kerajaan
Jenis Pengurusan
Total Negeri
Type of Management
JADUAL 5.2 : LUAS BERTANAM DAN PENGELUARAN KOPI MENGIKUT JENIS
Table 5.2 : Planted Area and Production of Coffee by Type of Management and State, Malaysia, 2017 (cont'd)PENGURUSAN DAN NEGERI, MALAYSIA, 2017 (samb.)
1.5
2.0
26.5
1,028.6
2,587.5
960.0
2.0 8,109.2 2,076.2
7,013.5

Muka surat ini sengaja dibiarkan kosong
NIPAH
NIPA PALM
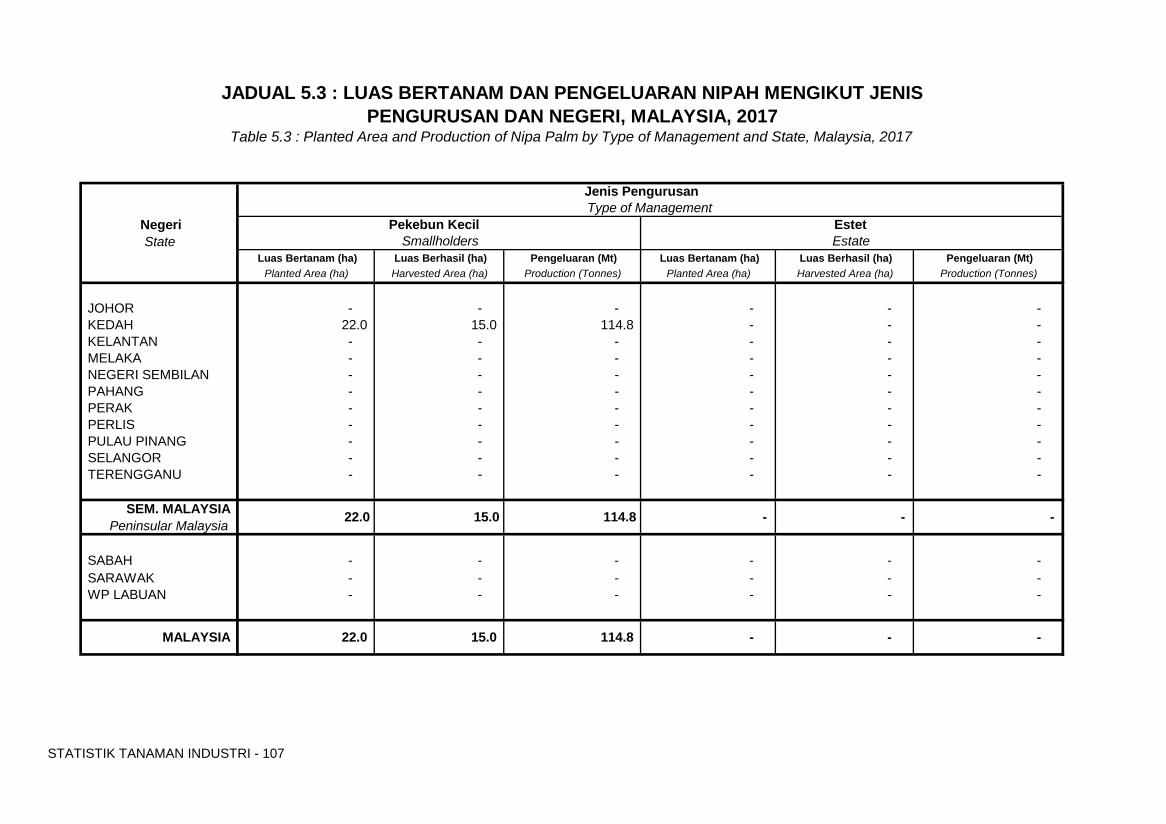
STATISTIK TANAMAN INDUSTRI - 107
State Luas Bertanam (ha) Luas Berhasil (ha) Pengeluaran (Mt) Luas Bertanam (ha) Luas Berhasil (ha) Pengeluaran (Mt)
Planted Area (ha) Harvested Area (ha) Production (Tonnes) Planted Area (ha) Harvested Area (ha) Production (Tonnes)
JOHOR - - - - - - KEDAH 22.0 15.0 114.8 - - - KELANTAN - - - - - - MELAKA - - - - - - NEGERI SEMBILAN - - - - - - PAHANG - - - - - - PERAK - - - - - - PERLIS - - - - - - PULAU PINANG - - - - - - SELANGOR - - - - - - TERENGGANU - - - - - -
SEM. MALAYSIAPeninsular Malaysia
SABAH - - - - - - SARAWAK - - - - - - WP LABUAN - - - - - -
22.0
114.8 - - - 22.0
MALAYSIA - 114.8 -
Estate
15.0
15.0
-
Smallholders
Table 5.3 : Planted Area and Production of Nipa Palm by Type of Management and State, Malaysia, 2017PENGURUSAN DAN NEGERI, MALAYSIA, 2017
JADUAL 5.3 : LUAS BERTANAM DAN PENGELUARAN NIPAH MENGIKUT JENIS
Pekebun Kecil Negeri Estet Type of ManagementJenis Pengurusan
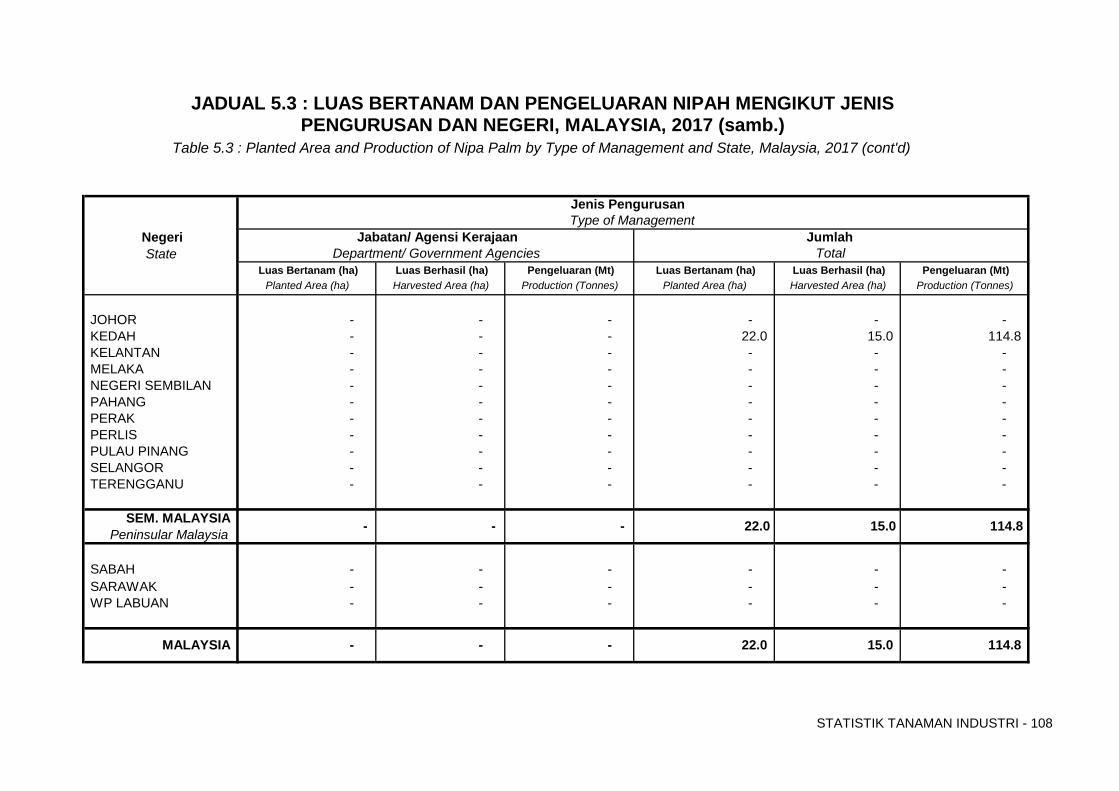
STATISTIK TANAMAN INDUSTRI - 108
State Luas Bertanam (ha) Luas Berhasil (ha) Pengeluaran (Mt) Luas Bertanam (ha) Luas Berhasil (ha) Pengeluaran (Mt)
Planted Area (ha) Harvested Area (ha) Production (Tonnes) Planted Area (ha) Harvested Area (ha) Production (Tonnes)
JOHOR - - - - - - KEDAH - - - 22.0 15.0 114.8 KELANTAN - - - - - - MELAKA - - - - - - NEGERI SEMBILAN - - - - - - PAHANG - - - - - - PERAK - - - - - - PERLIS - - - - - - PULAU PINANG - - - - - - SELANGOR - - - - - - TERENGGANU - - - - - -
SEM. MALAYSIAPeninsular Malaysia
SABAH - - - - - - SARAWAK - - - - - - WP LABUAN - - - - - -
JADUAL 5.3 : LUAS BERTANAM DAN PENGELUARAN NIPAH MENGIKUT JENISPENGURUSAN DAN NEGERI, MALAYSIA, 2017 (samb.)
Table 5.3 : Planted Area and Production of Nipa Palm by Type of Management and State, Malaysia, 2017 (cont'd)
Jumlah Department/ Government Agencies
Negeri Type of Management
Total
Jenis Pengurusan
Jabatan/ Agensi Kerajaan
15.0
MALAYSIA
-
-
114.8 -
- - 22.0 114.8 15.0
- 22.0

Muka surat ini sengaja dibiarkan kosong
PINANG
ARECA NUT
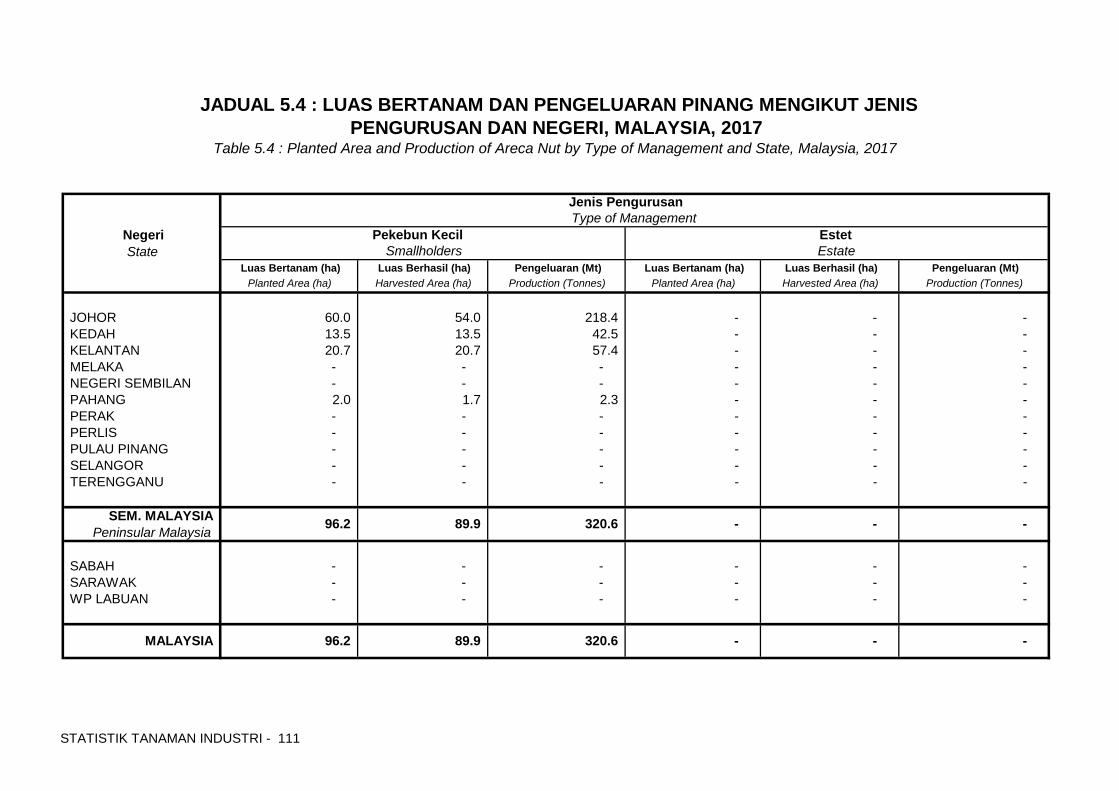
STATISTIK TANAMAN INDUSTRI - 111
State Luas Bertanam (ha) Luas Berhasil (ha) Pengeluaran (Mt) Luas Bertanam (ha) Luas Berhasil (ha) Pengeluaran (Mt)
Planted Area (ha) Harvested Area (ha) Production (Tonnes) Planted Area (ha) Harvested Area (ha) Production (Tonnes)
JOHOR 60.0 54.0 218.4 - - - KEDAH 13.5 13.5 42.5 - - - KELANTAN 20.7 20.7 57.4 - - - MELAKA - - - - - - NEGERI SEMBILAN - - - - - - PAHANG 2.0 1.7 2.3 - - - PERAK - - - - - - PERLIS - - - - - - PULAU PINANG - - - - - - SELANGOR - - - - - - TERENGGANU - - - - - -
SEM. MALAYSIAPeninsular Malaysia
SABAH - - - - - - SARAWAK - - - - - - WP LABUAN - - - - - -
Estate Smallholders
-
- -
JADUAL 5.4 : LUAS BERTANAM DAN PENGELUARAN PINANG MENGIKUT JENISPENGURUSAN DAN NEGERI, MALAYSIA, 2017
Table 5.4 : Planted Area and Production of Areca Nut by Type of Management and State, Malaysia, 2017
Negeri
Jenis Pengurusan Type of Management
Pekebun Kecil Estet
MALAYSIA -
320.6 89.9 96.2
-
-
96.2 89.9 320.6
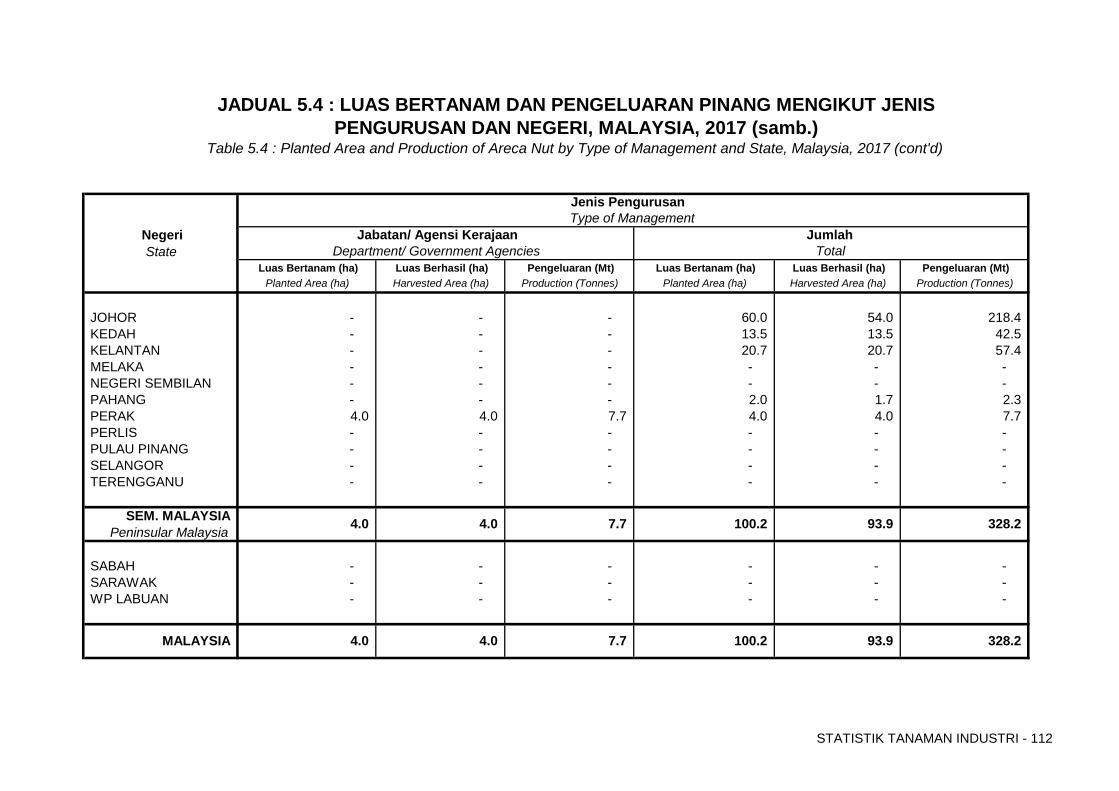
STATISTIK TANAMAN INDUSTRI - 112
State Luas Bertanam (ha) Luas Berhasil (ha) Pengeluaran (Mt) Luas Bertanam (ha) Luas Berhasil (ha) Pengeluaran (Mt)
Planted Area (ha) Harvested Area (ha) Production (Tonnes) Planted Area (ha) Harvested Area (ha) Production (Tonnes)
JOHOR - - - 60.0 54.0 218.4 KEDAH - - - 13.5 13.5 42.5 KELANTAN - - - 20.7 20.7 57.4 MELAKA - - - - - - NEGERI SEMBILAN - - - - - - PAHANG - - - 2.0 1.7 2.3 PERAK 4.0 4.0 7.7 4.0 4.0 7.7 PERLIS - - - - - - PULAU PINANG - - - - - - SELANGOR - - - - - - TERENGGANU - - - - - -
SEM. MALAYSIAPeninsular Malaysia
SABAH - - - - - - SARAWAK - - - - - - WP LABUAN - - - - - -
93.9
Jenis Pengurusan
Jumlah
100.2
Total
328.2
93.9 328.2 100.2
Department/ Government Agencies
JADUAL 5.4 : LUAS BERTANAM DAN PENGELUARAN PINANG MENGIKUT JENISPENGURUSAN DAN NEGERI, MALAYSIA, 2017 (samb.)
Negeri
Table 5.4 : Planted Area and Production of Areca Nut by Type of Management and State, Malaysia, 2017 (cont'd)
Type of Management Jabatan/ Agensi Kerajaan
MALAYSIA
4.0
7.7
4.0
4.0
7.7
4.0

Muka surat ini sengaja dibiarkan kosong

ROSELLE
ROSELLE
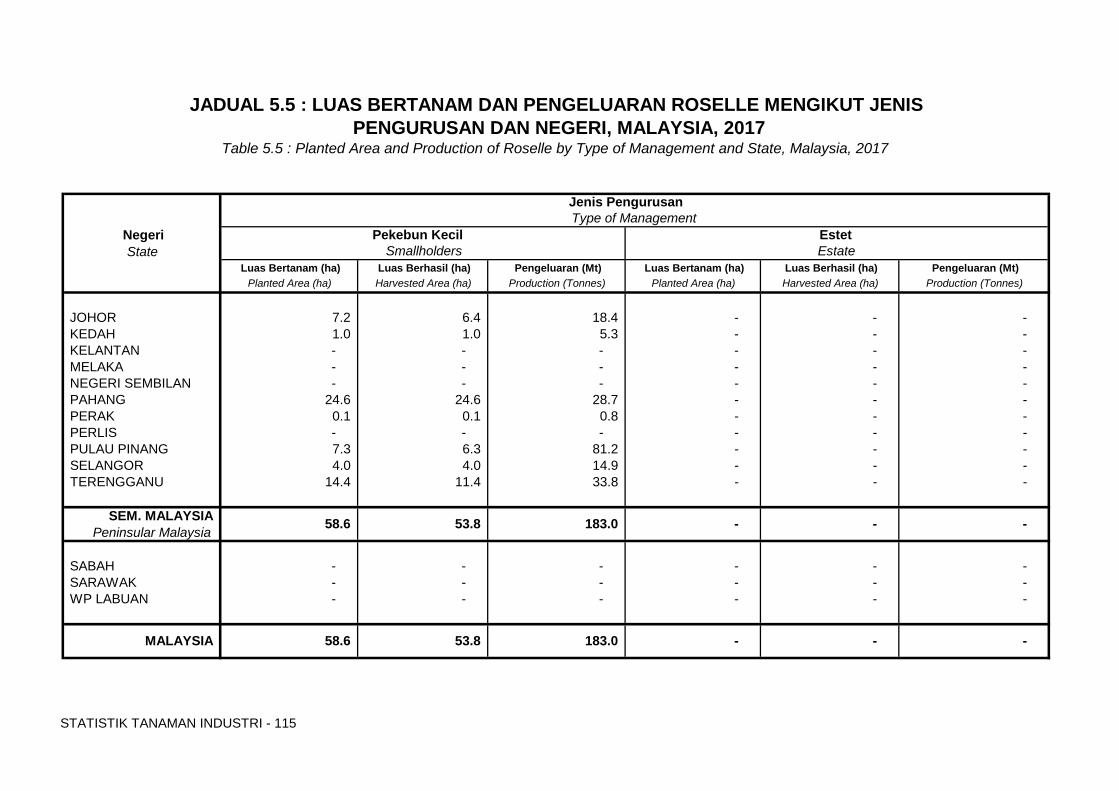
STATISTIK TANAMAN INDUSTRI - 115
State Luas Bertanam (ha) Luas Berhasil (ha) Pengeluaran (Mt) Luas Bertanam (ha) Luas Berhasil (ha) Pengeluaran (Mt)
Planted Area (ha) Harvested Area (ha) Production (Tonnes) Planted Area (ha) Harvested Area (ha) Production (Tonnes)
JOHOR 7.2 6.4 18.4 - - - KEDAH 1.0 1.0 5.3 - - - KELANTAN - - - - - - MELAKA - - - - - - NEGERI SEMBILAN - - - - - - PAHANG 24.6 24.6 28.7 - - - PERAK 0.1 0.1 0.8 - - - PERLIS - - - - - - PULAU PINANG 7.3 6.3 81.2 - - - SELANGOR 4.0 4.0 14.9 - - - TERENGGANU 14.4 11.4 33.8 - - -
SEM. MALAYSIAPeninsular Malaysia
SABAH - - - - - - SARAWAK - - - - - - WP LABUAN - - - - - -
JADUAL 5.5 : LUAS BERTANAM DAN PENGELUARAN ROSELLE MENGIKUT JENIS PENGURUSAN DAN NEGERI, MALAYSIA, 2017
Table 5.5 : Planted Area and Production of Roselle by Type of Management and State, Malaysia, 2017
Type of ManagementJenis Pengurusan
Negeri Pekebun Kecil Estet
MALAYSIA 58.6 -
Smallholders Estate
-
-
53.8 183.0 - 58.6
53.8 183.0 -
-
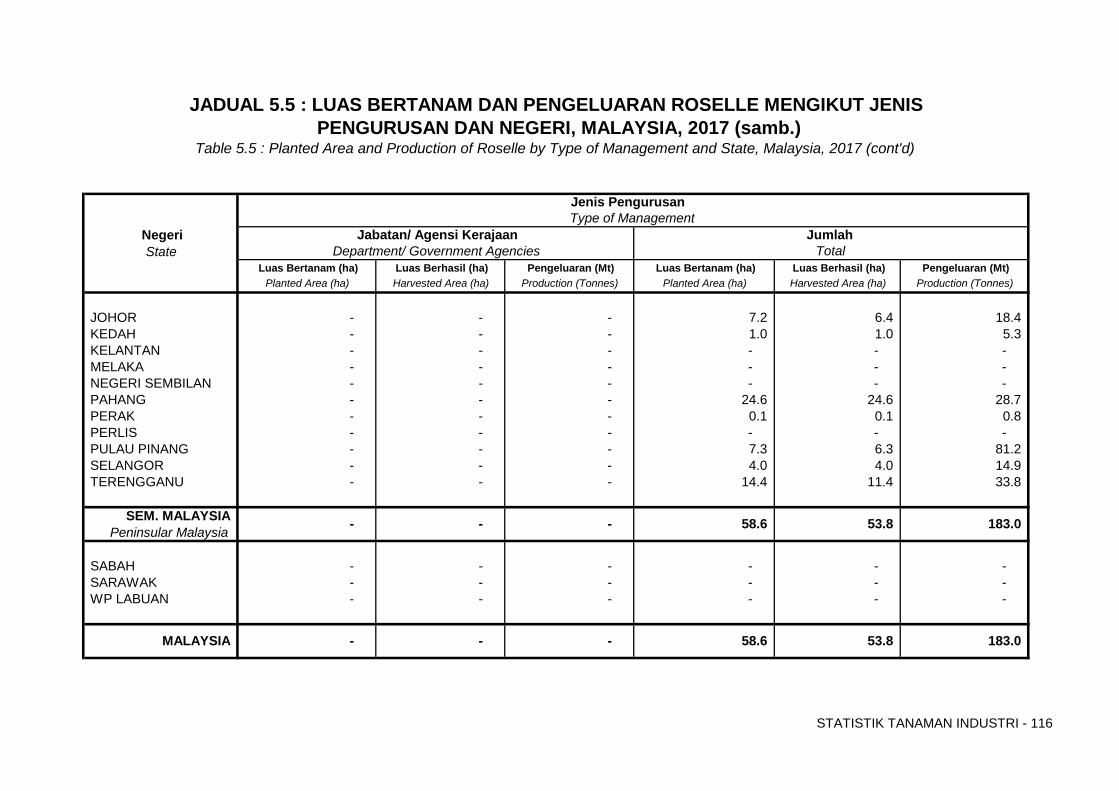
STATISTIK TANAMAN INDUSTRI - 116
State Luas Bertanam (ha) Luas Berhasil (ha) Pengeluaran (Mt) Luas Bertanam (ha) Luas Berhasil (ha) Pengeluaran (Mt)
Planted Area (ha) Harvested Area (ha) Production (Tonnes) Planted Area (ha) Harvested Area (ha) Production (Tonnes)
JOHOR - - - 7.2 6.4 18.4 KEDAH - - - 1.0 1.0 5.3 KELANTAN - - - - - - MELAKA - - - - - - NEGERI SEMBILAN - - - - - - PAHANG - - - 24.6 24.6 28.7 PERAK - - - 0.1 0.1 0.8 PERLIS - - - - - - PULAU PINANG - - - 7.3 6.3 81.2 SELANGOR - - - 4.0 4.0 14.9 TERENGGANU - - - 14.4 11.4 33.8
SEM. MALAYSIAPeninsular Malaysia
SABAH - - - - - - SARAWAK - - - - - - WP LABUAN - - - - - -
JADUAL 5.5 : LUAS BERTANAM DAN PENGELUARAN ROSELLE MENGIKUT JENIS
Table 5.5 : Planted Area and Production of Roselle by Type of Management and State, Malaysia, 2017 (cont'd) PENGURUSAN DAN NEGERI, MALAYSIA, 2017 (samb.)
- 53.8 58.6
Jumlah Negeri Department/ Government Agencies Total
Type of ManagementJenis Pengurusan
Jabatan/ Agensi Kerajaan
MALAYSIA 58.6 183.0 53.8
183.0 -
- - -
-

Muka surat ini sengaja dibiarkan kosong
RUMBIA/SAGU
SAGO
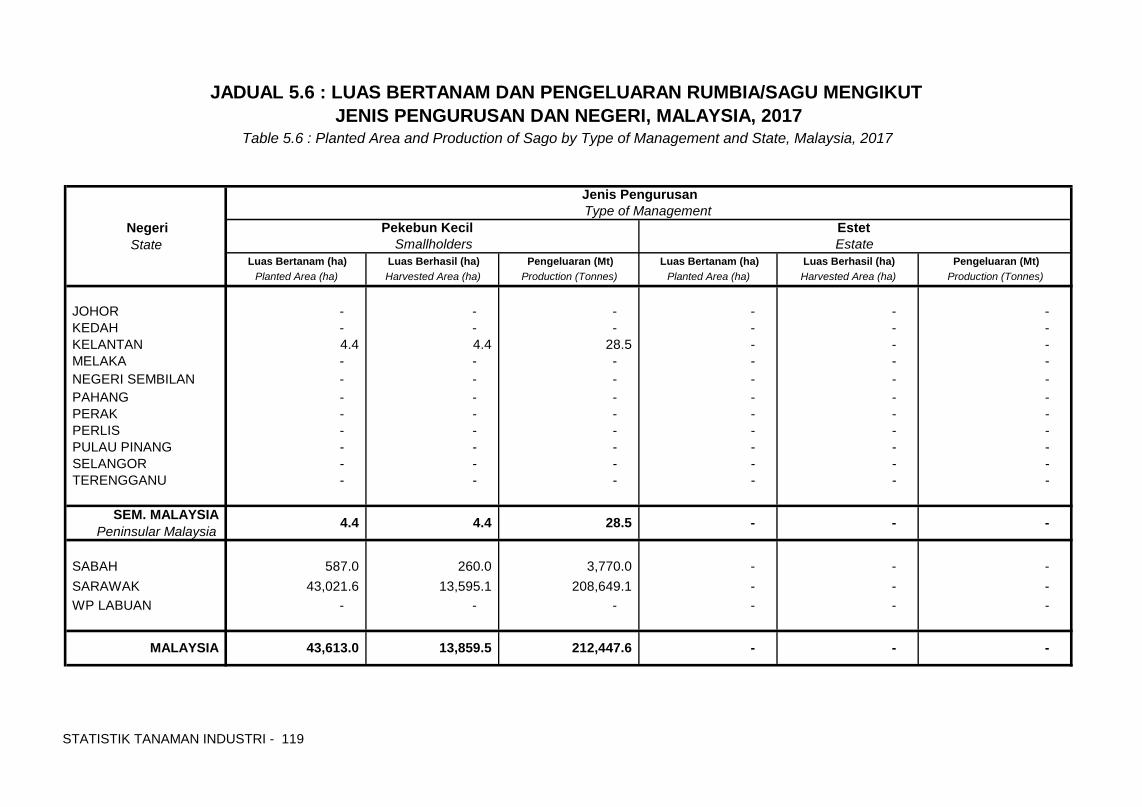
STATISTIK TANAMAN INDUSTRI - 119
State Luas Bertanam (ha) Luas Berhasil (ha) Pengeluaran (Mt) Luas Bertanam (ha) Luas Berhasil (ha) Pengeluaran (Mt)
Planted Area (ha) Harvested Area (ha) Production (Tonnes) Planted Area (ha) Harvested Area (ha) Production (Tonnes)
JOHOR - - - - - - KEDAH - - - - - - KELANTAN 4.4 4.4 28.5 - - - MELAKA - - - - - - NEGERI SEMBILAN - - - - - - PAHANG - - - - - - PERAK - - - - - - PERLIS - - - - - - PULAU PINANG - - - - - - SELANGOR - - - - - - TERENGGANU - - - - - -
SEM. MALAYSIAPeninsular Malaysia
SABAH 587.0 260.0 3,770.0 - - - SARAWAK 43,021.6 13,595.1 208,649.1 - - - WP LABUAN - - - - - -
JADUAL 5.6 : LUAS BERTANAM DAN PENGELUARAN RUMBIA/SAGU MENGIKUT
Estate
Table 5.6 : Planted Area and Production of Sago by Type of Management and State, Malaysia, 2017
Jenis Pengurusan
Estet Negeri Pekebun Kecil
JENIS PENGURUSAN DAN NEGERI, MALAYSIA, 2017
Type of Management
Smallholders
- -
-
-
- 4.4 4.4 - 28.5
MALAYSIA 43,613.0 13,859.5 212,447.6
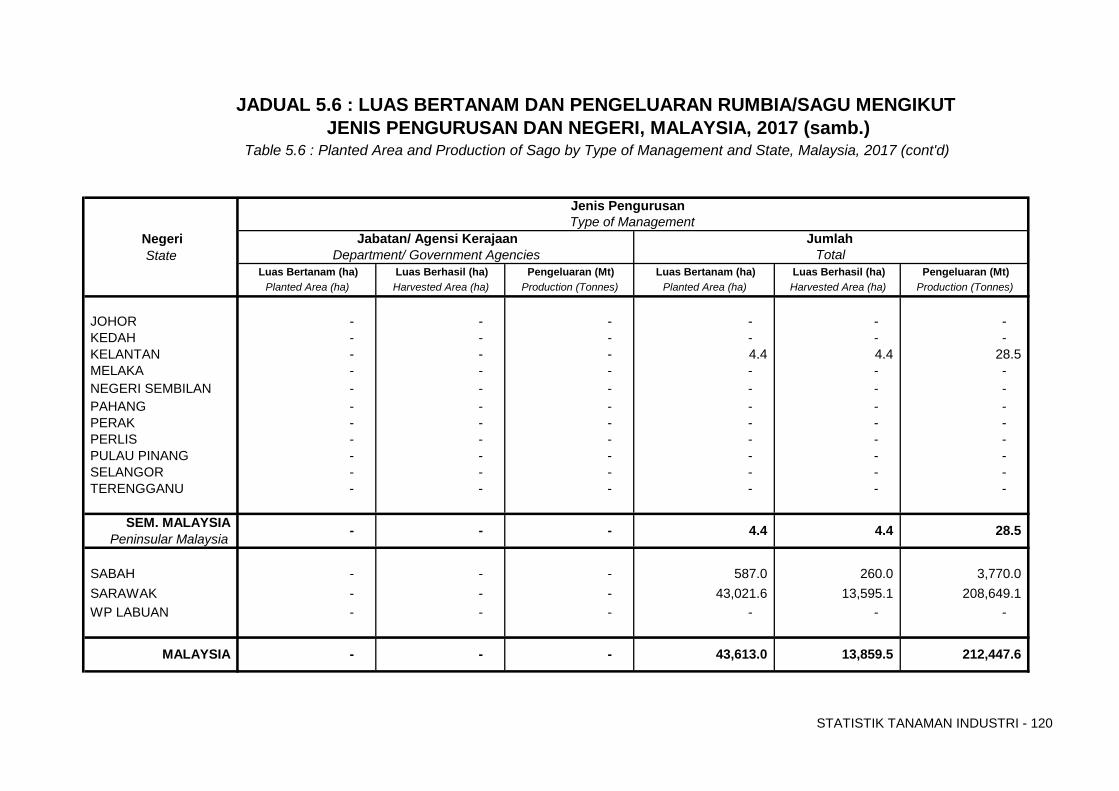
STATISTIK TANAMAN INDUSTRI - 120
State Luas Bertanam (ha) Luas Berhasil (ha) Pengeluaran (Mt) Luas Bertanam (ha) Luas Berhasil (ha) Pengeluaran (Mt)
Planted Area (ha) Harvested Area (ha) Production (Tonnes) Planted Area (ha) Harvested Area (ha) Production (Tonnes)
JOHOR - - - - - - KEDAH - - - - - - KELANTAN - - - 4.4 4.4 28.5 MELAKA - - - - - - NEGERI SEMBILAN - - - - - - PAHANG - - - - - - PERAK - - - - - - PERLIS - - - - - - PULAU PINANG - - - - - - SELANGOR - - - - - - TERENGGANU - - - - - -
SEM. MALAYSIAPeninsular Malaysia
SABAH - - - 587.0 260.0 3,770.0 SARAWAK - - - 43,021.6 13,595.1 208,649.1 WP LABUAN - - - - - -
JADUAL 5.6 : LUAS BERTANAM DAN PENGELUARAN RUMBIA/SAGU MENGIKUT
Table 5.6 : Planted Area and Production of Sago by Type of Management and State, Malaysia, 2017 (cont'd)
-
- 212,447.6 - - MALAYSIA 43,613.0 13,859.5
4.4
Department/ Government Agencies Total Negeri
28.5
JENIS PENGURUSAN DAN NEGERI, MALAYSIA, 2017 (samb.)
-
Jabatan/ Agensi Kerajaan Type of ManagementJenis Pengurusan
4.4
Jumlah
-

Muka surat ini sengaja dibiarkan kosong
TEH
TEA
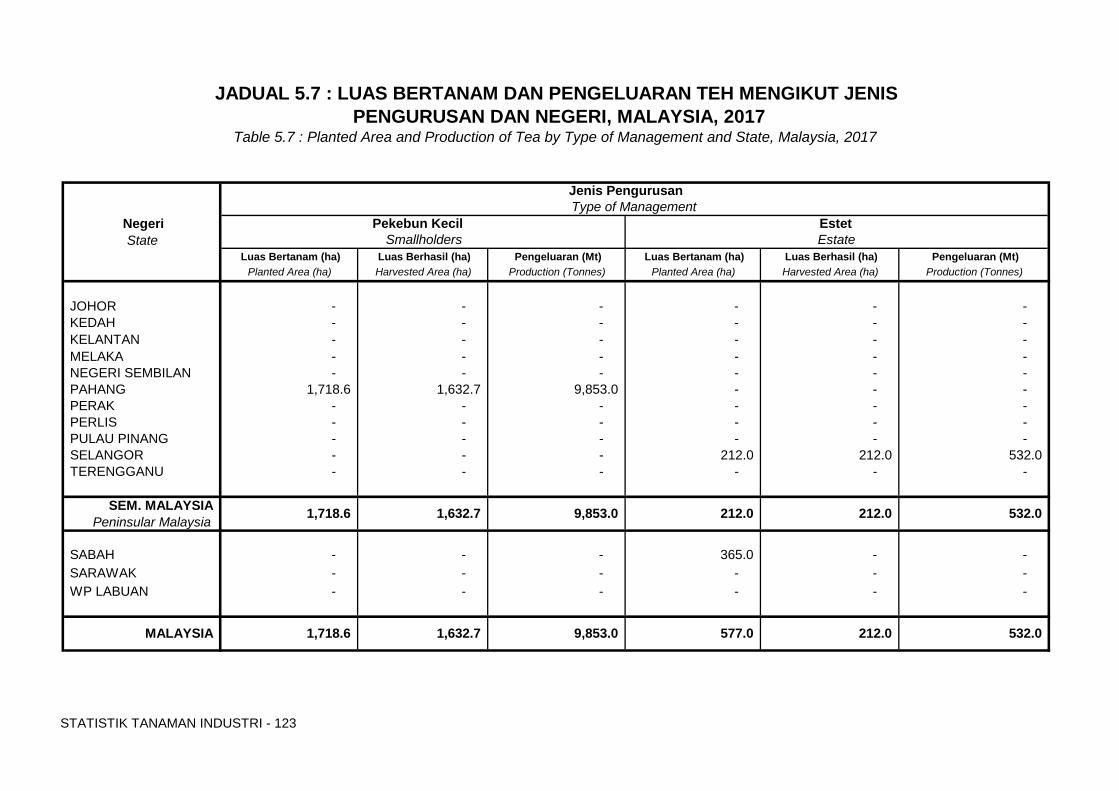
STATISTIK TANAMAN INDUSTRI - 123
State Luas Bertanam (ha) Luas Berhasil (ha) Pengeluaran (Mt) Luas Bertanam (ha) Luas Berhasil (ha) Pengeluaran (Mt)
Planted Area (ha) Harvested Area (ha) Production (Tonnes) Planted Area (ha) Harvested Area (ha) Production (Tonnes)
JOHOR - - - - - - KEDAH - - - - - - KELANTAN - - - - - - MELAKA - - - - - - NEGERI SEMBILAN - - - - - - PAHANG 1,718.6 1,632.7 9,853.0 - - - PERAK - - - - - - PERLIS - - - - - - PULAU PINANG - - - - - - SELANGOR - - - 212.0 212.0 532.0 TERENGGANU - - - - - -
SEM. MALAYSIAPeninsular Malaysia
SABAH - - - 365.0 - - SARAWAK - - - - - - WP LABUAN - - - - - -
1,632.7 9,853.0
MALAYSIA 1,718.6 1,632.7 9,853.0
1,718.6 212.0 212.0
532.0
532.0
577.0 212.0
JADUAL 5.7 : LUAS BERTANAM DAN PENGELUARAN TEH MENGIKUT JENIS PENGURUSAN DAN NEGERI, MALAYSIA, 2017
Smallholders EstatePekebun Kecil Estet Negeri
Table 5.7 : Planted Area and Production of Tea by Type of Management and State, Malaysia, 2017
Jenis Pengurusan Type of Management
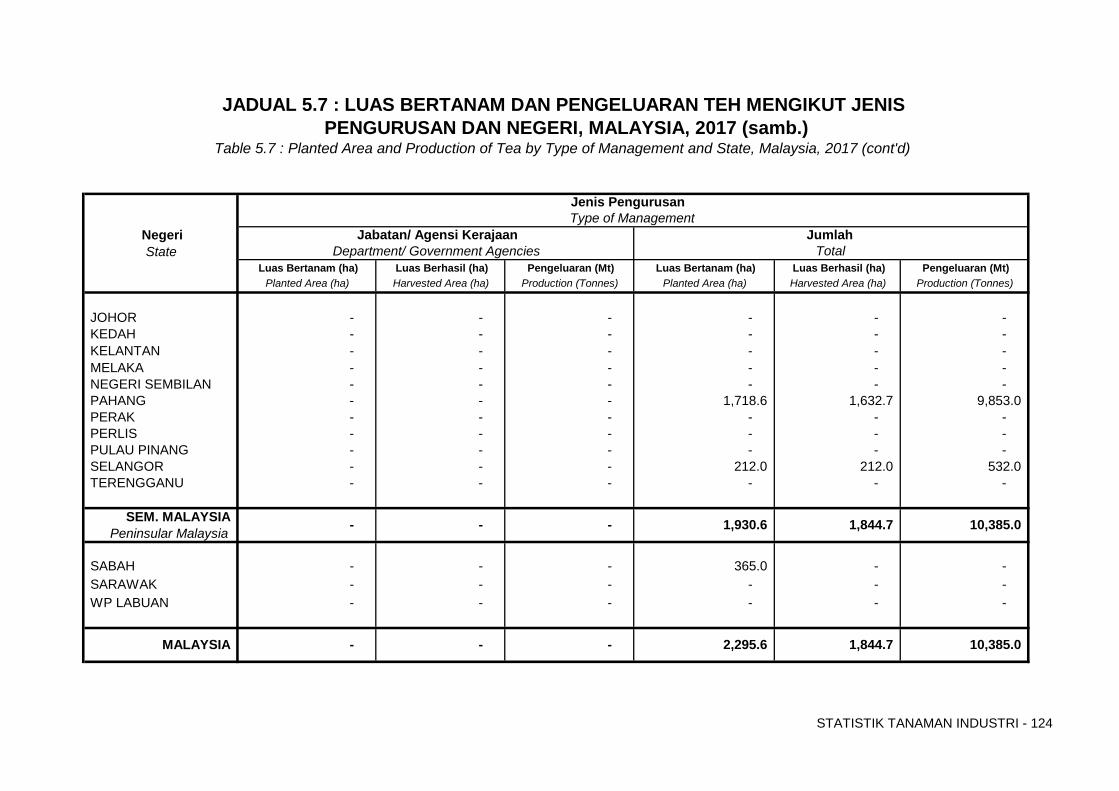
STATISTIK TANAMAN INDUSTRI - 124
State Luas Bertanam (ha) Luas Berhasil (ha) Pengeluaran (Mt) Luas Bertanam (ha) Luas Berhasil (ha) Pengeluaran (Mt)
Planted Area (ha) Harvested Area (ha) Production (Tonnes) Planted Area (ha) Harvested Area (ha) Production (Tonnes)
JOHOR - - - - - - KEDAH - - - - - - KELANTAN - - - - - - MELAKA - - - - - - NEGERI SEMBILAN - - - - - - PAHANG - - - 1,718.6 1,632.7 9,853.0 PERAK - - - - - - PERLIS - - - - - - PULAU PINANG - - - - - - SELANGOR - - - 212.0 212.0 532.0 TERENGGANU - - - - - -
SEM. MALAYSIAPeninsular Malaysia
SABAH - - - 365.0 - - SARAWAK - - - - - - WP LABUAN - - - - - -
MALAYSIA
JADUAL 5.7 : LUAS BERTANAM DAN PENGELUARAN TEH MENGIKUT JENIS
Type of Management
PENGURUSAN DAN NEGERI, MALAYSIA, 2017 (samb.)
Negeri
Table 5.7 : Planted Area and Production of Tea by Type of Management and State, Malaysia, 2017 (cont'd)
Jenis Pengurusan
10,385.0 -
10,385.0 2,295.6 1,844.7 -
1,930.6
-
- -
Department/ Government Agencies Jabatan/ Agensi Kerajaan
-
Jumlah
1,844.7
Total

Muka surat ini sengaja dibiarkan kosong

CENDAWAN
MUSHROOM
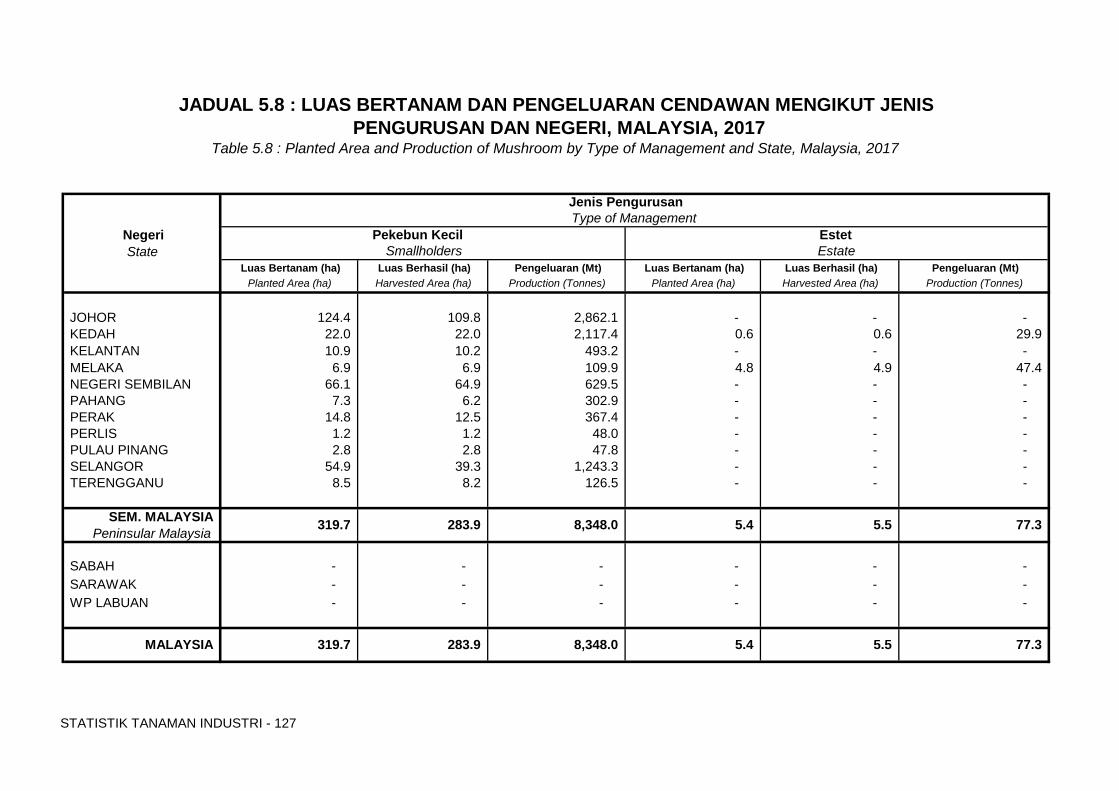
STATISTIK TANAMAN INDUSTRI - 127
State Luas Bertanam (ha) Luas Berhasil (ha) Pengeluaran (Mt) Luas Bertanam (ha) Luas Berhasil (ha) Pengeluaran (Mt)
Planted Area (ha) Harvested Area (ha) Production (Tonnes) Planted Area (ha) Harvested Area (ha) Production (Tonnes)
JOHOR 124.4 109.8 2,862.1 - - - KEDAH 22.0 22.0 2,117.4 0.6 0.6 29.9 KELANTAN 10.9 10.2 493.2 - - - MELAKA 6.9 6.9 109.9 4.8 4.9 47.4 NEGERI SEMBILAN 66.1 64.9 629.5 - - - PAHANG 7.3 6.2 302.9 - - - PERAK 14.8 12.5 367.4 - - - PERLIS 1.2 1.2 48.0 - - - PULAU PINANG 2.8 2.8 47.8 - - - SELANGOR 54.9 39.3 1,243.3 - - - TERENGGANU 8.5 8.2 126.5 - - -
SEM. MALAYSIAPeninsular Malaysia
SABAH - - - - - - SARAWAK - - - - - - WP LABUAN - - - - - -
Table 5.8 : Planted Area and Production of Mushroom by Type of Management and State, Malaysia, 2017
MALAYSIA 319.7 283.9 8,348.0
319.7 8,348.0 5.5
5.4 5.5
283.9
Jenis Pengurusan
5.4
77.3
77.3
JADUAL 5.8 : LUAS BERTANAM DAN PENGELUARAN CENDAWAN MENGIKUT JENIS PENGURUSAN DAN NEGERI, MALAYSIA, 2017
Smallholders EstatePekebun Kecil Estet Negeri
Type of Management
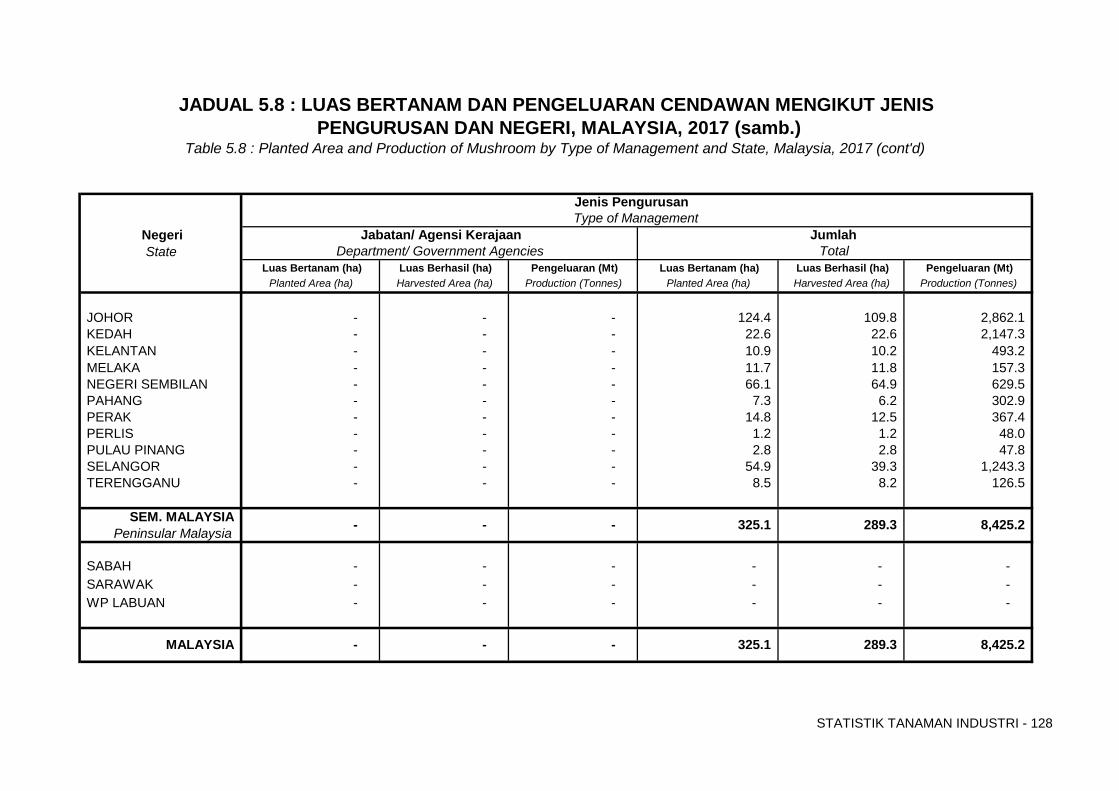
STATISTIK TANAMAN INDUSTRI - 128
State Luas Bertanam (ha) Luas Berhasil (ha) Pengeluaran (Mt) Luas Bertanam (ha) Luas Berhasil (ha) Pengeluaran (Mt)
Planted Area (ha) Harvested Area (ha) Production (Tonnes) Planted Area (ha) Harvested Area (ha) Production (Tonnes)
JOHOR - - - 124.4 109.8 2,862.1 KEDAH - - - 22.6 22.6 2,147.3 KELANTAN - - - 10.9 10.2 493.2 MELAKA - - - 11.7 11.8 157.3 NEGERI SEMBILAN - - - 66.1 64.9 629.5 PAHANG - - - 7.3 6.2 302.9 PERAK - - - 14.8 12.5 367.4 PERLIS - - - 1.2 1.2 48.0 PULAU PINANG - - - 2.8 2.8 47.8 SELANGOR - - - 54.9 39.3 1,243.3 TERENGGANU - - - 8.5 8.2 126.5
SEM. MALAYSIAPeninsular Malaysia
SABAH - - - - - - SARAWAK - - - - - - WP LABUAN - - - - - -
-
Jenis Pengurusan
- 325.1 289.3 -
325.1
JADUAL 5.8 : LUAS BERTANAM DAN PENGELUARAN CENDAWAN MENGIKUT JENIS
Type of Management
PENGURUSAN DAN NEGERI, MALAYSIA, 2017 (samb.)
- MALAYSIA
8,425.2 -
Table 5.8 : Planted Area and Production of Mushroom by Type of Management and State, Malaysia, 2017 (cont'd)
289.3
Department/ Government Agencies Total Jabatan/ Agensi Kerajaan Jumlah Negeri
-
8,425.2

Muka surat ini sengaja dibiarkan kosong
LEBAH KELULUT
KELULUT BEE
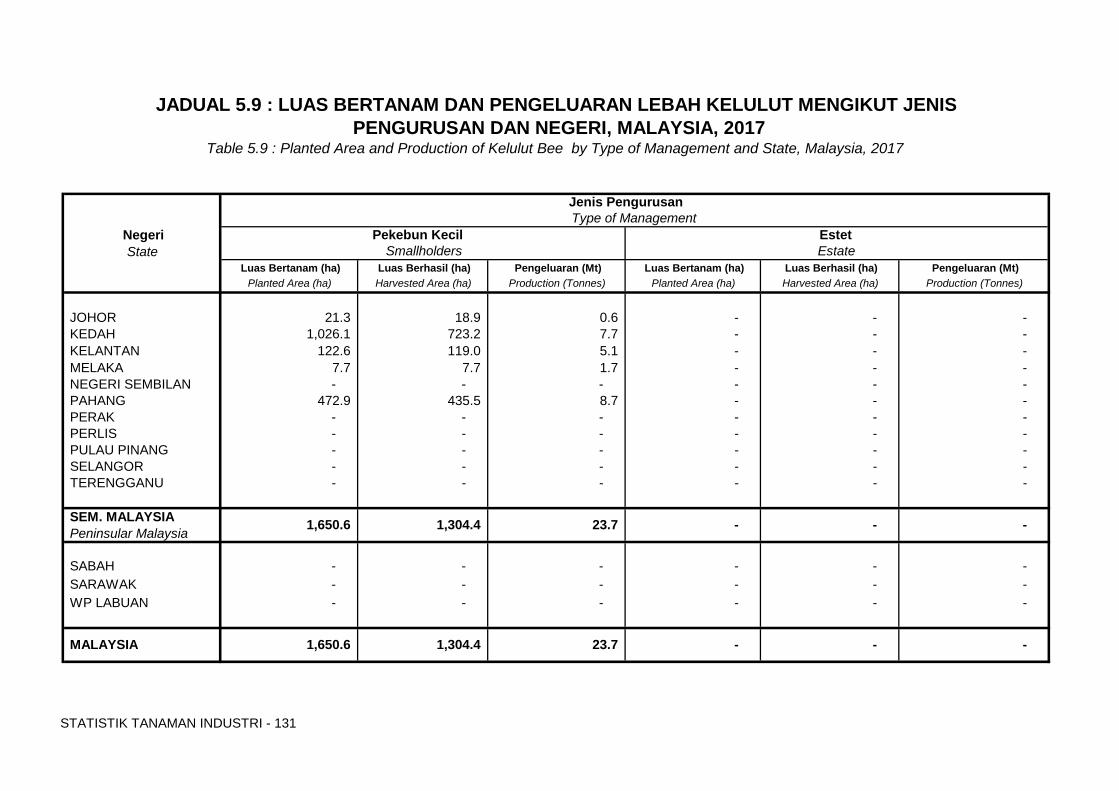
STATISTIK TANAMAN INDUSTRI - 131
State Luas Bertanam (ha) Luas Berhasil (ha) Pengeluaran (Mt) Luas Bertanam (ha) Luas Berhasil (ha) Pengeluaran (Mt)
Planted Area (ha) Harvested Area (ha) Production (Tonnes) Planted Area (ha) Harvested Area (ha) Production (Tonnes)
JOHOR 21.3 18.9 0.6 - - - KEDAH 1,026.1 723.2 7.7 - - - KELANTAN 122.6 119.0 5.1 - - - MELAKA 7.7 7.7 1.7 - - - NEGERI SEMBILAN - - - - - - PAHANG 472.9 435.5 8.7 - - - PERAK - - - - - - PERLIS - - - - - - PULAU PINANG - - - - - - SELANGOR - - - - - - TERENGGANU - - - - - -
SEM. MALAYSIAPeninsular Malaysia
SABAH - - - - - - SARAWAK - - - - - - WP LABUAN - - - - - -
Table 5.9 : Planted Area and Production of Kelulut Bee by Type of Management and State, Malaysia, 2017
MALAYSIA 1,650.6 1,304.4 23.7
1,650.6 23.7 -
- -
1,304.4
Jenis Pengurusan
-
-
-
JADUAL 5.9 : LUAS BERTANAM DAN PENGELUARAN LEBAH KELULUT MENGIKUT JENIS PENGURUSAN DAN NEGERI, MALAYSIA, 2017
Smallholders EstatePekebun Kecil Estet Negeri
Type of Management
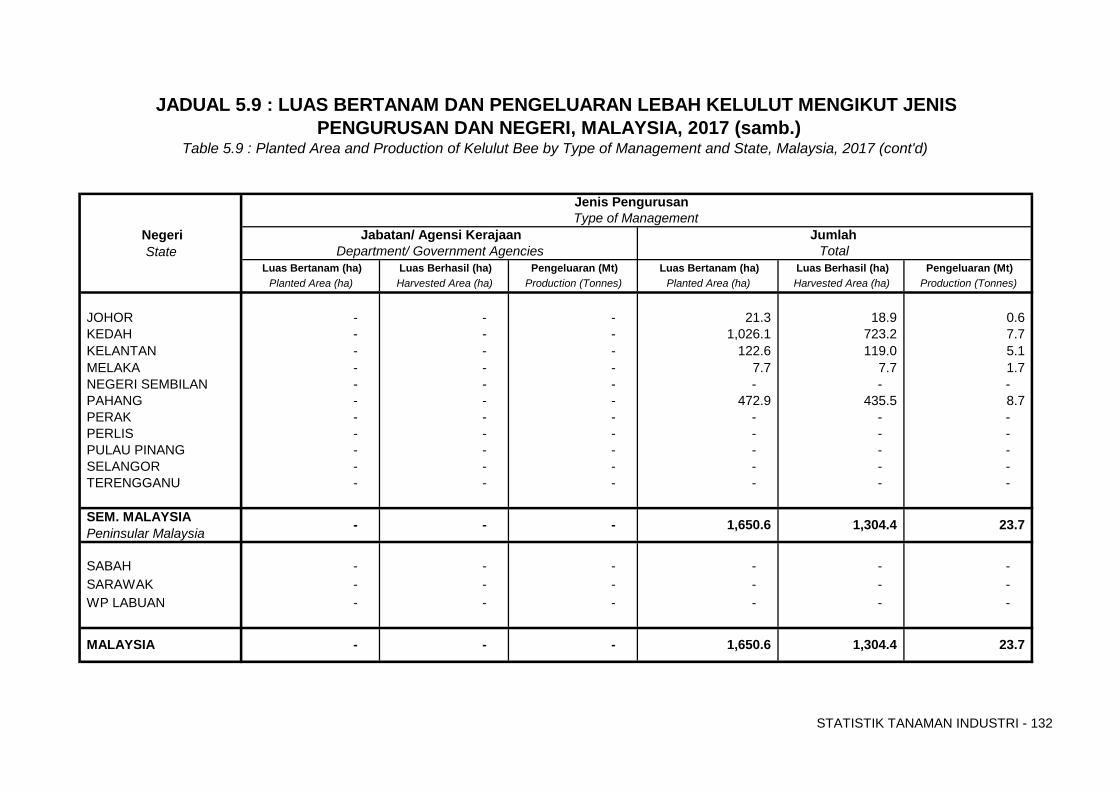
STATISTIK TANAMAN INDUSTRI - 132
State Luas Bertanam (ha) Luas Berhasil (ha) Pengeluaran (Mt) Luas Bertanam (ha) Luas Berhasil (ha) Pengeluaran (Mt)
Planted Area (ha) Harvested Area (ha) Production (Tonnes) Planted Area (ha) Harvested Area (ha) Production (Tonnes)
JOHOR - - - 21.3 18.9 0.6 KEDAH - - - 1,026.1 723.2 7.7 KELANTAN - - - 122.6 119.0 5.1 MELAKA - - - 7.7 7.7 1.7 NEGERI SEMBILAN - - - - - - PAHANG - - - 472.9 435.5 8.7 PERAK - - - - - - PERLIS - - - - - - PULAU PINANG - - - - - - SELANGOR - - - - - - TERENGGANU - - - - - -
SEM. MALAYSIAPeninsular Malaysia
SABAH - - - - - - SARAWAK - - - - - - WP LABUAN - - - - - -
-
Jenis Pengurusan
- 1,650.6 1,304.4 -
1,650.6
JADUAL 5.9 : LUAS BERTANAM DAN PENGELUARAN LEBAH KELULUT MENGIKUT JENIS
Type of Management
PENGURUSAN DAN NEGERI, MALAYSIA, 2017 (samb.)
- MALAYSIA
23.7 -
Table 5.9 : Planted Area and Production of Kelulut Bee by Type of Management and State, Malaysia, 2017 (cont'd)
1,304.4
Department/ Government Agencies Total Jabatan/ Agensi Kerajaan Jumlah Negeri
-
23.7
Muka surat ini sengaja dibiarkan kosong
LEBAH MADU
HONEY BEE
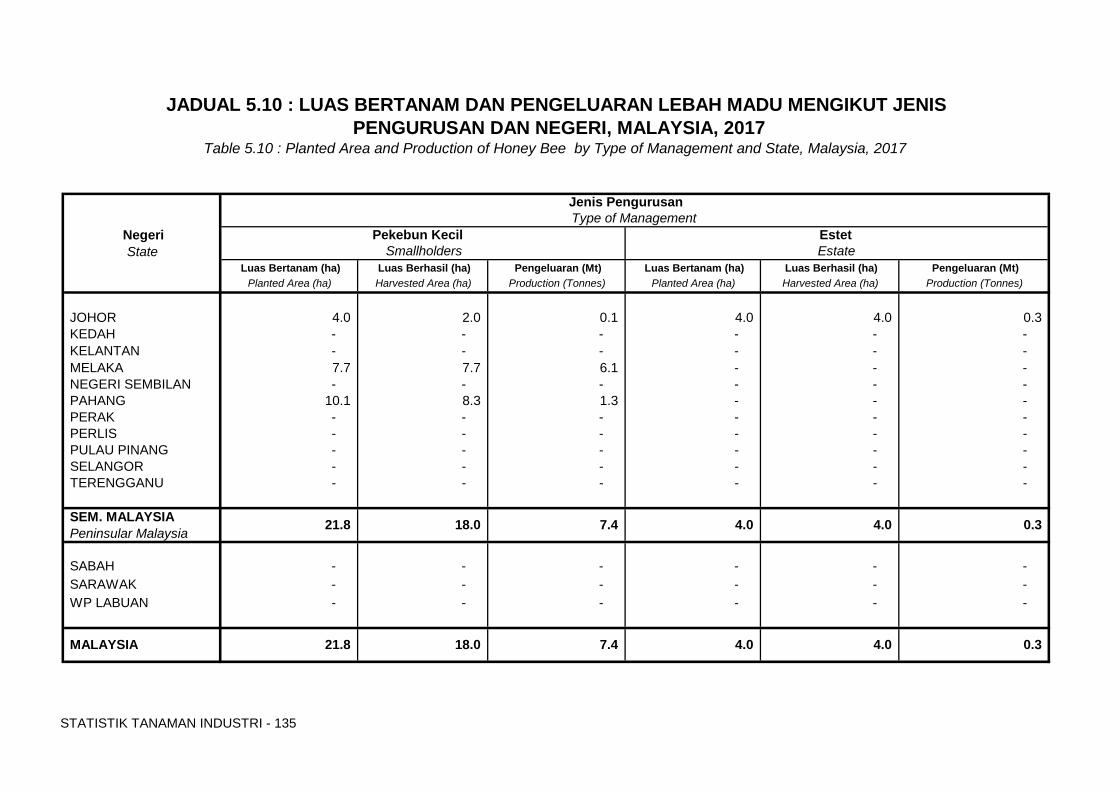
STATISTIK TANAMAN INDUSTRI - 135
State Luas Bertanam (ha) Luas Berhasil (ha) Pengeluaran (Mt) Luas Bertanam (ha) Luas Berhasil (ha) Pengeluaran (Mt)
Planted Area (ha) Harvested Area (ha) Production (Tonnes) Planted Area (ha) Harvested Area (ha) Production (Tonnes)
JOHOR 4.0 2.0 0.1 4.0 4.0 0.3 KEDAH - - - - - - KELANTAN - - - - - - MELAKA 7.7 7.7 6.1 - - - NEGERI SEMBILAN - - - - - - PAHANG 10.1 8.3 1.3 - - - PERAK - - - - - - PERLIS - - - - - - PULAU PINANG - - - - - - SELANGOR - - - - - - TERENGGANU - - - - - -
SEM. MALAYSIAPeninsular Malaysia
SABAH - - - - - - SARAWAK - - - - - - WP LABUAN - - - - - -
0.3
JADUAL 5.10 : LUAS BERTANAM DAN PENGELUARAN LEBAH MADU MENGIKUT JENIS PENGURUSAN DAN NEGERI, MALAYSIA, 2017
Smallholders EstatePekebun Kecil Estet Negeri
Type of Management
Table 5.10 : Planted Area and Production of Honey Bee by Type of Management and State, Malaysia, 2017
MALAYSIA 21.8 18.0 7.4
21.8 7.4 4.0
4.0 4.0
18.0
Jenis Pengurusan
4.0
0.3
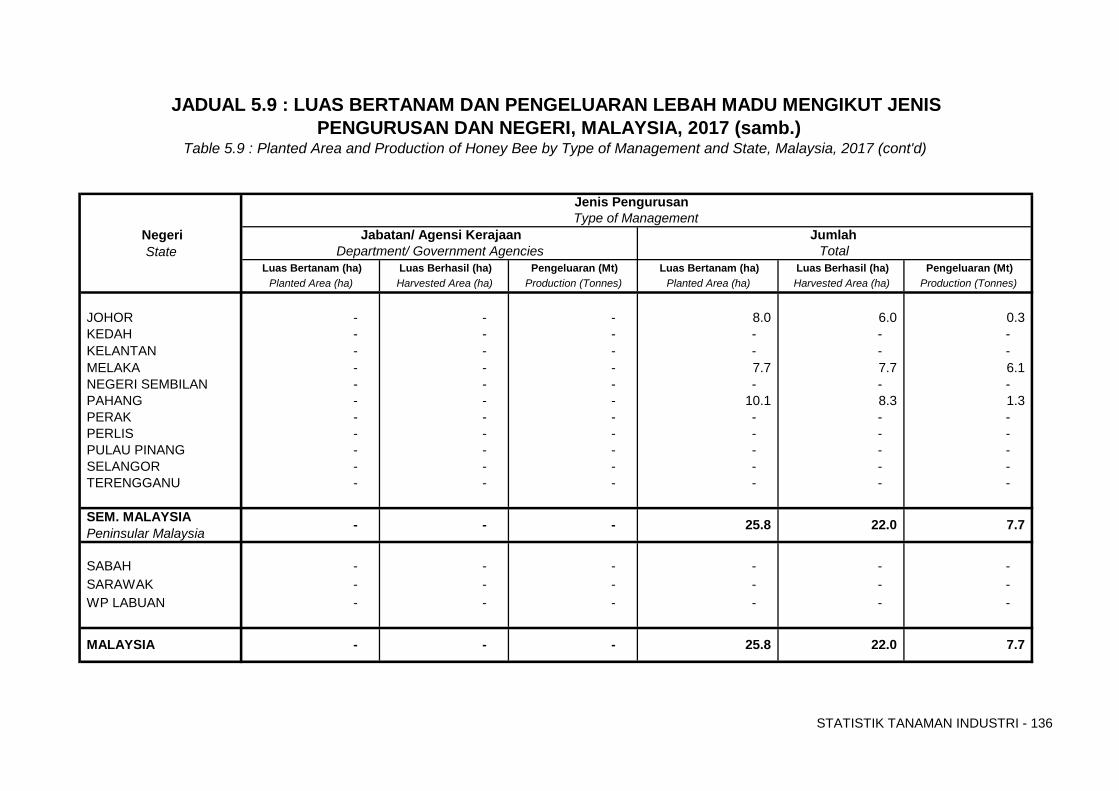
STATISTIK TANAMAN INDUSTRI - 136
State Luas Bertanam (ha) Luas Berhasil (ha) Pengeluaran (Mt) Luas Bertanam (ha) Luas Berhasil (ha) Pengeluaran (Mt)
Planted Area (ha) Harvested Area (ha) Production (Tonnes) Planted Area (ha) Harvested Area (ha) Production (Tonnes)
JOHOR - - - 8.0 6.0 0.3 KEDAH - - - - - - KELANTAN - - - - - - MELAKA - - - 7.7 7.7 6.1 NEGERI SEMBILAN - - - - - - PAHANG - - - 10.1 8.3 1.3 PERAK - - - - - - PERLIS - - - - - - PULAU PINANG - - - - - - SELANGOR - - - - - - TERENGGANU - - - - - -
SEM. MALAYSIAPeninsular Malaysia
SABAH - - - - - - SARAWAK - - - - - - WP LABUAN - - - - - -
JADUAL 5.9 : LUAS BERTANAM DAN PENGELUARAN LEBAH MADU MENGIKUT JENIS
Type of Management
PENGURUSAN DAN NEGERI, MALAYSIA, 2017 (samb.)
- MALAYSIA
7.7 -
Table 5.9 : Planted Area and Production of Honey Bee by Type of Management and State, Malaysia, 2017 (cont'd)
22.0
Department/ Government Agencies Total Jabatan/ Agensi Kerajaan Jumlah Negeri
-
7.7
-
Jenis Pengurusan
- 25.8 22.0 -
25.8

Muka surat ini sengaja dibiarkan kosong
JAGUNG BIJIAN
GRAIN CORN
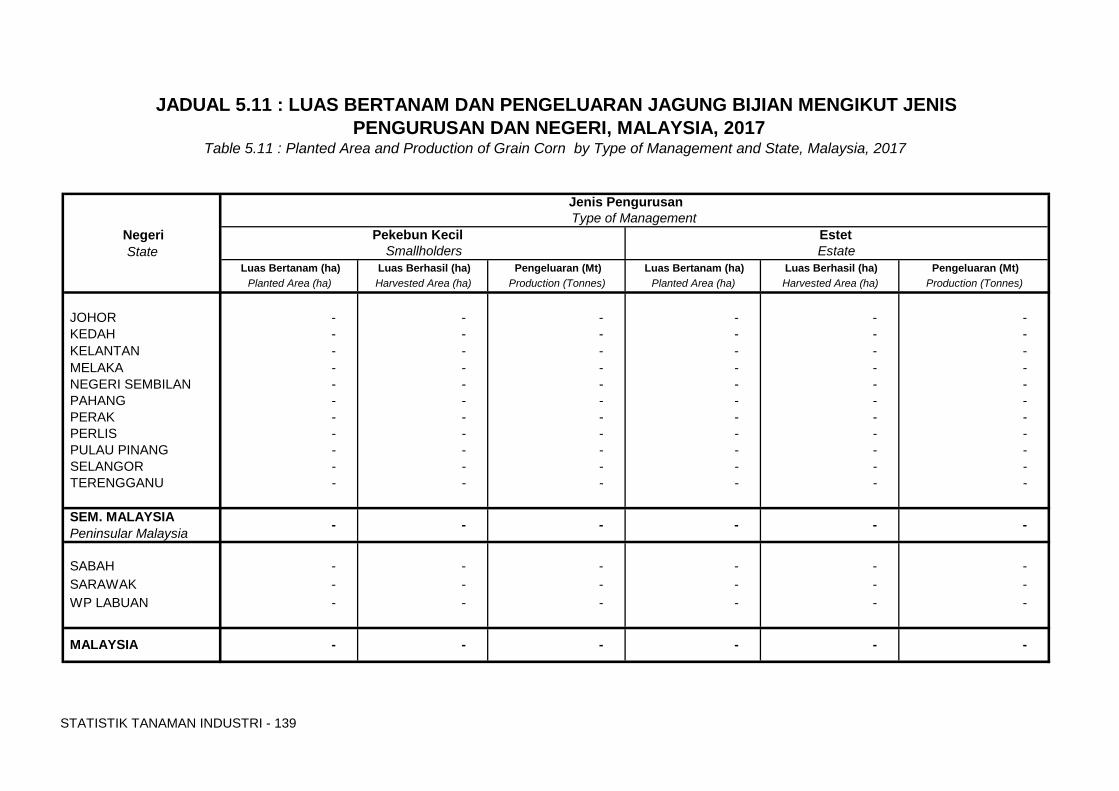
STATISTIK TANAMAN INDUSTRI - 139
State Luas Bertanam (ha) Luas Berhasil (ha) Pengeluaran (Mt) Luas Bertanam (ha) Luas Berhasil (ha) Pengeluaran (Mt)
Planted Area (ha) Harvested Area (ha) Production (Tonnes) Planted Area (ha) Harvested Area (ha) Production (Tonnes)
JOHOR - - - - - - KEDAH - - - - - - KELANTAN - - - - - - MELAKA - - - - - - NEGERI SEMBILAN - - - - - - PAHANG - - - - - - PERAK - - - - - - PERLIS - - - - - - PULAU PINANG - - - - - - SELANGOR - - - - - - TERENGGANU - - - - - -
SEM. MALAYSIAPeninsular Malaysia
SABAH - - - - - - SARAWAK - - - - - - WP LABUAN - - - - - -
Table 5.11 : Planted Area and Production of Grain Corn by Type of Management and State, Malaysia, 2017
MALAYSIA - - -
- - -
- -
-
Jenis Pengurusan
-
-
-
JADUAL 5.11 : LUAS BERTANAM DAN PENGELUARAN JAGUNG BIJIAN MENGIKUT JENIS PENGURUSAN DAN NEGERI, MALAYSIA, 2017
Smallholders EstatePekebun Kecil Estet Negeri
Type of Management
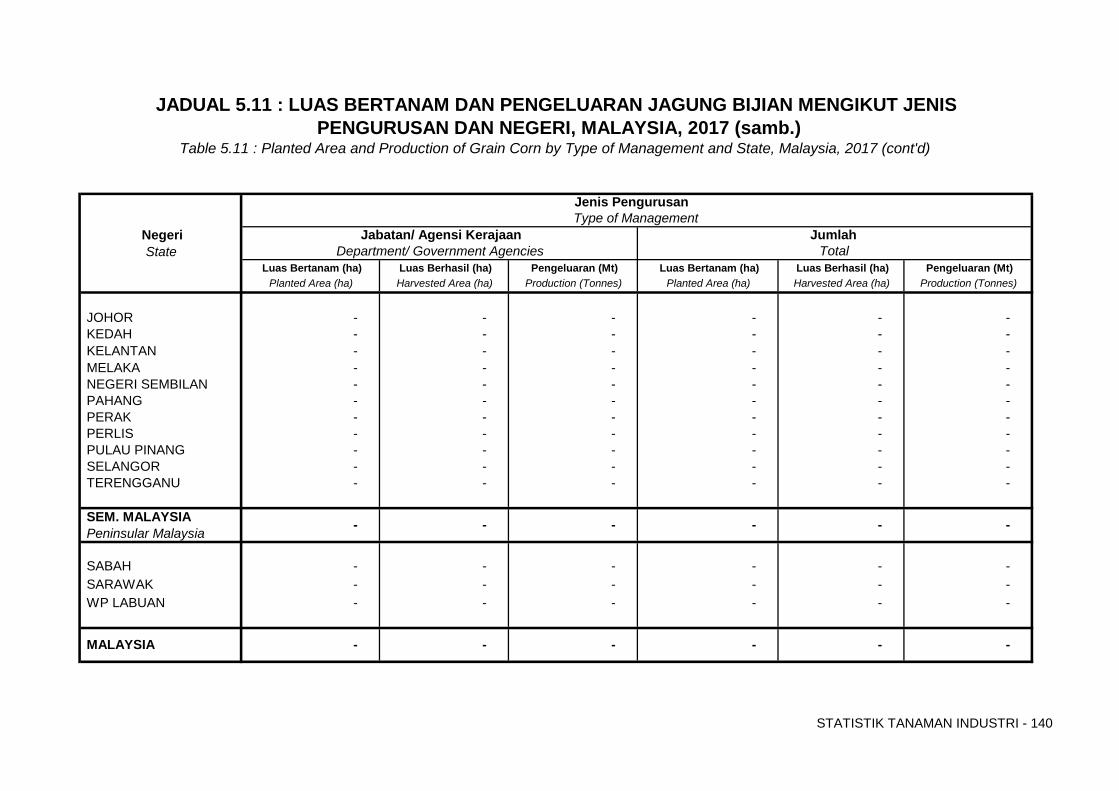
STATISTIK TANAMAN INDUSTRI - 140
State Luas Bertanam (ha) Luas Berhasil (ha) Pengeluaran (Mt) Luas Bertanam (ha) Luas Berhasil (ha) Pengeluaran (Mt)
Planted Area (ha) Harvested Area (ha) Production (Tonnes) Planted Area (ha) Harvested Area (ha) Production (Tonnes)
JOHOR - - - - - - KEDAH - - - - - - KELANTAN - - - - - - MELAKA - - - - - - NEGERI SEMBILAN - - - - - - PAHANG - - - - - - PERAK - - - - - - PERLIS - - - - - - PULAU PINANG - - - - - - SELANGOR - - - - - - TERENGGANU - - - - - -
SEM. MALAYSIAPeninsular Malaysia
SABAH - - - - - - SARAWAK - - - - - - WP LABUAN - - - - - -
-
Jenis Pengurusan
- - - -
-
JADUAL 5.11 : LUAS BERTANAM DAN PENGELUARAN JAGUNG BIJIAN MENGIKUT JENIS
Type of Management
PENGURUSAN DAN NEGERI, MALAYSIA, 2017 (samb.)
- MALAYSIA
- -
Table 5.11 : Planted Area and Production of Grain Corn by Type of Management and State, Malaysia, 2017 (cont'd)
-
Department/ Government Agencies Total Jabatan/ Agensi Kerajaan Jumlah Negeri
-
-

Muka surat ini sengaja dibiarkan kosong
SEKSYEN 6 Section 6
LUAS BERTANAM DAN PENGELUARAN TANAMAN INDUSTRI
MENGIKUT JENIS PENGURUSAN, NEGERI, 2017
Planted Area and Production of Industrial Crops by Type of Management, State, 2017
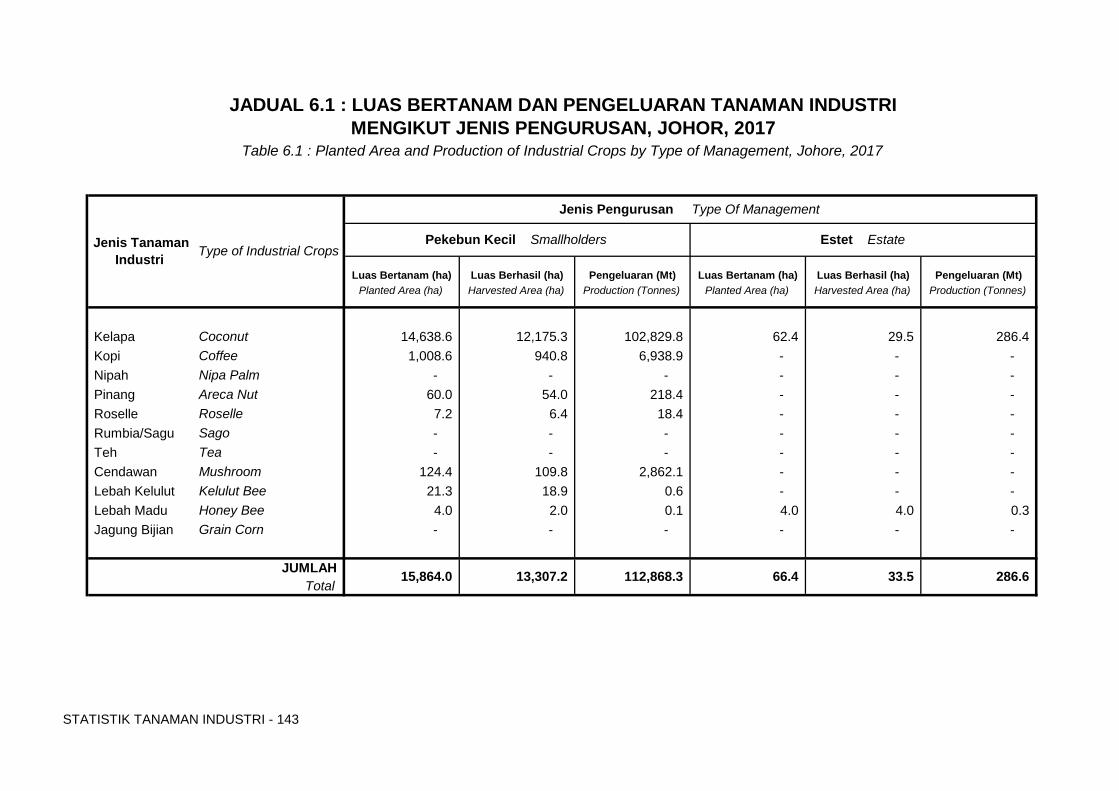
STATISTIK TANAMAN INDUSTRI - 143
Luas Bertanam (ha) Luas Berhasil (ha) Pengeluaran (Mt) Luas Bertanam (ha) Luas Berhasil (ha) Pengeluaran (Mt)Planted Area (ha) Harvested Area (ha) Production (Tonnes) Planted Area (ha) Harvested Area (ha) Production (Tonnes)
Kelapa Coconut 14,638.6 12,175.3 102,829.8 62.4 29.5 286.4 Kopi Coffee 1,008.6 940.8 6,938.9 - - - Nipah Nipa Palm - - - - - - Pinang Areca Nut 60.0 54.0 218.4 - - - Roselle Roselle 7.2 6.4 18.4 - - - Rumbia/Sagu Sago - - - - - - Teh Tea - - - - - - Cendawan Mushroom 124.4 109.8 2,862.1 - - - Lebah Kelulut Kelulut Bee 21.3 18.9 0.6 - - - Lebah Madu Honey Bee 4.0 2.0 0.1 4.0 4.0 0.3 Jagung Bijian Grain Corn - - - - - -
Estet Estate
66.4 286.6
JADUAL 6.1 : LUAS BERTANAM DAN PENGELUARAN TANAMAN INDUSTRI MENGIKUT JENIS PENGURUSAN, JOHOR, 2017
Jenis Pengurusan Type Of Management
Table 6.1 : Planted Area and Production of Industrial Crops by Type of Management, Johore, 2017
112,868.3 33.5 JUMLAH 13,307.2
Pekebun Kecil Smallholders
Total
Jenis Tanaman Industri Type of Industrial Crops
15,864.0
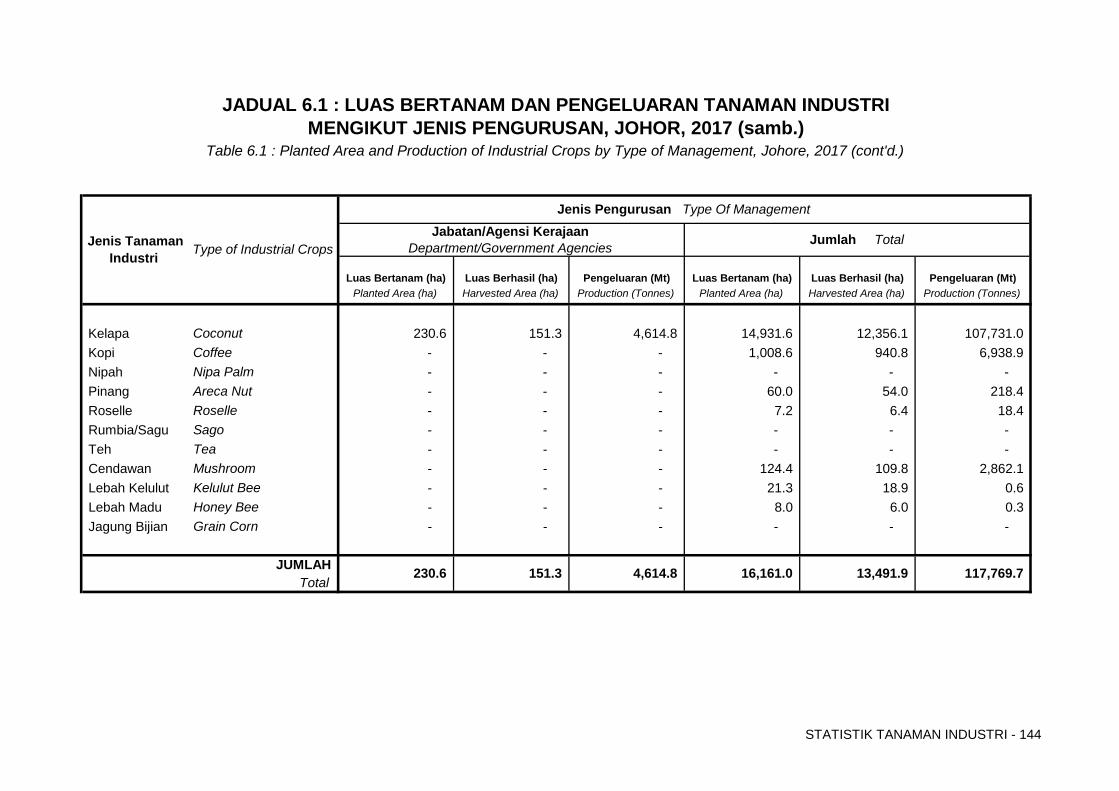
STATISTIK TANAMAN INDUSTRI - 144
Luas Bertanam (ha) Luas Berhasil (ha) Pengeluaran (Mt) Luas Bertanam (ha) Luas Berhasil (ha) Pengeluaran (Mt)Planted Area (ha) Harvested Area (ha) Production (Tonnes) Planted Area (ha) Harvested Area (ha) Production (Tonnes)
Kelapa Coconut 230.6 151.3 4,614.8 14,931.6 12,356.1 107,731.0 Kopi Coffee - - - 1,008.6 940.8 6,938.9 Nipah Nipa Palm - - - - - - Pinang Areca Nut - - - 60.0 54.0 218.4 Roselle Roselle - - - 7.2 6.4 18.4 Rumbia/Sagu Sago - - - - - - Teh Tea - - - - - - Cendawan Mushroom - - - 124.4 109.8 2,862.1 Lebah Kelulut Kelulut Bee - - - 21.3 18.9 0.6 Lebah Madu Honey Bee - - - 8.0 6.0 0.3 Jagung Bijian Grain Corn - - - - - -
Jabatan/Agensi Kerajaan Department/Government Agencies
JADUAL 6.1 : LUAS BERTANAM DAN PENGELUARAN TANAMAN INDUSTRI
Jenis Tanaman Industri Type of Industrial Crops
MENGIKUT JENIS PENGURUSAN, JOHOR, 2017 (samb.)Table 6.1 : Planted Area and Production of Industrial Crops by Type of Management, Johore, 2017 (cont'd.)
Jumlah Total
Jenis Pengurusan Type Of Management
117,769.7 230.6 JUMLAHTotal
16,161.0 13,491.9 151.3 4,614.8
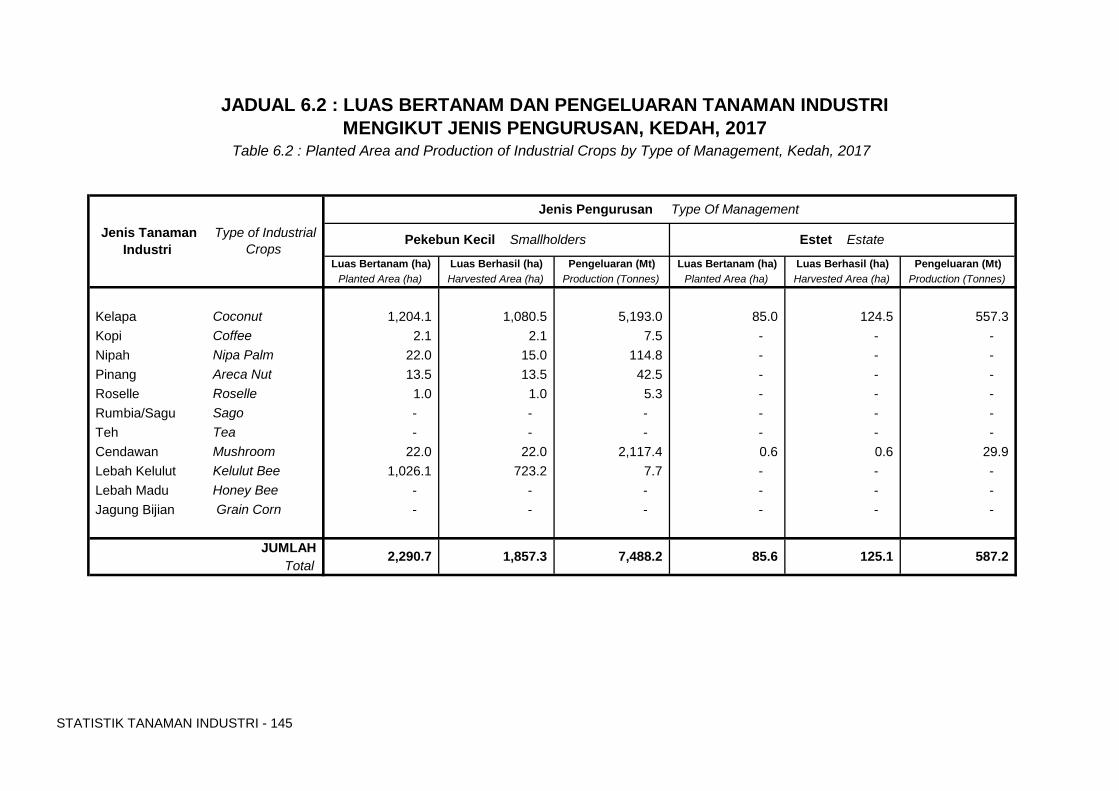
STATISTIK TANAMAN INDUSTRI - 145
Luas Bertanam (ha) Luas Berhasil (ha) Pengeluaran (Mt) Luas Bertanam (ha) Luas Berhasil (ha) Pengeluaran (Mt)Planted Area (ha) Harvested Area (ha) Production (Tonnes) Planted Area (ha) Harvested Area (ha) Production (Tonnes)
Kelapa Coconut 1,204.1 1,080.5 5,193.0 85.0 124.5 557.3 Kopi Coffee 2.1 2.1 7.5 - - - Nipah Nipa Palm 22.0 15.0 114.8 - - - Pinang Areca Nut 13.5 13.5 42.5 - - - Roselle Roselle 1.0 1.0 5.3 - - - Rumbia/Sagu Sago - - - - - - Teh Tea - - - - - - Cendawan Mushroom 22.0 22.0 2,117.4 0.6 0.6 29.9 Lebah Kelulut Kelulut Bee 1,026.1 723.2 7.7 - - - Lebah Madu Honey Bee - - - - - - Jagung Bijian Grain Corn - - - - - -
Table 6.2 : Planted Area and Production of Industrial Crops by Type of Management, Kedah, 2017
JADUAL 6.2 : LUAS BERTANAM DAN PENGELUARAN TANAMAN INDUSTRI MENGIKUT JENIS PENGURUSAN, KEDAH, 2017
JUMLAHTotal
7,488.2 125.1 85.6 2,290.7 1,857.3 587.2
Jenis Pengurusan Type Of Management
Jenis Tanaman Industri
Type of Industrial Crops
Pekebun Kecil Smallholders Estet Estate
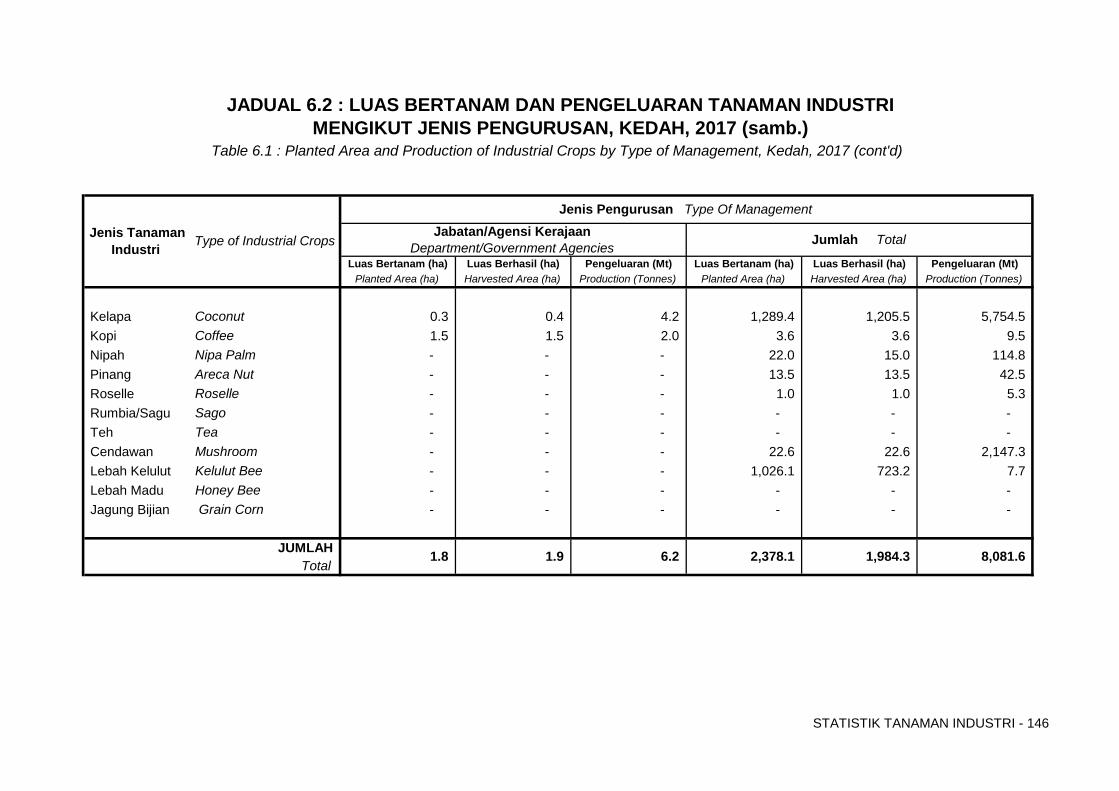
STATISTIK TANAMAN INDUSTRI - 146
Luas Bertanam (ha) Luas Berhasil (ha) Pengeluaran (Mt) Luas Bertanam (ha) Luas Berhasil (ha) Pengeluaran (Mt)Planted Area (ha) Harvested Area (ha) Production (Tonnes) Planted Area (ha) Harvested Area (ha) Production (Tonnes)
Kelapa Coconut 0.3 0.4 4.2 1,289.4 1,205.5 5,754.5 Kopi Coffee 1.5 1.5 2.0 3.6 3.6 9.5 Nipah Nipa Palm - - - 22.0 15.0 114.8 Pinang Areca Nut - - - 13.5 13.5 42.5 Roselle Roselle - - - 1.0 1.0 5.3 Rumbia/Sagu Sago - - - - - - Teh Tea - - - - - - Cendawan Mushroom - - - 22.6 22.6 2,147.3 Lebah Kelulut Kelulut Bee - - - 1,026.1 723.2 7.7 Lebah Madu Honey Bee - - - - - - Jagung Bijian Grain Corn - - - - - -
JADUAL 6.2 : LUAS BERTANAM DAN PENGELUARAN TANAMAN INDUSTRI MENGIKUT JENIS PENGURUSAN, KEDAH, 2017 (samb.)
Table 6.1 : Planted Area and Production of Industrial Crops by Type of Management, Kedah, 2017 (cont'd)
Jenis Tanaman Industri Type of Industrial Crops
Jenis Pengurusan Type Of Management
Jumlah TotalJabatan/Agensi Kerajaan Department/Government Agencies
JUMLAHTotal
2,378.1 6.2 8,081.6 1,984.3 1.8 1.9
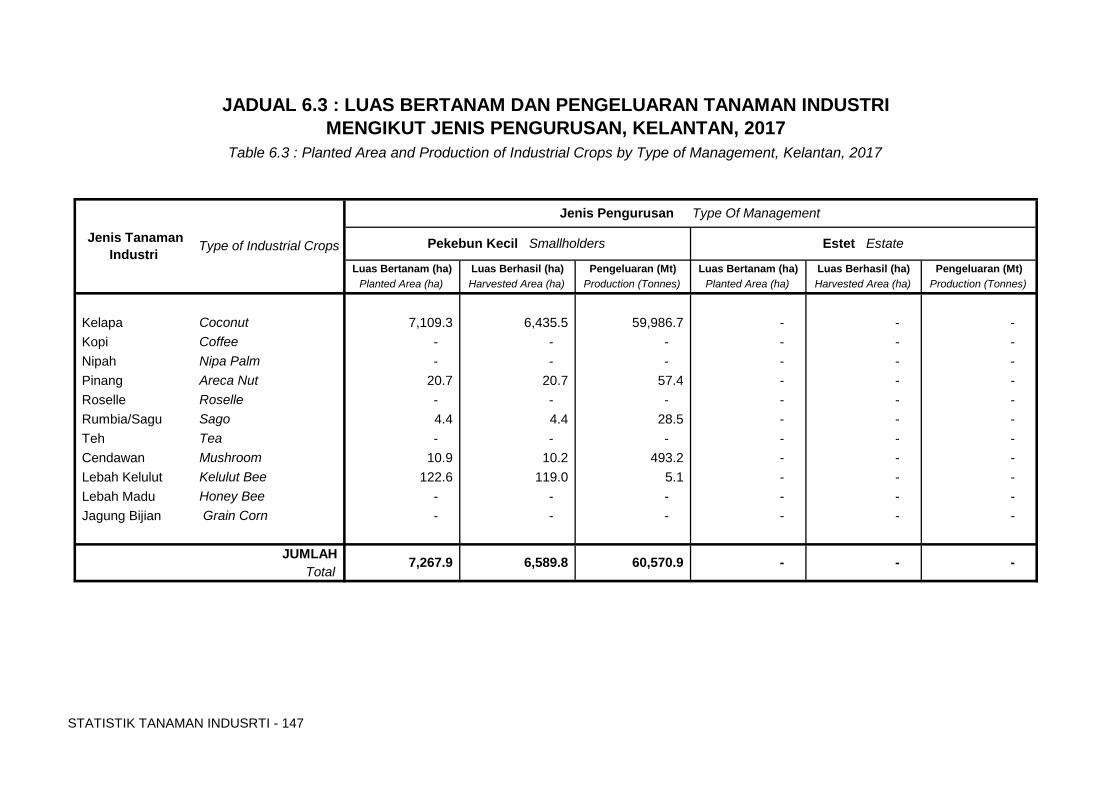
STATISTIK TANAMAN INDUSRTI - 147
Luas Bertanam (ha) Luas Berhasil (ha) Pengeluaran (Mt) Luas Bertanam (ha) Luas Berhasil (ha) Pengeluaran (Mt)Planted Area (ha) Harvested Area (ha) Production (Tonnes) Planted Area (ha) Harvested Area (ha) Production (Tonnes)
Kelapa Coconut 7,109.3 6,435.5 59,986.7 - - - Kopi Coffee - - - - - - Nipah Nipa Palm - - - - - - Pinang Areca Nut 20.7 20.7 57.4 - - - Roselle Roselle - - - - - - Rumbia/Sagu Sago 4.4 4.4 28.5 - - - Teh Tea - - - - - - Cendawan Mushroom 10.9 10.2 493.2 - - - Lebah Kelulut Kelulut Bee 122.6 119.0 5.1 - - - Lebah Madu Honey Bee - - - - - - Jagung Bijian Grain Corn - - - - - -
JADUAL 6.3 : LUAS BERTANAM DAN PENGELUARAN TANAMAN INDUSTRI MENGIKUT JENIS PENGURUSAN, KELANTAN, 2017
Table 6.3 : Planted Area and Production of Industrial Crops by Type of Management, Kelantan, 2017
- -
Estet Estate
JUMLAHTotal
60,570.9 - 7,267.9 6,589.8
Jenis Tanaman Industri Type of Industrial Crops Pekebun Kecil Smallholders
Jenis Pengurusan Type Of Management

STATISTIK TANAMAN INDUSRTI - 148
Luas Bertanam (ha) Luas Berhasil (ha) Pengeluaran (Mt) Luas Bertanam (ha) Luas Berhasil (ha) Pengeluaran (Mt)Planted Area (ha) Harvested Area (ha) Production (Tonnes) Planted Area (ha) Harvested Area (ha) Production (Tonnes)
Kelapa Coconut 6.4 2.5 21.8 7,115.7 6,437.9 60,008.6 Kopi Coffee - - - - - - Nipah Nipa Palm - - - - - - Pinang Areca Nut - - - 20.7 20.7 57.4 Roselle Roselle - - - - - - Rumbia/Sagu Sago - - - 4.4 4.4 28.5 Teh Tea - - - - - - Cendawan Mushroom - - - 10.9 10.2 493.2 Lebah Kelulut Kelulut Bee - - - 122.6 119.0 5.1 Lebah Madu Honey Bee - - - - - - Jagung Bijian Grain Corn - - - - - -
6.4 60,592.7 21.8 2.5 7,274.4
JADUAL 6.3 : LUAS BERTANAM DAN PENGELUARAN TANAMAN INDUSTRI MENGIKUT JENIS PENGURUSAN, KELANTAN, 2017 (samb.)
Table 6.3 : Planted Area and Production of Industrial Crops by Type of Management, Kelantan, 2017 (cont'd)
6,592.2
Jumlah TotalJabatan/Agensi Kerajaan Department/Government Agencies
Jenis Tanaman Industri Type of Industrial Crops
Jenis Pengurusan Type Of Management
JUMLAHTotal

STATISTIK TANAMAN INDUSTRI - 149
Luas Bertanam (ha) Luas Berhasil (ha) Pengeluaran (Mt) Luas Bertanam (ha) Luas Berhasil (ha) Pengeluaran (Mt)Planted Area (ha) Harvested Area (ha) Production (Tonnes) Planted Area (ha) Harvested Area (ha) Production (Tonnes)
Kelapa Coconut 1,455.9 1,395.0 10,393.5 - - - Kopi Coffee - - - - - - Nipah Nipa Palm - - - - - - Pinang Areca Nut - - - - - - Roselle Roselle - - - - - - Rumbia/Sagu Sago - - - - - - Teh Tea - - - - - - Cendawan Mushroom 6.9 6.9 109.9 - - - Lebah Kelulut Kelulut Bee 7.7 7.7 1.7 - - - Lebah Madu Honey Bee 7.7 7.7 6.1 - - - Jagung Bijian Grain Corn - - - - - -
Jenis Pengurusan Type Of Management
JADUAL 6.4 : LUAS BERTANAM DAN PENGELUARAN TANAMAN INDUSTRI MENGIKUT JENIS PENGURUSAN, MELAKA, 2017
Table 6.4 : Planted Area and Production of Industrial Crops by Type of Management, Malacca, 2017
Jenis Tanaman Industri Type of Industrial Crops
Pekebun Kecil Smallholders
Total
Estet Estate
10,511.2 - - - 1,478.2 1,417.3 JUMLAH

STATISTIK TANAMAN INDUSTRI - 150
Luas Bertanam (ha) Luas Berhasil (ha) Pengeluaran (Mt) Luas Bertanam (ha) Luas Berhasil (ha) Pengeluaran (Mt)Planted Area (ha) Harvested Area (ha) Production (Tonnes) Planted Area (ha) Harvested Area (ha) Production (Tonnes)
Kelapa Coconut - - - 1,455.9 1,395.0 10,393.5 Kopi Coffee - - - - - - Nipah Nipa Palm - - - - - - Pinang Areca Nut - - - - - - Roselle Roselle - - - - - - Rumbia/Sagu Sago - - - - - - Teh Tea - - - - - - Cendawan Mushroom - - - 6.9 6.9 109.9 Lebah Kelulut Kelulut Bee - - - 7.7 7.7 1.7 Lebah Madu Honey Bee - - - 7.7 7.7 6.1 Jagung Bijian Grain Corn - - - - - -
JADUAL 6.4 : LUAS BERTANAM DAN PENGELUARAN TANAMAN INDUSTRI MENGIKUT JENIS PENGURUSAN, MELAKA, 2017 (samb.)
Table 6.4 : Planted Area and Production of Industrial Crops by Type of Management, Malacca, 2017 (cont'd.)
Jenis Tanaman Industri Type of Industrial Crops
Jenis Pengurusan Type Of Management
Jumlah TotalJabatan/Agensi Kerajaan Department/Government Agencies
- 10,511.2 JUMLAHTotal
1,417.3 1,478.2 - -
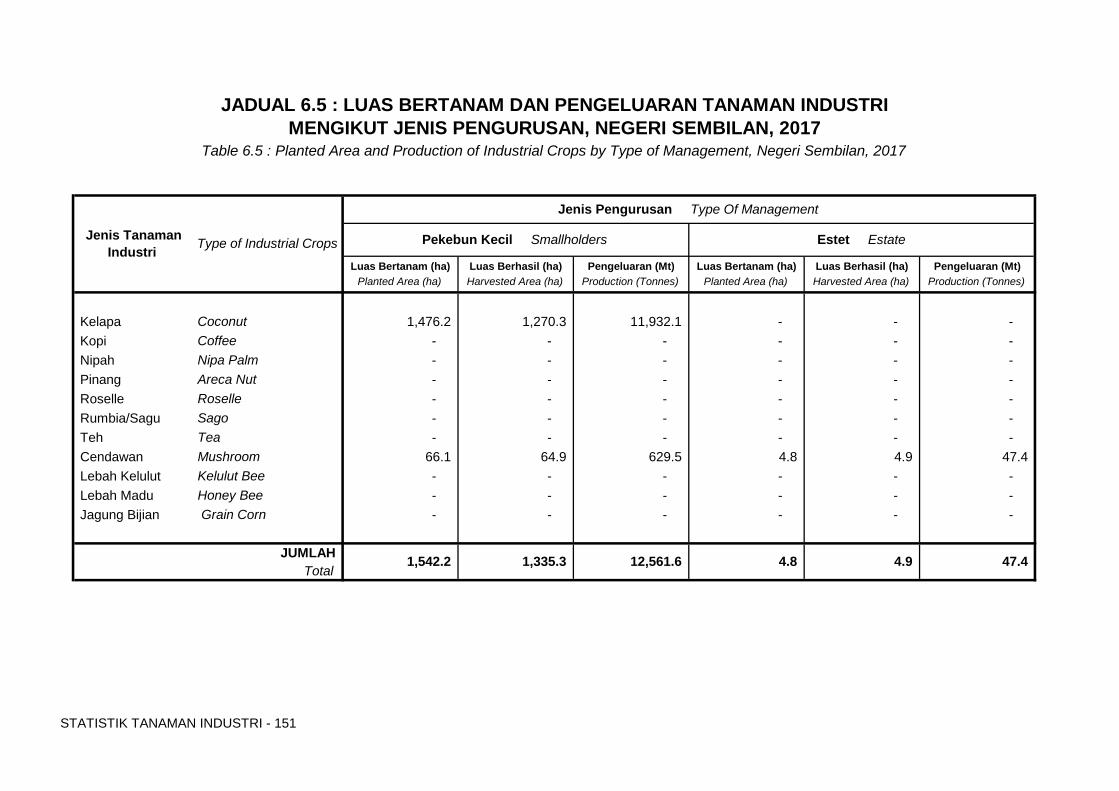
STATISTIK TANAMAN INDUSTRI - 151
Luas Bertanam (ha) Luas Berhasil (ha) Pengeluaran (Mt) Luas Bertanam (ha) Luas Berhasil (ha) Pengeluaran (Mt)Planted Area (ha) Harvested Area (ha) Production (Tonnes) Planted Area (ha) Harvested Area (ha) Production (Tonnes)
Kelapa Coconut 1,476.2 1,270.3 11,932.1 - - - Kopi Coffee - - - - - - Nipah Nipa Palm - - - - - - Pinang Areca Nut - - - - - - Roselle Roselle - - - - - - Rumbia/Sagu Sago - - - - - - Teh Tea - - - - - - Cendawan Mushroom 66.1 64.9 629.5 4.8 4.9 47.4 Lebah Kelulut Kelulut Bee - - - - - - Lebah Madu Honey Bee - - - - - - Jagung Bijian Grain Corn - - - - - -
JADUAL 6.5 : LUAS BERTANAM DAN PENGELUARAN TANAMAN INDUSTRI MENGIKUT JENIS PENGURUSAN, NEGERI SEMBILAN, 2017
JUMLAHTotal
Table 6.5 : Planted Area and Production of Industrial Crops by Type of Management, Negeri Sembilan, 2017
Jenis Tanaman Industri Type of Industrial Crops
Jenis Pengurusan Type Of Management
1,335.3
Pekebun Kecil Smallholders Estet Estate
4.9 12,561.6 47.4 4.8 1,542.2
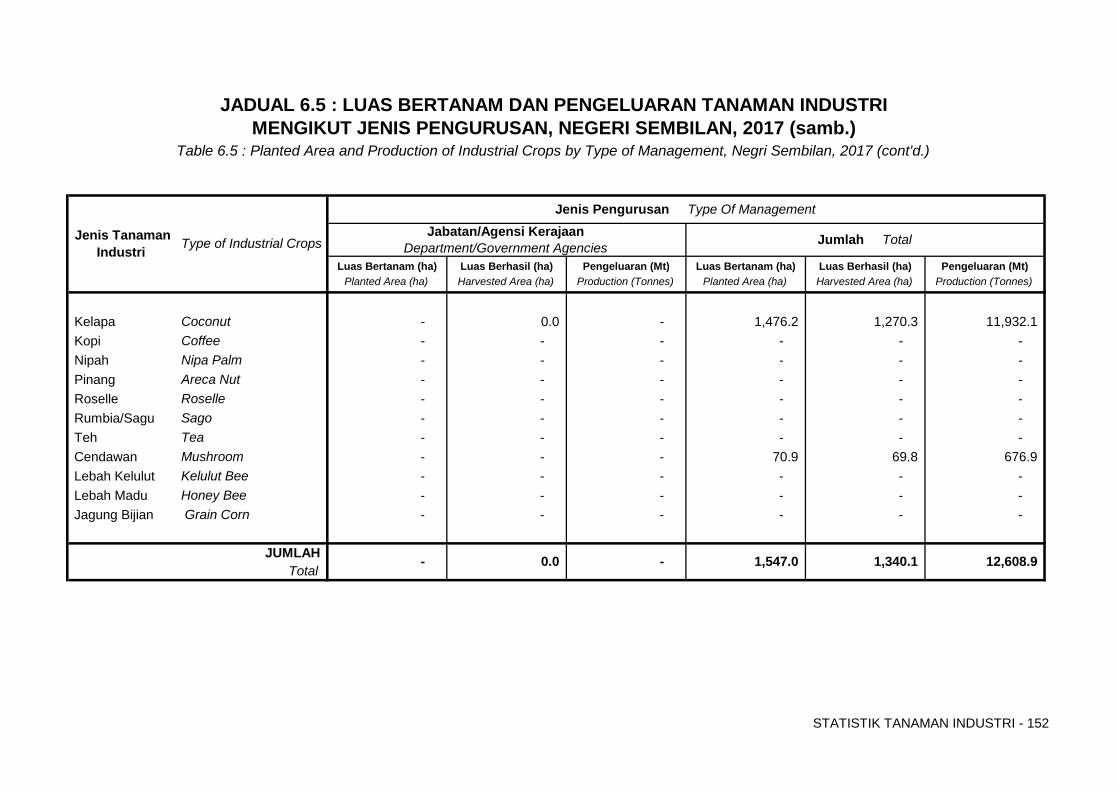
STATISTIK TANAMAN INDUSTRI - 152
Luas Bertanam (ha) Luas Berhasil (ha) Pengeluaran (Mt) Luas Bertanam (ha) Luas Berhasil (ha) Pengeluaran (Mt)Planted Area (ha) Harvested Area (ha) Production (Tonnes) Planted Area (ha) Harvested Area (ha) Production (Tonnes)
Kelapa Coconut - 0.0 - 1,476.2 1,270.3 11,932.1 Kopi Coffee - - - - - - Nipah Nipa Palm - - - - - - Pinang Areca Nut - - - - - - Roselle Roselle - - - - - - Rumbia/Sagu Sago - - - - - - Teh Tea - - - - - - Cendawan Mushroom - - - 70.9 69.8 676.9 Lebah Kelulut Kelulut Bee - - - - - - Lebah Madu Honey Bee - - - - - - Jagung Bijian Grain Corn - - - - - -
Total
JADUAL 6.5 : LUAS BERTANAM DAN PENGELUARAN TANAMAN INDUSTRI MENGIKUT JENIS PENGURUSAN, NEGERI SEMBILAN, 2017 (samb.)
Table 6.5 : Planted Area and Production of Industrial Crops by Type of Management, Negri Sembilan, 2017 (cont'd.)
0.0
Jenis Pengurusan Type Of Management
Type of Industrial Crops Jabatan/Agensi Kerajaan
Department/Government Agencies
12,608.9
Jumlah Total
1,340.1 - -
Jenis Tanaman Industri
1,547.0 JUMLAH
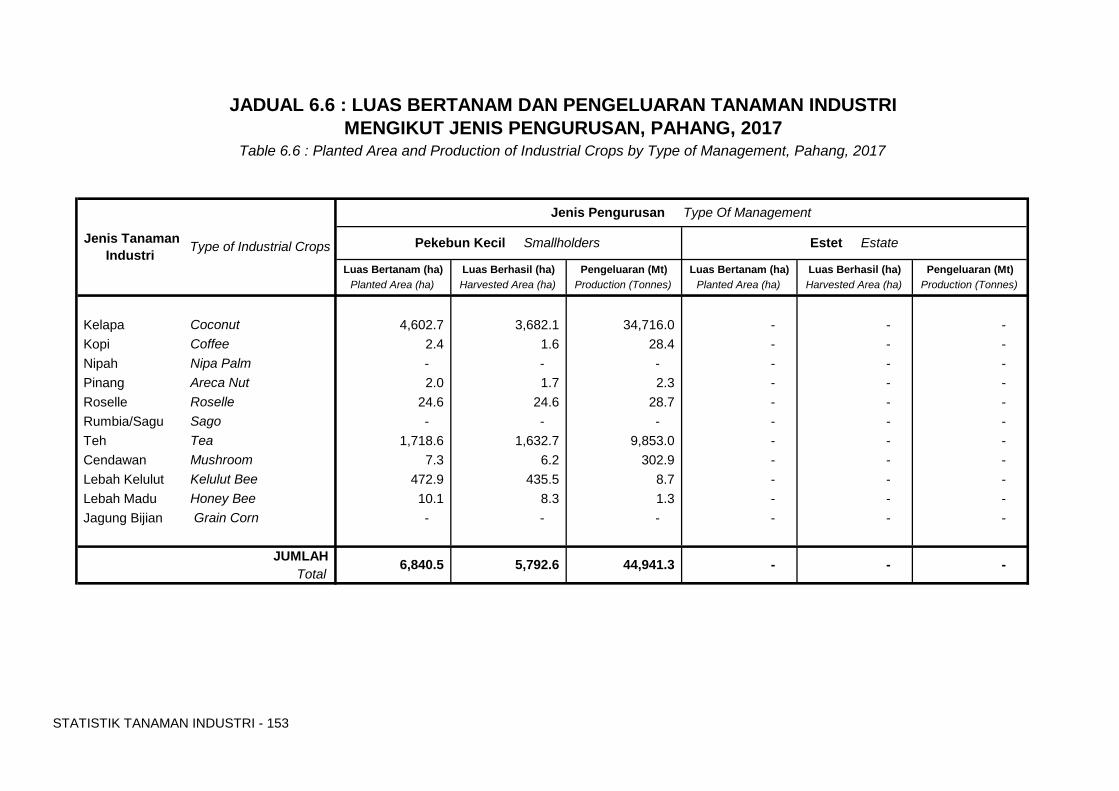
STATISTIK TANAMAN INDUSTRI - 153
Luas Bertanam (ha) Luas Berhasil (ha) Pengeluaran (Mt) Luas Bertanam (ha) Luas Berhasil (ha) Pengeluaran (Mt)Planted Area (ha) Harvested Area (ha) Production (Tonnes) Planted Area (ha) Harvested Area (ha) Production (Tonnes)
Kelapa Coconut 4,602.7 3,682.1 34,716.0 - - - Kopi Coffee 2.4 1.6 28.4 - - - Nipah Nipa Palm - - - - - - Pinang Areca Nut 2.0 1.7 2.3 - - - Roselle Roselle 24.6 24.6 28.7 - - - Rumbia/Sagu Sago - - - - - - Teh Tea 1,718.6 1,632.7 9,853.0 - - - Cendawan Mushroom 7.3 6.2 302.9 - - - Lebah Kelulut Kelulut Bee 472.9 435.5 8.7 - - - Lebah Madu Honey Bee 10.1 8.3 1.3 - - - Jagung Bijian Grain Corn - - - - - -
JADUAL 6.6 : LUAS BERTANAM DAN PENGELUARAN TANAMAN INDUSTRI MENGIKUT JENIS PENGURUSAN, PAHANG, 2017
Table 6.6 : Planted Area and Production of Industrial Crops by Type of Management, Pahang, 2017
JUMLAH
Jenis Tanaman Industri Type of Industrial Crops
Jenis Pengurusan Type Of Management
44,941.3
Pekebun Kecil Smallholders Estet Estate
Total- 6,840.5 5,792.6 - -
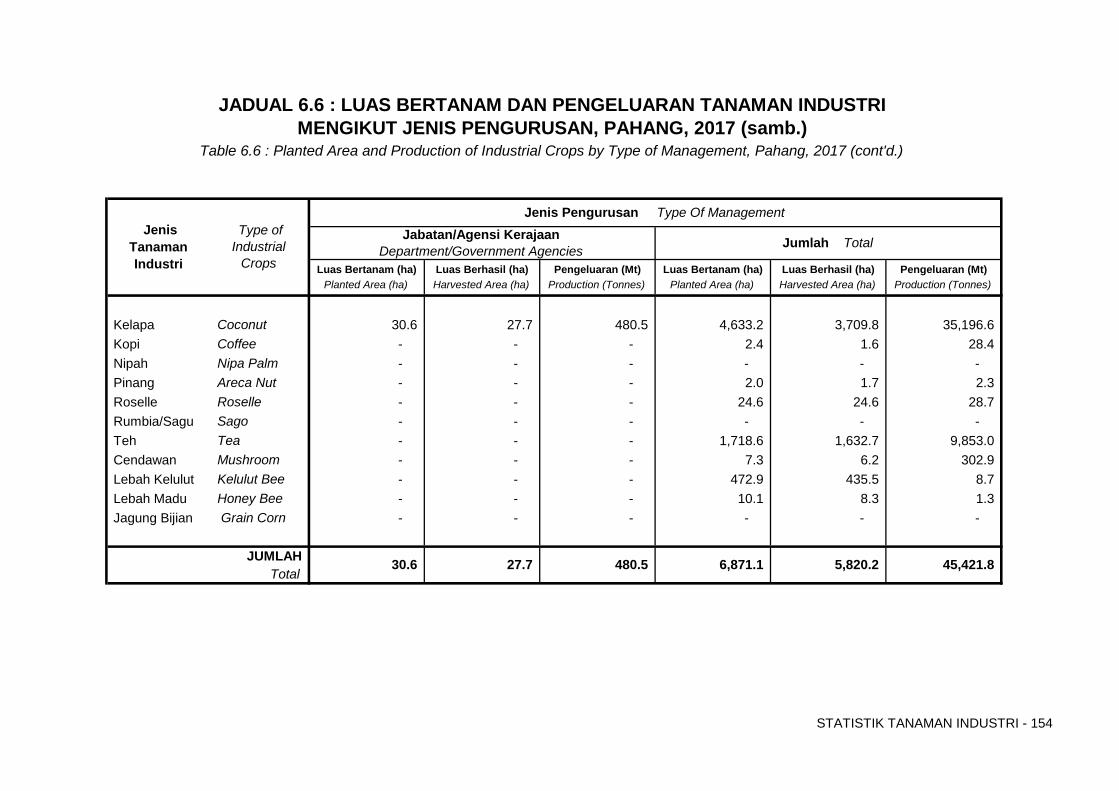
STATISTIK TANAMAN INDUSTRI - 154
Luas Bertanam (ha) Luas Berhasil (ha) Pengeluaran (Mt) Luas Bertanam (ha) Luas Berhasil (ha) Pengeluaran (Mt)Planted Area (ha) Harvested Area (ha) Production (Tonnes) Planted Area (ha) Harvested Area (ha) Production (Tonnes)
Kelapa Coconut 30.6 27.7 480.5 4,633.2 3,709.8 35,196.6 Kopi Coffee - - - 2.4 1.6 28.4 Nipah Nipa Palm - - - - - - Pinang Areca Nut - - - 2.0 1.7 2.3 Roselle Roselle - - - 24.6 24.6 28.7 Rumbia/Sagu Sago - - - - - - Teh Tea - - - 1,718.6 1,632.7 9,853.0 Cendawan Mushroom - - - 7.3 6.2 302.9 Lebah Kelulut Kelulut Bee - - - 472.9 435.5 8.7 Lebah Madu Honey Bee - - - 10.1 8.3 1.3 Jagung Bijian Grain Corn - - - - - -
JADUAL 6.6 : LUAS BERTANAM DAN PENGELUARAN TANAMAN INDUSTRI MENGIKUT JENIS PENGURUSAN, PAHANG, 2017 (samb.)
Table 6.6 : Planted Area and Production of Industrial Crops by Type of Management, Pahang, 2017 (cont'd.)
480.5 30.6 JUMLAH 45,421.8
Type of Industrial
Crops
Jenis Tanaman Industri
Total
Jabatan/Agensi Kerajaan Department/Government Agencies
27.7
Jenis Pengurusan Type Of Management
Jumlah Total
6,871.1 5,820.2
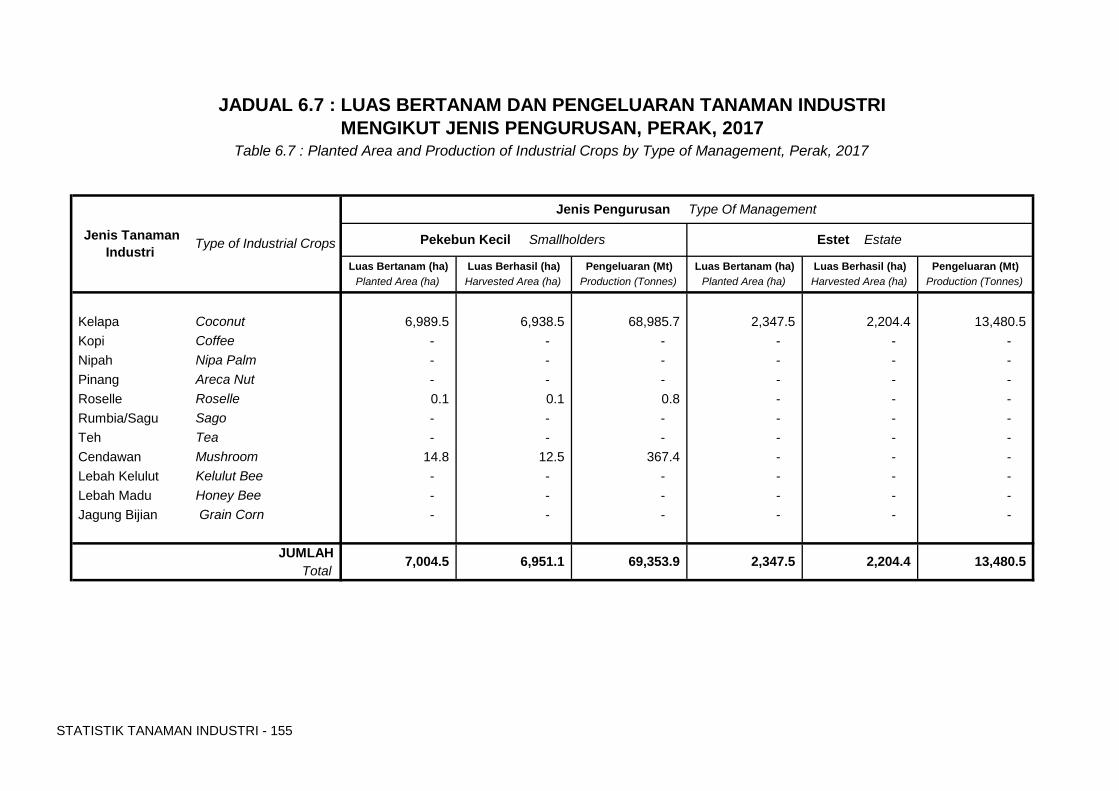
STATISTIK TANAMAN INDUSTRI - 155
Luas Bertanam (ha) Luas Berhasil (ha) Pengeluaran (Mt) Luas Bertanam (ha) Luas Berhasil (ha) Pengeluaran (Mt)Planted Area (ha) Harvested Area (ha) Production (Tonnes) Planted Area (ha) Harvested Area (ha) Production (Tonnes)
Kelapa Coconut 6,989.5 6,938.5 68,985.7 2,347.5 2,204.4 13,480.5 Kopi Coffee - - - - - - Nipah Nipa Palm - - - - - - Pinang Areca Nut - - - - - - Roselle Roselle 0.1 0.1 0.8 - - - Rumbia/Sagu Sago - - - - - - Teh Tea - - - - - - Cendawan Mushroom 14.8 12.5 367.4 - - - Lebah Kelulut Kelulut Bee - - - - - - Lebah Madu Honey Bee - - - - - - Jagung Bijian Grain Corn - - - - - -
JADUAL 6.7 : LUAS BERTANAM DAN PENGELUARAN TANAMAN INDUSTRI MENGIKUT JENIS PENGURUSAN, PERAK, 2017
Table 6.7 : Planted Area and Production of Industrial Crops by Type of Management, Perak, 2017
69,353.9 JUMLAHTotal
7,004.5 6,951.1
Jenis Tanaman Industri Type of Industrial Crops Pekebun Kecil Smallholders
Jenis Pengurusan Type Of Management
2,347.5 2,204.4
Estet Estate
13,480.5
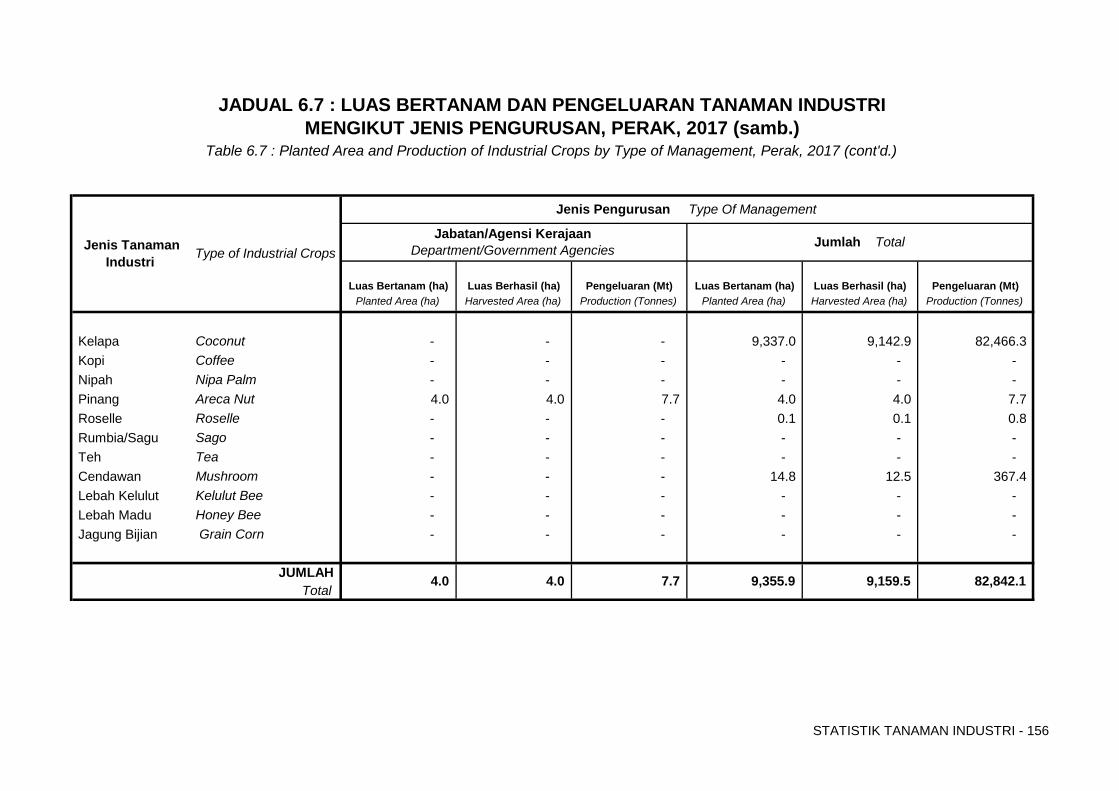
STATISTIK TANAMAN INDUSTRI - 156
Luas Bertanam (ha) Luas Berhasil (ha) Pengeluaran (Mt) Luas Bertanam (ha) Luas Berhasil (ha) Pengeluaran (Mt)Planted Area (ha) Harvested Area (ha) Production (Tonnes) Planted Area (ha) Harvested Area (ha) Production (Tonnes)
Kelapa Coconut - - - 9,337.0 9,142.9 82,466.3 Kopi Coffee - - - - - - Nipah Nipa Palm - - - - - - Pinang Areca Nut 4.0 4.0 7.7 4.0 4.0 7.7 Roselle Roselle - - - 0.1 0.1 0.8 Rumbia/Sagu Sago - - - - - - Teh Tea - - - - - - Cendawan Mushroom - - - 14.8 12.5 367.4 Lebah Kelulut Kelulut Bee - - - - - - Lebah Madu Honey Bee - - - - - - Jagung Bijian Grain Corn - - - - - -
4.0 82,842.1 7.7 4.0 JUMLAHTotal
9,355.9 9,159.5
JADUAL 6.7 : LUAS BERTANAM DAN PENGELUARAN TANAMAN INDUSTRI MENGIKUT JENIS PENGURUSAN, PERAK, 2017 (samb.)
Table 6.7 : Planted Area and Production of Industrial Crops by Type of Management, Perak, 2017 (cont'd.)
Jabatan/Agensi Kerajaan Department/Government Agencies Jenis Tanaman
Industri Type of Industrial Crops
Jenis Pengurusan Type Of Management
Jumlah Total

STATISTIK TANAMAN INDUSTRI - 157
Luas Bertanam (ha) Luas Berhasil (ha) Pengeluaran (Mt) Luas Bertanam (ha) Luas Berhasil (ha) Pengeluaran (Mt)Planted Area (ha) Harvested Area (ha) Production (Tonnes) Planted Area (ha) Harvested Area (ha) Production (Tonnes)
Kelapa Coconut 396.3 396.3 2,734.4 - - - Kopi Coffee - - - - - - Nipah Nipa Palm - - - - - - Pinang Areca Nut - - - - - - Roselle Roselle - - - - - - Rumbia/Sagu Sago - - - - - - Teh Tea - - - - - - Cendawan Mushroom 1.2 1.2 48.0 - - - Lebah Kelulut Kelulut Bee - - - - - - Lebah Madu Honey Bee - - - - - - Jagung Bijian Grain Corn - - - - - -
Jenis Pengurusan Type Of Management
2,782.4
Jenis Tanaman Industri
JADUAL 6.8 : LUAS BERTANAM DAN PENGELUARAN TANAMAN INDUSTRI MENGIKUT JENIS PENGURUSAN, PERLIS, 2017
Table 6.8 : Planted Area and Production of Industrial Crops by Type of Management, Perlis, 2017
Type of Industrial Crops Pekebun Kecil Smallholders Estet Estate
- JUMLAHTotal
- - 397.5 397.5
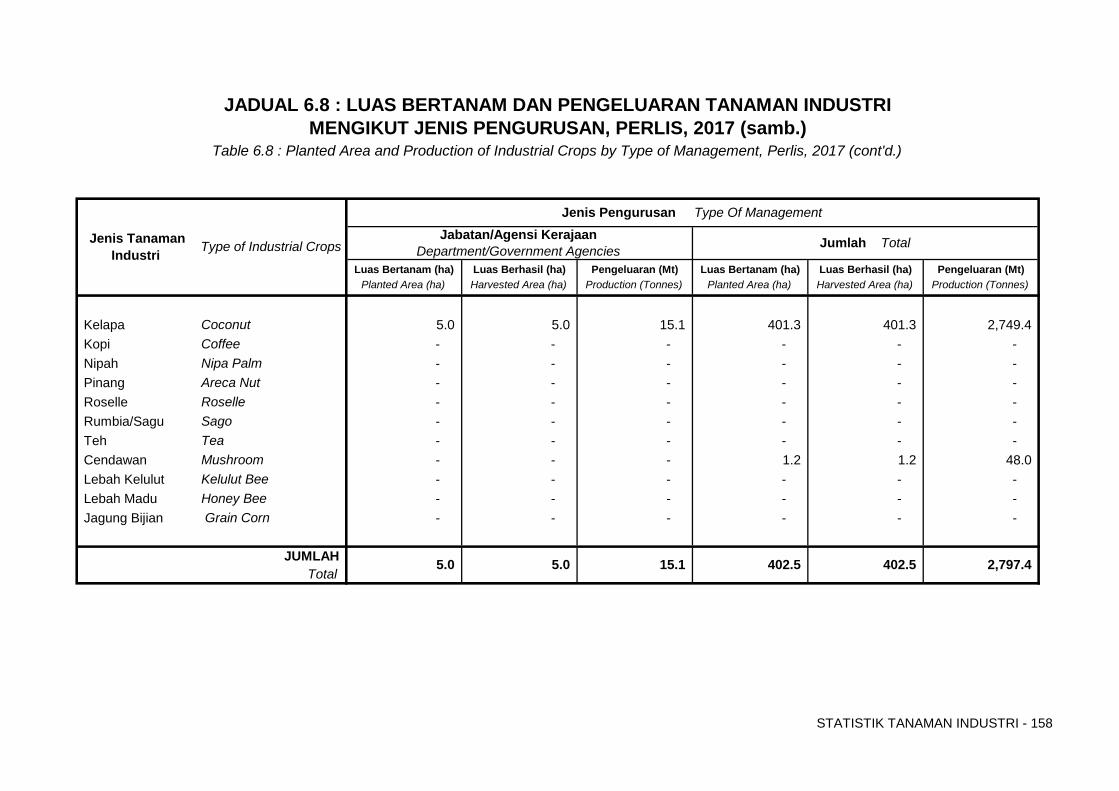
STATISTIK TANAMAN INDUSTRI - 158
Luas Bertanam (ha) Luas Berhasil (ha) Pengeluaran (Mt) Luas Bertanam (ha) Luas Berhasil (ha) Pengeluaran (Mt)Planted Area (ha) Harvested Area (ha) Production (Tonnes) Planted Area (ha) Harvested Area (ha) Production (Tonnes)
Kelapa Coconut 5.0 5.0 15.1 401.3 401.3 2,749.4 Kopi Coffee - - - - - - Nipah Nipa Palm - - - - - - Pinang Areca Nut - - - - - - Roselle Roselle - - - - - - Rumbia/Sagu Sago - - - - - - Teh Tea - - - - - - Cendawan Mushroom - - - 1.2 1.2 48.0 Lebah Kelulut Kelulut Bee - - - - - - Lebah Madu Honey Bee - - - - - - Jagung Bijian Grain Corn - - - - - -
JADUAL 6.8 : LUAS BERTANAM DAN PENGELUARAN TANAMAN INDUSTRI MENGIKUT JENIS PENGURUSAN, PERLIS, 2017 (samb.)
Table 6.8 : Planted Area and Production of Industrial Crops by Type of Management, Perlis, 2017 (cont'd.)
Jenis Tanaman Industri Type of Industrial Crops
Jabatan/Agensi Kerajaan Department/Government Agencies
5.0
Jenis Pengurusan Type Of Management
Jumlah Total
402.5 2,797.4 402.5 15.1 5.0 JUMLAHTotal
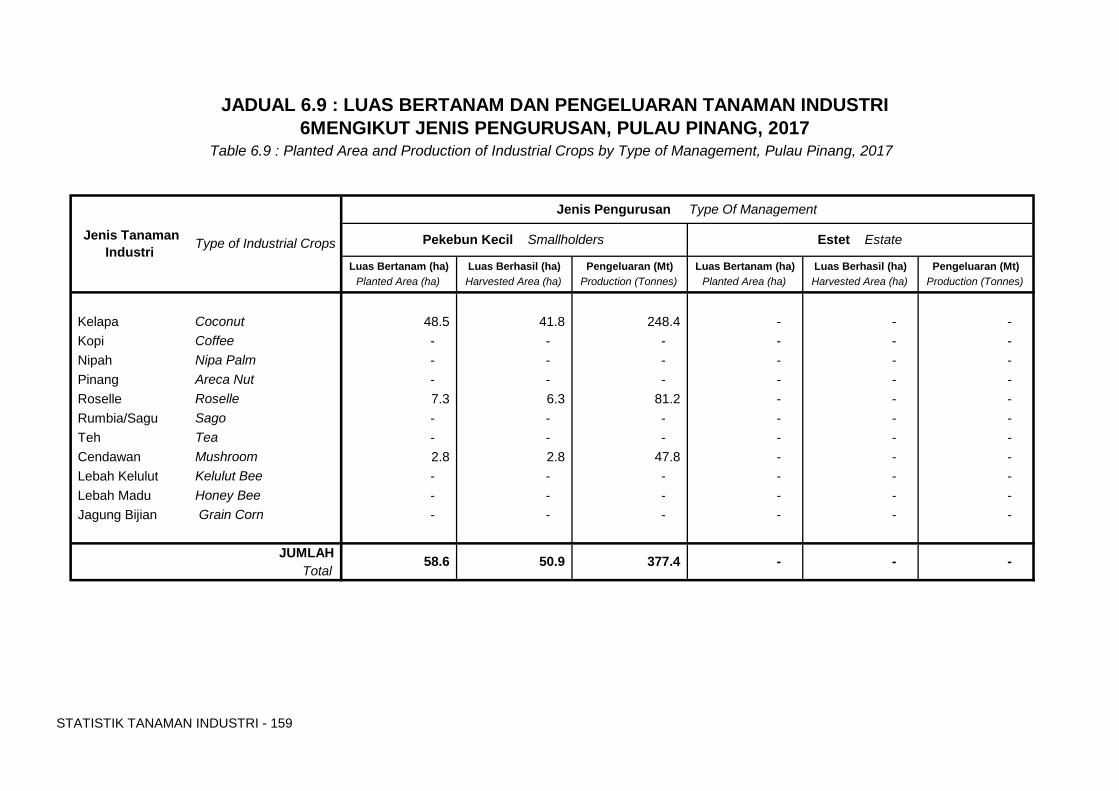
STATISTIK TANAMAN INDUSTRI - 159
Luas Bertanam (ha) Luas Berhasil (ha) Pengeluaran (Mt) Luas Bertanam (ha) Luas Berhasil (ha) Pengeluaran (Mt)Planted Area (ha) Harvested Area (ha) Production (Tonnes) Planted Area (ha) Harvested Area (ha) Production (Tonnes)
Kelapa Coconut 48.5 41.8 248.4 - - - Kopi Coffee - - - - - - Nipah Nipa Palm - - - - - - Pinang Areca Nut - - - - - - Roselle Roselle 7.3 6.3 81.2 - - - Rumbia/Sagu Sago - - - - - - Teh Tea - - - - - - Cendawan Mushroom 2.8 2.8 47.8 - - - Lebah Kelulut Kelulut Bee - - - - - - Lebah Madu Honey Bee - - - - - - Jagung Bijian Grain Corn - - - - - -
Jenis Pengurusan Type Of Management
JADUAL 6.9 : LUAS BERTANAM DAN PENGELUARAN TANAMAN INDUSTRI 6MENGIKUT JENIS PENGURUSAN, PULAU PINANG, 2017
Table 6.9 : Planted Area and Production of Industrial Crops by Type of Management, Pulau Pinang, 2017
Total
Estet Estate
377.4 - - -
Jenis Tanaman Industri Type of Industrial Crops
58.6 50.9
Pekebun Kecil Smallholders
JUMLAH
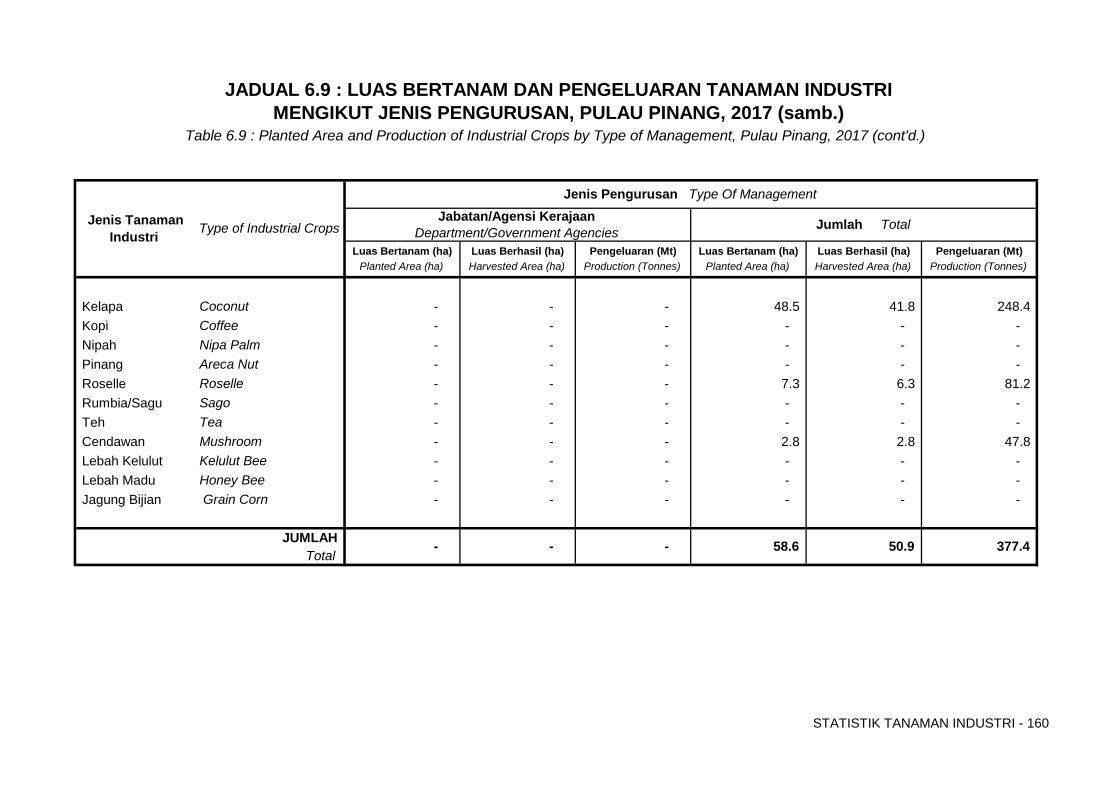
STATISTIK TANAMAN INDUSTRI - 160
Luas Bertanam (ha) Luas Berhasil (ha) Pengeluaran (Mt) Luas Bertanam (ha) Luas Berhasil (ha) Pengeluaran (Mt)Planted Area (ha) Harvested Area (ha) Production (Tonnes) Planted Area (ha) Harvested Area (ha) Production (Tonnes)
Kelapa Coconut - - - 48.5 41.8 248.4 Kopi Coffee - - - - - - Nipah Nipa Palm - - - - - - Pinang Areca Nut - - - - - - Roselle Roselle - - - 7.3 6.3 81.2 Rumbia/Sagu Sago - - - - - - Teh Tea - - - - - - Cendawan Mushroom - - - 2.8 2.8 47.8 Lebah Kelulut Kelulut Bee - - - - - - Lebah Madu Honey Bee - - - - - - Jagung Bijian Grain Corn - - - - - -
- 377.4 JUMLAHTotal
50.9 58.6 - -
JADUAL 6.9 : LUAS BERTANAM DAN PENGELUARAN TANAMAN INDUSTRI MENGIKUT JENIS PENGURUSAN, PULAU PINANG, 2017 (samb.)
Table 6.9 : Planted Area and Production of Industrial Crops by Type of Management, Pulau Pinang, 2017 (cont'd.)
Jenis Tanaman Industri Type of Industrial Crops
Jenis Pengurusan Type Of Management
Jumlah TotalJabatan/Agensi Kerajaan Department/Government Agencies
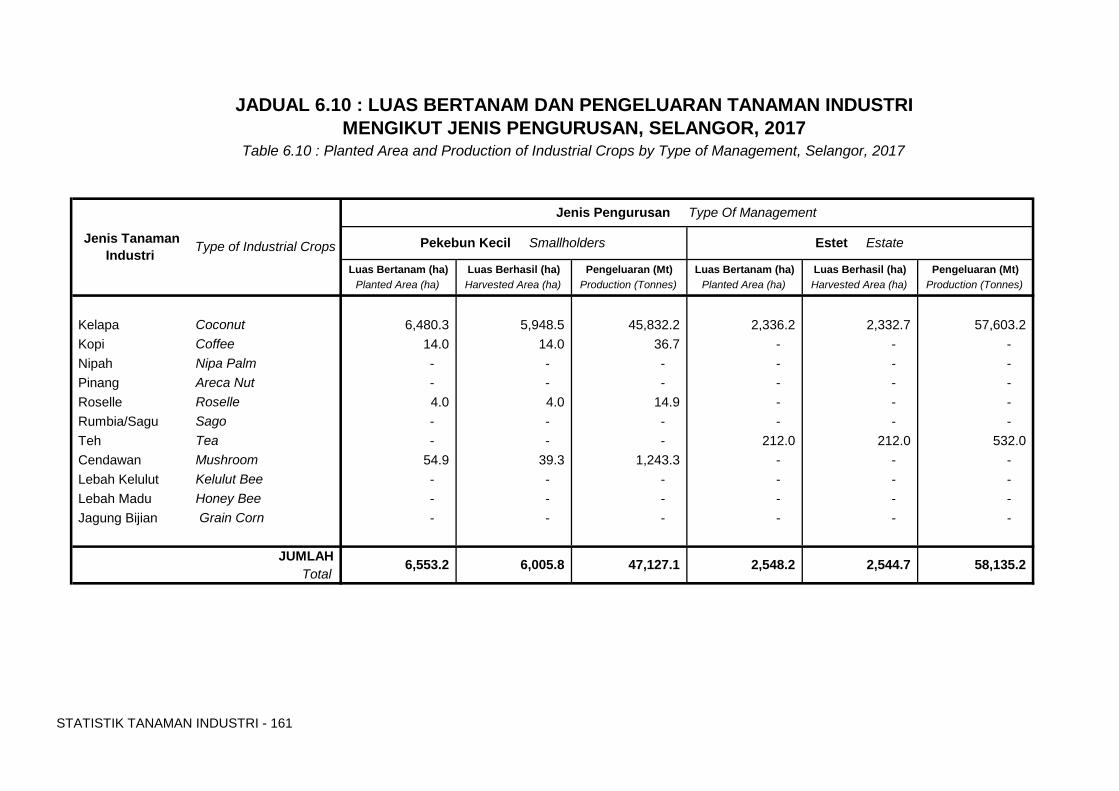
STATISTIK TANAMAN INDUSTRI - 161
Luas Bertanam (ha) Luas Berhasil (ha) Pengeluaran (Mt) Luas Bertanam (ha) Luas Berhasil (ha) Pengeluaran (Mt)Planted Area (ha) Harvested Area (ha) Production (Tonnes) Planted Area (ha) Harvested Area (ha) Production (Tonnes)
Kelapa Coconut 6,480.3 5,948.5 45,832.2 2,336.2 2,332.7 57,603.2 Kopi Coffee 14.0 14.0 36.7 - - - Nipah Nipa Palm - - - - - - Pinang Areca Nut - - - - - - Roselle Roselle 4.0 4.0 14.9 - - - Rumbia/Sagu Sago - - - - - - Teh Tea - - - 212.0 212.0 532.0 Cendawan Mushroom 54.9 39.3 1,243.3 - - - Lebah Kelulut Kelulut Bee - - - - - - Lebah Madu Honey Bee - - - - - - Jagung Bijian Grain Corn - - - - - -
Pekebun Kecil Smallholders
Jenis Pengurusan Type Of Management
JADUAL 6.10 : LUAS BERTANAM DAN PENGELUARAN TANAMAN INDUSTRI MENGIKUT JENIS PENGURUSAN, SELANGOR, 2017
Table 6.10 : Planted Area and Production of Industrial Crops by Type of Management, Selangor, 2017
JUMLAH 2,544.7
Estet Estate
Total6,553.2 6,005.8 2,548.2 58,135.2 47,127.1
Jenis Tanaman Industri Type of Industrial Crops
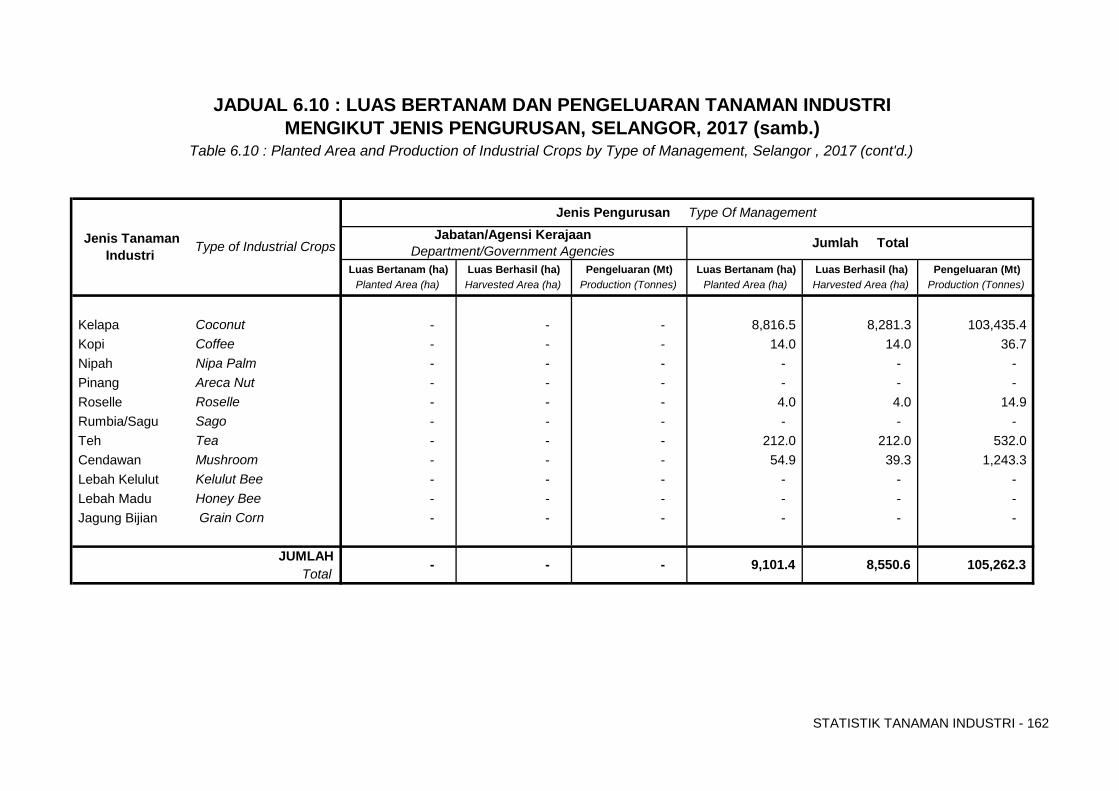
STATISTIK TANAMAN INDUSTRI - 162
Luas Bertanam (ha) Luas Berhasil (ha) Pengeluaran (Mt) Luas Bertanam (ha) Luas Berhasil (ha) Pengeluaran (Mt) Planted Area (ha) Harvested Area (ha) Production (Tonnes) Planted Area (ha) Harvested Area (ha) Production (Tonnes)
Kelapa Coconut - - - 8,816.5 8,281.3 103,435.4 Kopi Coffee - - - 14.0 14.0 36.7 Nipah Nipa Palm - - - - - - Pinang Areca Nut - - - - - - Roselle Roselle - - - 4.0 4.0 14.9 Rumbia/Sagu Sago - - - - - - Teh Tea - - - 212.0 212.0 532.0 Cendawan Mushroom - - - 54.9 39.3 1,243.3 Lebah Kelulut Kelulut Bee - - - - - - Lebah Madu Honey Bee - - - - - - Jagung Bijian Grain Corn - - - - - -
- Total
9,101.4 8,550.6 - - JUMLAH
JADUAL 6.10 : LUAS BERTANAM DAN PENGELUARAN TANAMAN INDUSTRI MENGIKUT JENIS PENGURUSAN, SELANGOR, 2017 (samb.)
Table 6.10 : Planted Area and Production of Industrial Crops by Type of Management, Selangor , 2017 (cont'd.)
105,262.3
Jabatan/Agensi Kerajaan Department/Government Agencies
Jenis Tanaman Industri Type of Industrial Crops
Jenis Pengurusan Type Of Management
Jumlah Total
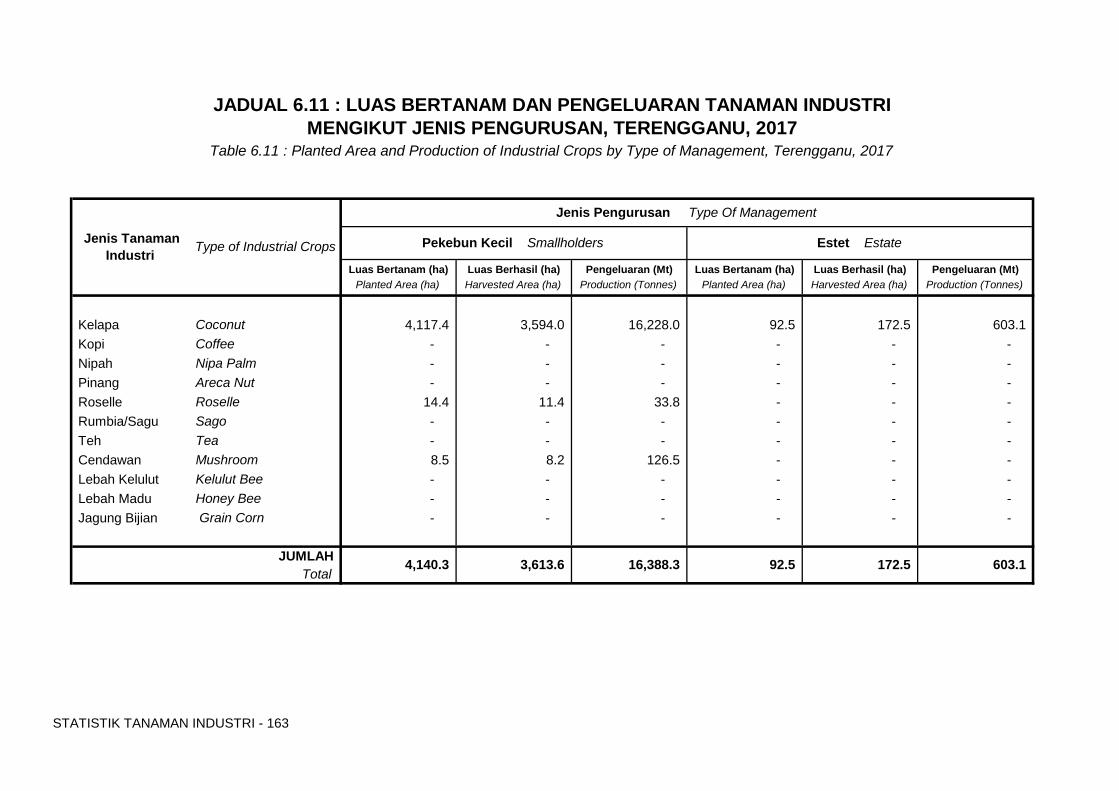
STATISTIK TANAMAN INDUSTRI - 163
Luas Bertanam (ha) Luas Berhasil (ha) Pengeluaran (Mt) Luas Bertanam (ha) Luas Berhasil (ha) Pengeluaran (Mt)Planted Area (ha) Harvested Area (ha) Production (Tonnes) Planted Area (ha) Harvested Area (ha) Production (Tonnes)
Kelapa Coconut 4,117.4 3,594.0 16,228.0 92.5 172.5 603.1 Kopi Coffee - - - - - - Nipah Nipa Palm - - - - - - Pinang Areca Nut - - - - - - Roselle Roselle 14.4 11.4 33.8 - - - Rumbia/Sagu Sago - - - - - - Teh Tea - - - - - - Cendawan Mushroom 8.5 8.2 126.5 - - - Lebah Kelulut Kelulut Bee - - - - - - Lebah Madu Honey Bee - - - - - - Jagung Bijian Grain Corn - - - - - -
JUMLAHTotal
Jenis Tanaman Industri Type of Industrial Crops
Jenis Pengurusan Type Of Management
16,388.3 172.5 92.5 603.1 4,140.3 3,613.6
JADUAL 6.11 : LUAS BERTANAM DAN PENGELUARAN TANAMAN INDUSTRI MENGIKUT JENIS PENGURUSAN, TERENGGANU, 2017
Table 6.11 : Planted Area and Production of Industrial Crops by Type of Management, Terengganu, 2017
Pekebun Kecil Smallholders Estet Estate
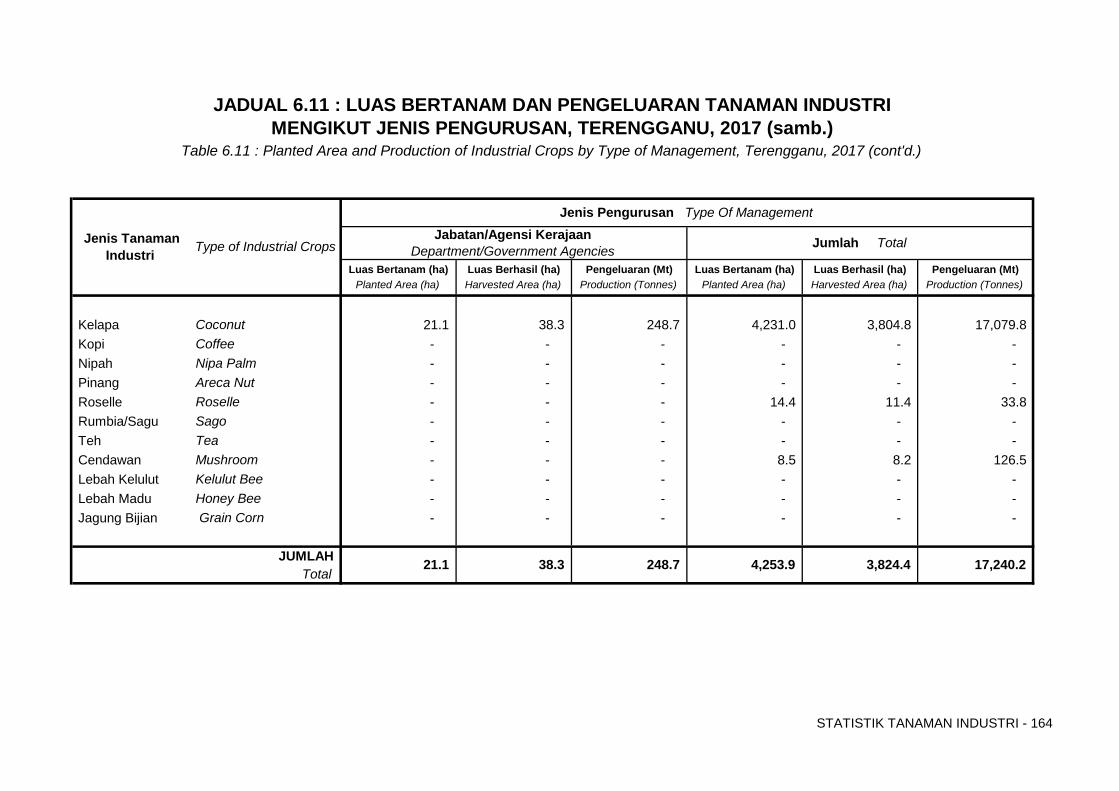
STATISTIK TANAMAN INDUSTRI - 164
Luas Bertanam (ha) Luas Berhasil (ha) Pengeluaran (Mt) Luas Bertanam (ha) Luas Berhasil (ha) Pengeluaran (Mt)Planted Area (ha) Harvested Area (ha) Production (Tonnes) Planted Area (ha) Harvested Area (ha) Production (Tonnes)
Kelapa Coconut 21.1 38.3 248.7 4,231.0 3,804.8 17,079.8 Kopi Coffee - - - - - - Nipah Nipa Palm - - - - - - Pinang Areca Nut - - - - - - Roselle Roselle - - - 14.4 11.4 33.8 Rumbia/Sagu Sago - - - - - - Teh Tea - - - - - - Cendawan Mushroom - - - 8.5 8.2 126.5 Lebah Kelulut Kelulut Bee - - - - - - Lebah Madu Honey Bee - - - - - - Jagung Bijian Grain Corn - - - - - -
JADUAL 6.11 : LUAS BERTANAM DAN PENGELUARAN TANAMAN INDUSTRI MENGIKUT JENIS PENGURUSAN, TERENGGANU, 2017 (samb.)
Table 6.11 : Planted Area and Production of Industrial Crops by Type of Management, Terengganu, 2017 (cont'd.)
Jumlah TotalJabatan/Agensi Kerajaan Department/Government Agencies
Jenis Tanaman Industri Type of Industrial Crops
Jenis Pengurusan Type Of Management
JUMLAHTotal
4,253.9 3,824.4 21.1 17,240.2 248.7 38.3
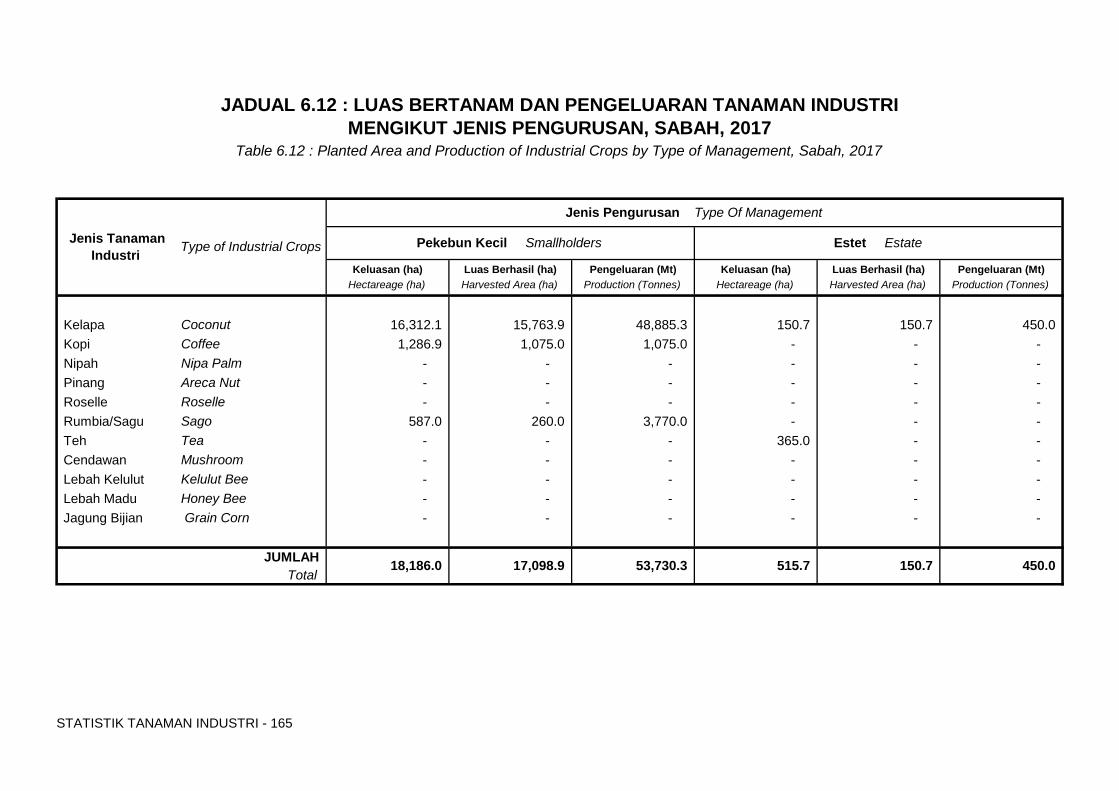
STATISTIK TANAMAN INDUSTRI - 165
Keluasan (ha) Luas Berhasil (ha) Pengeluaran (Mt) Keluasan (ha) Luas Berhasil (ha) Pengeluaran (Mt)Hectareage (ha) Harvested Area (ha) Production (Tonnes) Hectareage (ha) Harvested Area (ha) Production (Tonnes)
Kelapa Coconut 16,312.1 15,763.9 48,885.3 150.7 150.7 450.0 Kopi Coffee 1,286.9 1,075.0 1,075.0 - - - Nipah Nipa Palm - - - - - - Pinang Areca Nut - - - - - - Roselle Roselle - - - - - - Rumbia/Sagu Sago 587.0 260.0 3,770.0 - - - Teh Tea - - - 365.0 - - Cendawan Mushroom - - - - - - Lebah Kelulut Kelulut Bee - - - - - - Lebah Madu Honey Bee - - - - - - Jagung Bijian Grain Corn - - - - - -
JADUAL 6.12 : LUAS BERTANAM DAN PENGELUARAN TANAMAN INDUSTRI MENGIKUT JENIS PENGURUSAN, SABAH, 2017
Table 6.12 : Planted Area and Production of Industrial Crops by Type of Management, Sabah, 2017
Estet Estate
515.7 150.7
Jenis Pengurusan Type Of Management
450.0 17,098.9 Total
Jenis Tanaman Industri Type of Industrial Crops
18,186.0 JUMLAH
Pekebun Kecil Smallholders
53,730.3
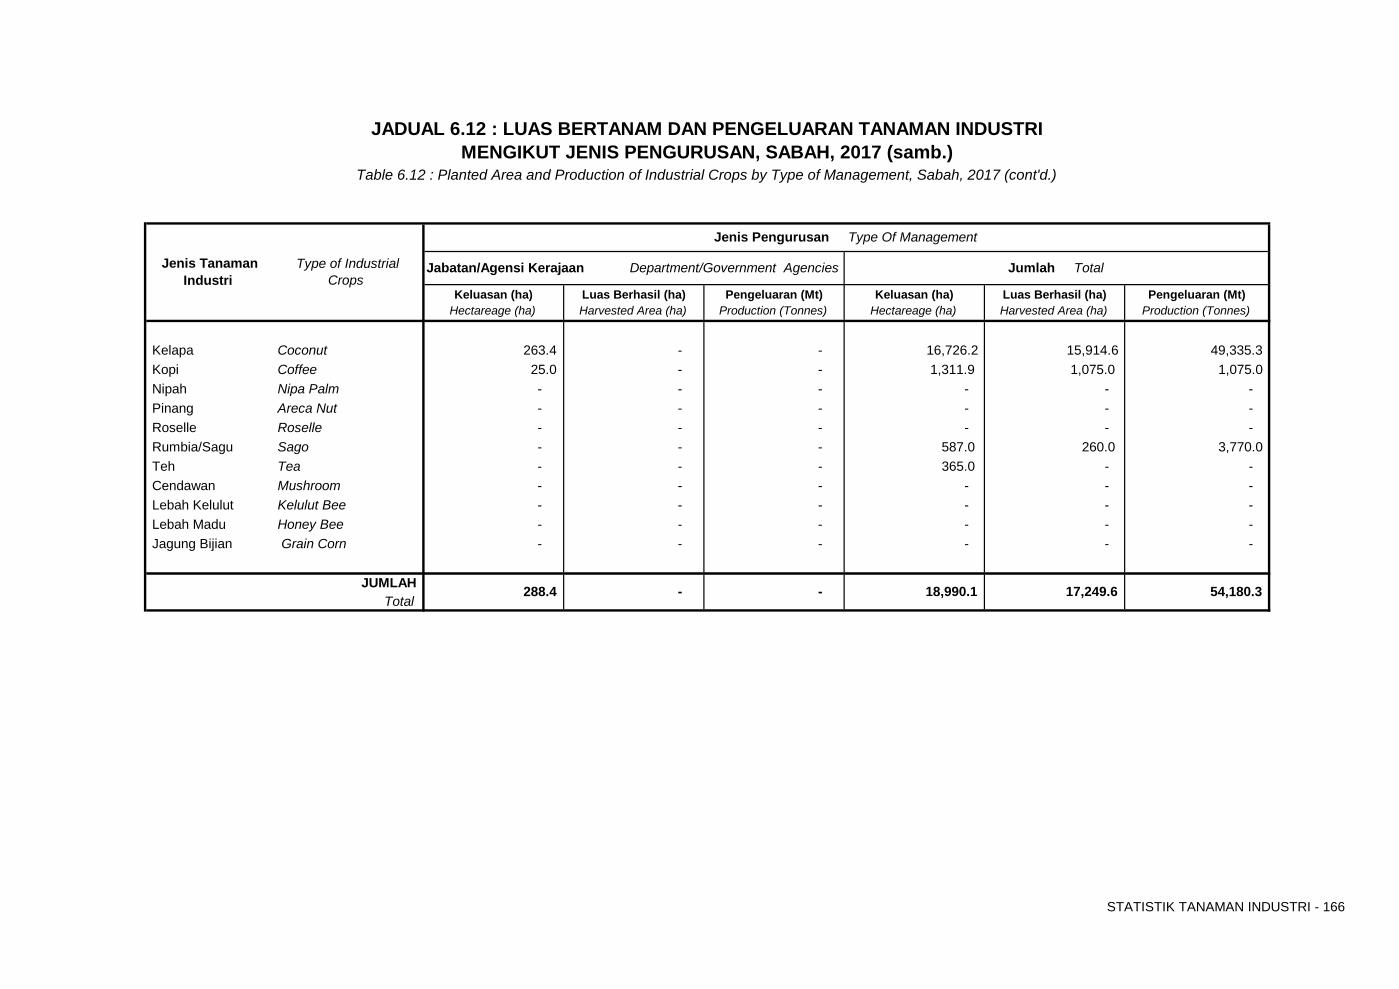
STATISTIK TANAMAN INDUSTRI - 166
Keluasan (ha) Luas Berhasil (ha) Pengeluaran (Mt) Keluasan (ha) Luas Berhasil (ha) Pengeluaran (Mt)Hectareage (ha) Harvested Area (ha) Production (Tonnes) Hectareage (ha) Harvested Area (ha) Production (Tonnes)
Kelapa Coconut 263.4 - - 16,726.2 15,914.6 49,335.3 Kopi Coffee 25.0 - - 1,311.9 1,075.0 1,075.0 Nipah Nipa Palm - - - - - - Pinang Areca Nut - - - - - - Roselle Roselle - - - - - - Rumbia/Sagu Sago - - - 587.0 260.0 3,770.0 Teh Tea - - - 365.0 - - Cendawan Mushroom - - - - - - Lebah Kelulut Kelulut Bee - - - - - - Lebah Madu Honey Bee - - - - - - Jagung Bijian Grain Corn - - - - - -
JADUAL 6.12 : LUAS BERTANAM DAN PENGELUARAN TANAMAN INDUSTRI
18,990.1 - -
MENGIKUT JENIS PENGURUSAN, SABAH, 2017 (samb.)Table 6.12 : Planted Area and Production of Industrial Crops by Type of Management, Sabah, 2017 (cont'd.)
Jumlah Total
JUMLAHTotal
17,249.6
Jenis Pengurusan Type Of Management
Jabatan/Agensi Kerajaan Department/Government Agencies Jenis Tanaman Industri
Type of Industrial Crops
288.4 54,180.3
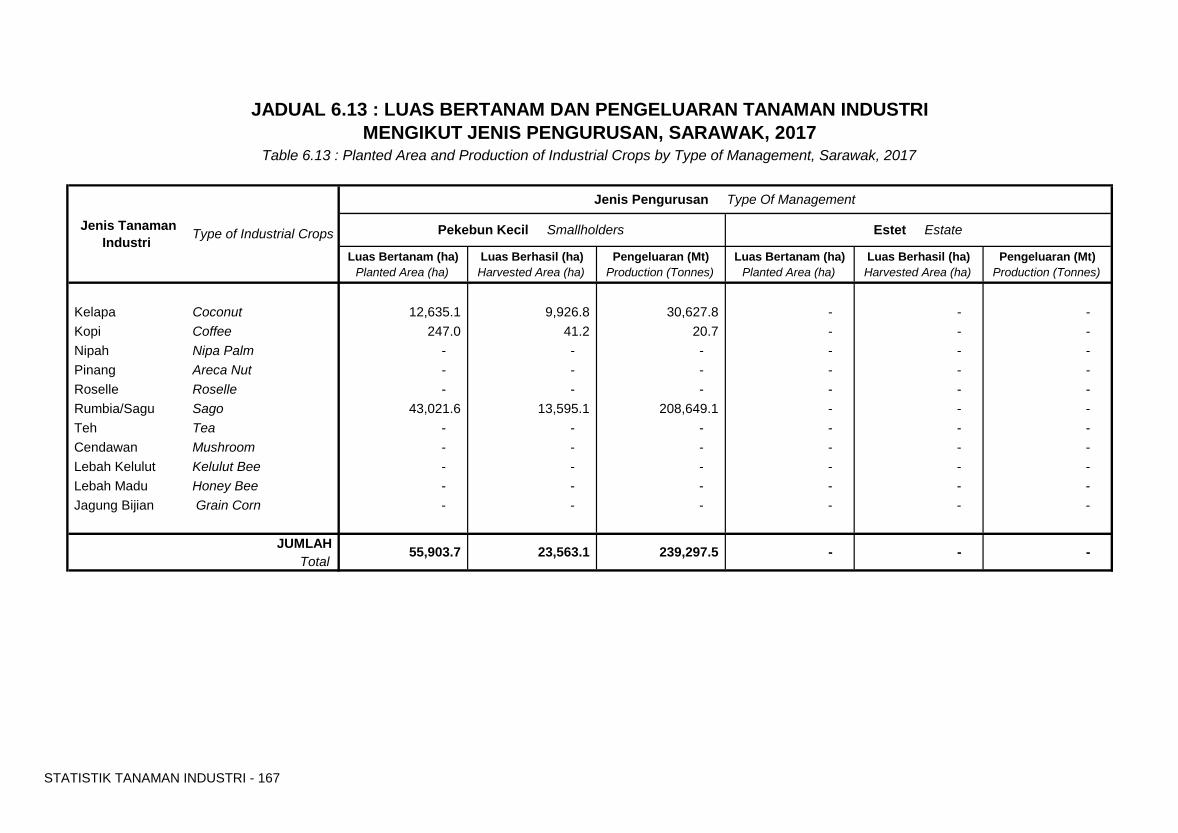
STATISTIK TANAMAN INDUSTRI - 167
Luas Bertanam (ha) Luas Berhasil (ha) Pengeluaran (Mt) Luas Bertanam (ha) Luas Berhasil (ha) Pengeluaran (Mt)Planted Area (ha) Harvested Area (ha) Production (Tonnes) Planted Area (ha) Harvested Area (ha) Production (Tonnes)
Kelapa Coconut 12,635.1 9,926.8 30,627.8 - - - Kopi Coffee 247.0 41.2 20.7 - - - Nipah Nipa Palm - - - - - - Pinang Areca Nut - - - - - - Roselle Roselle - - - - - - Rumbia/Sagu Sago 43,021.6 13,595.1 208,649.1 - - - Teh Tea - - - - - - Cendawan Mushroom - - - - - - Lebah Kelulut Kelulut Bee - - - - - - Lebah Madu Honey Bee - - - - - - Jagung Bijian Grain Corn - - - - - -
JADUAL 6.13 : LUAS BERTANAM DAN PENGELUARAN TANAMAN INDUSTRI MENGIKUT JENIS PENGURUSAN, SARAWAK, 2017
Table 6.13 : Planted Area and Production of Industrial Crops by Type of Management, Sarawak, 2017
239,297.5 - -
Estet Estate
Jenis Pengurusan Type Of Management
JUMLAHTotal
Jenis Tanaman Industri Type of Industrial Crops Pekebun Kecil Smallholders
- 55,903.7 23,563.1
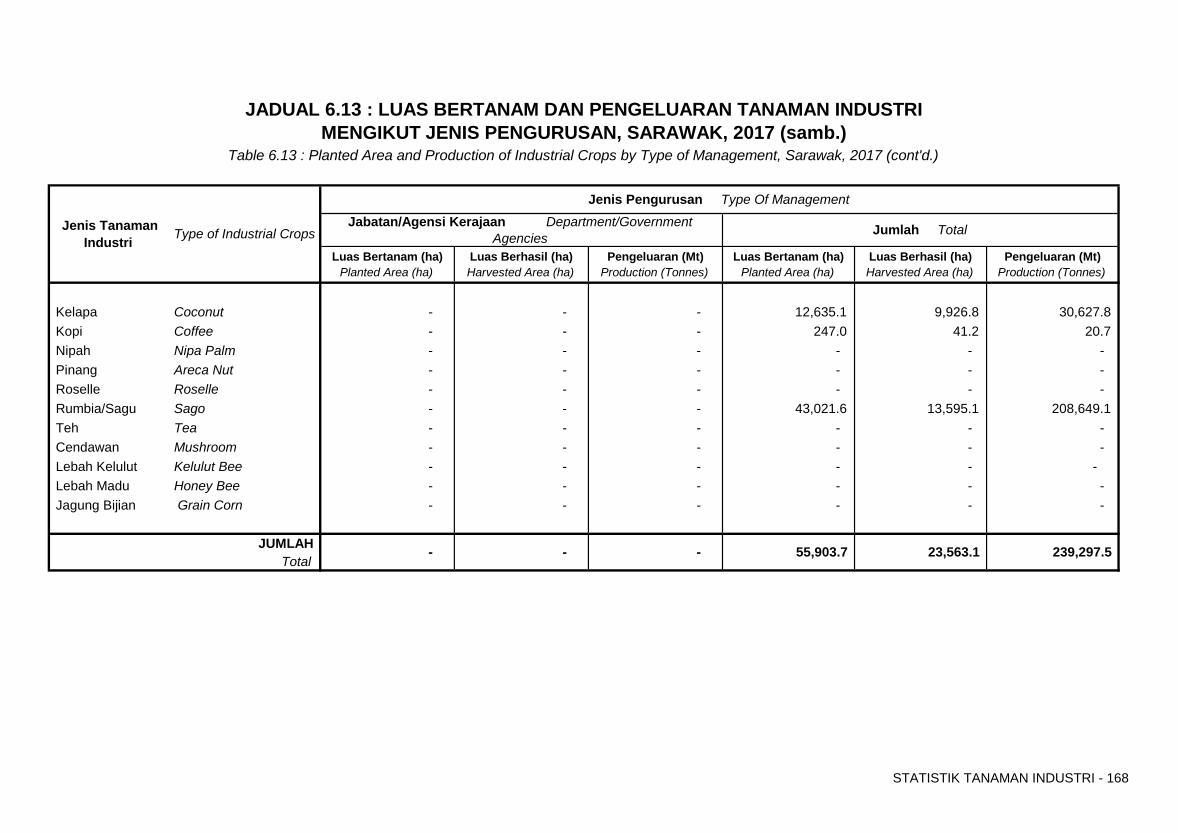
STATISTIK TANAMAN INDUSTRI - 168
Luas Bertanam (ha) Luas Berhasil (ha) Pengeluaran (Mt) Luas Bertanam (ha) Luas Berhasil (ha) Pengeluaran (Mt)Planted Area (ha) Harvested Area (ha) Production (Tonnes) Planted Area (ha) Harvested Area (ha) Production (Tonnes)
Kelapa Coconut - - - 12,635.1 9,926.8 30,627.8 Kopi Coffee - - - 247.0 41.2 20.7 Nipah Nipa Palm - - - - - - Pinang Areca Nut - - - - - - Roselle Roselle - - - - - - Rumbia/Sagu Sago - - - 43,021.6 13,595.1 208,649.1 Teh Tea - - - - - - Cendawan Mushroom - - - - - - Lebah Kelulut Kelulut Bee - - - - - - Lebah Madu Honey Bee - - - - - - Jagung Bijian Grain Corn - - - - - -
JUMLAH - 239,297.5 - 55,903.7 - 23,563.1 Total
JADUAL 6.13 : LUAS BERTANAM DAN PENGELUARAN TANAMAN INDUSTRI MENGIKUT JENIS PENGURUSAN, SARAWAK, 2017 (samb.)
Table 6.13 : Planted Area and Production of Industrial Crops by Type of Management, Sarawak, 2017 (cont'd.)
Type of Industrial Crops
Jenis Pengurusan Type Of Management
Jenis Tanaman Industri
Jumlah TotalJabatan/Agensi Kerajaan Department/Government Agencies
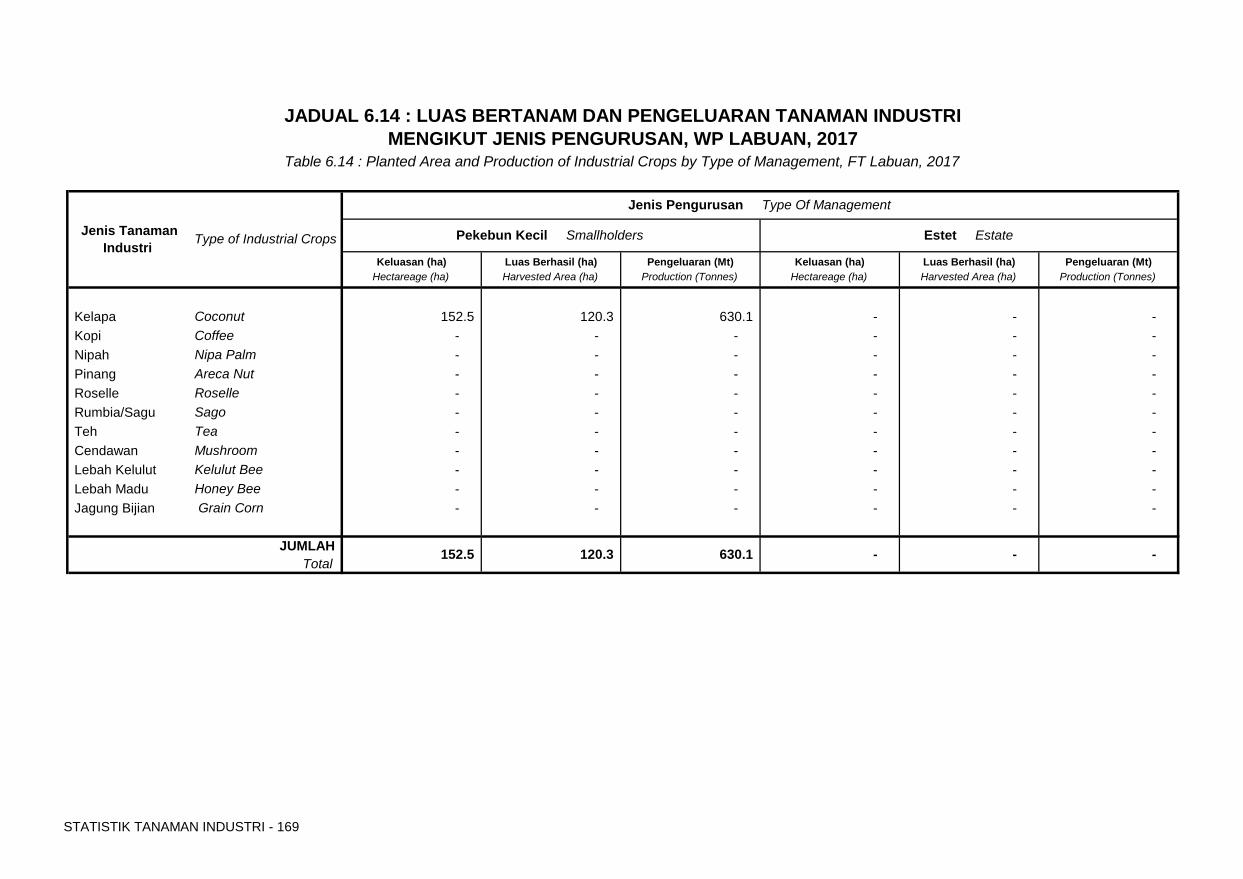
STATISTIK TANAMAN INDUSTRI - 169
Keluasan (ha) Luas Berhasil (ha) Pengeluaran (Mt) Keluasan (ha) Luas Berhasil (ha) Pengeluaran (Mt)Hectareage (ha) Harvested Area (ha) Production (Tonnes) Hectareage (ha) Harvested Area (ha) Production (Tonnes)
Kelapa Coconut 152.5 120.3 630.1 - - - Kopi Coffee - - - - - - Nipah Nipa Palm - - - - - - Pinang Areca Nut - - - - - - Roselle Roselle - - - - - - Rumbia/Sagu Sago - - - - - - Teh Tea - - - - - - Cendawan Mushroom - - - - - - Lebah Kelulut Kelulut Bee - - - - - - Lebah Madu Honey Bee - - - - - - Jagung Bijian Grain Corn - - - - - -
- - -
JADUAL 6.14 : LUAS BERTANAM DAN PENGELUARAN TANAMAN INDUSTRI MENGIKUT JENIS PENGURUSAN, WP LABUAN, 2017
Table 6.14 : Planted Area and Production of Industrial Crops by Type of Management, FT Labuan, 2017
Estet Estate
Jenis Pengurusan Type Of Management
152.5 120.3
Pekebun Kecil Smallholders
JUMLAHTotal
Jenis Tanaman Industri Type of Industrial Crops
630.1
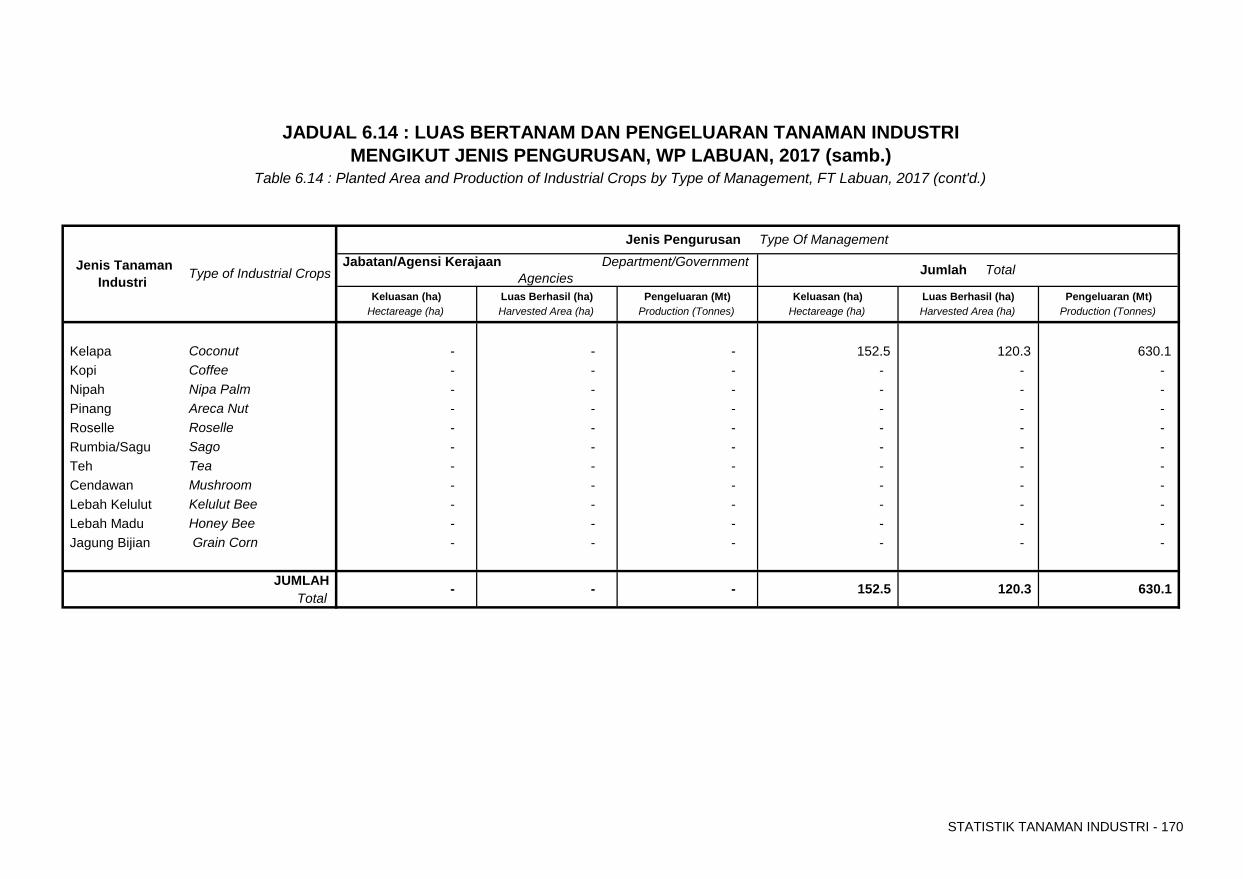
STATISTIK TANAMAN INDUSTRI - 170
Keluasan (ha) Luas Berhasil (ha) Pengeluaran (Mt) Keluasan (ha) Luas Berhasil (ha) Pengeluaran (Mt)Hectareage (ha) Harvested Area (ha) Production (Tonnes) Hectareage (ha) Harvested Area (ha) Production (Tonnes)
Kelapa Coconut - - - 152.5 120.3 630.1 Kopi Coffee - - - - - - Nipah Nipa Palm - - - - - - Pinang Areca Nut - - - - - - Roselle Roselle - - - - - - Rumbia/Sagu Sago - - - - - - Teh Tea - - - - - - Cendawan Mushroom - - - - - - Lebah Kelulut Kelulut Bee - - - - - - Lebah Madu Honey Bee - - - - - - Jagung Bijian Grain Corn - - - - - -
JADUAL 6.14 : LUAS BERTANAM DAN PENGELUARAN TANAMAN INDUSTRI MENGIKUT JENIS PENGURUSAN, WP LABUAN, 2017 (samb.)
Table 6.14 : Planted Area and Production of Industrial Crops by Type of Management, FT Labuan, 2017 (cont'd.)
Jumlah TotalJabatan/Agensi Kerajaan Department/Government Agencies
Jenis Tanaman Industri Type of Industrial Crops
Jenis Pengurusan Type Of Management
- 630.1 JUMLAHTotal
120.3 152.5 - -

Muka surat ini sengaja dibiarkan kosong
SEKSYEN 7 Section 7
DATA SIRI MASA – RINGKASAN LUAS BERTANAM
DAN PENGELUARAN TANAMAN INDUSTRI, MALAYSIA, 2013 – 2017
Time Series Data – Summary of Planted Area and Production
Of Industrial Crops, Malaysia, 2013 – 2017
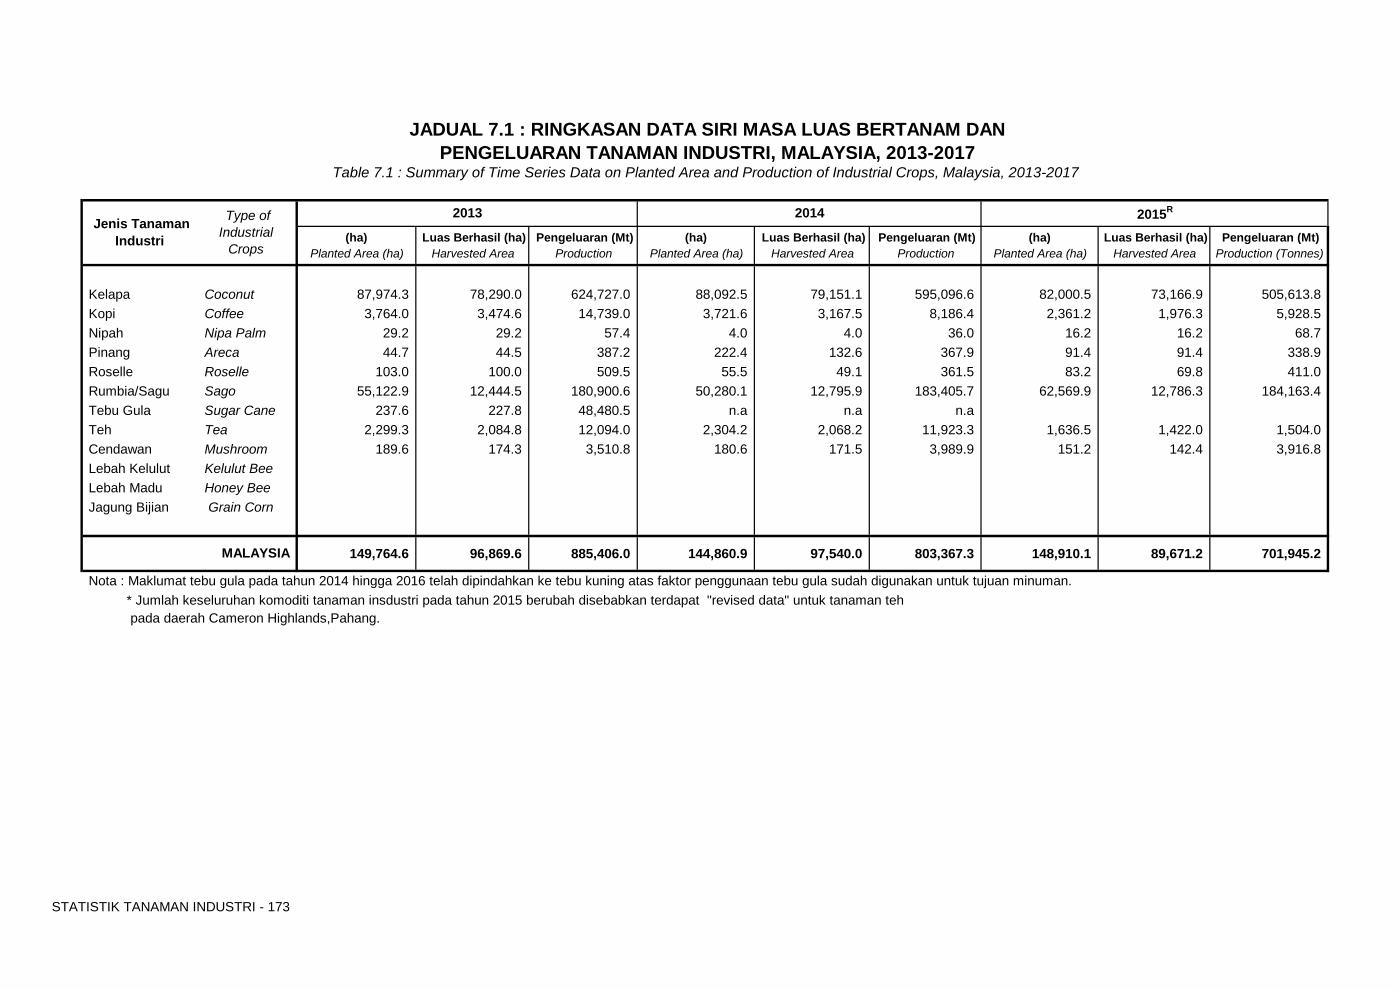
STATISTIK TANAMAN INDUSTRI - 173
(ha) Luas Berhasil (ha) Pengeluaran (Mt)
(ha) Luas Berhasil (ha) Pengeluaran (Mt)
(ha) Luas Berhasil (ha) Pengeluaran (Mt)
Planted Area (ha) Harvested Area (h )
Production (T )
Planted Area (ha) Harvested Area (h )
Production (T )
Planted Area (ha) Harvested Area (h )
Production (Tonnes)
Kelapa Coconut 87,974.3 78,290.0 624,727.0 88,092.5 79,151.1 595,096.6 82,000.5 73,166.9 505,613.8 Kopi Coffee 3,764.0 3,474.6 14,739.0 3,721.6 3,167.5 8,186.4 2,361.2 1,976.3 5,928.5 Nipah Nipa Palm 29.2 29.2 57.4 4.0 4.0 36.0 16.2 16.2 68.7 Pinang Areca 44.7 44.5 387.2 222.4 132.6 367.9 91.4 91.4 338.9 Roselle Roselle 103.0 100.0 509.5 55.5 49.1 361.5 83.2 69.8 411.0 Rumbia/Sagu Sago 55,122.9 12,444.5 180,900.6 50,280.1 12,795.9 183,405.7 62,569.9 12,786.3 184,163.4 Tebu Gula Sugar Cane 237.6 227.8 48,480.5 n.a n.a n.aTeh Tea 2,299.3 2,084.8 12,094.0 2,304.2 2,068.2 11,923.3 1,636.5 1,422.0 1,504.0 Cendawan Mushroom 189.6 174.3 3,510.8 180.6 171.5 3,989.9 151.2 142.4 3,916.8 Lebah Kelulut Kelulut BeeLebah Madu Honey BeeJagung Bijian Grain Corn
149,764.6 96,869.6 885,406.0 144,860.9 97,540.0 803,367.3 148,910.1 89,671.2 701,945.2
Nota : Maklumat tebu gula pada tahun 2014 hingga 2016 telah dipindahkan ke tebu kuning atas faktor penggunaan tebu gula sudah digunakan untuk tujuan minuman. * Jumlah keseluruhan komoditi tanaman insdustri pada tahun 2015 berubah disebabkan terdapat "revised data" untuk tanaman teh pada daerah Cameron Highlands,Pahang.
MALAYSIA
Jenis Tanaman Industri
Type of Industrial
Crops
2013
JADUAL 7.1 : RINGKASAN DATA SIRI MASA LUAS BERTANAM DAN PENGELUARAN TANAMAN INDUSTRI, MALAYSIA, 2013-2017
Table 7.1 : Summary of Time Series Data on Planted Area and Production of Industrial Crops, Malaysia, 2013-2017
2014 2015R
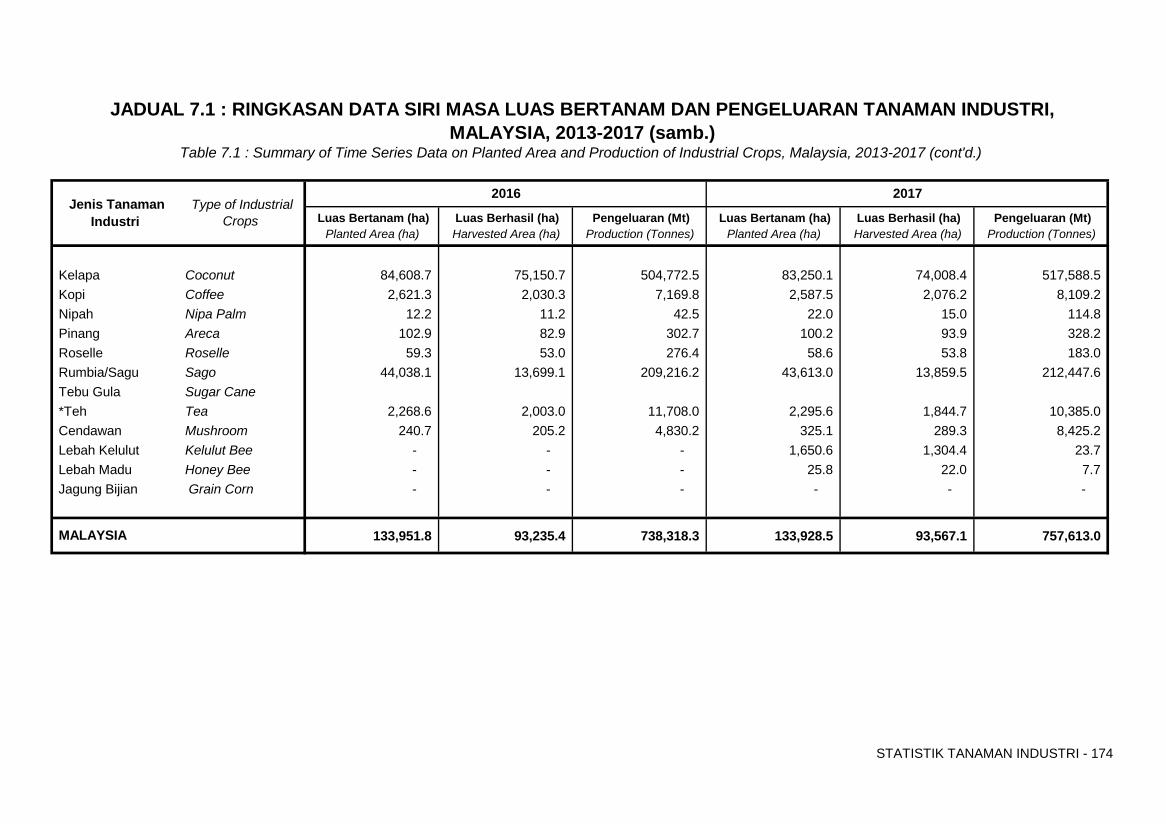
STATISTIK TANAMAN INDUSTRI - 174
Luas Bertanam (ha) Luas Berhasil (ha) Pengeluaran (Mt) Luas Bertanam (ha) Luas Berhasil (ha) Pengeluaran (Mt) Planted Area (ha) Harvested Area (ha) Production (Tonnes) Planted Area (ha) Harvested Area (ha) Production (Tonnes)
Kelapa Coconut 84,608.7 75,150.7 504,772.5 83,250.1 74,008.4 517,588.5 Kopi Coffee 2,621.3 2,030.3 7,169.8 2,587.5 2,076.2 8,109.2 Nipah Nipa Palm 12.2 11.2 42.5 22.0 15.0 114.8 Pinang Areca 102.9 82.9 302.7 100.2 93.9 328.2 Roselle Roselle 59.3 53.0 276.4 58.6 53.8 183.0 Rumbia/Sagu Sago 44,038.1 13,699.1 209,216.2 43,613.0 13,859.5 212,447.6 Tebu Gula Sugar Cane*Teh Tea 2,268.6 2,003.0 11,708.0 2,295.6 1,844.7 10,385.0 Cendawan Mushroom 240.7 205.2 4,830.2 325.1 289.3 8,425.2 Lebah Kelulut Kelulut Bee - - - 1,650.6 1,304.4 23.7 Lebah Madu Honey Bee - - - 25.8 22.0 7.7 Jagung Bijian Grain Corn - - - - - -
133,951.8 93,235.4 738,318.3 133,928.5 93,567.1 757,613.0
JADUAL 7.1 : RINGKASAN DATA SIRI MASA LUAS BERTANAM DAN PENGELUARAN TANAMAN INDUSTRI,
MALAYSIA
Jenis Tanaman Industri
Type of Industrial Crops
2016
MALAYSIA, 2013-2017 (samb.) Table 7.1 : Summary of Time Series Data on Planted Area and Production of Industrial Crops, Malaysia, 2013-2017 (cont'd.)
2017
L2: SENARAI TANAMAN INDUSTRI MENGIKUT NAMA TEMPATAN, INGGERIS DAN BOTANI
L2 : List of Industrial Crops by Local, English and Botanical Names
L3: JENIS PENGURUSAN L3 : Type of Management
L4: SUMBER RUJUKAN L4 : Source of References
L5: AKRONIM L5 : Acronym
SEKSYEN 8
Section 8 DATA SIRI MASA – LUAS BERTANAM DAN PENGELUARAN
TANAMAN INDUSTRI MENGIKUT NEGERI & JENIS TANAMAN, MALAYSIA, 2013 – 2017
Time Series Data – Planted Area and Production of Industrial Crops
by State & Type of Crops, Malaysia, 2013 – 2017
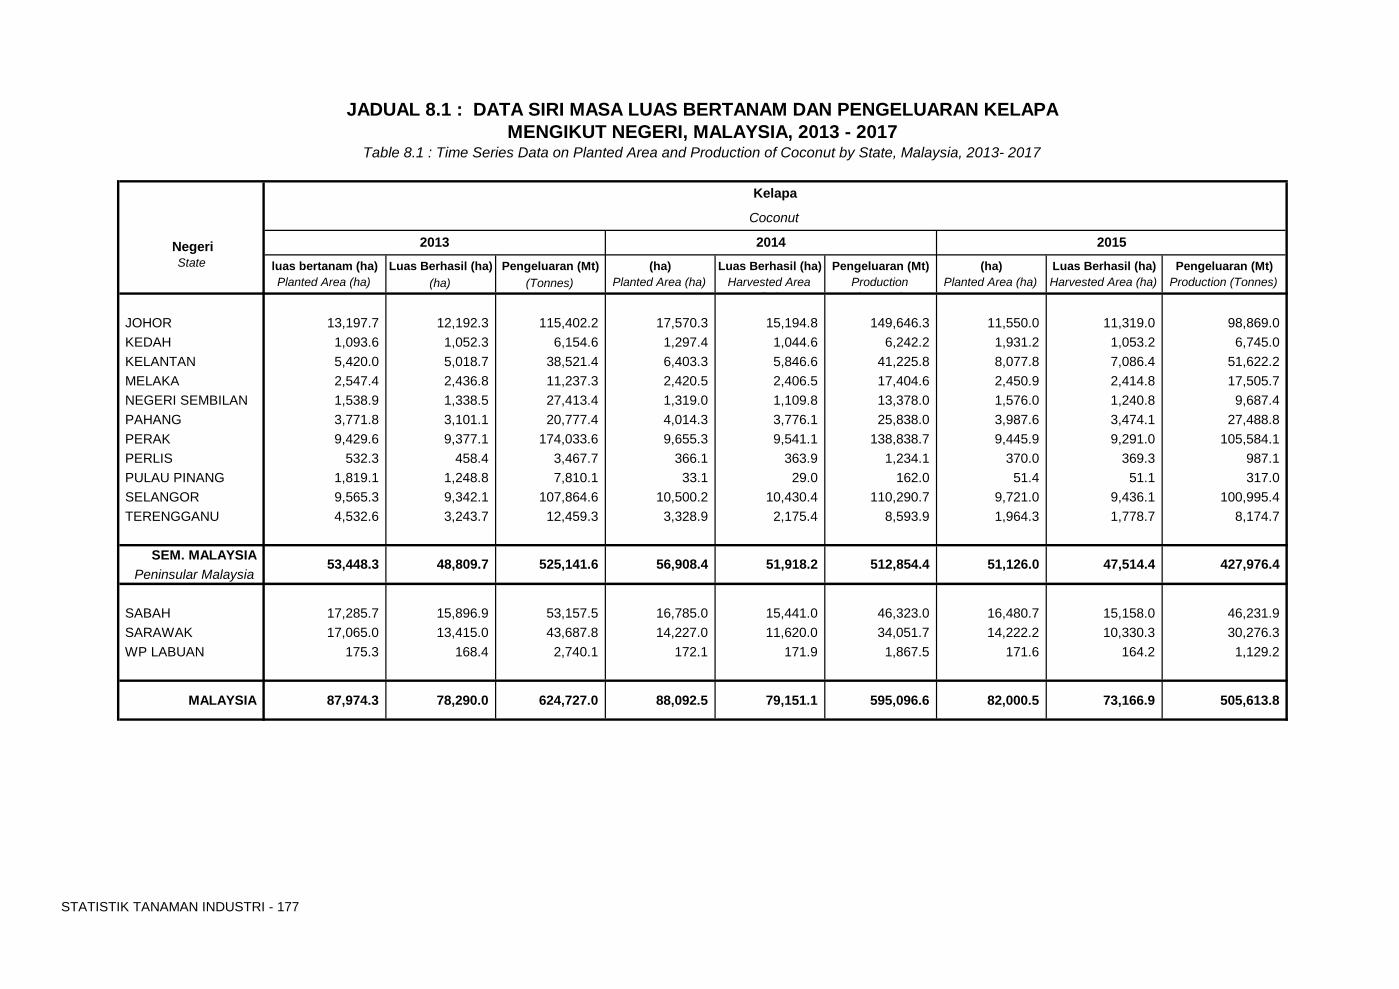
STATISTIK TANAMAN INDUSTRI - 177
State luas bertanam (ha) Luas Berhasil (ha) Pengeluaran (Mt) (ha) Luas Berhasil (ha) Pengeluaran (Mt)
(ha) Luas Berhasil (ha) Pengeluaran (Mt)
Planted Area (ha)
(ha)
(Tonnes) Planted Area (ha) Harvested Area (h )
Production (T )
Planted Area (ha) Harvested Area (ha) Production (Tonnes)
JOHOR 13,197.7 12,192.3 115,402.2 17,570.3 15,194.8 149,646.3 11,550.0 11,319.0 98,869.0 KEDAH 1,093.6 1,052.3 6,154.6 1,297.4 1,044.6 6,242.2 1,931.2 1,053.2 6,745.0 KELANTAN 5,420.0 5,018.7 38,521.4 6,403.3 5,846.6 41,225.8 8,077.8 7,086.4 51,622.2 MELAKA 2,547.4 2,436.8 11,237.3 2,420.5 2,406.5 17,404.6 2,450.9 2,414.8 17,505.7 NEGERI SEMBILAN 1,538.9 1,338.5 27,413.4 1,319.0 1,109.8 13,378.0 1,576.0 1,240.8 9,687.4 PAHANG 3,771.8 3,101.1 20,777.4 4,014.3 3,776.1 25,838.0 3,987.6 3,474.1 27,488.8 PERAK 9,429.6 9,377.1 174,033.6 9,655.3 9,541.1 138,838.7 9,445.9 9,291.0 105,584.1 PERLIS 532.3 458.4 3,467.7 366.1 363.9 1,234.1 370.0 369.3 987.1 PULAU PINANG 1,819.1 1,248.8 7,810.1 33.1 29.0 162.0 51.4 51.1 317.0 SELANGOR 9,565.3 9,342.1 107,864.6 10,500.2 10,430.4 110,290.7 9,721.0 9,436.1 100,995.4 TERENGGANU 4,532.6 3,243.7 12,459.3 3,328.9 2,175.4 8,593.9 1,964.3 1,778.7 8,174.7
SEM. MALAYSIAPeninsular Malaysia
SABAH 17,285.7 15,896.9 53,157.5 16,785.0 15,441.0 46,323.0 16,480.7 15,158.0 46,231.9 SARAWAK 17,065.0 13,415.0 43,687.8 14,227.0 11,620.0 34,051.7 14,222.2 10,330.3 30,276.3 WP LABUAN 175.3 168.4 2,740.1 172.1 171.9 1,867.5 171.6 164.2 1,129.2
MALAYSIA 87,974.3 78,290.0 624,727.0 88,092.5 79,151.1 595,096.6 82,000.5 73,166.9 505,613.8
JADUAL 8.1 : DATA SIRI MASA LUAS BERTANAM DAN PENGELUARAN KELAPA MENGIKUT NEGERI, MALAYSIA, 2013 - 2017
Table 8.1 : Time Series Data on Planted Area and Production of Coconut by State, Malaysia, 2013- 2017
20142013 Negeri 2015
Kelapa
Coconut
53,448.3 525,141.6 48,809.7 427,976.4 51,126.0 47,514.4 512,854.4 56,908.4 51,918.2
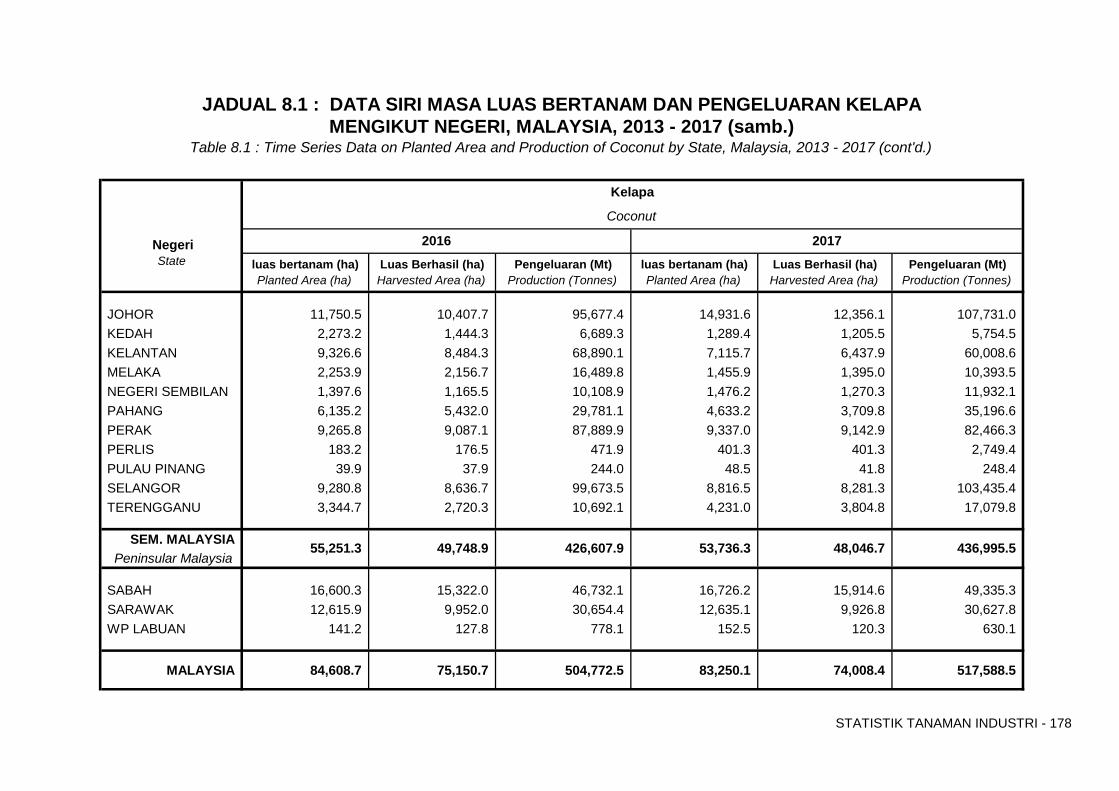
STATISTIK TANAMAN INDUSTRI - 178
Negeri State luas bertanam (ha) Luas Berhasil (ha) Pengeluaran (Mt) luas bertanam (ha) Luas Berhasil (ha) Pengeluaran (Mt)
Planted Area (ha) Harvested Area (ha) Production (Tonnes) Planted Area (ha) Harvested Area (ha) Production (Tonnes)
JOHOR 11,750.5 10,407.7 95,677.4 14,931.6 12,356.1 107,731.0 KEDAH 2,273.2 1,444.3 6,689.3 1,289.4 1,205.5 5,754.5 KELANTAN 9,326.6 8,484.3 68,890.1 7,115.7 6,437.9 60,008.6 MELAKA 2,253.9 2,156.7 16,489.8 1,455.9 1,395.0 10,393.5 NEGERI SEMBILAN 1,397.6 1,165.5 10,108.9 1,476.2 1,270.3 11,932.1 PAHANG 6,135.2 5,432.0 29,781.1 4,633.2 3,709.8 35,196.6 PERAK 9,265.8 9,087.1 87,889.9 9,337.0 9,142.9 82,466.3 PERLIS 183.2 176.5 471.9 401.3 401.3 2,749.4 PULAU PINANG 39.9 37.9 244.0 48.5 41.8 248.4 SELANGOR 9,280.8 8,636.7 99,673.5 8,816.5 8,281.3 103,435.4 TERENGGANU 3,344.7 2,720.3 10,692.1 4,231.0 3,804.8 17,079.8
SEM. MALAYSIAPeninsular Malaysia
SABAH 16,600.3 15,322.0 46,732.1 16,726.2 15,914.6 49,335.3 SARAWAK 12,615.9 9,952.0 30,654.4 12,635.1 9,926.8 30,627.8 WP LABUAN 141.2 127.8 778.1 152.5 120.3 630.1
MALAYSIA 84,608.7 75,150.7 504,772.5 83,250.1 74,008.4 517,588.5
49,748.9
Table 8.1 : Time Series Data on Planted Area and Production of Coconut by State, Malaysia, 2013 - 2017 (cont'd.)
426,607.9
JADUAL 8.1 : DATA SIRI MASA LUAS BERTANAM DAN PENGELUARAN KELAPA
Kelapa
Coconut
48,046.7 436,995.5
2016 2017
53,736.3 55,251.3
MENGIKUT NEGERI, MALAYSIA, 2013 - 2017 (samb.)
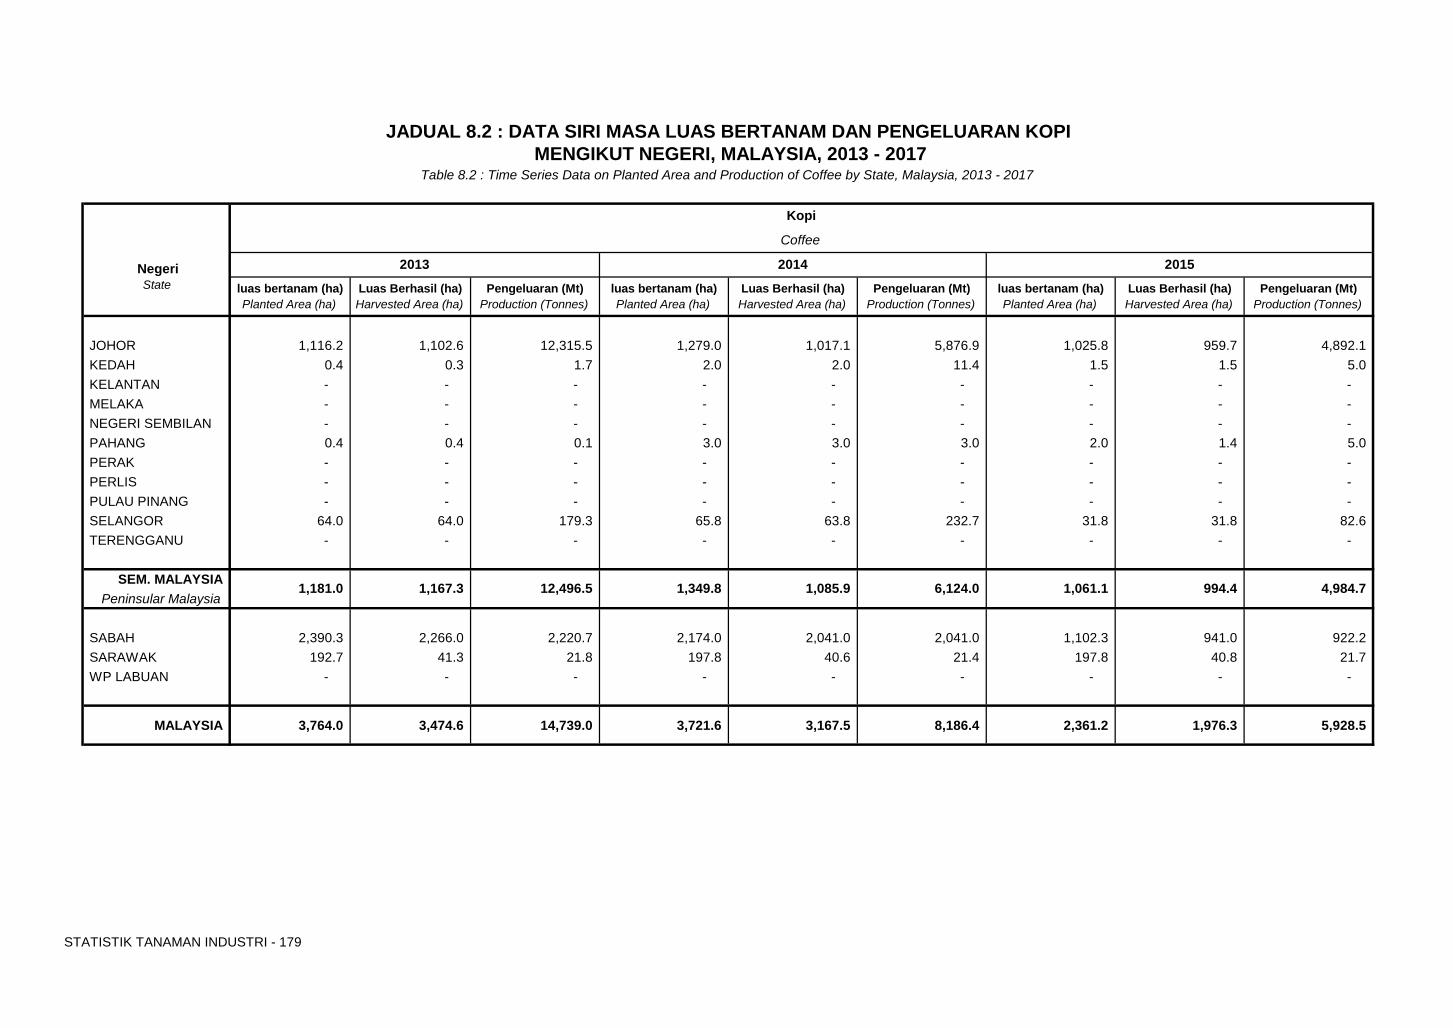
STATISTIK TANAMAN INDUSTRI - 179
luas bertanam (ha) Luas Berhasil (ha) Pengeluaran (Mt) luas bertanam (ha) Luas Berhasil (ha) Pengeluaran (Mt) luas bertanam (ha) Luas Berhasil (ha) Pengeluaran (Mt)Planted Area (ha) Harvested Area (ha) Production (Tonnes) Planted Area (ha) Harvested Area (ha) Production (Tonnes) Planted Area (ha) Harvested Area (ha) Production (Tonnes)
JOHOR 1,116.2 1,102.6 12,315.5 1,279.0 1,017.1 5,876.9 1,025.8 959.7 4,892.1 KEDAH 0.4 0.3 1.7 2.0 2.0 11.4 1.5 1.5 5.0 KELANTAN - - - - - - - - - MELAKA - - - - - - - - - NEGERI SEMBILAN - - - - - - - - - PAHANG 0.4 0.4 0.1 3.0 3.0 3.0 2.0 1.4 5.0 PERAK - - - - - - - - - PERLIS - - - - - - - - - PULAU PINANG - - - - - - - - - SELANGOR 64.0 64.0 179.3 65.8 63.8 232.7 31.8 31.8 82.6 TERENGGANU - - - - - - - - -
SEM. MALAYSIAPeninsular Malaysia
SABAH 2,390.3 2,266.0 2,220.7 2,174.0 2,041.0 2,041.0 1,102.3 941.0 922.2 SARAWAK 192.7 41.3 21.8 197.8 40.6 21.4 197.8 40.8 21.7 WP LABUAN - - - - - - - - -
MALAYSIA 3,764.0 3,474.6 14,739.0 3,721.6 3,167.5 8,186.4 2,361.2 1,976.3 5,928.5
Negeri
1,181.0
Kopi
Coffee
1,349.8 1,085.9 6,124.0 994.4
JADUAL 8.2 : DATA SIRI MASA LUAS BERTANAM DAN PENGELUARAN KOPI
1,167.3 4,984.7 1,061.1 12,496.5
MENGIKUT NEGERI, MALAYSIA, 2013 - 2017
20152014
Table 8.2 : Time Series Data on Planted Area and Production of Coffee by State, Malaysia, 2013 - 2017
State
2013
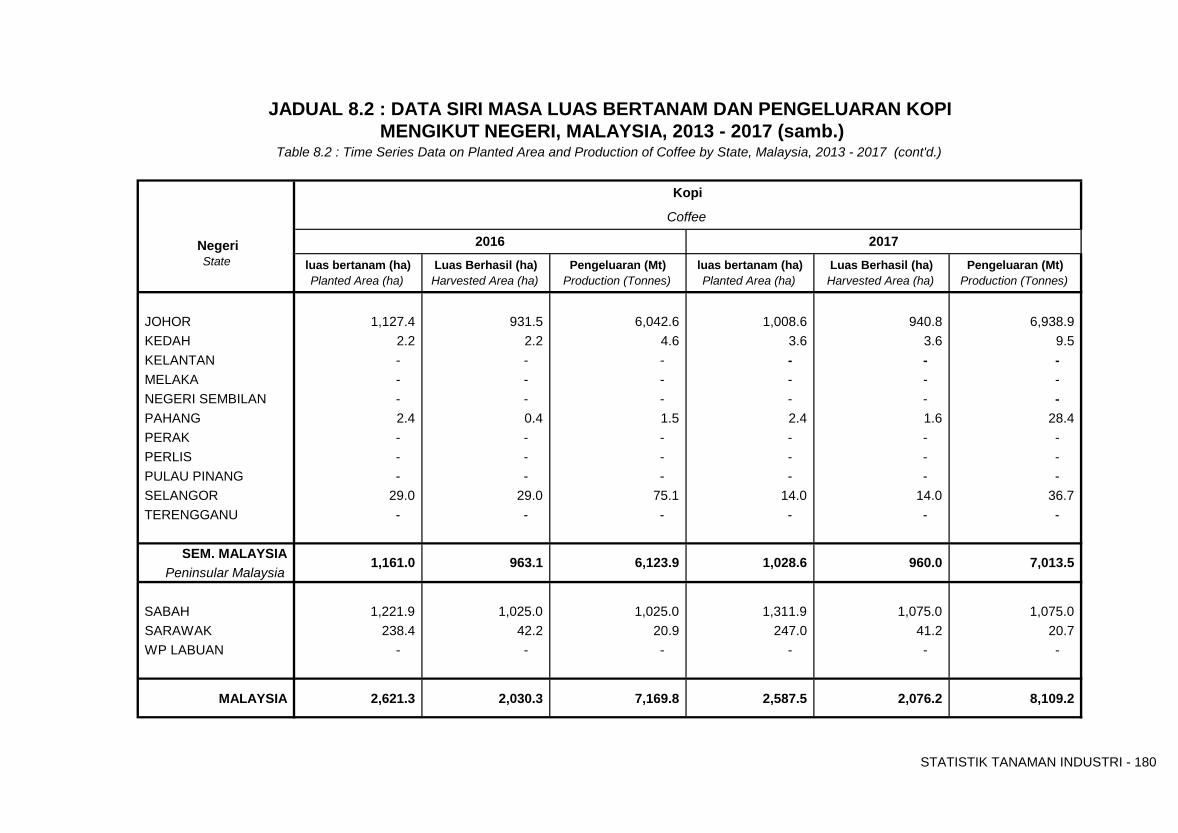
STATISTIK TANAMAN INDUSTRI - 180
State luas bertanam (ha) Luas Berhasil (ha) Pengeluaran (Mt) luas bertanam (ha) Luas Berhasil (ha) Pengeluaran (Mt)Planted Area (ha) Harvested Area (ha) Production (Tonnes) Planted Area (ha) Harvested Area (ha) Production (Tonnes)
JOHOR 1,127.4 931.5 6,042.6 1,008.6 940.8 6,938.9 KEDAH 2.2 2.2 4.6 3.6 3.6 9.5 KELANTAN - - - - - - MELAKA - - - - - - NEGERI SEMBILAN - - - - - - PAHANG 2.4 0.4 1.5 2.4 1.6 28.4 PERAK - - - - - - PERLIS - - - - - - PULAU PINANG - - - - - - SELANGOR 29.0 29.0 75.1 14.0 14.0 36.7 TERENGGANU - - - - - -
SEM. MALAYSIAPeninsular Malaysia
SABAH 1,221.9 1,025.0 1,025.0 1,311.9 1,075.0 1,075.0 SARAWAK 238.4 42.2 20.9 247.0 41.2 20.7 WP LABUAN - - - - - -
MALAYSIA 2,621.3 2,030.3 7,169.8 2,587.5 2,076.2 8,109.2
1,028.6 960.0
2016
6,123.9
JADUAL 8.2 : DATA SIRI MASA LUAS BERTANAM DAN PENGELUARAN KOPI MENGIKUT NEGERI, MALAYSIA, 2013 - 2017 (samb.)
7,013.5 1,161.0
Table 8.2 : Time Series Data on Planted Area and Production of Coffee by State, Malaysia, 2013 - 2017 (cont'd.)
Negeri
Kopi
Coffee
963.1
2017
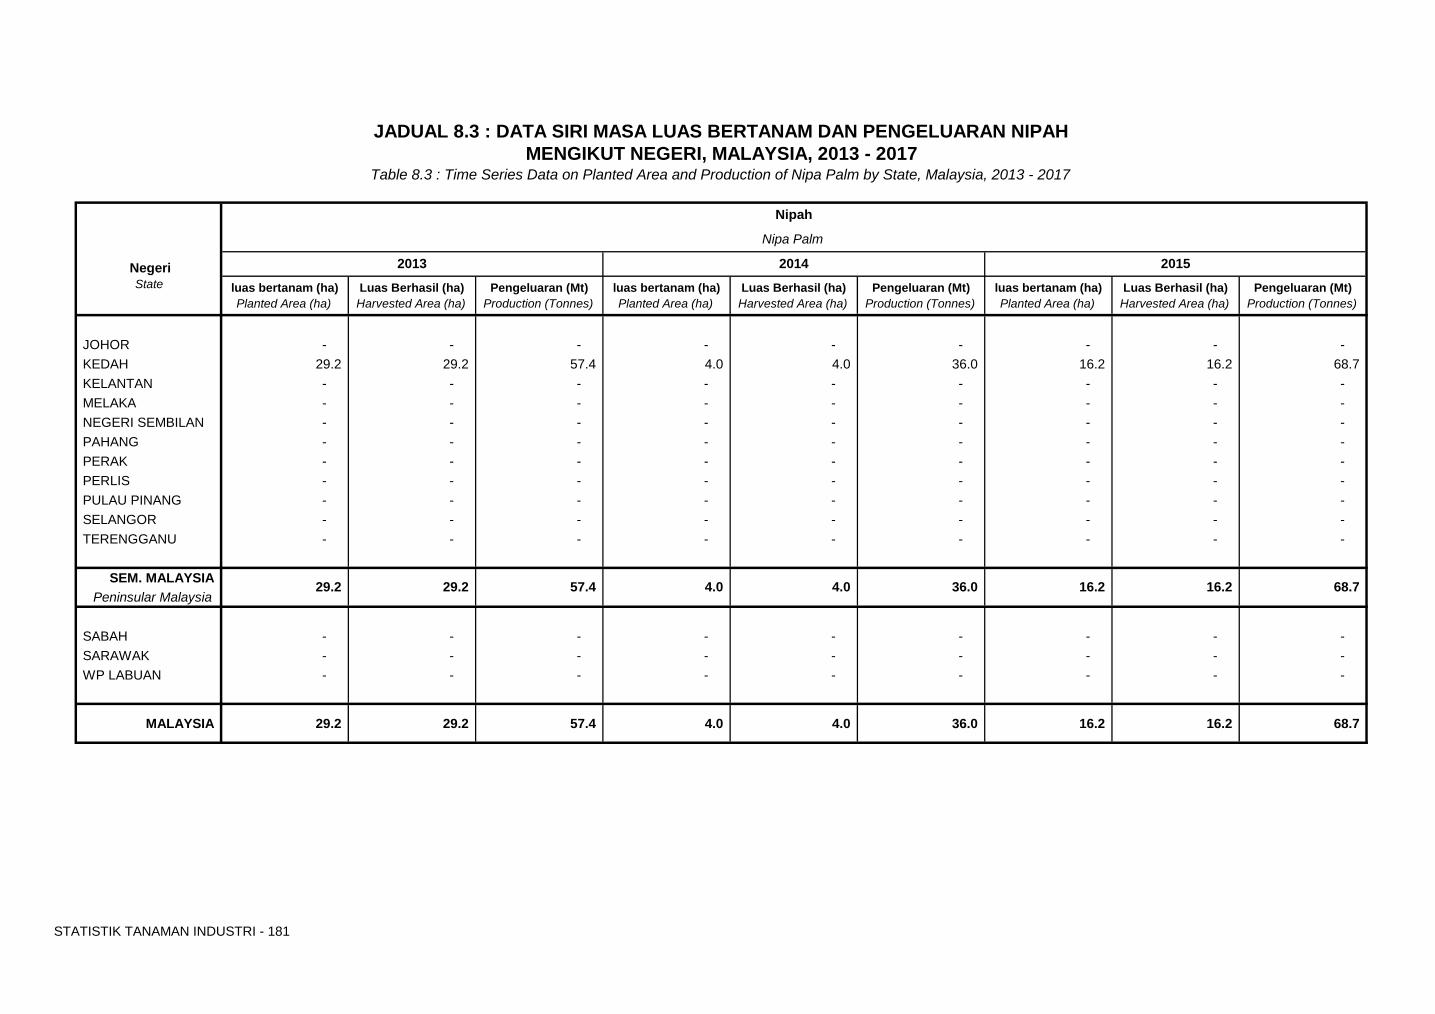
STATISTIK TANAMAN INDUSTRI - 181
luas bertanam (ha) Luas Berhasil (ha) Pengeluaran (Mt) luas bertanam (ha) Luas Berhasil (ha) Pengeluaran (Mt) luas bertanam (ha) Luas Berhasil (ha) Pengeluaran (Mt)Planted Area (ha) Harvested Area (ha) Production (Tonnes) Planted Area (ha) Harvested Area (ha) Production (Tonnes) Planted Area (ha) Harvested Area (ha) Production (Tonnes)
JOHOR - - - - - - - - - KEDAH 29.2 29.2 57.4 4.0 4.0 36.0 16.2 16.2 68.7 KELANTAN - - - - - - - - - MELAKA - - - - - - - - - NEGERI SEMBILAN - - - - - - - - - PAHANG - - - - - - - - - PERAK - - - - - - - - - PERLIS - - - - - - - - - PULAU PINANG - - - - - - - - - SELANGOR - - - - - - - - - TERENGGANU - - - - - - - - -
SEM. MALAYSIAPeninsular Malaysia
SABAH - - - - - - - - - SARAWAK - - - - - - - - - WP LABUAN - - - - - - - - -
MALAYSIA 29.2 29.2 57.4 4.0 4.0 36.0 16.2 16.2 68.7
29.2 57.4 29.2 16.2 68.7 4.0 4.0 36.0 16.2
JADUAL 8.3 : DATA SIRI MASA LUAS BERTANAM DAN PENGELUARAN NIPAH MENGIKUT NEGERI, MALAYSIA, 2013 - 2017
Table 8.3 : Time Series Data on Planted Area and Production of Nipa Palm by State, Malaysia, 2013 - 2017
State Negeri
Nipah
2014
Nipa Palm
2013 2015
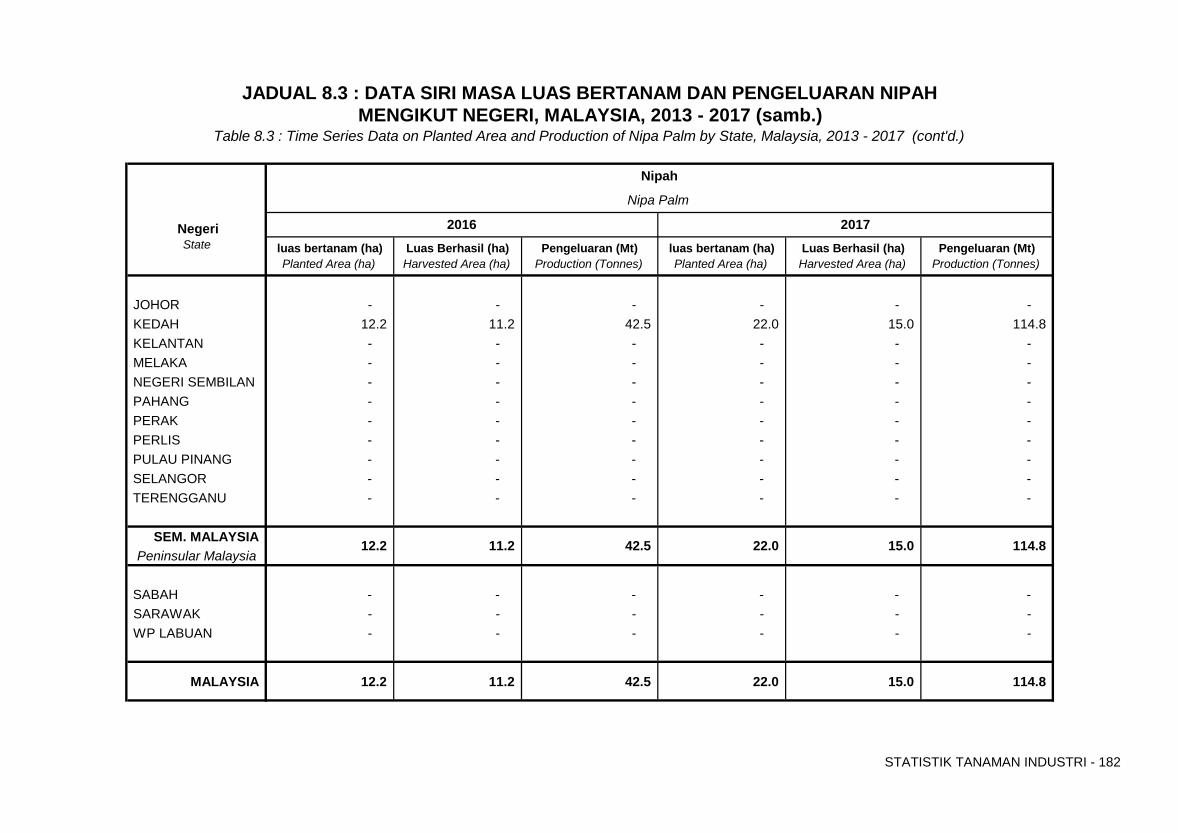
STATISTIK TANAMAN INDUSTRI - 182
State luas bertanam (ha) Luas Berhasil (ha) Pengeluaran (Mt) luas bertanam (ha) Luas Berhasil (ha) Pengeluaran (Mt)Planted Area (ha) Harvested Area (ha) Production (Tonnes) Planted Area (ha) Harvested Area (ha) Production (Tonnes)
JOHOR - - - - - - KEDAH 12.2 11.2 42.5 22.0 15.0 114.8 KELANTAN - - - - - - MELAKA - - - - - - NEGERI SEMBILAN - - - - - - PAHANG - - - - - - PERAK - - - - - - PERLIS - - - - - - PULAU PINANG - - - - - - SELANGOR - - - - - - TERENGGANU - - - - - -
SEM. MALAYSIAPeninsular Malaysia
SABAH - - - - - - SARAWAK - - - - - - WP LABUAN - - - - - -
MALAYSIA 12.2 11.2 42.5 22.0 15.0 114.8
Nipah
Nipa Palm
114.8
2016
JADUAL 8.3 : DATA SIRI MASA LUAS BERTANAM DAN PENGELUARAN NIPAH
Table 8.3 : Time Series Data on Planted Area and Production of Nipa Palm by State, Malaysia, 2013 - 2017 (cont'd.)
12.2 22.0 11.2 42.5
MENGIKUT NEGERI, MALAYSIA, 2013 - 2017 (samb.)
15.0
2017 Negeri
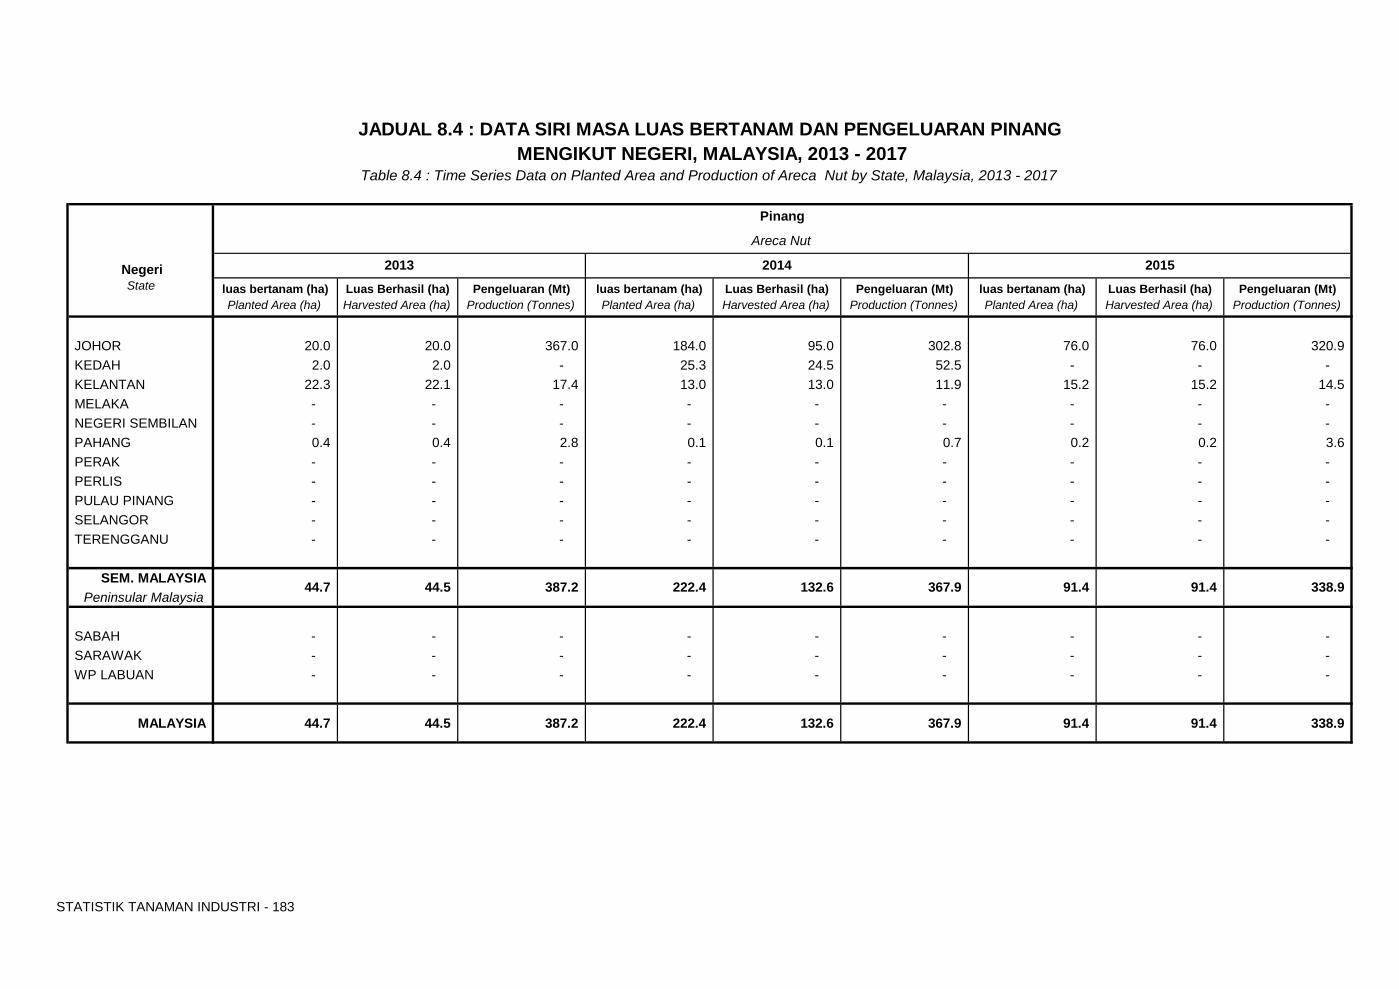
STATISTIK TANAMAN INDUSTRI - 183
luas bertanam (ha) Luas Berhasil (ha) Pengeluaran (Mt) luas bertanam (ha) Luas Berhasil (ha) Pengeluaran (Mt) luas bertanam (ha) Luas Berhasil (ha) Pengeluaran (Mt)Planted Area (ha) Harvested Area (ha) Production (Tonnes) Planted Area (ha) Harvested Area (ha) Production (Tonnes) Planted Area (ha) Harvested Area (ha) Production (Tonnes)
JOHOR 20.0 20.0 367.0 184.0 95.0 302.8 76.0 76.0 320.9 KEDAH 2.0 2.0 - 25.3 24.5 52.5 - - - KELANTAN 22.3 22.1 17.4 13.0 13.0 11.9 15.2 15.2 14.5 MELAKA - - - - - - - - - NEGERI SEMBILAN - - - - - - - - - PAHANG 0.4 0.4 2.8 0.1 0.1 0.7 0.2 0.2 3.6 PERAK - - - - - - - - - PERLIS - - - - - - - - - PULAU PINANG - - - - - - - - - SELANGOR - - - - - - - - - TERENGGANU - - - - - - - - -
SEM. MALAYSIAPeninsular Malaysia
SABAH - - - - - - - - - SARAWAK - - - - - - - - - WP LABUAN - - - - - - - - -
MALAYSIA 44.7 44.5 387.2 222.4 132.6 367.9 91.4 91.4 338.9
State Negeri
Pinang
44.7 44.5 387.2 367.9
2015
91.4
20142013
91.4 132.6 222.4 338.9
JADUAL 8.4 : DATA SIRI MASA LUAS BERTANAM DAN PENGELUARAN PINANG MENGIKUT NEGERI, MALAYSIA, 2013 - 2017
Table 8.4 : Time Series Data on Planted Area and Production of Areca Nut by State, Malaysia, 2013 - 2017
Areca Nut
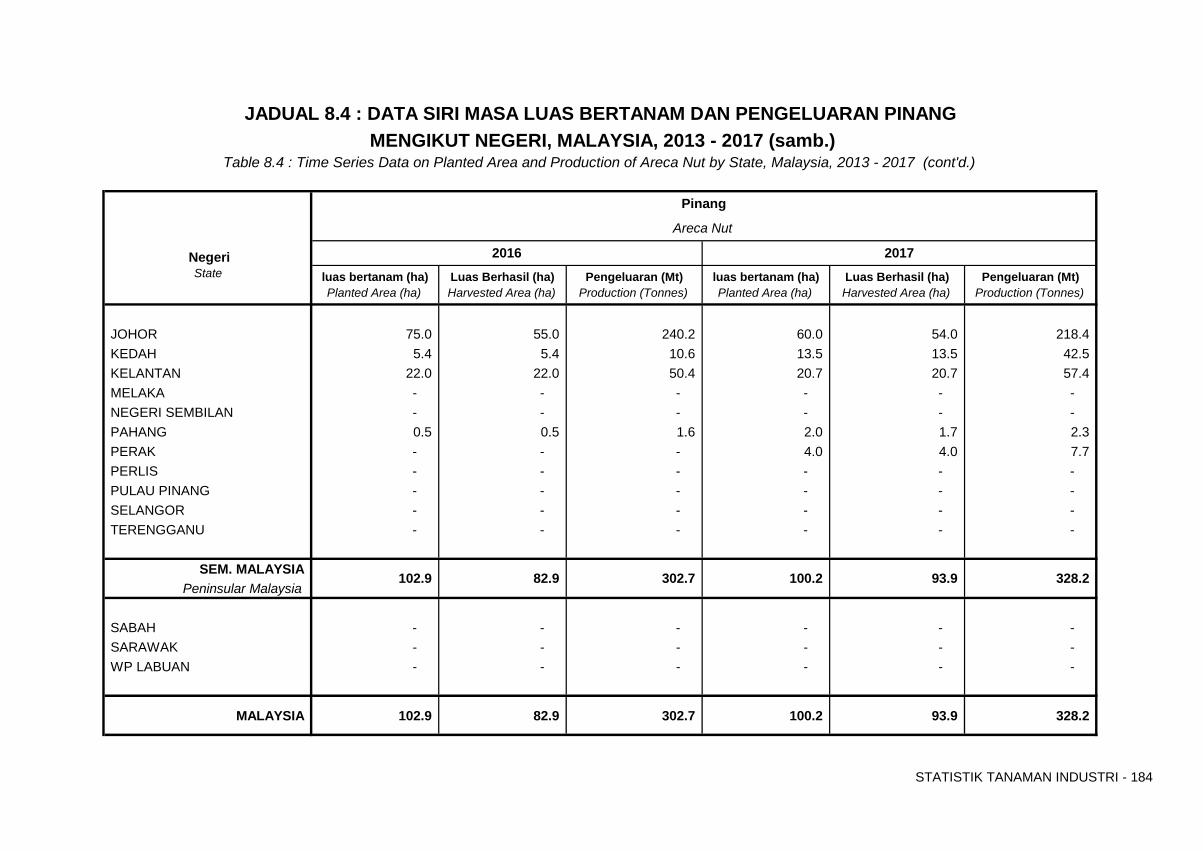
STATISTIK TANAMAN INDUSTRI - 184
State luas bertanam (ha) Luas Berhasil (ha) Pengeluaran (Mt) luas bertanam (ha) Luas Berhasil (ha) Pengeluaran (Mt)Planted Area (ha) Harvested Area (ha) Production (Tonnes) Planted Area (ha) Harvested Area (ha) Production (Tonnes)
JOHOR 75.0 55.0 240.2 60.0 54.0 218.4 KEDAH 5.4 5.4 10.6 13.5 13.5 42.5 KELANTAN 22.0 22.0 50.4 20.7 20.7 57.4 MELAKA - - - - - - NEGERI SEMBILAN - - - - - - PAHANG 0.5 0.5 1.6 2.0 1.7 2.3 PERAK - - - 4.0 4.0 7.7 PERLIS - - - - - - PULAU PINANG - - - - - - SELANGOR - - - - - - TERENGGANU - - - - - -
SEM. MALAYSIAPeninsular Malaysia
SABAH - - - - - - SARAWAK - - - - - - WP LABUAN - - - - - -
MALAYSIA 102.9 82.9 302.7 100.2 93.9 328.2
302.7
Pinang
100.2 93.9 328.2 102.9 82.9
JADUAL 8.4 : DATA SIRI MASA LUAS BERTANAM DAN PENGELUARAN PINANG MENGIKUT NEGERI, MALAYSIA, 2013 - 2017 (samb.)
Table 8.4 : Time Series Data on Planted Area and Production of Areca Nut by State, Malaysia, 2013 - 2017 (cont'd.)
2016 Negeri
Areca Nut
2017
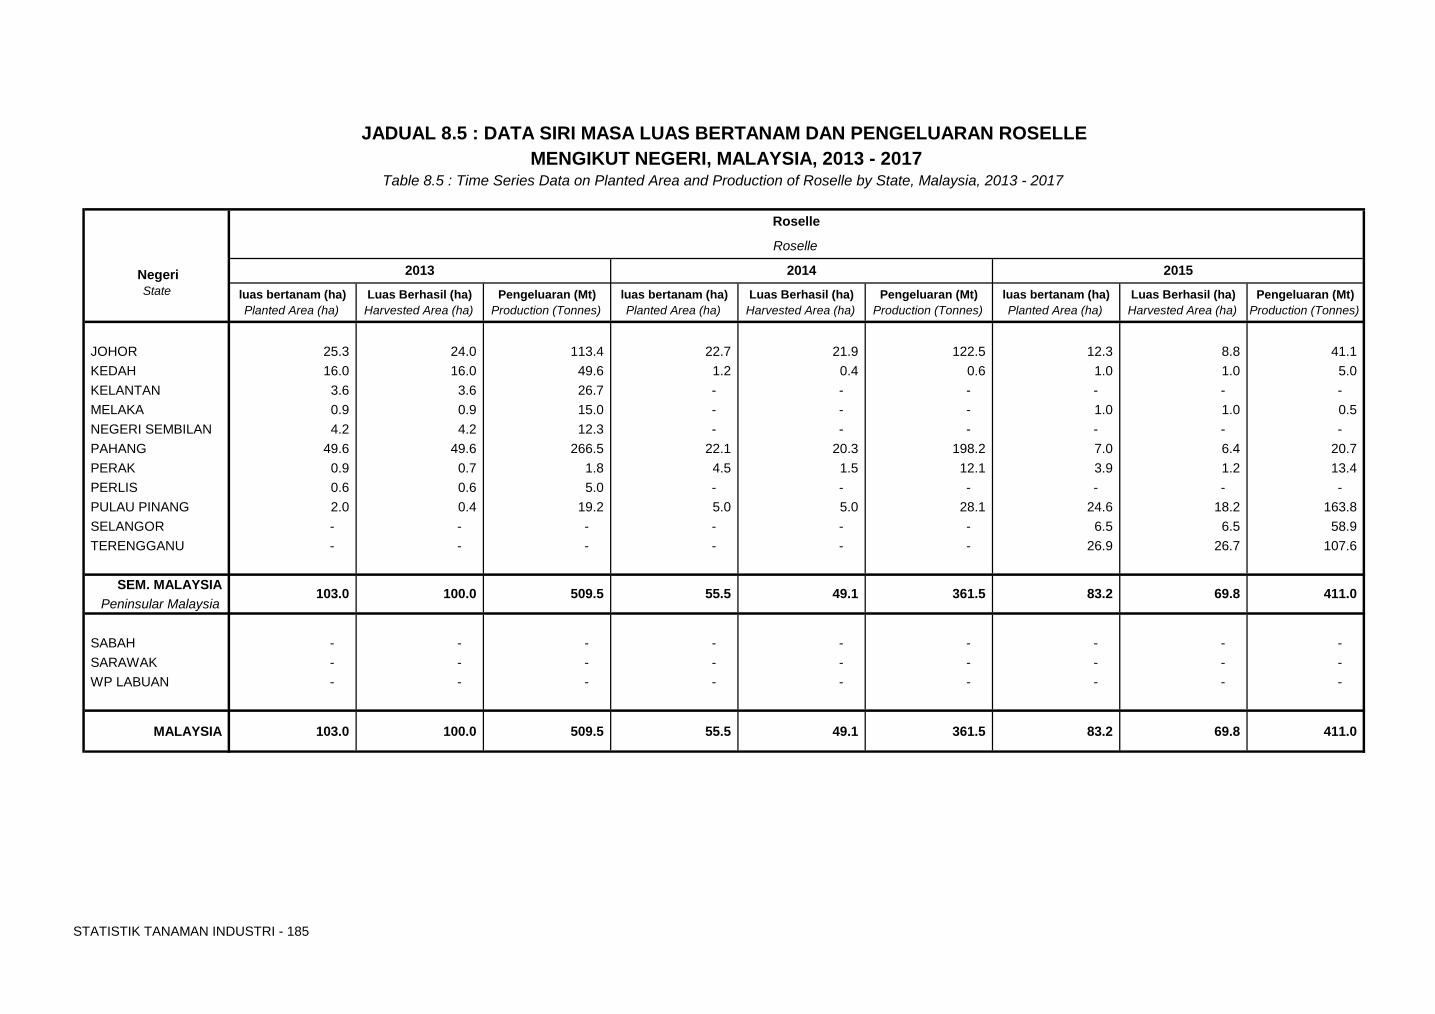
STATISTIK TANAMAN INDUSTRI - 185
luas bertanam (ha) Luas Berhasil (ha) Pengeluaran (Mt) luas bertanam (ha) Luas Berhasil (ha) Pengeluaran (Mt) luas bertanam (ha) Luas Berhasil (ha) Pengeluaran (Mt)Planted Area (ha) Harvested Area (ha) Production (Tonnes) Planted Area (ha) Harvested Area (ha) Production (Tonnes) Planted Area (ha) Harvested Area (ha) Production (Tonnes)
JOHOR 25.3 24.0 113.4 22.7 21.9 122.5 12.3 8.8 41.1 KEDAH 16.0 16.0 49.6 1.2 0.4 0.6 1.0 1.0 5.0 KELANTAN 3.6 3.6 26.7 - - - - - - MELAKA 0.9 0.9 15.0 - - - 1.0 1.0 0.5 NEGERI SEMBILAN 4.2 4.2 12.3 - - - - - - PAHANG 49.6 49.6 266.5 22.1 20.3 198.2 7.0 6.4 20.7 PERAK 0.9 0.7 1.8 4.5 1.5 12.1 3.9 1.2 13.4 PERLIS 0.6 0.6 5.0 - - - - - - PULAU PINANG 2.0 0.4 19.2 5.0 5.0 28.1 24.6 18.2 163.8 SELANGOR - - - - - - 6.5 6.5 58.9 TERENGGANU - - - - - - 26.9 26.7 107.6
SEM. MALAYSIAPeninsular Malaysia
SABAH - - - - - - - - - SARAWAK - - - - - - - - - WP LABUAN - - - - - - - - -
MALAYSIA 103.0 100.0 509.5 55.5 49.1 361.5 83.2 69.8 411.0
411.0 83.2 69.8
State
Roselle
103.0 100.0 509.5 361.5 55.5 49.1
JADUAL 8.5 : DATA SIRI MASA LUAS BERTANAM DAN PENGELUARAN ROSELLE MENGIKUT NEGERI, MALAYSIA, 2013 - 2017
Negeri
Roselle
Table 8.5 : Time Series Data on Planted Area and Production of Roselle by State, Malaysia, 2013 - 2017
201520142013
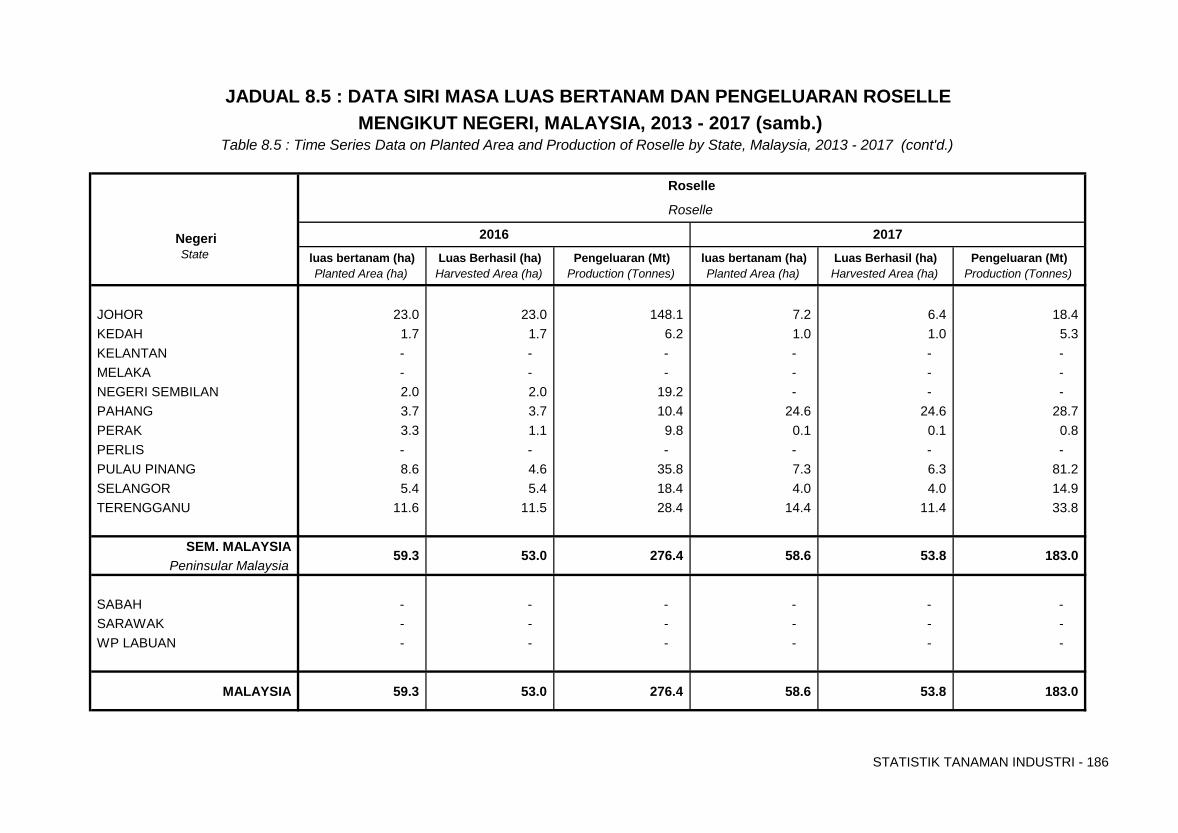
STATISTIK TANAMAN INDUSTRI - 186
State luas bertanam (ha) Luas Berhasil (ha) Pengeluaran (Mt) luas bertanam (ha) Luas Berhasil (ha) Pengeluaran (Mt)Planted Area (ha) Harvested Area (ha) Production (Tonnes) Planted Area (ha) Harvested Area (ha) Production (Tonnes)
JOHOR 23.0 23.0 148.1 7.2 6.4 18.4 KEDAH 1.7 1.7 6.2 1.0 1.0 5.3 KELANTAN - - - - - - MELAKA - - - - - - NEGERI SEMBILAN 2.0 2.0 19.2 - - - PAHANG 3.7 3.7 10.4 24.6 24.6 28.7 PERAK 3.3 1.1 9.8 0.1 0.1 0.8 PERLIS - - - - - - PULAU PINANG 8.6 4.6 35.8 7.3 6.3 81.2 SELANGOR 5.4 5.4 18.4 4.0 4.0 14.9 TERENGGANU 11.6 11.5 28.4 14.4 11.4 33.8
SEM. MALAYSIAPeninsular Malaysia
SABAH - - - - - - SARAWAK - - - - - - WP LABUAN - - - - - -
MALAYSIA 59.3 53.0 276.4 58.6 53.8 183.0
JADUAL 8.5 : DATA SIRI MASA LUAS BERTANAM DAN PENGELUARAN ROSELLE
Roselle
Negeri
MENGIKUT NEGERI, MALAYSIA, 2013 - 2017 (samb.)
2017
Table 8.5 : Time Series Data on Planted Area and Production of Roselle by State, Malaysia, 2013 - 2017 (cont'd.)
Roselle
183.0
2016
59.3 53.0 276.4 58.6 53.8
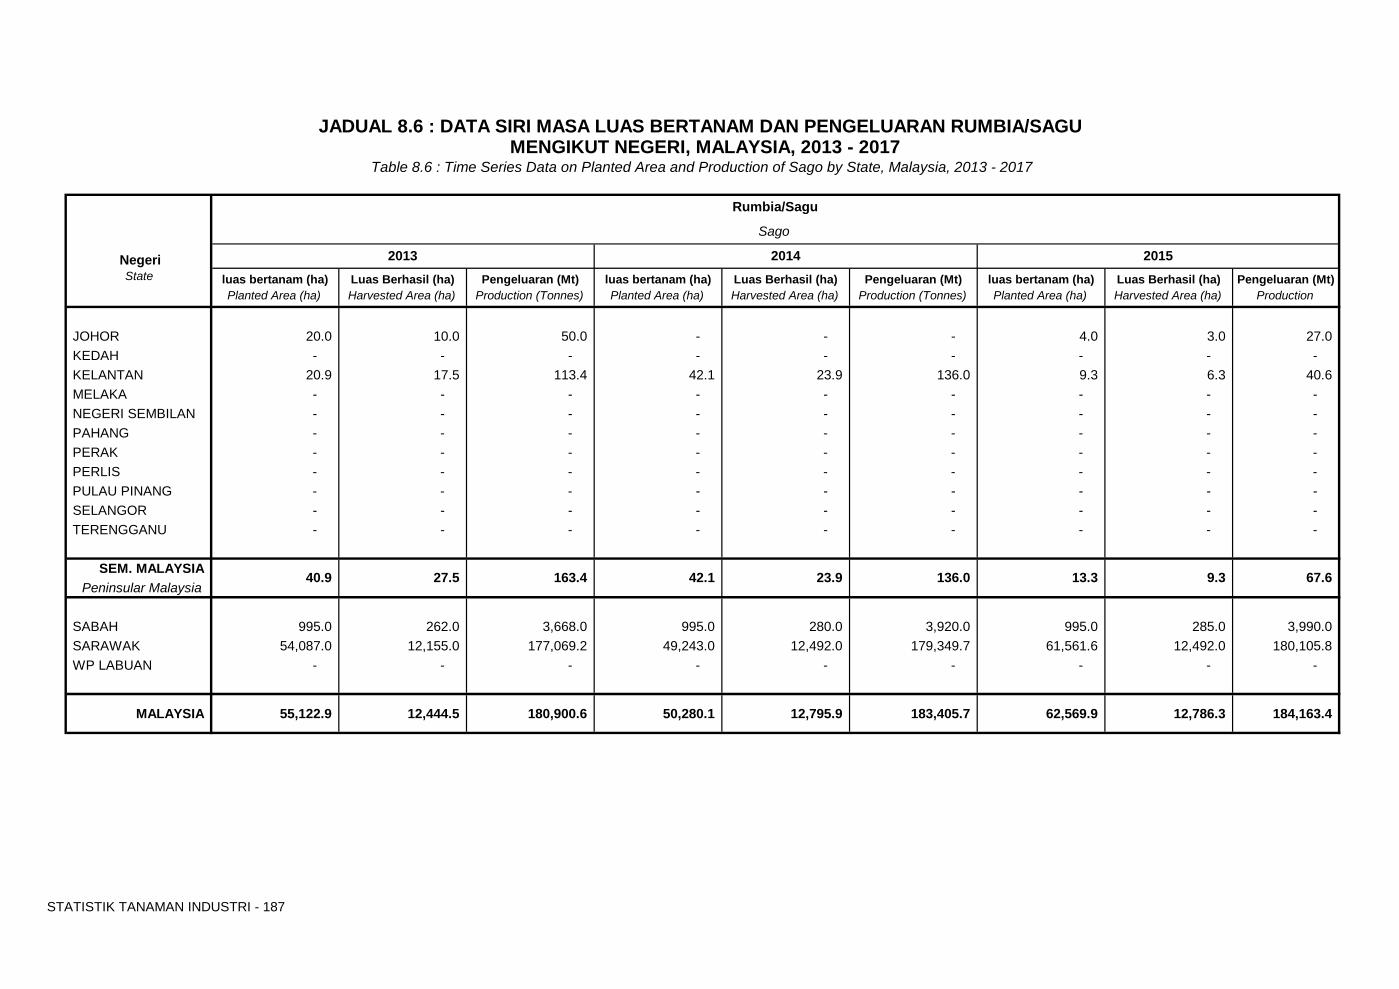
STATISTIK TANAMAN INDUSTRI - 187
luas bertanam (ha) Luas Berhasil (ha) Pengeluaran (Mt) luas bertanam (ha) Luas Berhasil (ha) Pengeluaran (Mt) luas bertanam (ha) Luas Berhasil (ha) Pengeluaran (Mt)Planted Area (ha) Harvested Area (ha) Production (Tonnes) Planted Area (ha) Harvested Area (ha) Production (Tonnes) Planted Area (ha) Harvested Area (ha) Production
(T )
JOHOR 20.0 10.0 50.0 - - - 4.0 3.0 27.0 KEDAH - - - - - - - - - KELANTAN 20.9 17.5 113.4 42.1 23.9 136.0 9.3 6.3 40.6 MELAKA - - - - - - - - - NEGERI SEMBILAN - - - - - - - - - PAHANG - - - - - - - - - PERAK - - - - - - - - - PERLIS - - - - - - - - - PULAU PINANG - - - - - - - - - SELANGOR - - - - - - - - - TERENGGANU - - - - - - - - -
SEM. MALAYSIAPeninsular Malaysia
SABAH 995.0 262.0 3,668.0 995.0 280.0 3,920.0 995.0 285.0 3,990.0 SARAWAK 54,087.0 12,155.0 177,069.2 49,243.0 12,492.0 179,349.7 61,561.6 12,492.0 180,105.8WP LABUAN - - - - - - - - -
MALAYSIA 55,122.9 12,444.5 180,900.6 50,280.1 12,795.9 183,405.7 62,569.9 12,786.3 184,163.4
23.9 40.9 27.5 163.4
JADUAL 8.6 : DATA SIRI MASA LUAS BERTANAM DAN PENGELUARAN RUMBIA/SAGU MENGIKUT NEGERI, MALAYSIA, 2013 - 2017
Negeri
Rumbia/Sagu
13.3 9.3 67.6
Table 8.6 : Time Series Data on Planted Area and Production of Sago by State, Malaysia, 2013 - 2017
136.0
2015 State
Sago
2013 2014
42.1
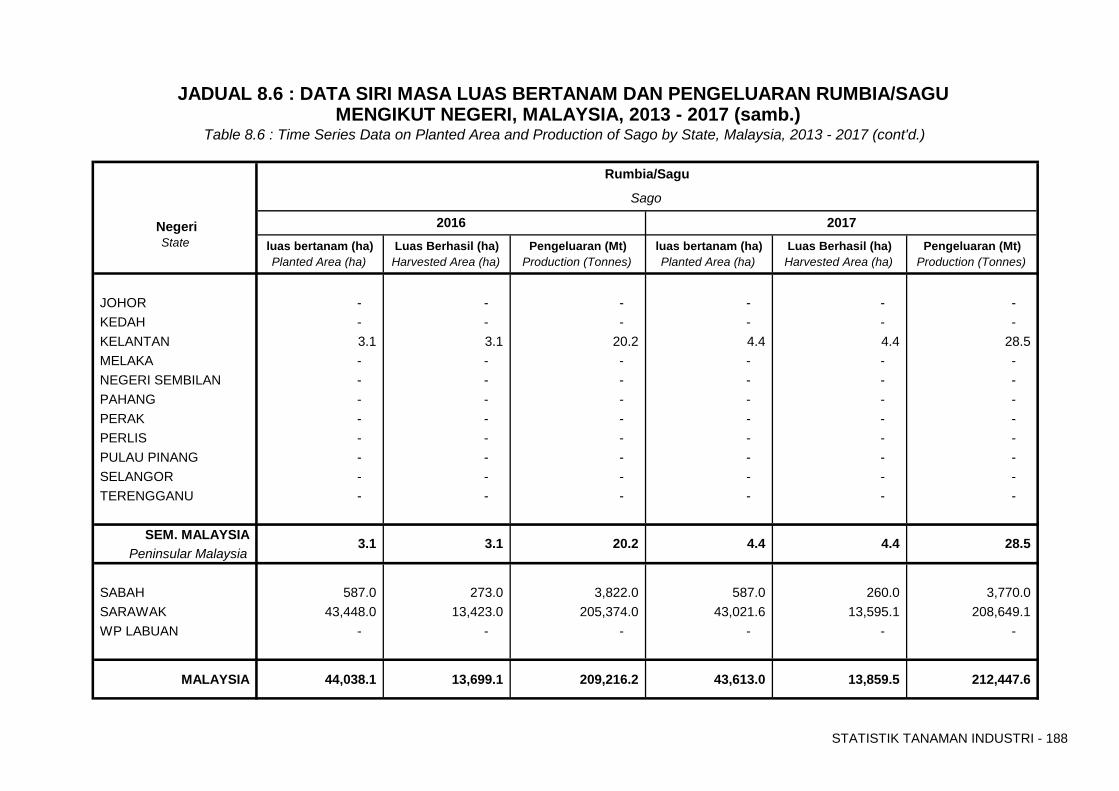
STATISTIK TANAMAN INDUSTRI - 188
State luas bertanam (ha) Luas Berhasil (ha) Pengeluaran (Mt) luas bertanam (ha) Luas Berhasil (ha) Pengeluaran (Mt)Planted Area (ha) Harvested Area (ha) Production (Tonnes) Planted Area (ha) Harvested Area (ha) Production (Tonnes)
JOHOR - - - - - - KEDAH - - - - - - KELANTAN 3.1 3.1 20.2 4.4 4.4 28.5 MELAKA - - - - - - NEGERI SEMBILAN - - - - - - PAHANG - - - - - - PERAK - - - - - - PERLIS - - - - - - PULAU PINANG - - - - - - SELANGOR - - - - - - TERENGGANU - - - - - -
SEM. MALAYSIAPeninsular Malaysia
SABAH 587.0 273.0 3,822.0 587.0 260.0 3,770.0 SARAWAK 43,448.0 13,423.0 205,374.0 43,021.6 13,595.1 208,649.1WP LABUAN - - - - - -
MALAYSIA 44,038.1 13,699.1 209,216.2 43,613.0 13,859.5 212,447.6
Rumbia/Sagu
Sago
3.1
JADUAL 8.6 : DATA SIRI MASA LUAS BERTANAM DAN PENGELUARAN RUMBIA/SAGU MENGIKUT NEGERI, MALAYSIA, 2013 - 2017 (samb.)
Table 8.6 : Time Series Data on Planted Area and Production of Sago by State, Malaysia, 2013 - 2017 (cont'd.)
20.2
Negeri 2016
3.1 4.4 28.5
2017
4.4
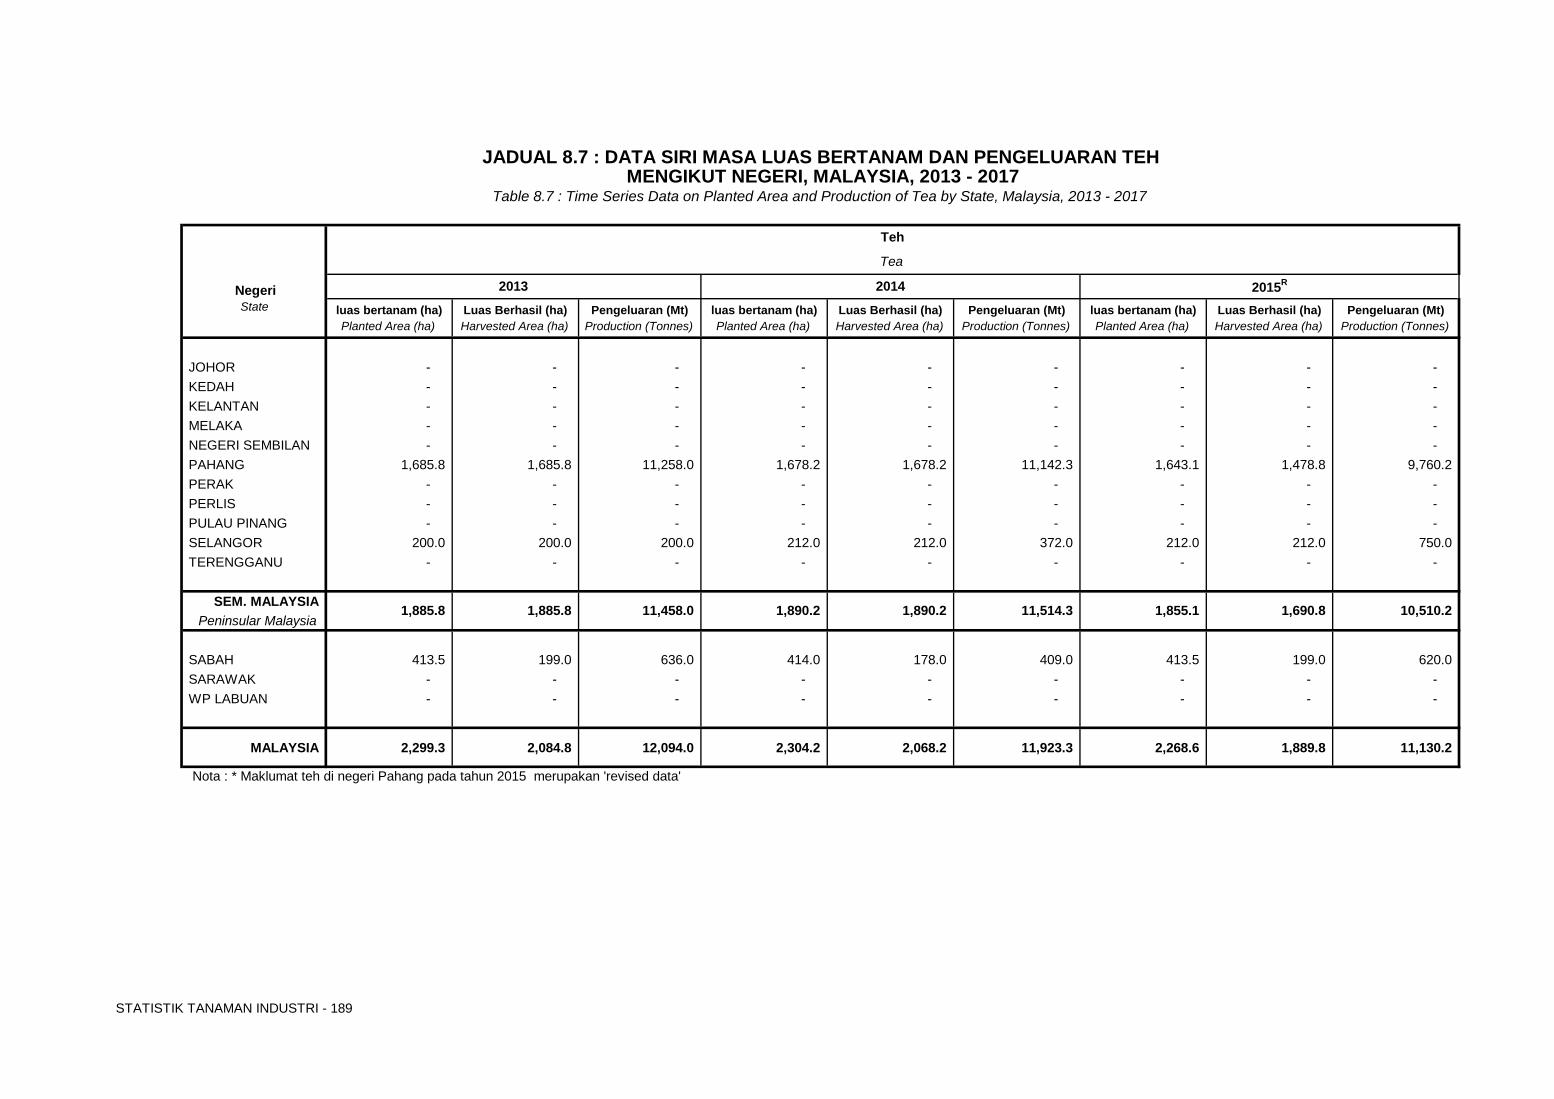
STATISTIK TANAMAN INDUSTRI - 189
luas bertanam (ha) Luas Berhasil (ha) Pengeluaran (Mt) luas bertanam (ha) Luas Berhasil (ha) Pengeluaran (Mt) luas bertanam (ha) Luas Berhasil (ha) Pengeluaran (Mt)Planted Area (ha) Harvested Area (ha) Production (Tonnes) Planted Area (ha) Harvested Area (ha) Production (Tonnes) Planted Area (ha) Harvested Area (ha) Production (Tonnes)
JOHOR - - - - - - - - - KEDAH - - - - - - - - - KELANTAN - - - - - - - - - MELAKA - - - - - - - - - NEGERI SEMBILAN - - - - - - - - - PAHANG 1,685.8 1,685.8 11,258.0 1,678.2 1,678.2 11,142.3 1,643.1 1,478.8 9,760.2 PERAK - - - - - - - - - PERLIS - - - - - - - - - PULAU PINANG - - - - - - - - - SELANGOR 200.0 200.0 200.0 212.0 212.0 372.0 212.0 212.0 750.0 TERENGGANU - - - - - - - - -
SEM. MALAYSIAPeninsular Malaysia
SABAH 413.5 199.0 636.0 414.0 178.0 409.0 413.5 199.0 620.0 SARAWAK - - - - - - - - - WP LABUAN - - - - - - - - -
MALAYSIA 2,299.3 2,084.8 12,094.0 2,304.2 2,068.2 11,923.3 2,268.6 1,889.8 11,130.2
Nota : * Maklumat teh di negeri Pahang pada tahun 2015 merupakan 'revised data'
State
1,855.1 1,690.8 10,510.2 1,890.2 1,890.2 11,514.3 1,885.8 1,885.8 11,458.0
JADUAL 8.7 : DATA SIRI MASA LUAS BERTANAM DAN PENGELUARAN TEH
Table 8.7 : Time Series Data on Planted Area and Production of Tea by State, Malaysia, 2013 - 2017
2015R
Tea
2014
MENGIKUT NEGERI, MALAYSIA, 2013 - 2017
Negeri 2013
Teh
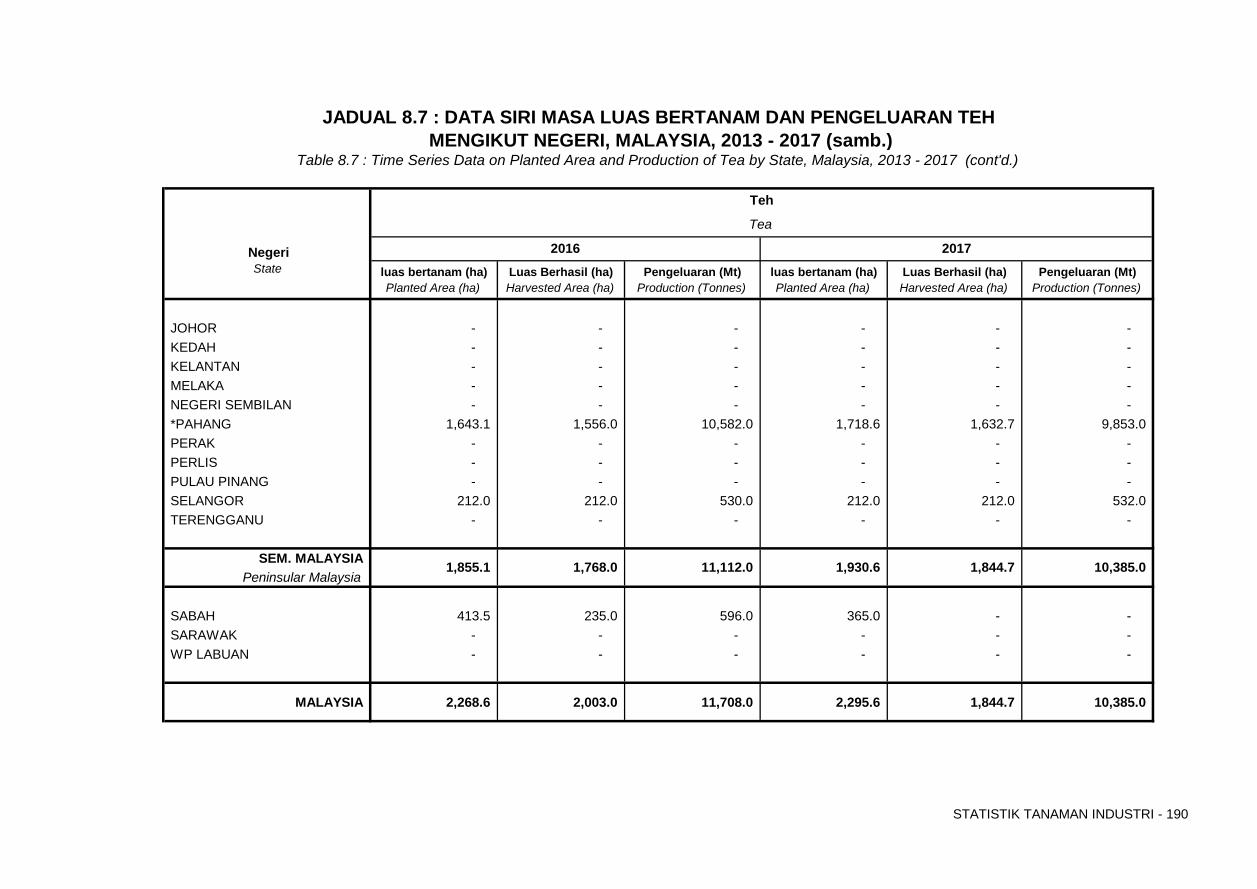
STATISTIK TANAMAN INDUSTRI - 190
State luas bertanam (ha) Luas Berhasil (ha) Pengeluaran (Mt) luas bertanam (ha) Luas Berhasil (ha) Pengeluaran (Mt)Planted Area (ha) Harvested Area (ha) Production (Tonnes) Planted Area (ha) Harvested Area (ha) Production (Tonnes)
JOHOR - - - - - - KEDAH - - - - - - KELANTAN - - - - - - MELAKA - - - - - - NEGERI SEMBILAN - - - - - - *PAHANG 1,643.1 1,556.0 10,582.0 1,718.6 1,632.7 9,853.0 PERAK - - - - - - PERLIS - - - - - - PULAU PINANG - - - - - - SELANGOR 212.0 212.0 530.0 212.0 212.0 532.0 TERENGGANU - - - - - -
SEM. MALAYSIAPeninsular Malaysia
SABAH 413.5 235.0 596.0 365.0 - - SARAWAK - - - - - - WP LABUAN - - - - - -
MALAYSIA 2,268.6 2,003.0 11,708.0 2,295.6 1,844.7 10,385.0
Teh
Tea
1,844.7 10,385.0
JADUAL 8.7 : DATA SIRI MASA LUAS BERTANAM DAN PENGELUARAN TEH MENGIKUT NEGERI, MALAYSIA, 2013 - 2017 (samb.)
Negeri
1,855.1 1,768.0 11,112.0
Table 8.7 : Time Series Data on Planted Area and Production of Tea by State, Malaysia, 2013 - 2017 (cont'd.)
1,930.6
20172016
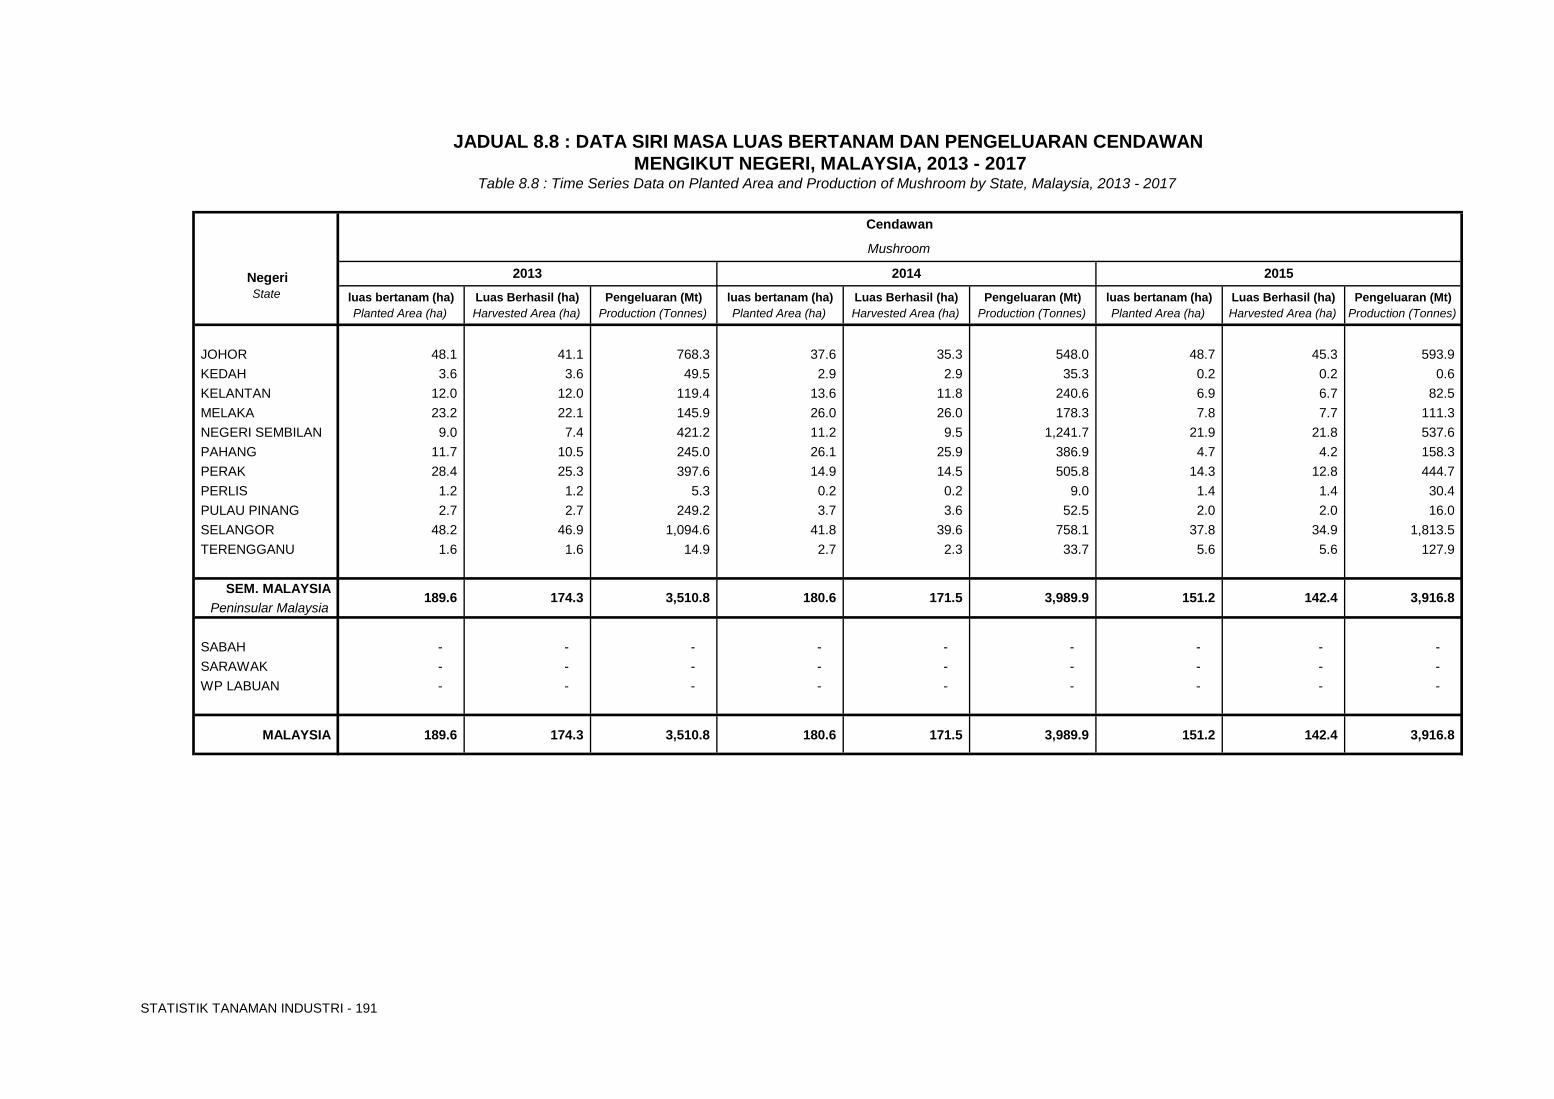
STATISTIK TANAMAN INDUSTRI - 191
luas bertanam (ha) Luas Berhasil (ha) Pengeluaran (Mt) luas bertanam (ha) Luas Berhasil (ha) Pengeluaran (Mt) luas bertanam (ha) Luas Berhasil (ha) Pengeluaran (Mt)Planted Area (ha) Harvested Area (ha) Production (Tonnes) Planted Area (ha) Harvested Area (ha) Production (Tonnes) Planted Area (ha) Harvested Area (ha) Production (Tonnes)
JOHOR 48.1 41.1 768.3 37.6 35.3 548.0 48.7 45.3 593.9 KEDAH 3.6 3.6 49.5 2.9 2.9 35.3 0.2 0.2 0.6 KELANTAN 12.0 12.0 119.4 13.6 11.8 240.6 6.9 6.7 82.5 MELAKA 23.2 22.1 145.9 26.0 26.0 178.3 7.8 7.7 111.3 NEGERI SEMBILAN 9.0 7.4 421.2 11.2 9.5 1,241.7 21.9 21.8 537.6 PAHANG 11.7 10.5 245.0 26.1 25.9 386.9 4.7 4.2 158.3 PERAK 28.4 25.3 397.6 14.9 14.5 505.8 14.3 12.8 444.7 PERLIS 1.2 1.2 5.3 0.2 0.2 9.0 1.4 1.4 30.4 PULAU PINANG 2.7 2.7 249.2 3.7 3.6 52.5 2.0 2.0 16.0 SELANGOR 48.2 46.9 1,094.6 41.8 39.6 758.1 37.8 34.9 1,813.5 TERENGGANU 1.6 1.6 14.9 2.7 2.3 33.7 5.6 5.6 127.9
SEM. MALAYSIAPeninsular Malaysia
SABAH - - - - - - - - - SARAWAK - - - - - - - - - WP LABUAN - - - - - - - - -
MALAYSIA 189.6 174.3 3,510.8 180.6 171.5 3,989.9 151.2 142.4 3,916.8
MENGIKUT NEGERI, MALAYSIA, 2013 - 2017JADUAL 8.8 : DATA SIRI MASA LUAS BERTANAM DAN PENGELUARAN CENDAWAN
Table 8.8 : Time Series Data on Planted Area and Production of Mushroom by State, Malaysia, 2013 - 2017
20152014 Negeri 2013
Cendawan
State
151.2 142.4 3,916.8
Mushroom
189.6 174.3 3,510.8 180.6 171.5 3,989.9
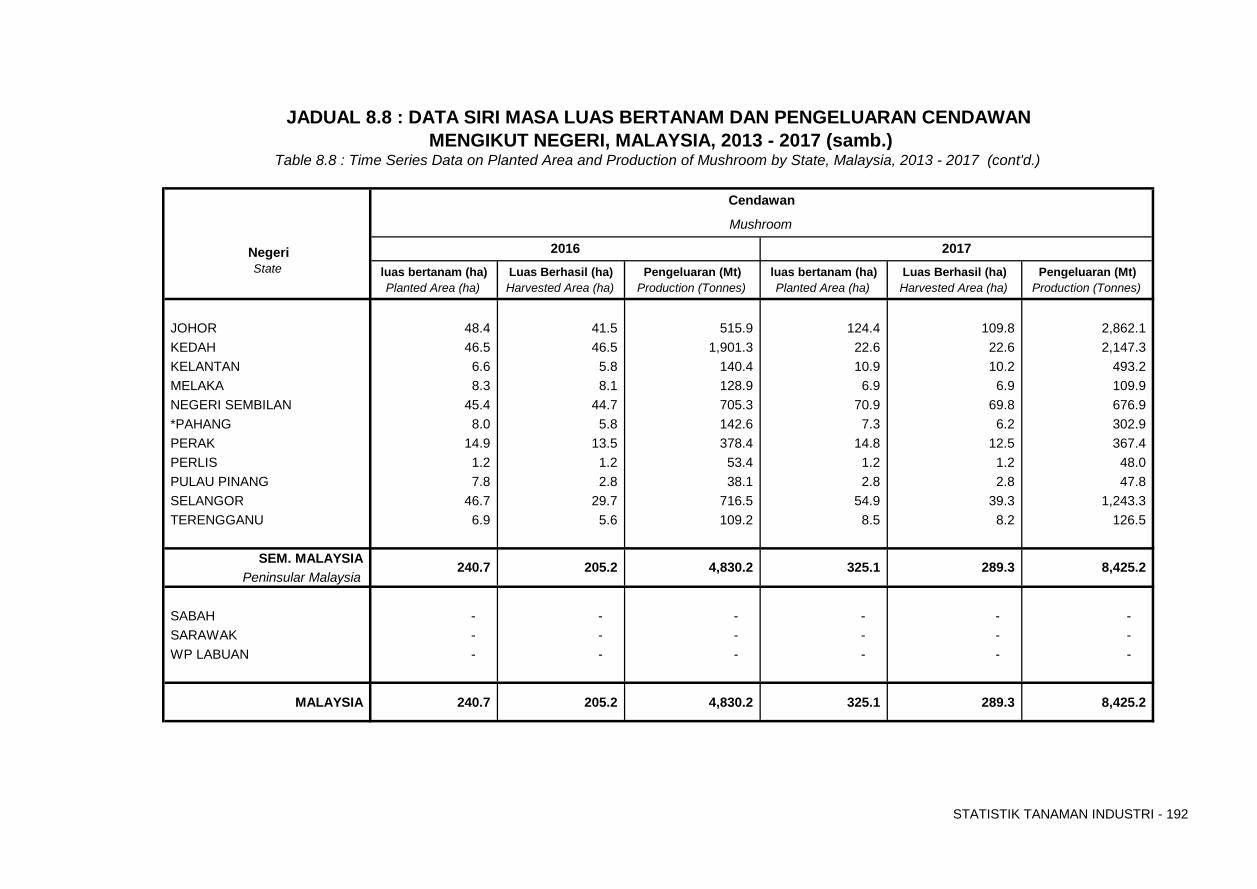
STATISTIK TANAMAN INDUSTRI - 192
State luas bertanam (ha) Luas Berhasil (ha) Pengeluaran (Mt) luas bertanam (ha) Luas Berhasil (ha) Pengeluaran (Mt)Planted Area (ha) Harvested Area (ha) Production (Tonnes) Planted Area (ha) Harvested Area (ha) Production (Tonnes)
JOHOR 48.4 41.5 515.9 124.4 109.8 2,862.1 KEDAH 46.5 46.5 1,901.3 22.6 22.6 2,147.3 KELANTAN 6.6 5.8 140.4 10.9 10.2 493.2 MELAKA 8.3 8.1 128.9 6.9 6.9 109.9 NEGERI SEMBILAN 45.4 44.7 705.3 70.9 69.8 676.9 *PAHANG 8.0 5.8 142.6 7.3 6.2 302.9 PERAK 14.9 13.5 378.4 14.8 12.5 367.4 PERLIS 1.2 1.2 53.4 1.2 1.2 48.0 PULAU PINANG 7.8 2.8 38.1 2.8 2.8 47.8 SELANGOR 46.7 29.7 716.5 54.9 39.3 1,243.3 TERENGGANU 6.9 5.6 109.2 8.5 8.2 126.5
SEM. MALAYSIAPeninsular Malaysia
SABAH - - - - - - SARAWAK - - - - - - WP LABUAN - - - - - -
MALAYSIA 240.7 205.2 4,830.2 325.1 289.3 8,425.2
Cendawan
Mushroom
289.3 8,425.2
JADUAL 8.8 : DATA SIRI MASA LUAS BERTANAM DAN PENGELUARAN CENDAWAN MENGIKUT NEGERI, MALAYSIA, 2013 - 2017 (samb.)
Negeri
240.7 205.2 4,830.2
Table 8.8 : Time Series Data on Planted Area and Production of Mushroom by State, Malaysia, 2013 - 2017 (cont'd.)
325.1
20172016

STATISTIK TANAMAN INDUSTRI - 193
luas bertanam (ha) Luas Berhasil (ha) Pengeluaran (Mt) luas bertanam (ha) Luas Berhasil (ha) Pengeluaran (Mt) luas bertanam (ha) Luas Berhasil (ha) Pengeluaran (Mt)Planted Area (ha) Harvested Area (ha) Production (Tonnes) Planted Area (ha) Harvested Area (ha) Production (Tonnes) Planted Area (ha) Harvested Area (ha) Production (Tonnes)
JOHOR - - - - - - - - - KEDAH - - - - - - - - - KELANTAN - - - - - - - - - MELAKA - - - - - - - - - NEGERI SEMBILAN - - - - - - - - - PAHANG - - - - - - - - - PERAK - - - - - - - - - PERLIS - - - - - - - - - PULAU PINANG - - - - - - - - - SELANGOR - - - - - - - - - TERENGGANU - - - - - - - - -
SEM. MALAYSIAPeninsular Malaysia
SABAH - - - - - - - - - SARAWAK - - - - - - - - - WP LABUAN - - - - - - - - -
MALAYSIA - - - - - - - - -
MENGIKUT NEGERI, MALAYSIA, 2013 - 2017JADUAL 8.9 : DATA SIRI MASA LUAS BERTANAM DAN PENGELUARAN LEBAH MADU
Table 8.9 : Time Series Data on Planted Area and Production of Kelulut Bee by State, Malaysia, 2013 - 2017
20152014 Negeri 2013
Lebah Kelulut
State
- - -
Kelulut Bee
- - - - - -
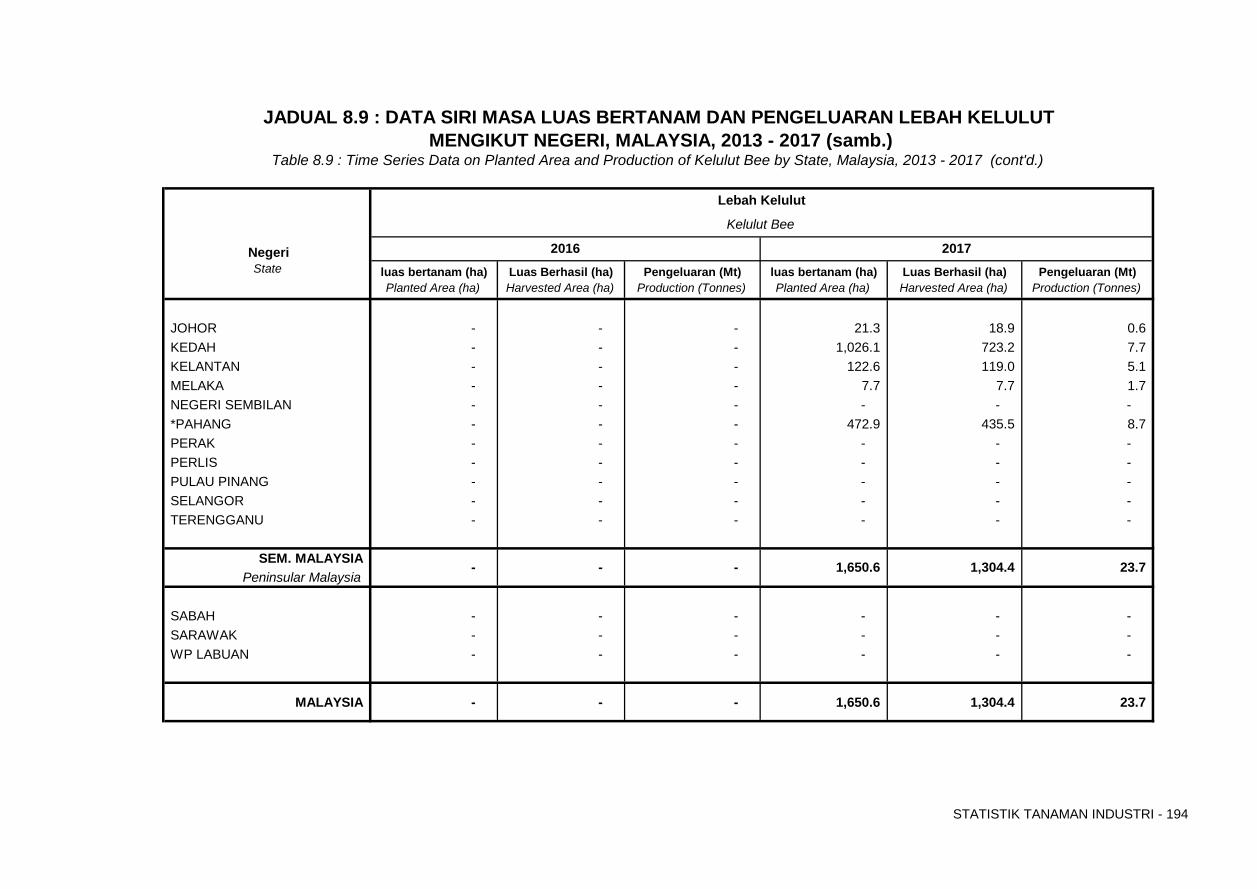
STATISTIK TANAMAN INDUSTRI - 194
State luas bertanam (ha) Luas Berhasil (ha) Pengeluaran (Mt) luas bertanam (ha) Luas Berhasil (ha) Pengeluaran (Mt)Planted Area (ha) Harvested Area (ha) Production (Tonnes) Planted Area (ha) Harvested Area (ha) Production (Tonnes)
JOHOR - - - 21.3 18.9 0.6 KEDAH - - - 1,026.1 723.2 7.7 KELANTAN - - - 122.6 119.0 5.1 MELAKA - - - 7.7 7.7 1.7 NEGERI SEMBILAN - - - - - - *PAHANG - - - 472.9 435.5 8.7 PERAK - - - - - - PERLIS - - - - - - PULAU PINANG - - - - - - SELANGOR - - - - - - TERENGGANU - - - - - -
SEM. MALAYSIAPeninsular Malaysia
SABAH - - - - - - SARAWAK - - - - - - WP LABUAN - - - - - -
MALAYSIA - - - 1,650.6 1,304.4 23.7
Lebah Kelulut
Kelulut Bee
1,304.4 23.7
JADUAL 8.9 : DATA SIRI MASA LUAS BERTANAM DAN PENGELUARAN LEBAH KELULUT MENGIKUT NEGERI, MALAYSIA, 2013 - 2017 (samb.)
Negeri
- - -
Table 8.9 : Time Series Data on Planted Area and Production of Kelulut Bee by State, Malaysia, 2013 - 2017 (cont'd.)
1,650.6
20172016

STATISTIK TANAMAN INDUSTRI - 195
luas bertanam (ha) Luas Berhasil (ha) Pengeluaran (Mt) luas bertanam (ha) Luas Berhasil (ha) Pengeluaran (Mt) luas bertanam (ha) Luas Berhasil (ha) Pengeluaran (Mt)Planted Area (ha) Harvested Area (ha) Production (Tonnes) Planted Area (ha) Harvested Area (ha) Production (Tonnes) Planted Area (ha) Harvested Area (ha) Production (Tonnes)
JOHOR - - - - - - - - - KEDAH - - - - - - - - - KELANTAN - - - - - - - - - MELAKA - - - - - - - - - NEGERI SEMBILAN - - - - - - - - - PAHANG - - - - - - - - - PERAK - - - - - - - - - PERLIS - - - - - - - - - PULAU PINANG - - - - - - - - - SELANGOR - - - - - - - - - TERENGGANU - - - - - - - - -
SEM. MALAYSIAPeninsular Malaysia
SABAH - - - - - - - - - SARAWAK - - - - - - - - - WP LABUAN - - - - - - - - -
MALAYSIA - - - - - - - - -
State
- - -
Honey Bee
- - - - - -
MENGIKUT NEGERI, MALAYSIA, 2013 - 2017JADUAL 8.10 : DATA SIRI MASA LUAS BERTANAM DAN PENGELUARAN LEBAH MADU
Table 8.10 : Time Series Data on Planted Area and Production of Honey Bee by State, Malaysia, 2013 - 2017
20152014 Negeri 2013
Lebah Madu
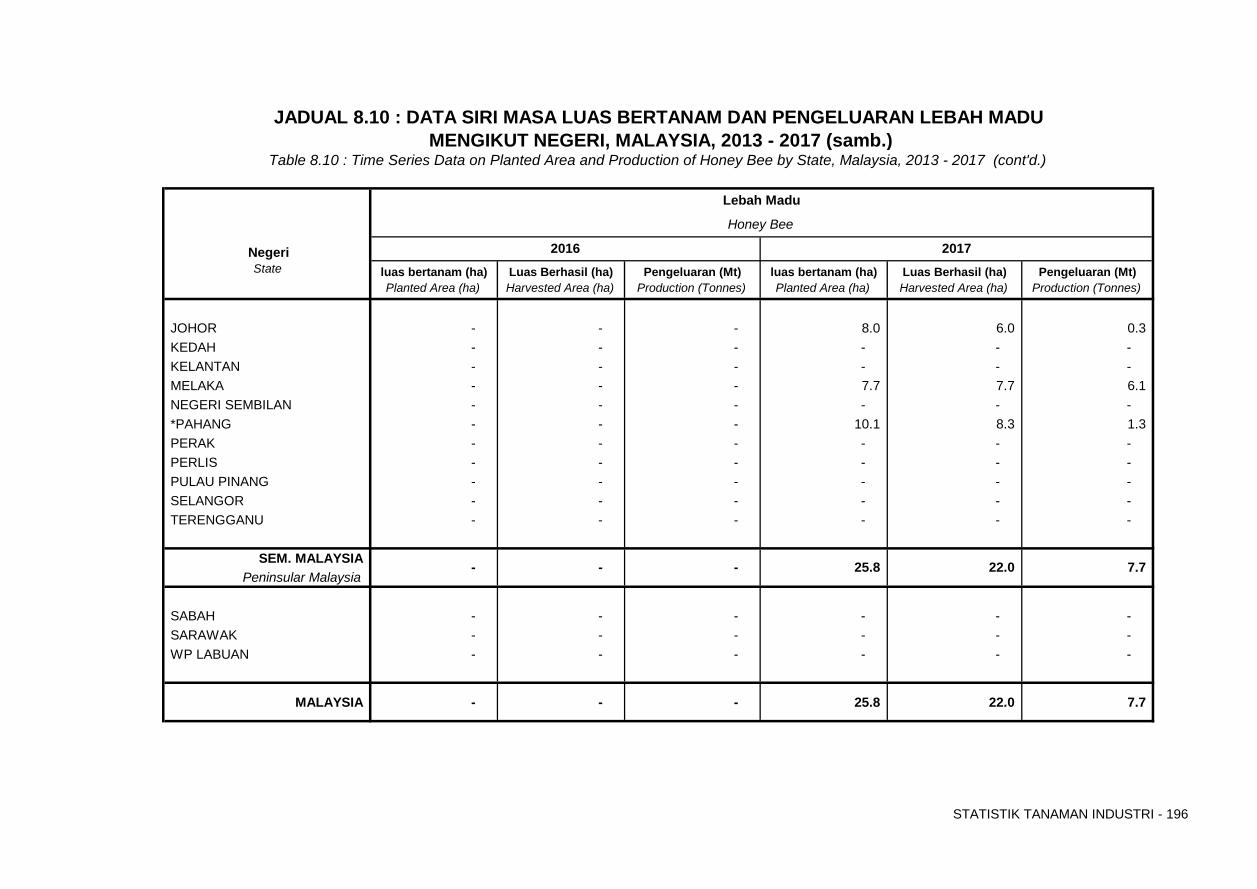
STATISTIK TANAMAN INDUSTRI - 196
State luas bertanam (ha) Luas Berhasil (ha) Pengeluaran (Mt) luas bertanam (ha) Luas Berhasil (ha) Pengeluaran (Mt)Planted Area (ha) Harvested Area (ha) Production (Tonnes) Planted Area (ha) Harvested Area (ha) Production (Tonnes)
JOHOR - - - 8.0 6.0 0.3 KEDAH - - - - - - KELANTAN - - - - - - MELAKA - - - 7.7 7.7 6.1 NEGERI SEMBILAN - - - - - - *PAHANG - - - 10.1 8.3 1.3 PERAK - - - - - - PERLIS - - - - - - PULAU PINANG - - - - - - SELANGOR - - - - - - TERENGGANU - - - - - -
SEM. MALAYSIAPeninsular Malaysia
SABAH - - - - - - SARAWAK - - - - - - WP LABUAN - - - - - -
MALAYSIA - - - 25.8 22.0 7.7
Lebah Madu
Honey Bee
22.0 7.7
JADUAL 8.10 : DATA SIRI MASA LUAS BERTANAM DAN PENGELUARAN LEBAH MADU MENGIKUT NEGERI, MALAYSIA, 2013 - 2017 (samb.)
Negeri
- - -
Table 8.10 : Time Series Data on Planted Area and Production of Honey Bee by State, Malaysia, 2013 - 2017 (cont'd.)
25.8
20172016
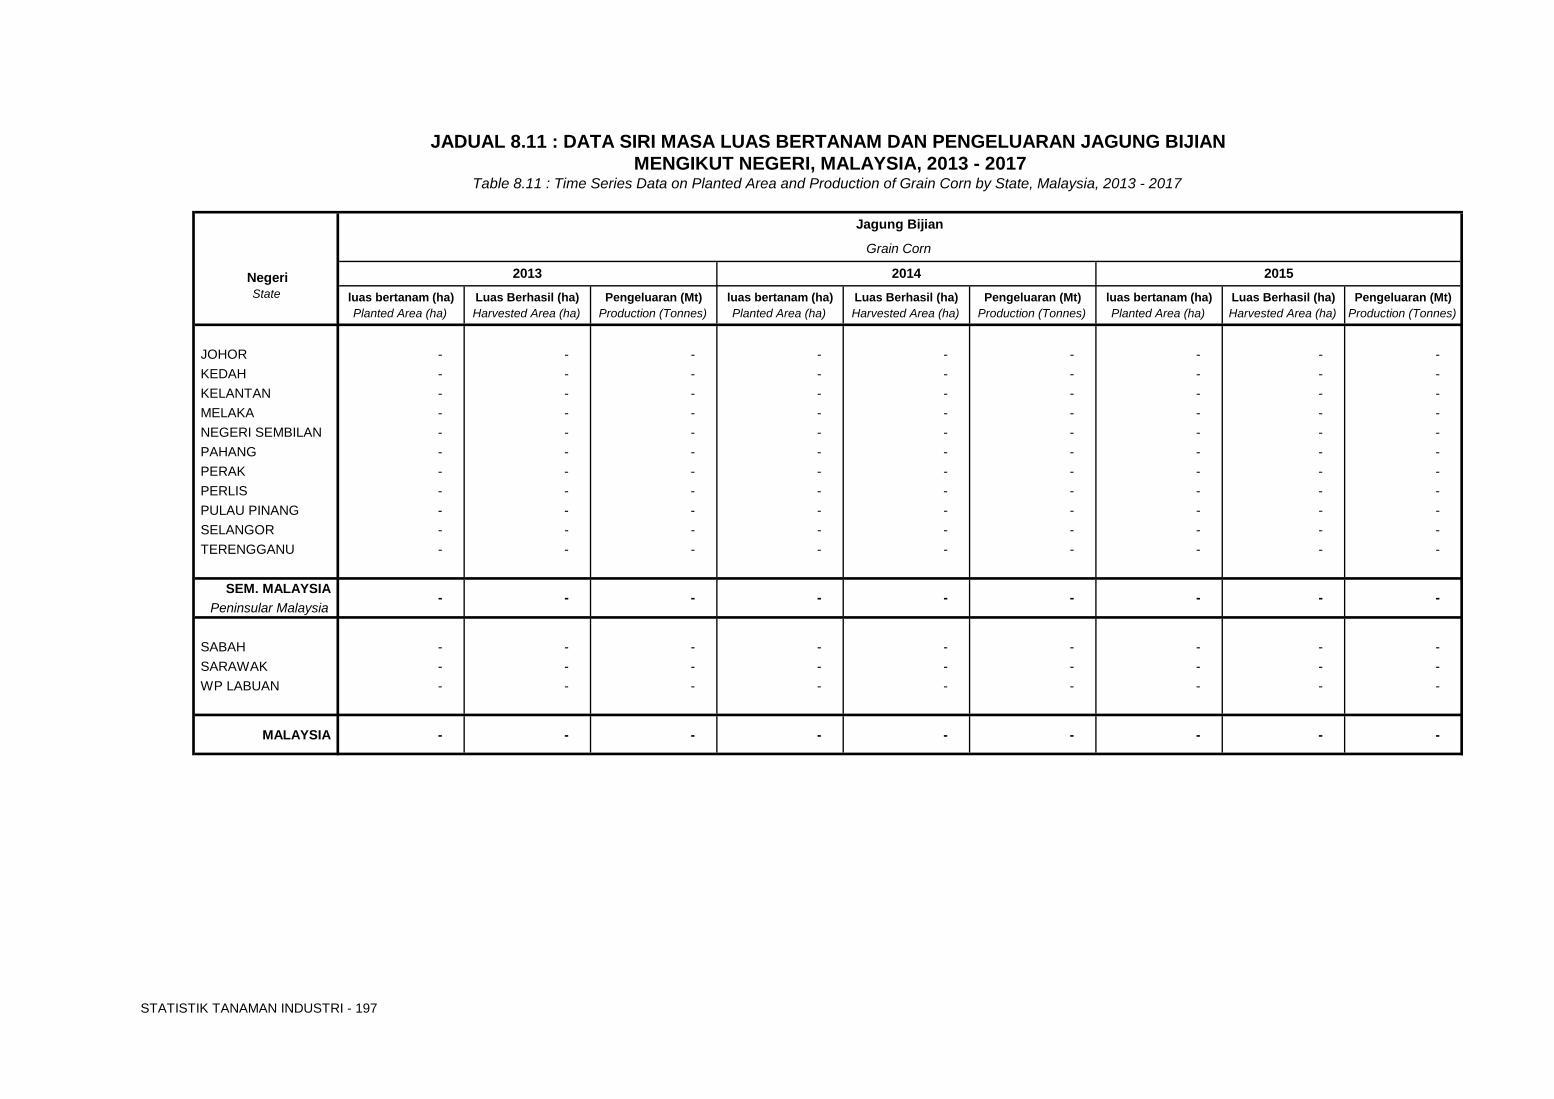
STATISTIK TANAMAN INDUSTRI - 197
luas bertanam (ha) Luas Berhasil (ha) Pengeluaran (Mt) luas bertanam (ha) Luas Berhasil (ha) Pengeluaran (Mt) luas bertanam (ha) Luas Berhasil (ha) Pengeluaran (Mt)Planted Area (ha) Harvested Area (ha) Production (Tonnes) Planted Area (ha) Harvested Area (ha) Production (Tonnes) Planted Area (ha) Harvested Area (ha) Production (Tonnes)
JOHOR - - - - - - - - - KEDAH - - - - - - - - - KELANTAN - - - - - - - - - MELAKA - - - - - - - - - NEGERI SEMBILAN - - - - - - - - - PAHANG - - - - - - - - - PERAK - - - - - - - - - PERLIS - - - - - - - - - PULAU PINANG - - - - - - - - - SELANGOR - - - - - - - - - TERENGGANU - - - - - - - - -
SEM. MALAYSIAPeninsular Malaysia
SABAH - - - - - - - - - SARAWAK - - - - - - - - - WP LABUAN - - - - - - - - -
MALAYSIA - - - - - - - - -
State
- - -
Grain Corn
- - - - - -
MENGIKUT NEGERI, MALAYSIA, 2013 - 2017JADUAL 8.11 : DATA SIRI MASA LUAS BERTANAM DAN PENGELUARAN JAGUNG BIJIAN
Table 8.11 : Time Series Data on Planted Area and Production of Grain Corn by State, Malaysia, 2013 - 2017
20152014 Negeri 2013
Jagung Bijian
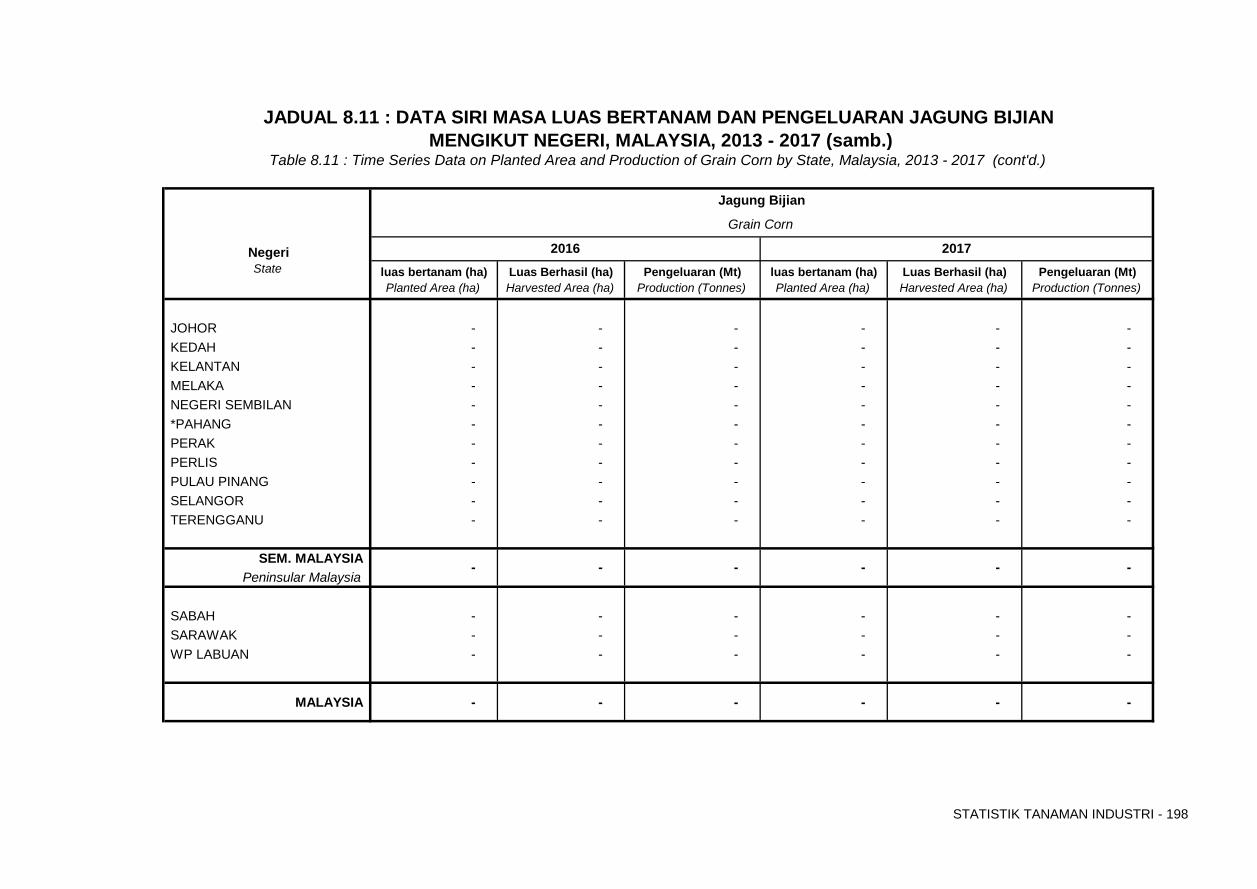
STATISTIK TANAMAN INDUSTRI - 198
State luas bertanam (ha) Luas Berhasil (ha) Pengeluaran (Mt) luas bertanam (ha) Luas Berhasil (ha) Pengeluaran (Mt)Planted Area (ha) Harvested Area (ha) Production (Tonnes) Planted Area (ha) Harvested Area (ha) Production (Tonnes)
JOHOR - - - - - - KEDAH - - - - - - KELANTAN - - - - - - MELAKA - - - - - - NEGERI SEMBILAN - - - - - - *PAHANG - - - - - - PERAK - - - - - - PERLIS - - - - - - PULAU PINANG - - - - - - SELANGOR - - - - - - TERENGGANU - - - - - -
SEM. MALAYSIAPeninsular Malaysia
SABAH - - - - - - SARAWAK - - - - - - WP LABUAN - - - - - -
MALAYSIA - - - - - -
Jagung Bijian
Grain Corn
- -
JADUAL 8.11 : DATA SIRI MASA LUAS BERTANAM DAN PENGELUARAN JAGUNG BIJIAN MENGIKUT NEGERI, MALAYSIA, 2013 - 2017 (samb.)
Negeri
- - -
Table 8.11 : Time Series Data on Planted Area and Production of Grain Corn by State, Malaysia, 2013 - 2017 (cont'd.)
-
20172016
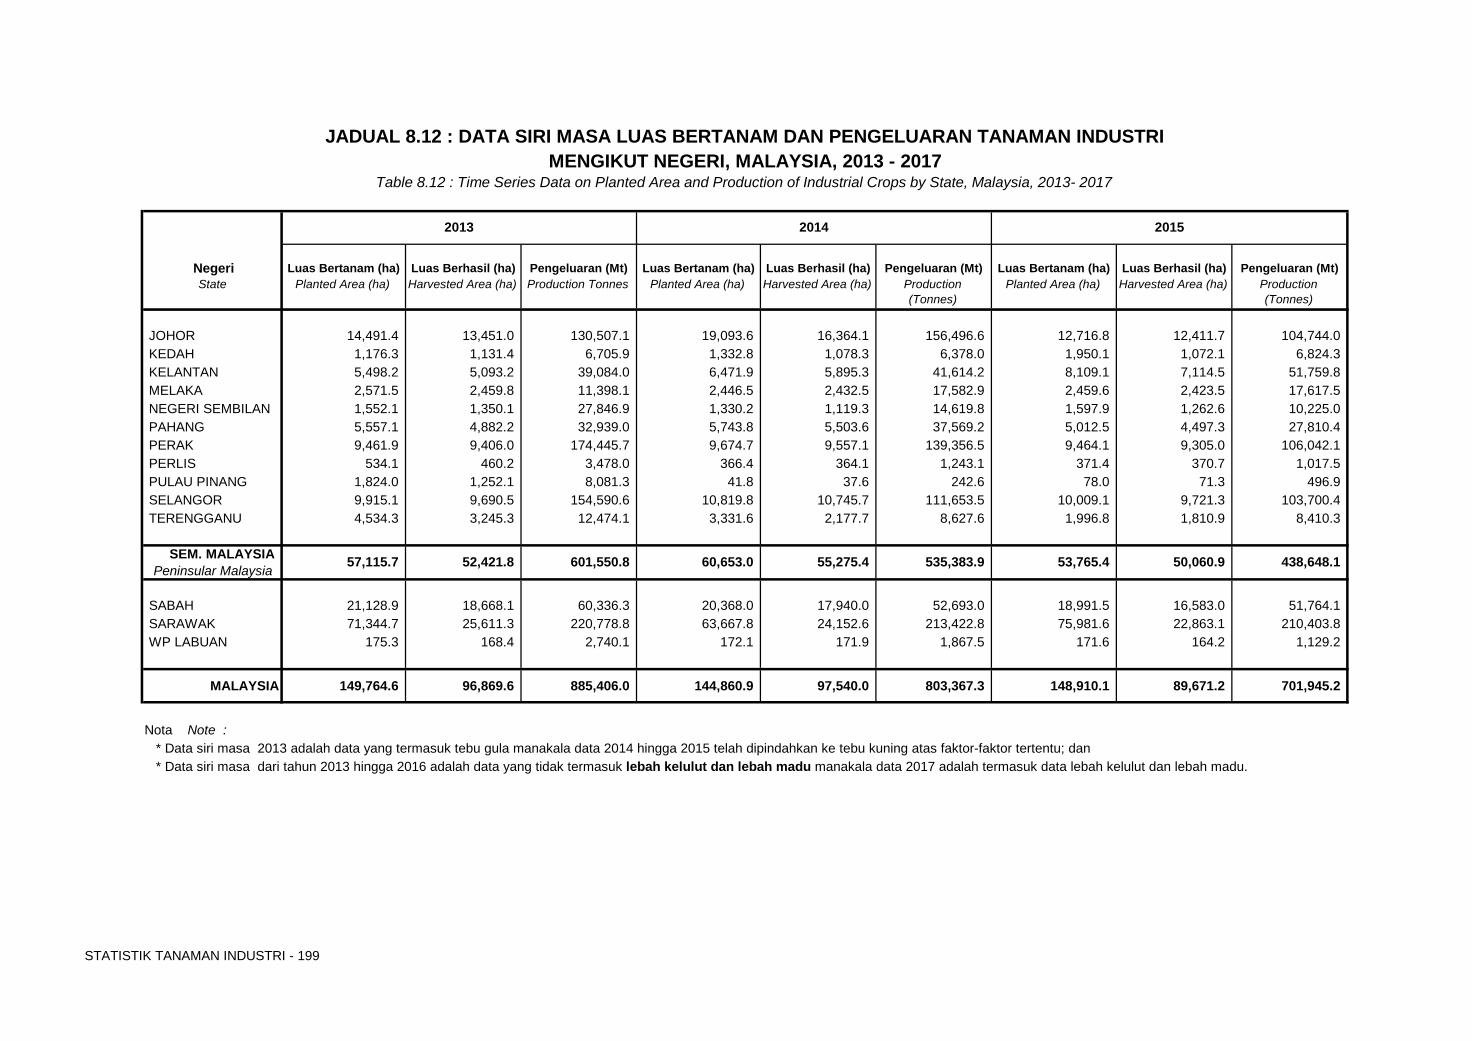
STATISTIK TANAMAN INDUSTRI - 199
Luas Bertanam (ha) Luas Berhasil (ha) Pengeluaran (Mt) Luas Bertanam (ha) Luas Berhasil (ha) Pengeluaran (Mt) Luas Bertanam (ha) Luas Berhasil (ha) Pengeluaran (Mt) State Planted Area (ha) Harvested Area (ha) Production Tonnes Planted Area (ha) Harvested Area (ha) Production
(Tonnes)Planted Area (ha) Harvested Area (ha) Production
(Tonnes)
JOHOR 14,491.4 13,451.0 130,507.1 19,093.6 16,364.1 156,496.6 12,716.8 12,411.7 104,744.0 KEDAH 1,176.3 1,131.4 6,705.9 1,332.8 1,078.3 6,378.0 1,950.1 1,072.1 6,824.3 KELANTAN 5,498.2 5,093.2 39,084.0 6,471.9 5,895.3 41,614.2 8,109.1 7,114.5 51,759.8 MELAKA 2,571.5 2,459.8 11,398.1 2,446.5 2,432.5 17,582.9 2,459.6 2,423.5 17,617.5 NEGERI SEMBILAN 1,552.1 1,350.1 27,846.9 1,330.2 1,119.3 14,619.8 1,597.9 1,262.6 10,225.0 PAHANG 5,557.1 4,882.2 32,939.0 5,743.8 5,503.6 37,569.2 5,012.5 4,497.3 27,810.4 PERAK 9,461.9 9,406.0 174,445.7 9,674.7 9,557.1 139,356.5 9,464.1 9,305.0 106,042.1 PERLIS 534.1 460.2 3,478.0 366.4 364.1 1,243.1 371.4 370.7 1,017.5 PULAU PINANG 1,824.0 1,252.1 8,081.3 41.8 37.6 242.6 78.0 71.3 496.9 SELANGOR 9,915.1 9,690.5 154,590.6 10,819.8 10,745.7 111,653.5 10,009.1 9,721.3 103,700.4 TERENGGANU 4,534.3 3,245.3 12,474.1 3,331.6 2,177.7 8,627.6 1,996.8 1,810.9 8,410.3
SEM. MALAYSIAPeninsular Malaysia
SABAH 21,128.9 18,668.1 60,336.3 20,368.0 17,940.0 52,693.0 18,991.5 16,583.0 51,764.1 SARAWAK 71,344.7 25,611.3 220,778.8 63,667.8 24,152.6 213,422.8 75,981.6 22,863.1 210,403.8 WP LABUAN 175.3 168.4 2,740.1 172.1 171.9 1,867.5 171.6 164.2 1,129.2
MALAYSIA 149,764.6 96,869.6 885,406.0 144,860.9 97,540.0 803,367.3 148,910.1 89,671.2 701,945.2
Nota Note : * Data siri masa 2013 adalah data yang termasuk tebu gula manakala data 2014 hingga 2015 telah dipindahkan ke tebu kuning atas faktor-faktor tertentu; dan * Data siri masa dari tahun 2013 hingga 2016 adalah data yang tidak termasuk lebah kelulut dan lebah madu manakala data 2017 adalah termasuk data lebah kelulut dan lebah madu.
535,383.9 438,648.1 55,275.4
JADUAL 8.12 : DATA SIRI MASA LUAS BERTANAM DAN PENGELUARAN TANAMAN INDUSTRIMENGIKUT NEGERI, MALAYSIA, 2013 - 2017
Table 8.12 : Time Series Data on Planted Area and Production of Industrial Crops by State, Malaysia, 2013- 2017
Negeri
60,653.0 53,765.4 50,060.9 601,550.8
20152013 2014
57,115.7 52,421.8
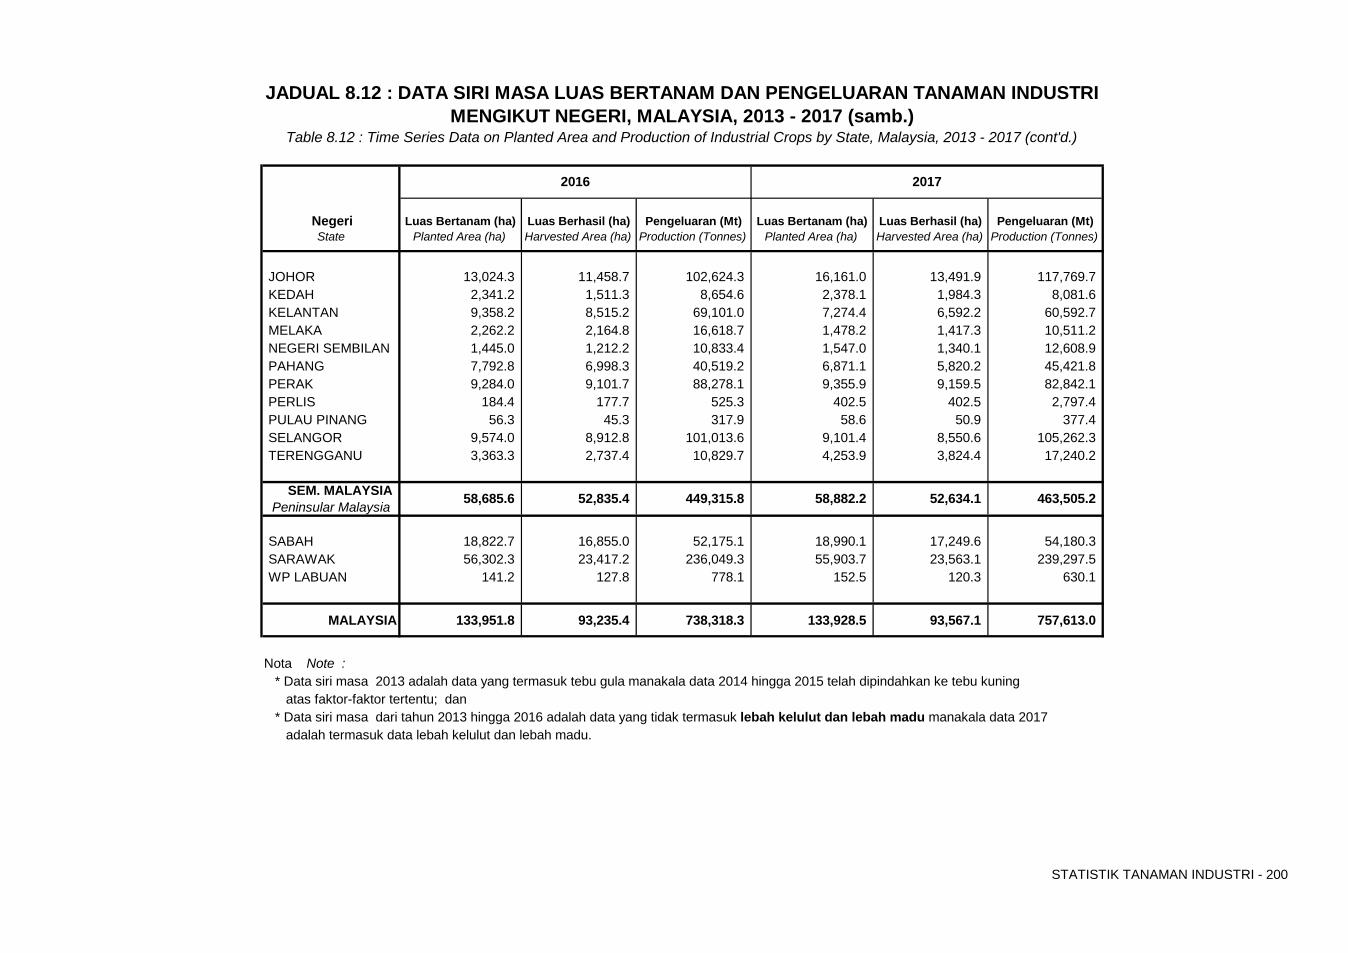
STATISTIK TANAMAN INDUSTRI - 200
Luas Bertanam (ha) Luas Berhasil (ha) Pengeluaran (Mt) Luas Bertanam (ha) Luas Berhasil (ha) Pengeluaran (Mt) State Planted Area (ha) Harvested Area (ha) Production (Tonnes) Planted Area (ha) Harvested Area (ha) Production (Tonnes)
JOHOR 13,024.3 11,458.7 102,624.3 16,161.0 13,491.9 117,769.7 KEDAH 2,341.2 1,511.3 8,654.6 2,378.1 1,984.3 8,081.6 KELANTAN 9,358.2 8,515.2 69,101.0 7,274.4 6,592.2 60,592.7 MELAKA 2,262.2 2,164.8 16,618.7 1,478.2 1,417.3 10,511.2 NEGERI SEMBILAN 1,445.0 1,212.2 10,833.4 1,547.0 1,340.1 12,608.9 PAHANG 7,792.8 6,998.3 40,519.2 6,871.1 5,820.2 45,421.8 PERAK 9,284.0 9,101.7 88,278.1 9,355.9 9,159.5 82,842.1 PERLIS 184.4 177.7 525.3 402.5 402.5 2,797.4 PULAU PINANG 56.3 45.3 317.9 58.6 50.9 377.4 SELANGOR 9,574.0 8,912.8 101,013.6 9,101.4 8,550.6 105,262.3 TERENGGANU 3,363.3 2,737.4 10,829.7 4,253.9 3,824.4 17,240.2
SEM. MALAYSIAPeninsular Malaysia
SABAH 18,822.7 16,855.0 52,175.1 18,990.1 17,249.6 54,180.3 SARAWAK 56,302.3 23,417.2 236,049.3 55,903.7 23,563.1 239,297.5 WP LABUAN 141.2 127.8 778.1 152.5 120.3 630.1
MALAYSIA 133,951.8 93,235.4 738,318.3 133,928.5 93,567.1 757,613.0
Nota Note : * Data siri masa 2013 adalah data yang termasuk tebu gula manakala data 2014 hingga 2015 telah dipindahkan ke tebu kuning atas faktor-faktor tertentu; dan * Data siri masa dari tahun 2013 hingga 2016 adalah data yang tidak termasuk lebah kelulut dan lebah madu manakala data 2017 adalah termasuk data lebah kelulut dan lebah madu.
JADUAL 8.12 : DATA SIRI MASA LUAS BERTANAM DAN PENGELUARAN TANAMAN INDUSTRI MENGIKUT NEGERI, MALAYSIA, 2013 - 2017 (samb.)
Table 8.12 : Time Series Data on Planted Area and Production of Industrial Crops by State, Malaysia, 2013 - 2017 (cont'd.)
463,505.2
2017
52,634.1
Negeri
2016
58,685.6 52,835.4 449,315.8 58,882.2

Muka surat ini sengaja dibiarkan kosong
BAHAGIAN C
Part C
STATISTIK TANAMAN INDUSTRI DI BAWAH KEMENTERIAN
PERUSAHAAN PERLADANGAN & KOMODITI (KPPK), MALAYSIA, 2017
Statistics of Industrial Crops Under Ministry of Plantation Industries & Commodities (MPIC), Malaysia, 2017
SEKSYEN 9
Section 9
LUAS BERTANAM DAN PENGELUARAN TANAMAN INDUSTRI UTAMA MENGIKUT JENIS PENGURUSAN, KAWASAN DAN NEGERI,
MALAYSIA, 2017
Planted Area and Production of Main Industrial Crops
by Type of Management, Region and State, Malaysia, 2017
Data Sekunder: KPPK Secondary Data: MPIC
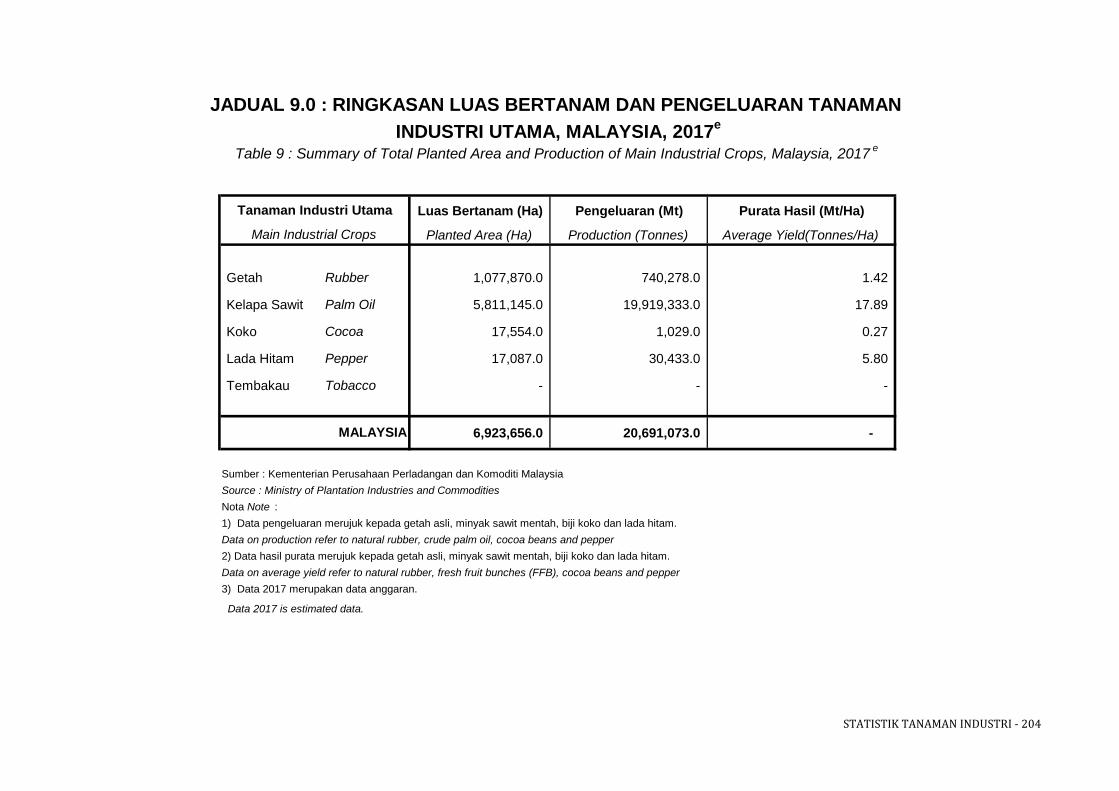
STATISTIK TANAMAN INDUSTRI - 204
Luas Bertanam (Ha) Pengeluaran (Mt) Purata Hasil (Mt/Ha)
Planted Area (Ha) Production (Tonnes) Average Yield(Tonnes/Ha)
Getah Rubber 1,077,870.0 740,278.0 1.42
Kelapa Sawit Palm Oil 5,811,145.0 19,919,333.0 17.89
Koko Cocoa 17,554.0 1,029.0 0.27
Lada Hitam Pepper 17,087.0 30,433.0 5.80
Tembakau Tobacco - - -
6,923,656.0 20,691,073.0 -
Sumber : Kementerian Perusahaan Perladangan dan Komoditi MalaysiaSource : Ministry of Plantation Industries and CommoditiesNota Note : 1) Data pengeluaran merujuk kepada getah asli, minyak sawit mentah, biji koko dan lada hitam.Data on production refer to natural rubber, crude palm oil, cocoa beans and pepper2) Data hasil purata merujuk kepada getah asli, minyak sawit mentah, biji koko dan lada hitam.Data on average yield refer to natural rubber, fresh fruit bunches (FFB), cocoa beans and pepper3) Data 2017 merupakan data anggaran.
Data 2017 is estimated data.
MALAYSIA
Tanaman Industri Utama
JADUAL 9.0 : RINGKASAN LUAS BERTANAM DAN PENGELUARAN TANAMAN INDUSTRI UTAMA, MALAYSIA, 2017e
Table 9 : Summary of Total Planted Area and Production of Main Industrial Crops, Malaysia, 2017 e
Main Industrial Crops
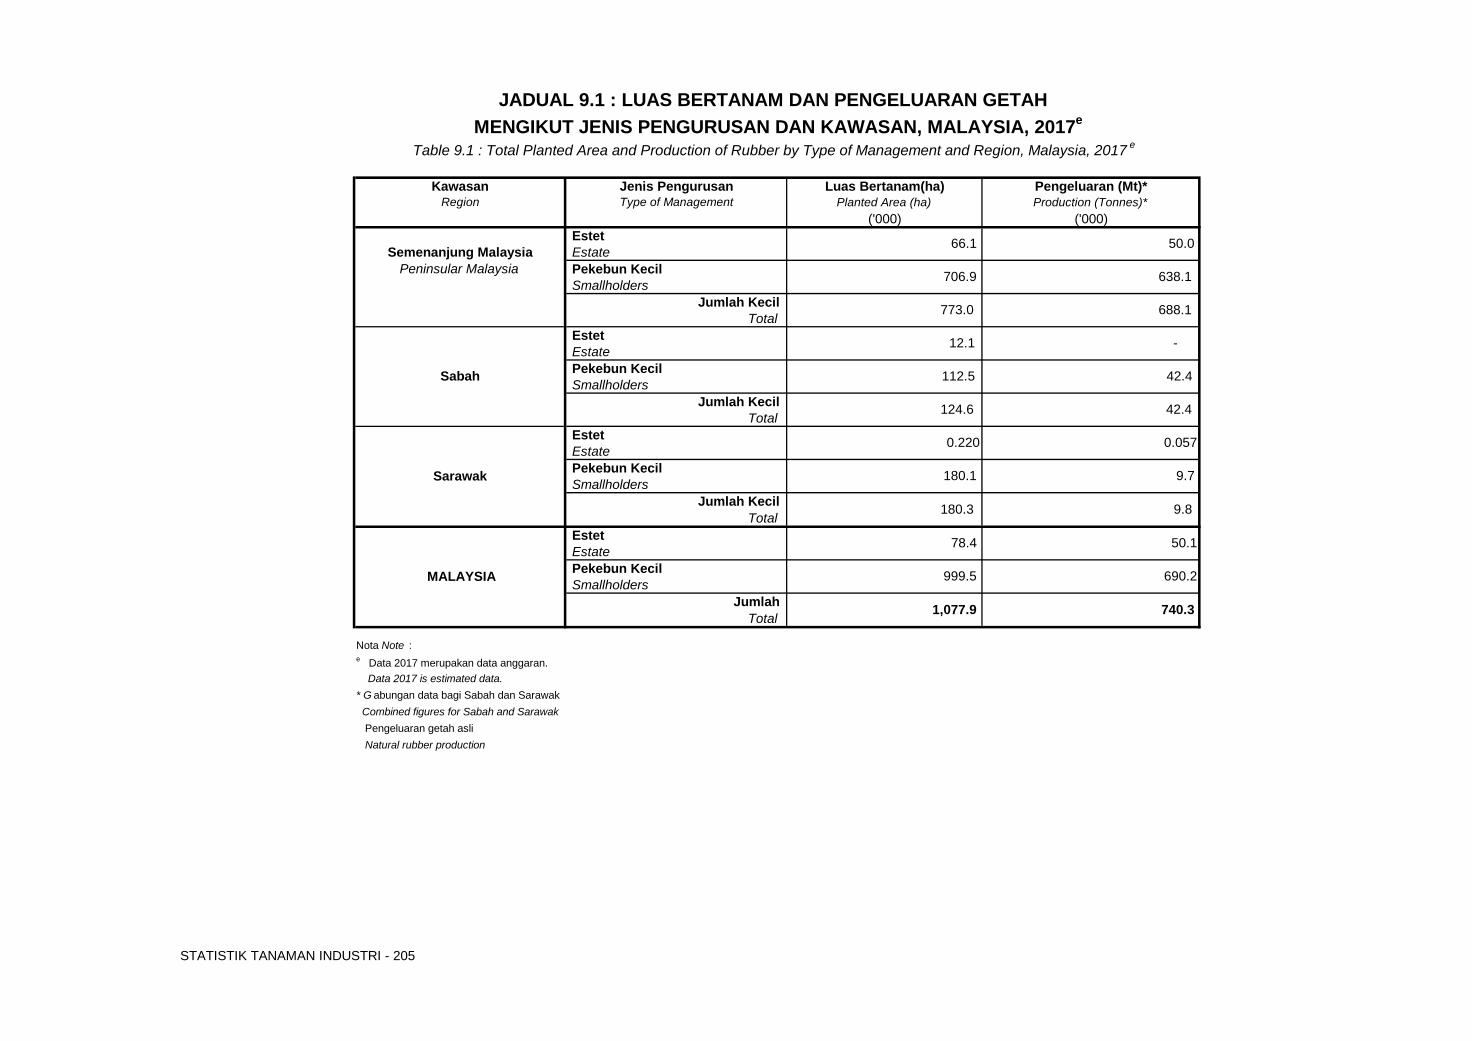
STATISTIK TANAMAN INDUSTRI - 205
Kawasan Jenis Pengurusan Luas Bertanam(ha) Pengeluaran (Mt)*Planted Area (ha) Production (Tonnes)*
('000) ('000)Estet EstatePekebun KecilSmallholders
Jumlah KecilTotal
Estet EstatePekebun KecilSmallholders
Jumlah KecilTotal
Estet EstatePekebun KecilSmallholders
Jumlah KecilTotal
Estet EstatePekebun KecilSmallholders
JumlahTotal
Nota Note : e Data 2017 merupakan data anggaran. Data 2017 is estimated data.* G abungan data bagi Sabah dan Sarawak Combined figures for Sabah and Sarawak Pengeluaran getah asli Natural rubber production
-
42.4
42.4
0.057
9.7
1,077.9 740.3
50.1
Sabah
Sarawak
180.3
MALAYSIA
0.220
124.6
78.4
690.2 999.5
180.1
12.1
112.5
9.8
706.9
JADUAL 9.1 : LUAS BERTANAM DAN PENGELUARAN GETAH MENGIKUT JENIS PENGURUSAN DAN KAWASAN, MALAYSIA, 2017e
Table 9.1 : Total Planted Area and Production of Rubber by Type of Management and Region, Malaysia, 2017 e
Semenanjung Malaysia 66.1 50.0
Peninsular Malaysia
Region Type of Management
638.1
688.1 773.0
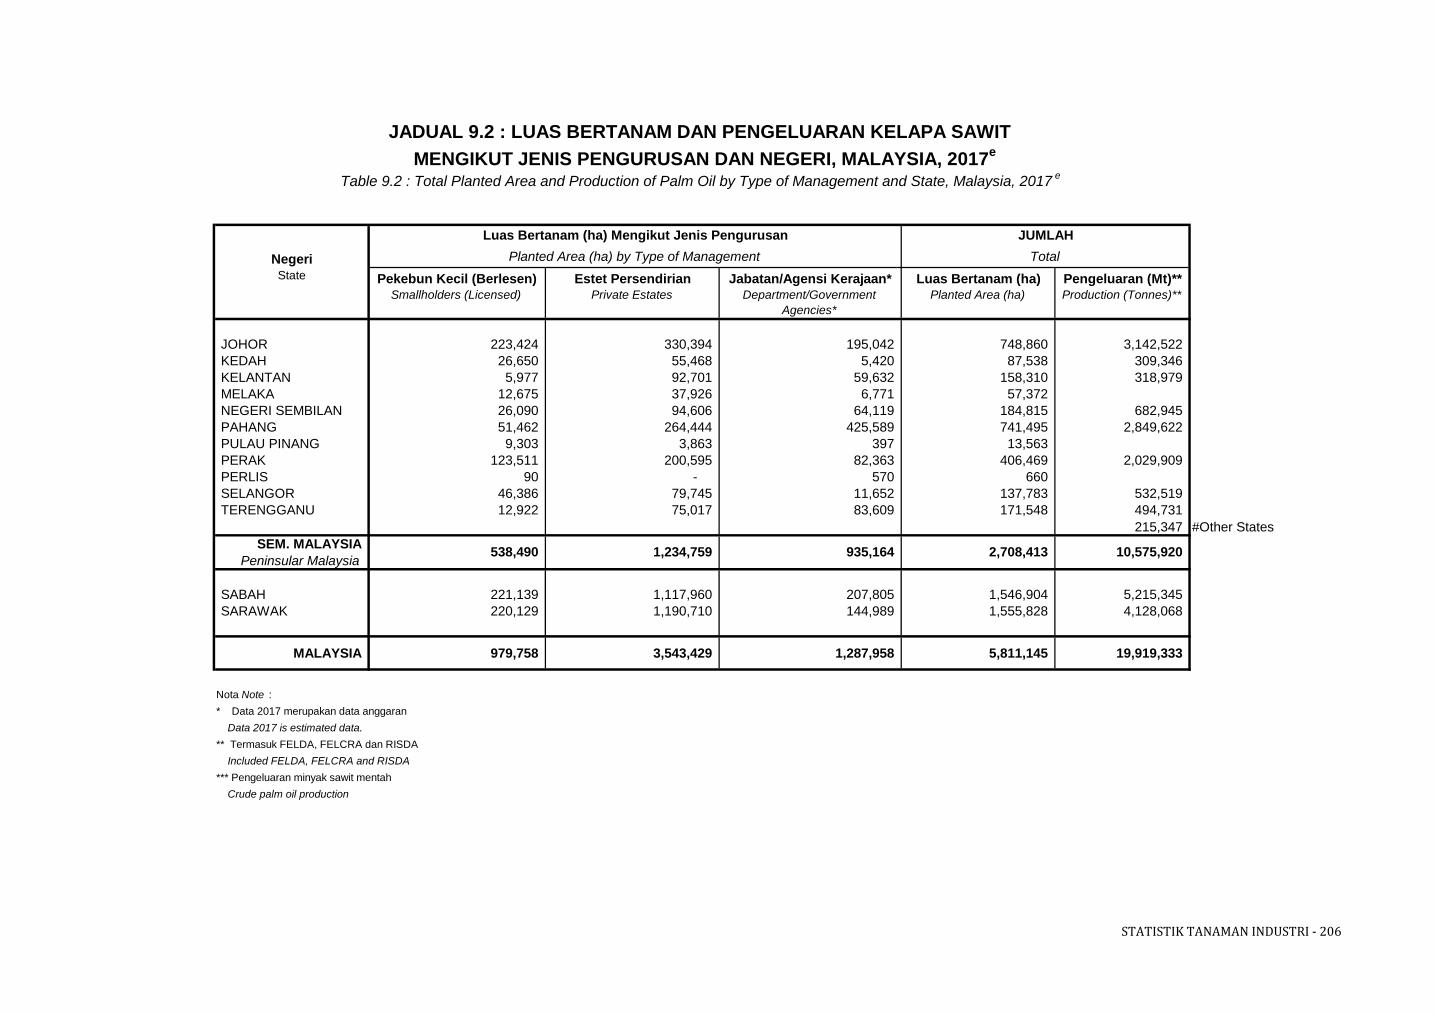
STATISTIK TANAMAN INDUSTRI - 206
Pekebun Kecil (Berlesen) Estet Persendirian Jabatan/Agensi Kerajaan* Luas Bertanam (ha) Pengeluaran (Mt)**Smallholders (Licensed) Private Estates Department/Government
Agencies*Planted Area (ha) Production (Tonnes)**
JOHOR 223,424 330,394 195,042 748,860 3,142,522 KEDAH 26,650 55,468 5,420 87,538 309,346 KELANTAN 5,977 92,701 59,632 158,310 318,979 MELAKA 12,675 37,926 6,771 57,372 NEGERI SEMBILAN 26,090 94,606 64,119 184,815 682,945 PAHANG 51,462 264,444 425,589 741,495 2,849,622 PULAU PINANG 9,303 3,863 397 13,563 PERAK 123,511 200,595 82,363 406,469 2,029,909 PERLIS 90 - 570 660 SELANGOR 46,386 79,745 11,652 137,783 532,519 TERENGGANU 12,922 75,017 83,609 171,548 494,731
215,347 #Other StatesSEM. MALAYSIA
Peninsular Malaysia
SABAH 221,139 1,117,960 207,805 1,546,904 5,215,345 SARAWAK 220,129 1,190,710 144,989 1,555,828 4,128,068
MALAYSIA 979,758 3,543,429 1,287,958 5,811,145 19,919,333
Nota Note : * Data 2017 merupakan data anggaran Data 2017 is estimated data.** Termasuk FELDA, FELCRA dan RISDA Included FELDA, FELCRA and RISDA*** Pengeluaran minyak sawit mentah Crude palm oil production
StateNegeri
JADUAL 9.2 : LUAS BERTANAM DAN PENGELUARAN KELAPA SAWIT MENGIKUT JENIS PENGURUSAN DAN NEGERI, MALAYSIA, 2017e
Table 9.2 : Total Planted Area and Production of Palm Oil by Type of Management and State, Malaysia, 2017 e
Luas Bertanam (ha) Mengikut Jenis Pengurusan JUMLAH
538,490 1,234,759 935,164
Total
2,708,413 10,575,920
Planted Area (ha) by Type of Management
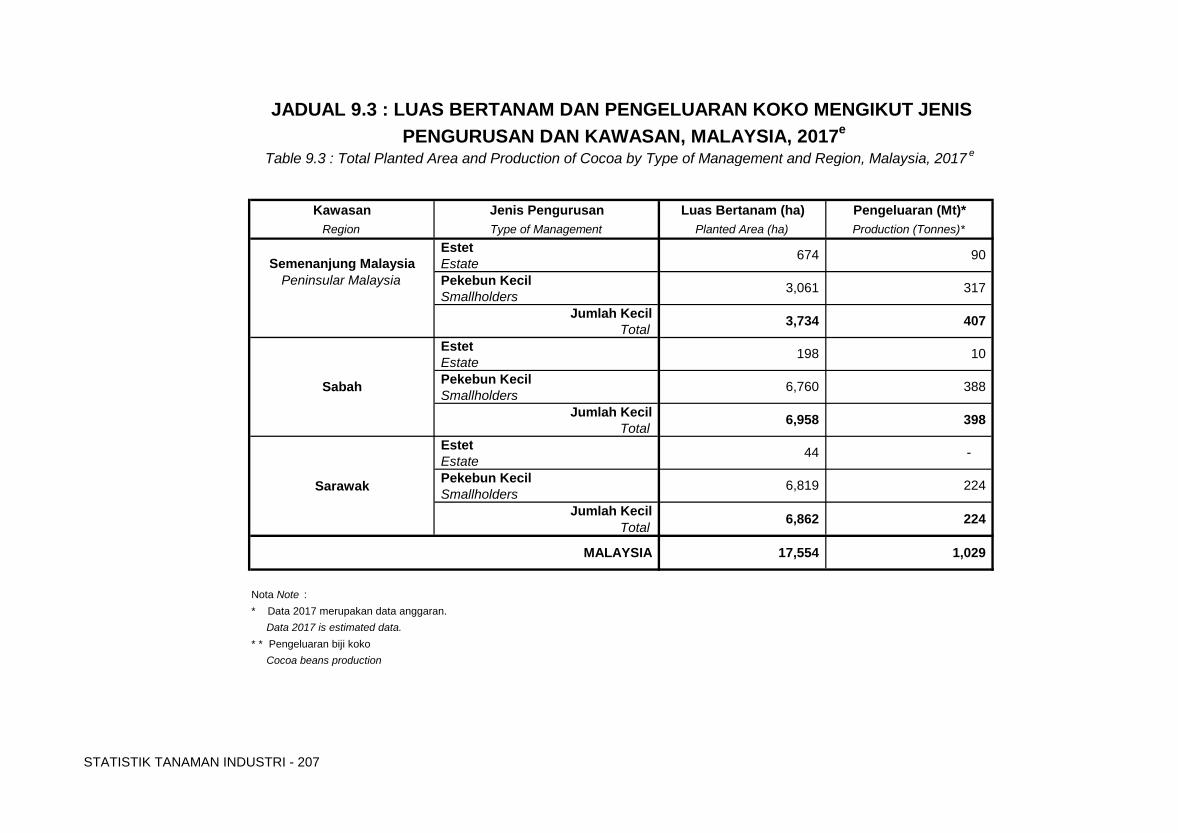
STATISTIK TANAMAN INDUSTRI - 207
Kawasan Jenis Pengurusan Luas Bertanam (ha) Pengeluaran (Mt)*Region Type of Management Planted Area (ha) Production (Tonnes)*
Estet EstatePekebun KecilSmallholders
Jumlah KecilTotal
Estet EstatePekebun KecilSmallholders
Jumlah KecilTotal
Estet EstatePekebun KecilSmallholders
Jumlah KecilTotal
Nota Note : * Data 2017 merupakan data anggaran. Data 2017 is estimated data.* * Pengeluaran biji koko Cocoa beans production
MALAYSIA 1,029 17,554
Sabah
Sarawak
6,862 224
198
398 6,958
44
6,819
6,760 388
JADUAL 9.3 : LUAS BERTANAM DAN PENGELUARAN KOKO MENGIKUT JENIS PENGURUSAN DAN KAWASAN, MALAYSIA, 2017e
Table 9.3 : Total Planted Area and Production of Cocoa by Type of Management and Region, Malaysia, 2017 e
674
3,061
Semenanjung MalaysiaPeninsular Malaysia
90
317
-
224
10
407 3,734
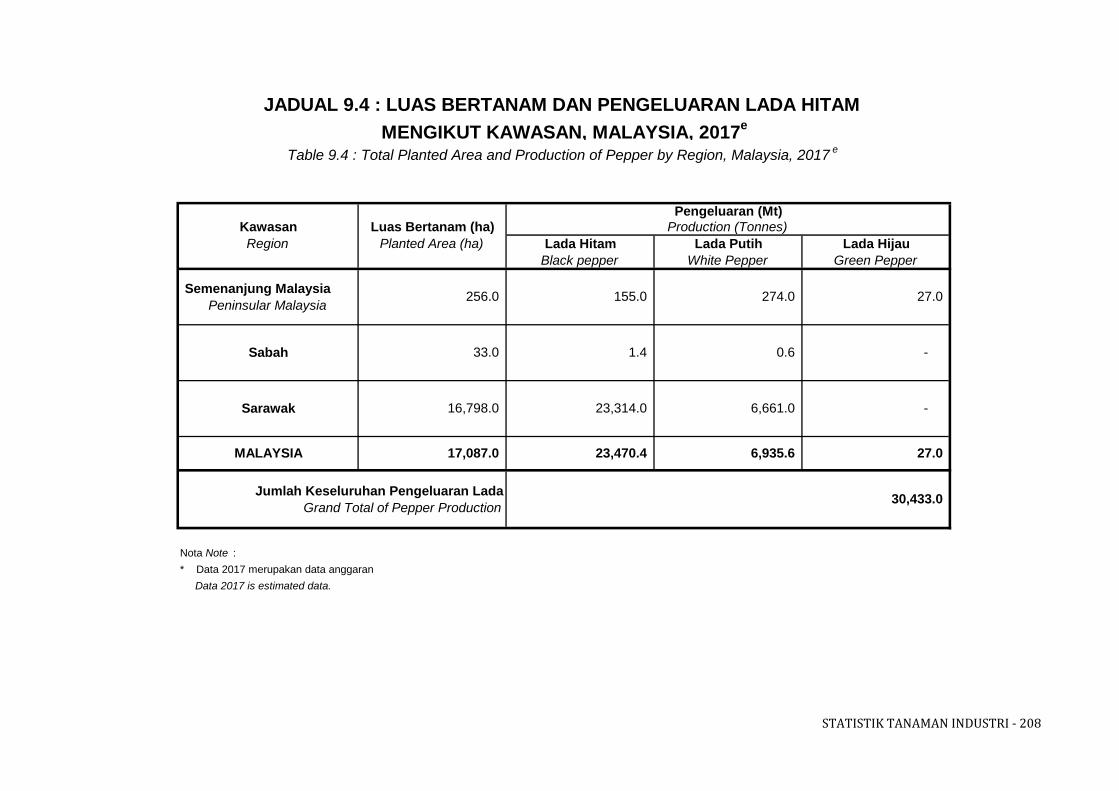
STATISTIK TANAMAN INDUSTRI - 208
Lada Hitam Lada Putih Lada HijauBlack pepper White Pepper Green Pepper
Semenanjung MalaysiaPeninsular Malaysia
Nota Note : * Data 2017 merupakan data anggaran Data 2017 is estimated data.
6,661.0
33.0
30,433.0 Jumlah Keseluruhan Pengeluaran LadaGrand Total of Pepper Production
6,935.6 MALAYSIA 23,470.4 17,087.0 27.0
JADUAL 9.4 : LUAS BERTANAM DAN PENGELUARAN LADA HITAM MENGIKUT KAWASAN, MALAYSIA, 2017e
Table 9.4 : Total Planted Area and Production of Pepper by Region, Malaysia, 2017 e
Pengeluaran (Mt)KawasanRegion
Sabah
Sarawak
Luas Bertanam (ha) Production (Tonnes)
27.0 256.0
- 0.6
155.0
23,314.0
1.4
274.0
Planted Area (ha)
- 16,798.0
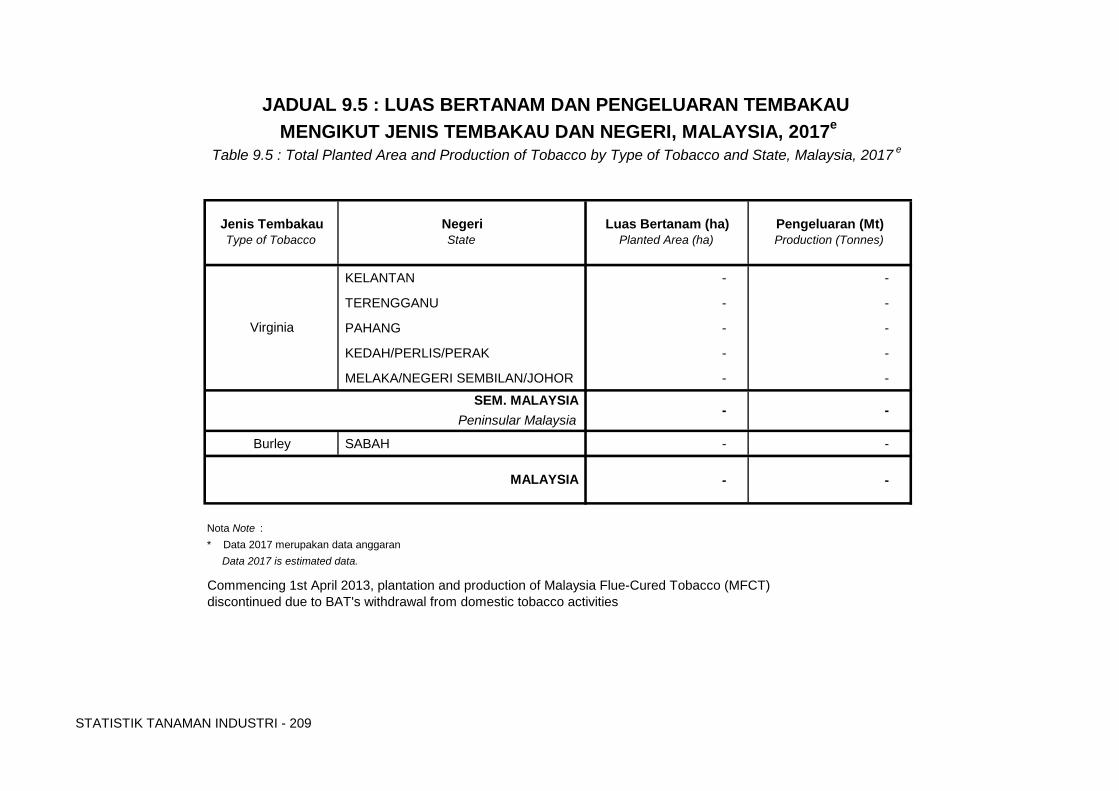
STATISTIK TANAMAN INDUSTRI - 209
KELANTAN - -
TERENGGANU - -
PAHANG - -
KEDAH/PERLIS/PERAK - -
MELAKA/NEGERI SEMBILAN/JOHOR - -
Burley SABAH - -
- -
Nota Note : * Data 2017 merupakan data anggaran Data 2017 is estimated data.
Commencing 1st April 2013, plantation and production of Malaysia Flue-Cured Tobacco (MFCT)discontinued due to BAT's withdrawal from domestic tobacco activities
MALAYSIA
Luas Bertanam (ha)
SEM. MALAYSIA
Virginia
Peninsular Malaysia- -
JADUAL 9.5 : LUAS BERTANAM DAN PENGELUARAN TEMBAKAU MENGIKUT JENIS TEMBAKAU DAN NEGERI, MALAYSIA, 2017e
Table 9.5 : Total Planted Area and Production of Tobacco by Type of Tobacco and State, Malaysia, 2017 e
Production (Tonnes)NegeriState
Pengeluaran (Mt)Jenis TembakauPlanted Area (ha)Type of Tobacco

L2: SENARAI TANAMAN INDUSTRI MENGIKUT NAMA TEMPATAN, INGGERIS DAN BOTANI
L2 : List of Industrial Crops by Local, English and Botanical Names
L3: JENIS PENGURUSAN L3 : Type of Management
L4: SUMBER RUJUKAN L4 : Source of References
L5: AKRONIM L5 : Acronym

Muka surat ini sengaja dibiarkan kosong
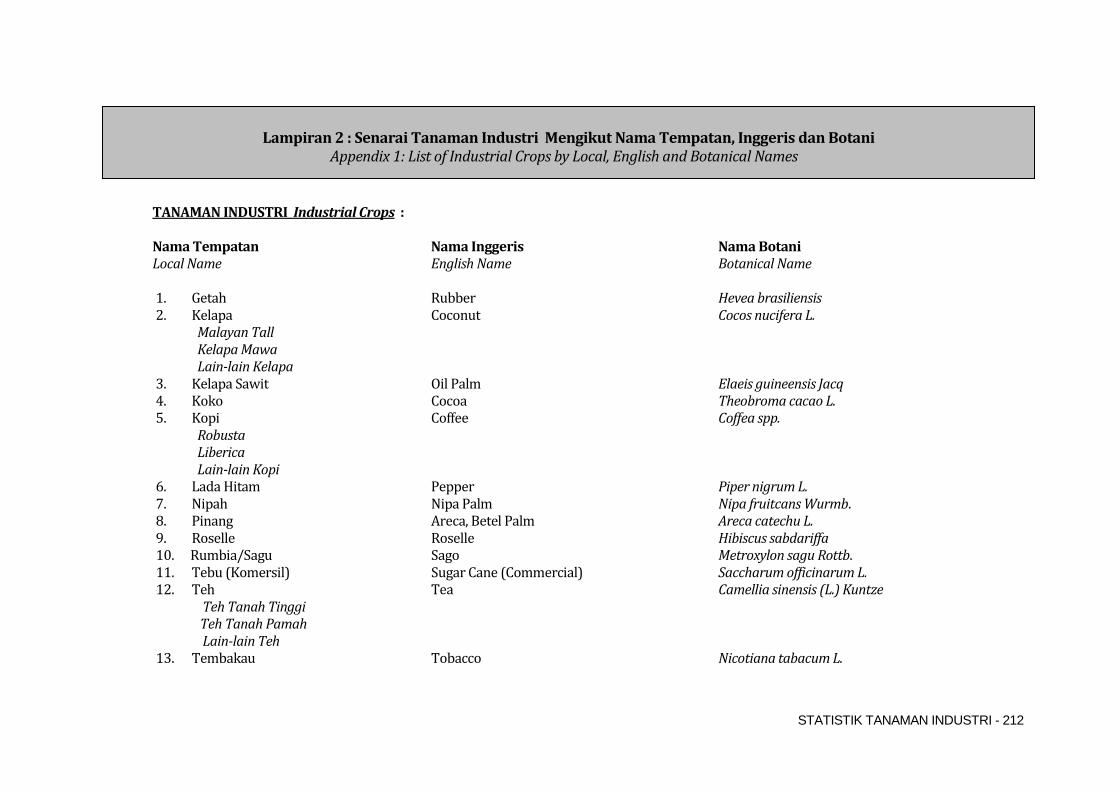
STATISTIK TANAMAN INDUSTRI - 212
TANAMAN INDUSTRI Industrial Crops : Nama Tempatan Nama Inggeris Nama Botani Local Name English Name Botanical Name 1. Getah Rubber Hevea brasiliensis 2. Kelapa Coconut Cocos nucifera L. Malayan Tall Kelapa Mawa Lain-lain Kelapa 3. Kelapa Sawit Oil Palm Elaeis guineensis Jacq
4. Koko Cocoa Theobroma cacao L. 5. Kopi Coffee Coffea spp. Robusta Liberica Lain-lain Kopi 6. Lada Hitam Pepper Piper nigrum L. 7. Nipah Nipa Palm Nipa fruitcans Wurmb. 8. Pinang Areca, Betel Palm Areca catechu L. 9. Roselle Roselle Hibiscus sabdariffa 10. Rumbia/Sagu Sago Metroxylon sagu Rottb. 11. Tebu (Komersil) Sugar Cane (Commercial) Saccharum officinarum L. 12. Teh Tea Camellia sinensis (L.) Kuntze Teh Tanah Tinggi Teh Tanah Pamah Lain-lain Teh 13. Tembakau Tobacco Nicotiana tabacum L.
Lampiran 2 : Senarai Tanaman Industri Mengikut Nama Tempatan, Inggeris dan Botani
Appendix 1: List of Industrial Crops by Local, English and Botanical Names
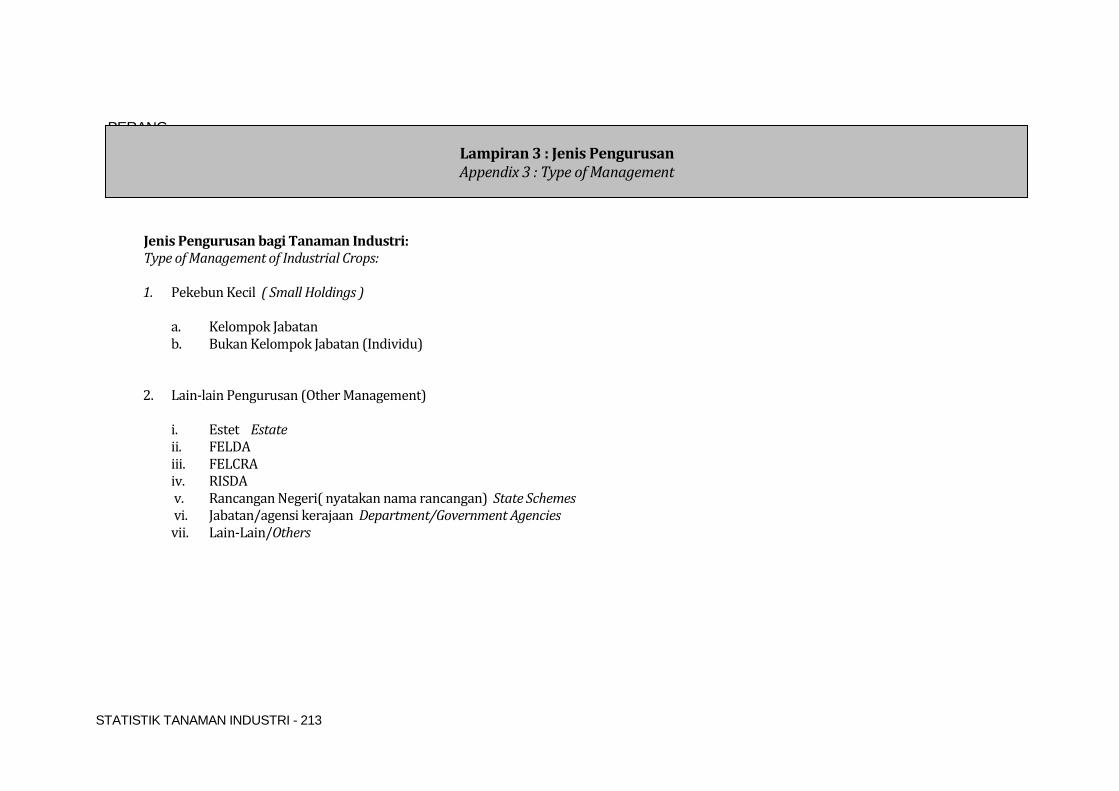
STATISTIK TANAMAN INDUSTRI - 213
PERANG
Jenis Pengurusan bagi Tanaman Industri: Type of Management of Industrial Crops:
1. Pekebun Kecil ( Small Holdings )
a. Kelompok Jabatan b. Bukan Kelompok Jabatan (Individu)
2. Lain-lain Pengurusan (Other Management)
i. Estet Estate ii. FELDA iii. FELCRA iv. RISDA v. Rancangan Negeri( nyatakan nama rancangan) State Schemes vi. Jabatan/agensi kerajaan Department/Government Agencies vii. Lain-Lain/Others
Lampiran 3 : Jenis Pengurusan Appendix 3 : Type of Management
STATISTIK TANAMAN INDUSTRI - 214
Data Sekunder Secondary Data :
Data Sekunder / Secondary Data
PENERBITAN DARIPADA JABATAN/KEMENTERIAN/AGENSI DEP./MINISTRY/AGENCY PUBLICATION:
ii. Statistik Komoditi 2017 (KPPK) Statistics on Commodities 2017 (MPIC)
Lampiran 4: Sumber Rujukan Appendix 4: Source of References
STATISTIK TANAMAN INDUSTRI - 215
Lampiran 5 : Akronim Appendix 5 : Acronym
1. FAMA - LEMBAGA PEMASARAN PERTANIAN PERSEKUTUAN (Federal Agricultural Marketing Authority)
2. FELDA - LEMBAGA KEMAJUAN TANAH PERSEKUTUAN
(Federal Land Development Authority)
3. JHEOA - JABATAN ORANG ASLI
4. JPNJ - JABATAN PERTANIAN NEGERI JOHOR
5. JPH - JABATAN PERKHIDMATAN HAIWAN
6. KEJORA - LEMBAGA KEMAJUAN JOHOR TENGGARA (South East Johor Development Authority)
7. LPP - LEMBAGA PERTUBUHAN PELADANG
(Farmers’ Organisation Authority) 8. RISDA - PIHAK BERKUASA KEMAJUAN PEKEBUN KECIL PERUSAHAAN GETAH (Rubber Industry Smallholders Development Authority)
9. LTN - LEMBAGA TEMBAKAU NEGARA (National Tobacco Board)
STATISTIK TANAMAN INDUSTRI - 216
Lampiran 5 : Akronim Appendix 5 : Acronym
10. MARDI - INSTITUT PENYELIDIKAN DAN KEMAJUAN PERTANIAN MALAYSIA
(Malaysian Agricultural Research and Development Institute)
11. PKEINJ - PERBADANAN KEMAJUAN EKONOMI ISLAM NEGERI JOHOR
12. PJ - PERBADANAN JOHOR ( Johor Corporation )
13. PLTHSB - PERBADANAN LADANG-LADANG TABUNG HAJI SENDIRIAN BERHAD 14. PORIM - INSTITUTE PENYELIDIKAN MINYAK KELAPA SAWIT MALAYSIA
( Palm Oil Research Institute of Malaysia )
15. PPNJ - PERTUBUHAN PELADANG NEGERI JOHOR (Johor State Farmers Organisation)
16. PTG - PEJABAT TANAH DAN GALIAN
17. RRIM - INSTITUTE PENYELIDIKAN GETAH MALAYSIA
(Rubber Research Institute of Malaysia)
18. UPEN - UNIT PERANCANGAN EKONOMI NEGERI (State Economic Planning Unit)
STATISTIK TANAMAN INDUSTRI - 217
Lampiran 5: Akronim Appendix 5: Acronym
19 YPJ - YAYASAN PELAJARAN JOHOR (Johor Education Foundation)
20. JP - JABATAN PERTANIAN
DOA (Department of Agriculture) 21. SADC - PERBADANAN PEMBANGUNAN PERTANIAN 22. RTBK - RANCANGAN TANAH BELIA KHAS
23. LGM - LEMBAGA GETAH MALAYSIA
24. LKPP - LEMBAGA KEMAJUAN PERUSAHAAN PERTANIAN Negeri Pahang (Pahang Agricultural Development Corporation)
25. MPOB - LEMBAGA MINYAK SAWIT MALAYSIA
(Malaysian Palm Oil Board) 26. JPLH - JEMAAH PEMASARAN LADA HITAM ( Pepper Marketing Board ) 28. KESEDAR - LEMBAGA KEMAJUAN KELANTAN SELATAN 29. MaLRA - PERSATUAN MEMBANTU PESAKIT KUSTA MALAYSIA (Malaysian Leprosy Relief Association)
STATISTIK TANAMAN INDUSTRI - 218
Lampiran 5: Akronim Appendix 5: Acronym
30. PKINK - PERBADANAN KEMAJUAN IKTISAD NEGERI KELANTAN (Kelantan State Economic Development Corporation) 31. YAKIN - YAYASAN KELANTAN DARUL NAIM 32. LIGS - LEMBAGA INDUSTRI GETAH SABAH (Sabah Rubber Industry Board) 33. LKM - LEMBAGA KOKO MALAYSIA MCB (Malaysian Cocoa Board) 34. LKTNS - LEMBAGA KEMAJUAN TANAH NEGERI SABAH SLDB (Sabah Land Development Board) 35. FELCRA - LEMBAGA PENYATUAN DAN PEMULIHAN TANAH PERSEKUTUAN Federal Land Consolidation and Rehabilitation Authority 36. KPPK - KEMENTERIAN PERUSAHAAN PERLADANGAN DAN KOMODITI MPIC Ministry of Plantation Industries and Commodities