industri pembekalan elektrik di malaysia electricity supply … · 2018-01-08 · 4 maa pa a sa...
TRANSCRIPT
Industri Pembekalan Elektrik di MalaysiaElectricity Supply Industry in Malaysia
Maklumat Prestasi & Statistik 2008Performance & Statistical Information 2008
Suruhanjaya Tenaga(Energy Commission)Tingkat 13, Menara TH Perdana,Maju Junction,1001, Jalan Sultan Ismail,50250, Kuala LumpurTel: (603) 2612 5400Fax: (603) 2693 7791
www.st.gov.my
i
Performance and Statistical Information 2008
KANDUNGAN
Pendahuluan
Profil Negara
Pencapaian Prestasi
Maklumat dan Statistik Industri
CONTENT
Foreword
Country Profile
Performance Highlights
Industry Statistics and Information
M/S
4
8
11
89
Pages
4
8
11
89
4
Maklumat Prestasi dan Statistik 2008
Pada tahun 2008, margin simpanan sistem atau reserve
margin di Semenanjung Malaysia berada dalam
lingkungan 41% berbanding 45% pada tahun 2007.
Walaupun reserve margin telah berkurangan, namun
begitu bekalan elektrik masih berada dalam tahap yang
selesa dengan kapasiti penjanaan yang sedia ada
mencukupi untuk memenuhi permintaan tenaga yang
meningkat pada setengah tahun pertama 2008 dan mula
menguncup pada setengah tahun kedua 2008. Kehendak
maksimum sistem grid di Semenanjung Malaysia telah
mencatatkan pertambahan sebanyak 2.8% daripada
13,620 MW tahun 2007 kepada tahap tertinggi iaitu 14,007
MW yang direkodkan pada 21 Mei 2008. Walau
bagaimanapun, jumlah kapasiti penjanaan terpasang di
Semenanjung Malaysia sehingga 31 Disember 2008 kekal
pada paras 19,723 MW memandangkan tiada
pertambahan kapasiti penjanaan baru. Daripada jumlah
keseluruhan kapasiti penjanaan tahun 2008, peratusan
tenaga elektrik yang dijana oleh IPP di Semenanjung
Malaysia ialah 67.8% atau 13,377 MW oleh 15 IPP [termasuk
Stesen Janakuasa Janamanjung dan Kapar Energy
Ventures Sdn. Bhd. (KEV)] dan selebihnya 32.2% telah
dibekal oleh TNB yang menjana sebanyak 6,346 MW.
Namun begitu, kapasiti penjanaan terpasang di
Semenanjung Malaysia pada tahun 2009 dijangka akan
bertambah berbanding tahun 2008 apabila projek
penjanaan menggunakan bahanapi arang batu oleh
stesen IPP iaitu Jimah Energy Ventures Sdn. Bhd., di Mukim
Jimah, Port Dickson, Negeri Sembilan dengan kapasiti 1,400
MW sedia beroperasi. Projek penjanaan ini telah siap
sepenuhnya pada Disember 2008 di mana unit pertama
berkapasiti 700 MW dijadualkan akan dimulatugas pada 1
Januari 2009, diikuti unit kedua 700 MW pada 1 Julai 2009.
Selain daripada projek IPP Jimah, Projek Pemulihan Stesen
Janaelektrik Tuanku Jaafar bagi Fasa Kedua (kitar padu)
oleh TNB atau dikenali PD2 dengan kapasiti 750 MW telah
siap sepenuhnya pada Disember 2008 dan akan
dimulatugas secara komersial pada awal tahun 2009.
Dengan bermulatugasnya PD2, ianya akan berupaya
memberikan kapasiti tambahan sebanyak 750 MW
kepada kapasiti 750 MW yang sedia ada di loji PD1. Selain
itu, satu lagi projek pemulihan ialah di Rancangan
Hidroelektrik Cameron Highlands dan Batang Padang iaitu
Projek Pemanjangan Jangka Hayat dan Automasi Loji yang
dijangka siap dalam tahun 2009.
Di Sabah, jumlah kapasiti penjanaan terpasang sehingga
31 Disember 2008 berada pada paras 812 MW, bertambah
14.7% daripada 708 MW tahun 2007. Penambahan kapasiti
penjanaan sebanyak 104 MW adalah berikutan telah
bermulatugas dua tarbin stim berkapasiti 35 MW setiap satu
(2 X 35 MW) di Stesen Ranhill Powertron Sdn. Bhd. pada
bulan April 2008 dan Oktober 2008 menjadikan 2 blok kitar
In 2008, the reserve margin in Peninsular Malaysia stood
around 41% compared with 45% in 2007. Even though the
reserve margin decreased, the total generation was more
than sufficient to meet the increasing demand in the first
half of 2008. However, in the second half of 2008 the
electricity demand contracted as a result of slow economic
activities due to global financial crisis. The maximum
demand of the grid system in Peninsular Malaysia increased
by 2.8% from 13,620 MW in 2007 to 14,007 MW which was
recorded on 21st May 2008. The total installed generation
capacity in Peninsular Malaysia in 2008 stood at 19,723 MW
with no new additional capacity. The percentage of
electricity generated by 15 IPP’s (including of Janamanjung
Power Station and Kapar Energy Ventures Sdn. Bhd.) in
Peninsular Malaysia was 67.8% or 13,377 MW of the total
installed capacity, and the remaining 32.2% or 6,346 MW
was supplied by TNB.
However, the installed generation capacity in Peninsular
Malaysia in the year 2009 is expected to increase, when 2 X
700 MW coal-fired power generation project by Jimah
Energy Ventures Sdn. Bhd., at Mukim Jimah, Port Dickson,
Negeri Sembilan come on stream. The generation project
was completed in December 2008 and the first unit of 700
MW is scheduled to be commissioned by 1st January 2009,
followed the second unit by 1st July 2009.
Apart from the IPP’s project by Jimah, the Tuanku Ja’afar
Power Station’s Rehabilitation Phase 2 (PD2) Project by TNB
with a combined cycle capacity of 750 MW was
completed in December 2008 and is expected to begin
operation in early 2009. Once the PD2 project is fully
commissioned, there will be an additional installed
capacity of 750 MW to the existing 750 MW PD1 plant. Other
major rehabilitation projects took place in Cameron
Highlands and Batang Padang Hydroelectric Schemes
through its Plant Life Extension and Automation Project, and
are expected to complete in 2009.
In Sabah, the maximum demand of the grid system
increased by 7.7% to 673 MW compared 625 MW in 2007.
The total installed generation capacity at end of 31st
December 2008 was 812 MW, that is a 14.7% increased over
708 MW in 2007. The additional generation capacity of 104
MW were contributed by :
➢ the commissioning of 2 steam turbines (2 X 35 MW) in
Ranhill Powertron Sdn Bhd power plant in April 2008 and
October 2008, thus forming 2 combined cycle blocks of
total capacity of 190 MW;
➢ the commissioning of the 34 MW steam turbine in
Sepangar Bay Power Corporation Sdn. Bhd. power plant
in August 2008, thus forming 1 combined cycle block of
total capacity of 100 MW.
PENDAHULUAN FOREWORD
5
Performance and Statistical Information 2008
padu dengan jumlah kapasiti 190 MW serta bermulatugas
tarbin stim berkapasiti 34 MW untuk unit kitar padu Fasa 2 di
Sepangar Bay Power Corporation Sdn. Bhd. (SBPC) pada
bulan Ogos 2008 menjadikan 1 blok kitar padu dengan
jumlah kapasiti 100 MW. Kehendak maksimum bagi sistem
grid di Sabah turut mencatatkan pertambahan sebanyak
7.7% kepada 673 MW berbanding 625 MW tahun 2007.
Dayaharap sistem bekalan elektrik di Sabah turut menjadi
fokus utama apabila satu insiden gangguan bekalan
elektrik yang meluas telah berlaku pada 21 April 2008 di
antara 35 minit hingga tiga jam 14 minit yang
menyebabkan hampir 90% bekalan elektrik ke seluruh
Sabah terganggu melibatkan kesemua bandar-bandar
utama di Pantai Barat dan Pantai Timur Sabah. Hanya
kawasan-kawasan di sebahagian W.P. Labuan, Beaufort,
Keningau, Tambunan, Tenom, Telupid dan Ranau yang
tidak terjejas. Insiden tersebut telah menyebabkan lebih
300,000 pengguna di Sabah terjejas dengan kehilangan
beban sebanyak 459.3 MW. Gangguan bekalan tersebut
telah dipulihkan secara berperingkat oleh SESB. Siasatan
Suruhanjaya mendapati terdapat insiden kecurian
kelengkapan logam menara talian penghantaran di
Suang Parai dalam kawasan Universiti Malaysia Sabah.
Impak daripada insiden tersebut telah memberi kesan
yang besar kepada prestasi sistem penghantaran serta
telah menimbulkan beberapa persoalan berhubung
reliability sistem pembekalan elektrik di Sabah.
Selain itu, pada awal Jun 2008, Kerajaan telah
mengumumkan pakej penstrukturan semula subsidi bahan
api berikutan kenaikan drastik harga minyak di peringkat
global. Tujuan penstrukturan semula subsidi tersebut adalah
supaya bantuan dapat diagihkan dengan lebih adil dan
memberi lebih manfaat kepada mereka yang
memerlukannya, terutama golongan berpendapatan
rendah dan sederhana. Berikutan dengan kenaikan harga
minyak, harga gas yang dibekalkan oleh Petronas di
Semenanjung Malaysia juga telah dinaikkan mulai 1 Julai
2008.
Selaras dengan kenaikan kos bahan api, kekangan
sumber gas dan arang batu dan isu pelaksanaan projek
penghantaran tenaga elektrik Bakun merupakan
perkara-perkara utama yang sentiasa menjadi fokus dalam
tahun 2008. Berdasarkan unjuran permintaan dan bekalan
setelah mengambilkira jangkaan kelembapan dalam
pertumbuhan permintaan elektrik ekoran krisis ekonomi
dunia, ketidaktentuan dalam pelaksanaan projek di mana
banyak perkara yang belum dapat dimuktamadkan dan
tarikh realistik pengilang kabel dasar laut, projek
penghantaran Bakun berkemungkinan besar hanya dapat
disalurkan ke Semenanjung menjelang tahun 2016.
Dengan penstrukturan semula subsidi gas dan kenaikan
In 2008, the reliability of electricity supply system in Sabah
was a main concern. Incident of wide area supply
interruptions occurred on 21st April 2008, interrupting the
electricity supply to almost 90% of the main town in West
Coast and East Coast of Sabah, with the exception of W.P.
Labuan, Beaufort, Keningau, Tambunan, Tenom, Telupid
dan Ranau. The incident had affected over 300,000
consumers, causing a load loss of about 459.3 MW.
However, the supply interruptions were restored by SESB in
stages within 35 minutes to three hours and 14 minutes. The
investigation by the Energy Commission revealed that even
though the supply interruption was triggered by incident of
theft of metal parts on a transmission tower of a transmission
line at Suang Parai in the Universiti Malaysia Sabah,
indequate generation capacity had caused the system
unable to withstand the disturbance and hence partially
collapsed. The incident impacted significantly on the
performance of the Sabah transmission system and has
raised various questions on the reliability of supply system in
Sabah.
In early June 2008, the Government announced the
restructuring of fuels subsidies amidst the continuing
escalation in oil prices globally. Subsequently, the prices of
gas supplied by Petronas in Peninsular Malaysia also
increased on 1st July 2008.
With the escalating fuel costs coupled with the constraint
of gas supply domestically and coal resources globally, the
possibility of transmission of power from Bakun project to
Peninsula had rekindled the interest among the
stakeholders. Base on the new supply demand balance
taking into account the economic slowdown due to global
financial crisis, the power from Bakun project to Peninsula is
expected to be realized only in 2016.
On 1st July 2008, the Government had approved an
average of 20% increase in the electricity tariff of TNB. The
increase was to cater for the fuel cost (gas and coal)
increase due to the restructuring of gas subsidies by the
Government and the global escalation of coal prices.
However, in line with the Government’s effort to reduce the
burden of lower income consumers, there was no increase
in rates for those consumers utilising electricity at 200 kWh
and below in a month, which accounted for 59% of
households in Peninsular Malaysia. With the new tariff rates,
the average selling prices increased to 32.5 sen/kWh
compared to the previous average selling prices of 26.1
sen/kWh.
In line with the government’s effort to enhance the delivery
services, standard for electricity supply services was
introduced by the Energy Commission in 2008. This new
standard include the minimum service levels (MSL) and
guaranteed service levels (GSL) to be observed by the
6
Maklumat Prestasi dan Statistik 2008
harga arang batu di pasaran, Kerajaan telah meluluskan
satu struktur baru tarif elektrik yang berkuatkuasa pada 1
Julai 2008 bagi membolehkan TNB menyerap kos bahan
api bagi gas dan arang batu. Struktur baru ini melibatkan
peningkatan tarif elektrik hampir 20%. Walau
bagaimanapun, selaras dengan hasrat Kerajaan untuk
melindungi kebajikan golongan berpendapatan rendah
dan sederhana, struktur tarif elektrik yang baru ini tidak
menjejaskan pengguna yang menggunakan tenaga
elektrik pada kadar 200 Kilowat-Jam (kWj) ke bawah setiap
bulan, iaitu 59 peratus isi rumah di Semenanjung Malaysia,
akan membayar pada kadar yang sama. Bagi pengguna
komersil dan industri pula akan mengalami peningkatan
tarif elektrik sebanyak 26%. Tarif purata berdasarkan
kenaikan tersebut adalah 32.5 sen/kWj, berbanding
dengan tarif purata sebelum kenaikan 26.1 sen/kWj.
Selain itu juga, selaras dengan hasrat Kerajaan supaya
pengguna turut diberi pampasan tertentu sekiranya TNB
gagal mematuhi tahap-tahap perkhidmatannya,
Suruhanjaya berpendapat sudah sewajarnya
standard-standard prestasi perkhidmatan pembekalan
elektrik TNB diperkemaskan agar lebih berkesan dalam
meningkatkan perkhidmatan TNB. Standard prestasi
bekalan dan perkhidmatan yang baru digubal dengan
mengambilkira service dimension yang sentiasa
menimbulkan rungutan kepada pengguna. Penggubalan
standard-standard tersebut menetapkan minimum service
level dan guaranteed service level, di mana hanya
guaranteed service level yang menetapkan penalti bagi
kegagalan mematuhinya. Namun begitu, sehingga akhir
tahun 2008, pelaksanaannya masih tertangguh atas
kerana perbezaan pendekatan di antara Suruhanjaya dan
TNB.
Penganalisisan maklumat dan data ke atas prestasi
pembekalan elektrik juga merangkumi laporan yang
dikemukakan oleh Pengendali Sistem Grid, laporan operasi
penjana-penjana bebas, aduan-aduan daripada orang
awam mengenai perkhidmatan pembekalan elektrik dan
kualiti bekalan elektrik serta aduan yang diterima daripada
pelbagai sumber antaranya aduan terus dari pengadu,
aduan melalui email ke info ST, aduan dari media massa
dan sebagainya. Kebanyakan aduan-aduan telah disiasat
dan diambil tindakan terus oleh pejabat-pejabat kawasan
Suruhanjaya Tenaga.
Selain dari itu, maklumat dan data yang dikumpul telah
dianalisis berdasarkan kepada laporan bulanan dan
tahunan yang dikemukakan kepada Suruhanjaya Tenaga
oleh pemegang-pemegang lesen utiliti-utiliti utama iaitu
Tenaga Nasional Berhad (di Semenanjung Malaysia),
Sabah Electricity Sdn. Bhd. (di Sabah) dan NUR Distribution
Sdn. Bhd. (di Kulim, Kedah). Laporan ini juga turut
mengandungi maklumat prestasi dan data di Sarawak
utility, where failure to comply to GSL will warrant the utility
to pay penalty in term of rebate to consumers. The
proposed standard comprises of service dimensions which
take into account the common grouses of the consumers.
Several discussions were carried out with TNB to implement
the standard. However, as at the end of 2008, the
implementation of standard is still pending due differences
in approach between TNB and Commission.
This performance and statistical informations of the
electricity supply industry are based on the:
- reports submitted by the Grid System Operator of
Peninsular Malaysia,
- reports submitted by Independent Power Producers
(IPPs),
- monthy and yearly reports submitted by major utilities
namely Tenaga Nasional Berhad (in Peninsular Malaysia),
Sabah Electricity Sdn. Bhd. (in Sabah) and NUR
Distribution Sdn. Bhd. (in Kulim, Kedah),
- the information provided by Sarawak Energy Berhad
(SEB),
- public complaints on the electricity supply services and
quality of supply issues through various means.
Prepared by :
Electricity Supply Regulatory Department
Energy Commission
7
Performance and Statistical Information 2008
yang diperolehi daripada Sarawak Energy Berhad (SEB).
Pada keseluruhannya, berdasarkan kepada
petunjuk-petunjuk prestasi yang diterima dan dianalisis
sepanjang tahun 2008 menunjukkan tahap prestasi
pembekalan elektrik di Malaysia terutamanya TNB didapati
menurun dari aspek reliability bekalan dimana indeks SAIDI
menunjukkan pertambahan berbanding tahun
sebelumnya. Pemantauan berterusan, usaha dan
langkah-langkah tertentu perlu diambil oleh TNB dalam
usaha untuk mengurangkan bilangan gangguan bekalan
elektrik. Jika dilihat daripada punca-punca gangguan,
aspek-aspek perancangan program senggaraan dan
pelan pengurusan aset wajar diberi penekanan oleh
semua utiliti di Malaysia. Sementara itu, insiden-insiden
power quality terutamanya voltage dips di Semenanjung
Malaysia juga masih memerlukan pemantauan yang
berterusan oleh TNB dan NUR serta kerjasama daripada
pengguna industri amat diperlukan dalam menanganinya
insiden voltage dips dengan berkesan supaya bilangan
insiden yang melibatkan gangguan dapat dikurangkan.
Disediakan oleh :
Jabatan Kawalselia Pembekalan Elektrik
Suruhanjaya Tenaga
8
Maklumat Prestasi dan Statistik 2008
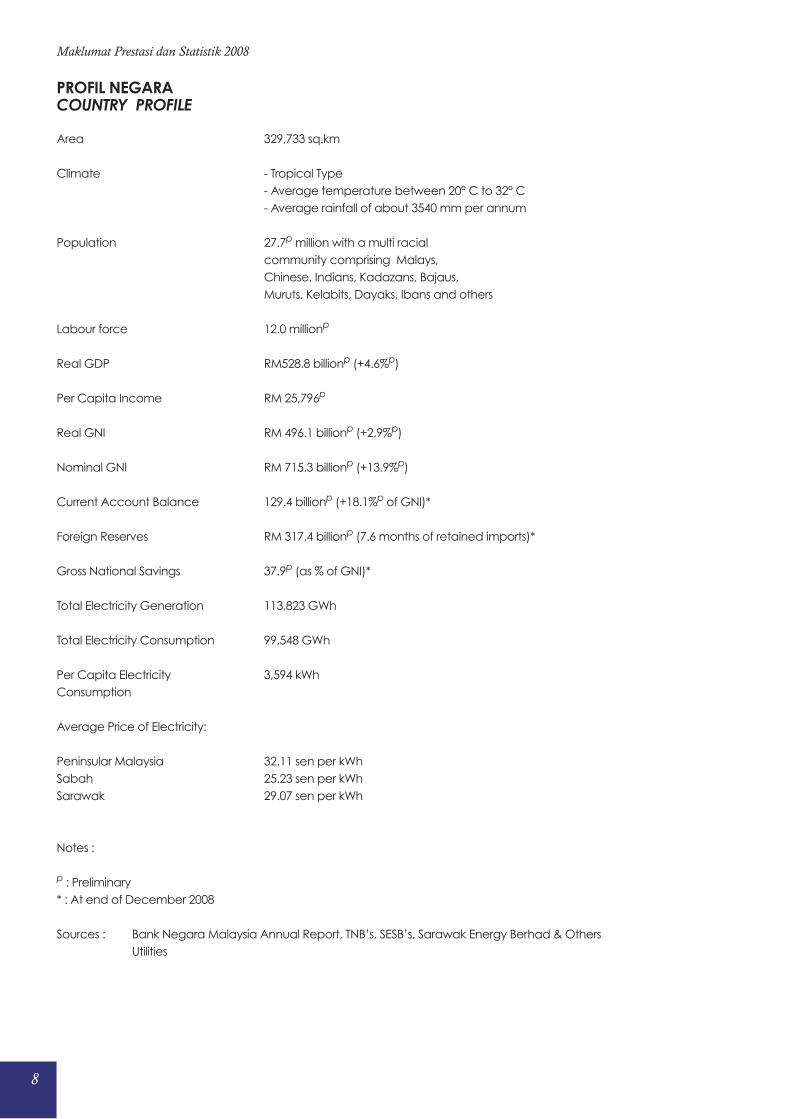
Area 329,733 sq.km
Climate - Tropical Type
- Average temperature between 20° C to 32° C
- Average rainfall of about 3540 mm per annum
Population 27.7p million with a multi racial
community comprising Malays,
Chinese, Indians, Kadazans, Bajaus,
Muruts, Kelabits, Dayaks, Ibans and others
Labour force 12.0 millionp
Real GDP RM528.8 billionp (+4.6%p)
Per Capita Income RM 25,796p
Real GNI RM 496.1 billionp (+2.9%p)
Nominal GNI RM 715.3 billionp (+13.9%p)
Current Account Balance 129.4 billionp (+18.1%p of GNI)*
Foreign Reserves RM 317.4 billionp (7.6 months of retained imports)*
Gross National Savings 37.9p (as % of GNI)*
Total Electricity Generation 113,823 GWh
Total Electricity Consumption 99,548 GWh
Per Capita Electricity 3,594 kWh
Consumption
Average Price of Electricity:
Peninsular Malaysia 32.11 sen per kWh
Sabah 25.23 sen per kWh
Sarawak 29.07 sen per kWh
Notes :
p : Preliminary
* : At end of December 2008
Sources : Bank Negara Malaysia Annual Report, TNB’s, SESB’s, Sarawak Energy Berhad & Others
Utilities
PROFIL NEGARACOUNTRY PROFILE
9
Performance and Statistical Information 2008
LAUT CHINA SELATAN
FILIPINA
SINGAPURA
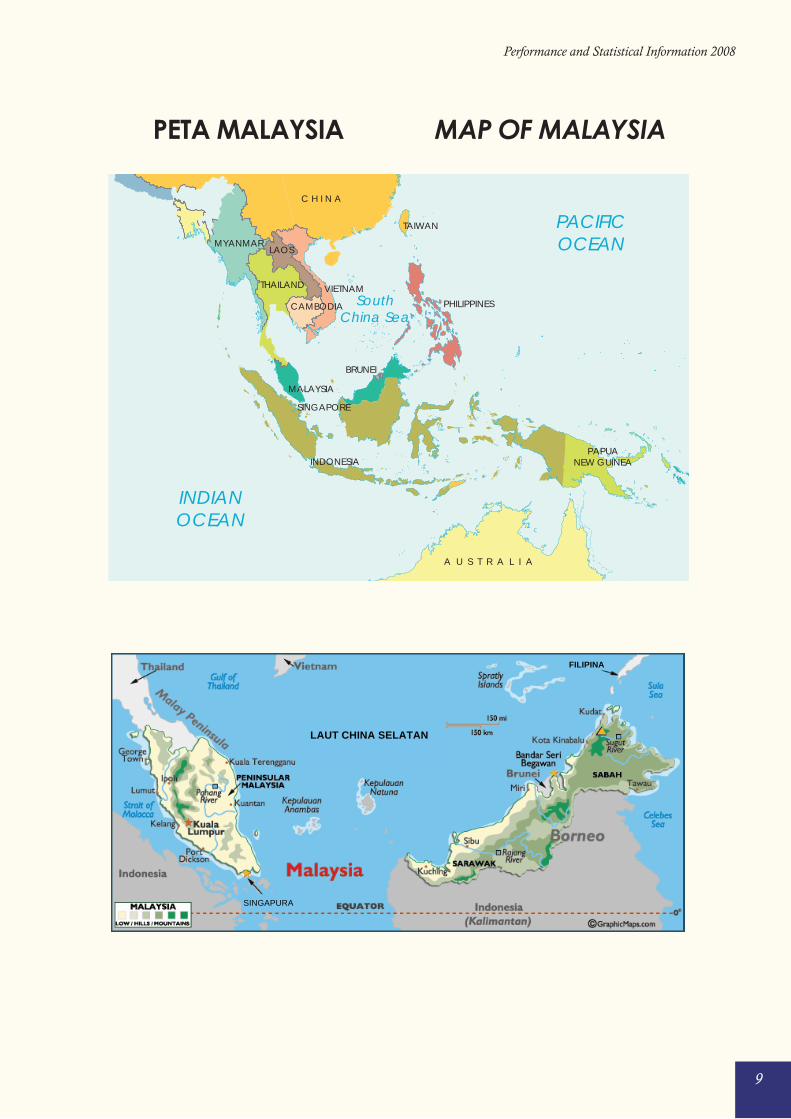
PETA MALAYSIA MAP OF MALAYSIA
C
PACIFICOCEAN
INDIANOCEAN
SouthChina Sea
PAPUANEW GUINEA
C H I N A
LAOS
PHILIPPINES
THAILAND
CAMBODIA
VIETNAM
SINGAPORE
BRUNEI
MALAYSIA
INDONESIA
A U S T R A L I A
MYANMAR
TAIWAN
10
Maklumat Prestasi dan Statistik 2008
11
Performance and Statistical Information 2008
PENCAPAIAN PRESTASI
• Pembekalan dan Permintaan Pembekalan
Elektrik
• Jualan Tenaga Elektrik
• Prestasi Sistem Penjanaan
• Prestasi Sistem Penghantaran
• Prestasi Sistem Pembahagian
• Punca Gangguan Bekalan Elektrik
• Kualiti Bekalan
• Kualiti Perkhidmatan
• Purata Harga Jualan Elektrik
PERFORMANCE HIGHLIGHTS
• Electricity Supply and Demand
• Sales of Electricity
• Performance of Generation System
• Performance of Transmission System
• Performance of Distribution System
• Causes of Electricity Supply Interruptions
• Voltage Quality
• Quality of Service
• Average Selling Prices of Electricity
12
Maklumat Prestasi dan Statistik 2008
KAPASITI PENJANAAN DAN KEHENDAK MAKSIMUM
Sistem Grid Di Semenanjung Malaysia - TNB
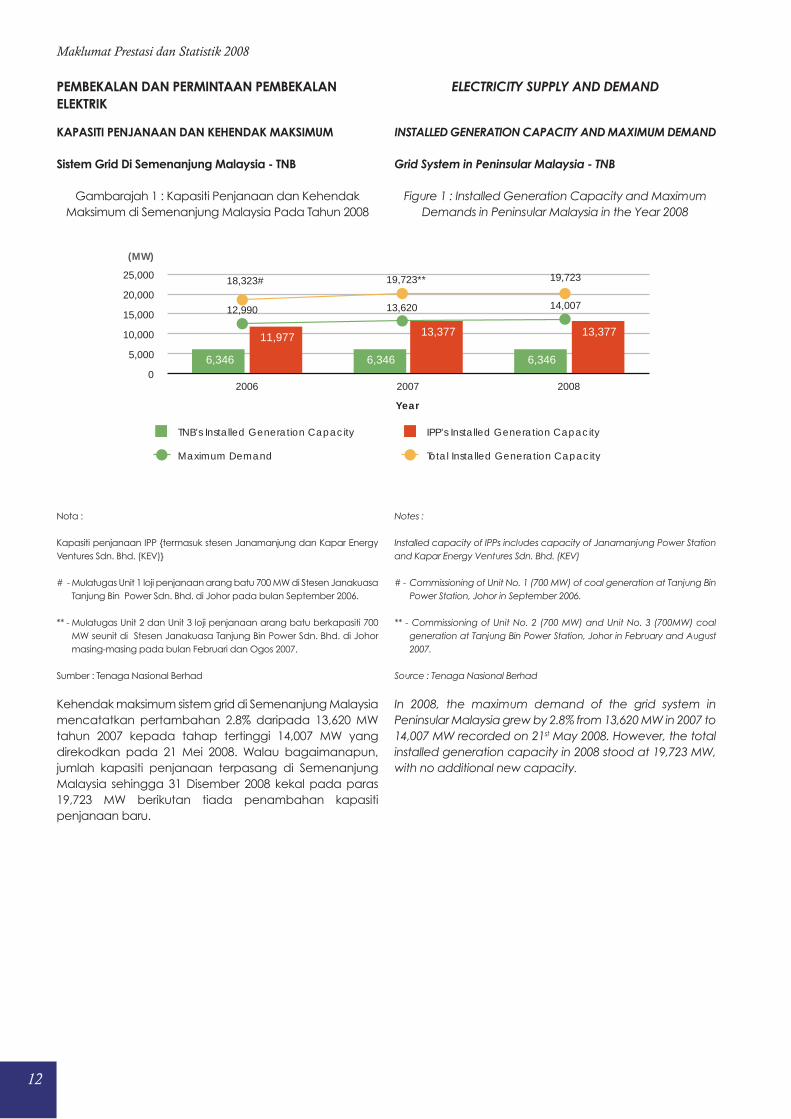
Gambarajah 1 : Kapasiti Penjanaan dan Kehendak
Maksimum di Semenanjung Malaysia Pada Tahun 2008
Nota :
Kapasiti penjanaan IPP {termasuk stesen Janamanjung dan Kapar Energy
Ventures Sdn. Bhd. (KEV)}
# - Mulatugas Unit 1 loji penjanaan arang batu 700 MW di Stesen Janakuasa
Tanjung Bin Power Sdn. Bhd. di Johor pada bulan September 2006.
** - Mulatugas Unit 2 dan Unit 3 loji penjanaan arang batu berkapasiti 700
MW seunit di Stesen Janakuasa Tanjung Bin Power Sdn. Bhd. di Johor
masing-masing pada bulan Februari dan Ogos 2007.
Sumber : Tenaga Nasional Berhad
Kehendak maksimum sistem grid di Semenanjung Malaysia
mencatatkan pertambahan 2.8% daripada 13,620 MW
tahun 2007 kepada tahap tertinggi 14,007 MW yang
direkodkan pada 21 Mei 2008. Walau bagaimanapun,
jumlah kapasiti penjanaan terpasang di Semenanjung
Malaysia sehingga 31 Disember 2008 kekal pada paras
19,723 MW berikutan tiada penambahan kapasiti
penjanaan baru.
INSTALLED GENERATION CAPACITY AND MAXIMUM DEMAND
Grid System in Peninsular Malaysia - TNB
Figure 1 : Installed Generation Capacity and Maximum
Demands in Peninsular Malaysia in the Year 2008
Notes :
Installed capacity of IPPs includes capacity of Janamanjung Power Station
and Kapar Energy Ventures Sdn. Bhd. (KEV)
# - Commissioning of Unit No. 1 (700 MW) of coal generation at Tanjung Bin
Power Station, Johor in September 2006.
** - Commissioning of Unit No. 2 (700 MW) and Unit No. 3 (700MW) coal
generation at Tanjung Bin Power Station, Johor in February and August
2007.
Source : Tenaga Nasional Berhad
In 2008, the maximum demand of the grid system in
Peninsular Malaysia grew by 2.8% from 13,620 MW in 2007 to
14,007 MW recorded on 21st May 2008. However, the total
installed generation capacity in 2008 stood at 19,723 MW,
with no additional new capacity.
PEMBEKALAN DAN PERMINTAAN PEMBEKALAN
ELEKTRIK
ELECTRICITY SUPPLY AND DEMAND
0
5,000
10,000
15,000
20,000
25,000
2006 2007 2008
13,37713,37711,977
6,3466,3466,346
(MW)
TNB’s Installed Generation Capacity IPP’s Installed Generation Capacity
Year
Maximum Demand Total Installed Generation Capacity
12,990 13,620 14,007
18,323# 19,723** 19,723
13
Performance and Statistical Information 2008
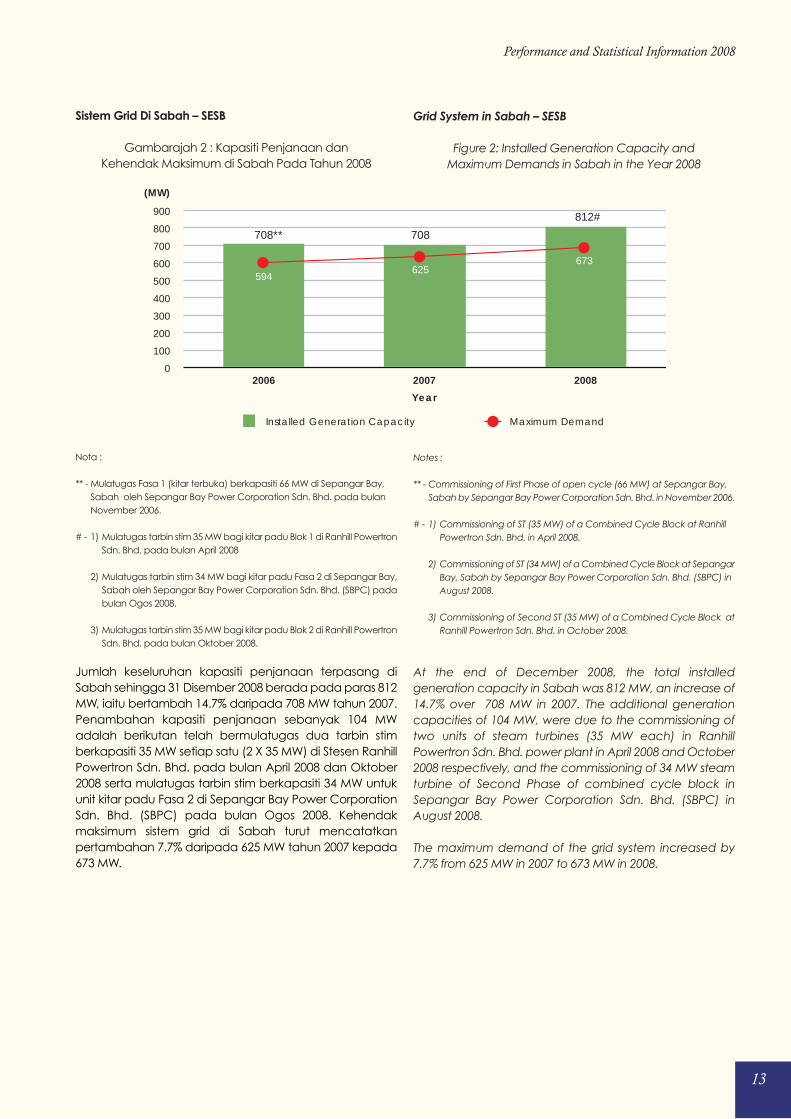
Sistem Grid Di Sabah – SESB
Gambarajah 2 : Kapasiti Penjanaan dan
Kehendak Maksimum di Sabah Pada Tahun 2008
Nota :
** - Mulatugas Fasa 1 (kitar terbuka) berkapasiti 66 MW di Sepangar Bay,
Sabah oleh Sepangar Bay Power Corporation Sdn. Bhd. pada bulan
November 2006.
# - 1) Mulatugas tarbin stim 35 MW bagi kitar padu Blok 1 di Ranhill Powertron
Sdn. Bhd. pada bulan April 2008
2) Mulatugas tarbin stim 34 MW bagi kitar padu Fasa 2 di Sepangar Bay,
Sabah oleh Sepangar Bay Power Corporation Sdn. Bhd. (SBPC) pada
bulan Ogos 2008.
3) Mulatugas tarbin stim 35 MW bagi kitar padu Blok 2 di Ranhill Powertron
Sdn. Bhd. pada bulan Oktober 2008.
Jumlah keseluruhan kapasiti penjanaan terpasang di
Sabah sehingga 31 Disember 2008 berada pada paras 812
MW, iaitu bertambah 14.7% daripada 708 MW tahun 2007.
Penambahan kapasiti penjanaan sebanyak 104 MW
adalah berikutan telah bermulatugas dua tarbin stim
berkapasiti 35 MW setiap satu (2 X 35 MW) di Stesen Ranhill
Powertron Sdn. Bhd. pada bulan April 2008 dan Oktober
2008 serta mulatugas tarbin stim berkapasiti 34 MW untuk
unit kitar padu Fasa 2 di Sepangar Bay Power Corporation
Sdn. Bhd. (SBPC) pada bulan Ogos 2008. Kehendak
maksimum sistem grid di Sabah turut mencatatkan
pertambahan 7.7% daripada 625 MW tahun 2007 kepada
673 MW.
Grid System in Sabah – SESB
Figure 2: Installed Generation Capacity and
Maximum Demands in Sabah in the Year 2008
Notes :
** - Commissioning of First Phase of open cycle (66 MW) at Sepangar Bay,
Sabah by Sepangar Bay Power Corporation Sdn. Bhd. in November 2006.
# - 1) Commissioning of ST (35 MW) of a Combined Cycle Block at Ranhill
Powertron Sdn. Bhd. in April 2008.
2) Commissioning of ST (34 MW) of a Combined Cycle Block at Sepangar
Bay, Sabah by Sepangar Bay Power Corporation Sdn. Bhd. (SBPC) in
August 2008.
3) Commissioning of Second ST (35 MW) of a Combined Cycle Block at
Ranhill Powertron Sdn. Bhd. in October 2008.
At the end of December 2008, the total installed
generation capacity in Sabah was 812 MW, an increase of
14.7% over 708 MW in 2007. The additional generation
capacities of 104 MW, were due to the commissioning of
two units of steam turbines (35 MW each) in Ranhill
Powertron Sdn. Bhd. power plant in April 2008 and October
2008 respectively, and the commissioning of 34 MW steam
turbine of Second Phase of combined cycle block in
Sepangar Bay Power Corporation Sdn. Bhd. (SBPC) in
August 2008.
The maximum demand of the grid system increased by
7.7% from 625 MW in 2007 to 673 MW in 2008.
0
100
200
300
400
500
600
700
800
900
2006 2007 2008
812#
708708**
(MW)
Installed Generation Capacity
Year
594625
673
Maximum Demand
14
Maklumat Prestasi dan Statistik 2008
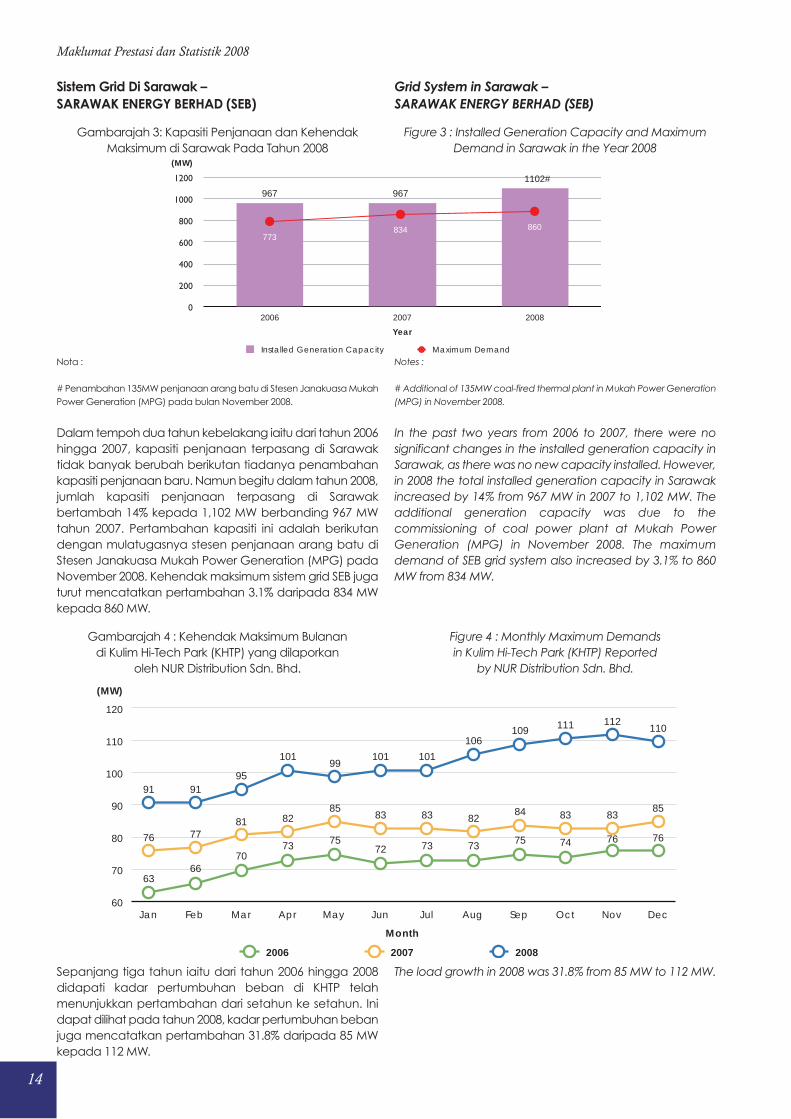
Gambarajah 3: Kapasiti Penjanaan dan Kehendak
Maksimum di Sarawak Pada Tahun 2008
Nota :
# Penambahan 135MW penjanaan arang batu di Stesen Janakuasa Mukah
Power Generation (MPG) pada bulan November 2008.
Dalam tempoh dua tahun kebelakang iaitu dari tahun 2006
hingga 2007, kapasiti penjanaan terpasang di Sarawak
tidak banyak berubah berikutan tiadanya penambahan
kapasiti penjanaan baru. Namun begitu dalam tahun 2008,
jumlah kapasiti penjanaan terpasang di Sarawak
bertambah 14% kepada 1,102 MW berbanding 967 MW
tahun 2007. Pertambahan kapasiti ini adalah berikutan
dengan mulatugasnya stesen penjanaan arang batu di
Stesen Janakuasa Mukah Power Generation (MPG) pada
November 2008. Kehendak maksimum sistem grid SEB juga
turut mencatatkan pertambahan 3.1% daripada 834 MW
kepada 860 MW.
Figure 3 : Installed Generation Capacity and Maximum
Demand in Sarawak in the Year 2008
Notes :
# Additional of 135MW coal-fired thermal plant in Mukah Power Generation
(MPG) in November 2008.
In the past two years from 2006 to 2007, there were no
significant changes in the installed generation capacity in
Sarawak, as there was no new capacity installed. However,
in 2008 the total installed generation capacity in Sarawak
increased by 14% from 967 MW in 2007 to 1,102 MW. The
additional generation capacity was due to the
commissioning of coal power plant at Mukah Power
Generation (MPG) in November 2008. The maximum
demand of SEB grid system also increased by 3.1% to 860
MW from 834 MW.
Sistem Grid Di Sarawak –
SARAWAK ENERGY BERHAD (SEB)
Grid System in Sarawak –
SARAWAK ENERGY BERHAD (SEB)
0
200
400
600
800
1000
1200
2006 2007 2008
1102#
967967
(MW)
Year
Installed Generation Capacity Maximum Demand
773834 860
Gambarajah 4 : Kehendak Maksimum Bulanan
di Kulim Hi-Tech Park (KHTP) yang dilaporkan
oleh NUR Distribution Sdn. Bhd.
Sepanjang tiga tahun iaitu dari tahun 2006 hingga 2008
didapati kadar pertumbuhan beban di KHTP telah
menunjukkan pertambahan dari setahun ke setahun. Ini
dapat dilihat pada tahun 2008, kadar pertumbuhan beban
juga mencatatkan pertambahan 31.8% daripada 85 MW
kepada 112 MW.
Figure 4 : Monthly Maximum Demands
in Kulim Hi-Tech Park (KHTP) Reported
by NUR Distribution Sdn. Bhd.
The load growth in 2008 was 31.8% from 85 MW to 112 MW.
Month
60
70
80
90
100
110
120
Jan Feb Mar Apr May Jun Jul Aug Sep Oct Nov Dec
(MW)
2006 2007 2008
6366
7073 75
72 73 73 75 74 76 7676 7781 82
8583 83 82
84 83 8385
91 9195
10199
101 101
106109 111 112
110
15
Performance and Statistical Information 2008
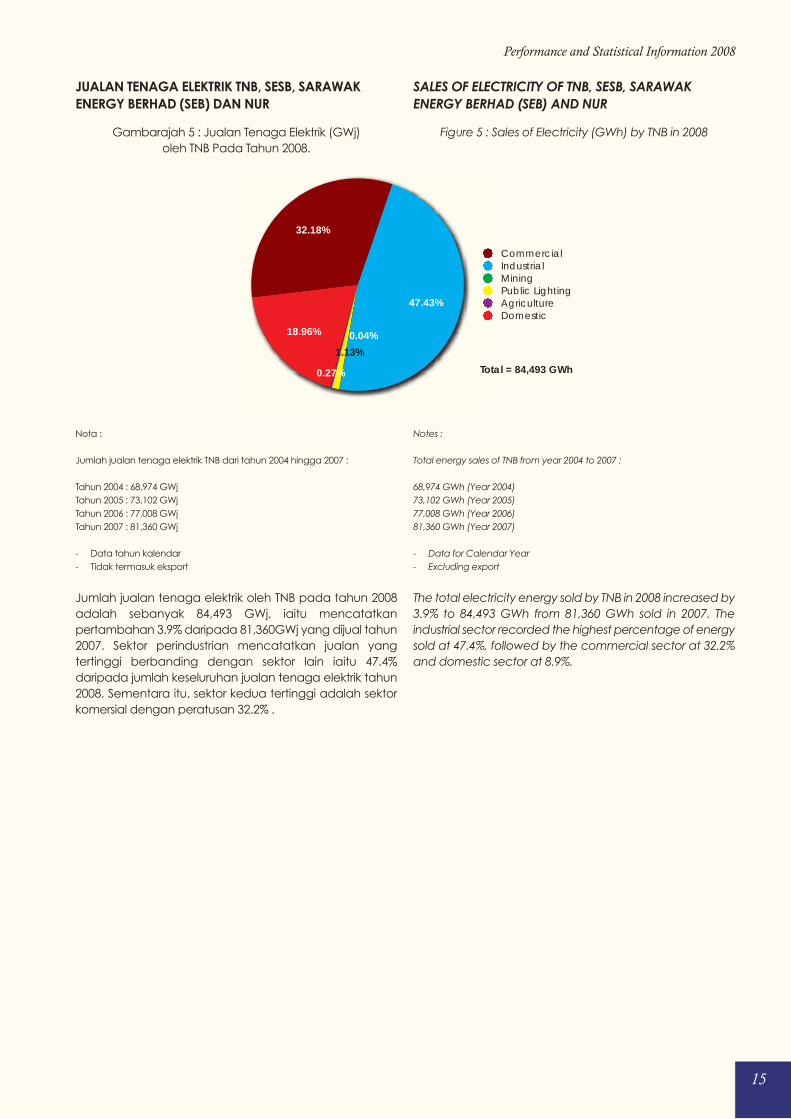
Gambarajah 5 : Jualan Tenaga Elektrik (GWj)
oleh TNB Pada Tahun 2008.
Nota :
Jumlah jualan tenaga elektrik TNB dari tahun 2004 hingga 2007 :
Tahun 2004 : 68,974 GWj
Tahun 2005 : 73,102 GWj
Tahun 2006 : 77,008 GWj
Tahun 2007 : 81,360 GWj
- Data tahun kalendar
- Tidak termasuk eksport
Jumlah jualan tenaga elektrik oleh TNB pada tahun 2008
adalah sebanyak 84,493 GWj, iaitu mencatatkan
pertambahan 3.9% daripada 81,360GWj yang dijual tahun
2007. Sektor perindustrian mencatatkan jualan yang
tertinggi berbanding dengan sektor lain iaitu 47.4%
daripada jumlah keseluruhan jualan tenaga elektrik tahun
2008. Sementara itu, sektor kedua tertinggi adalah sektor
komersial dengan peratusan 32.2% .
Figure 5 : Sales of Electricity (GWh) by TNB in 2008
Notes :
Total energy sales of TNB from year 2004 to 2007 :
68,974 GWh (Year 2004)
73,102 GWh (Year 2005)
77,008 GWh (Year 2006)
81,360 GWh (Year 2007)
- Data for Calendar Year
- Excluding export
The total electricity energy sold by TNB in 2008 increased by
3.9% to 84,493 GWh from 81,360 GWh sold in 2007. The
industrial sector recorded the highest percentage of energy
sold at 47.4%, followed by the commercial sector at 32.2%
and domestic sector at 8.9%.
JUALAN TENAGA ELEKTRIK TNB, SESB, SARAWAK
ENERGY BERHAD (SEB) DAN NUR
SALES OF ELECTRICITY OF TNB, SESB, SARAWAK
ENERGY BERHAD (SEB) AND NUR
18.96%
0.27%
1.13%
0.04%
47.43%
32.18%
CommercialIndustrialMiningPublic LightingAgricultureDomestic
Total = 84,493 GWh
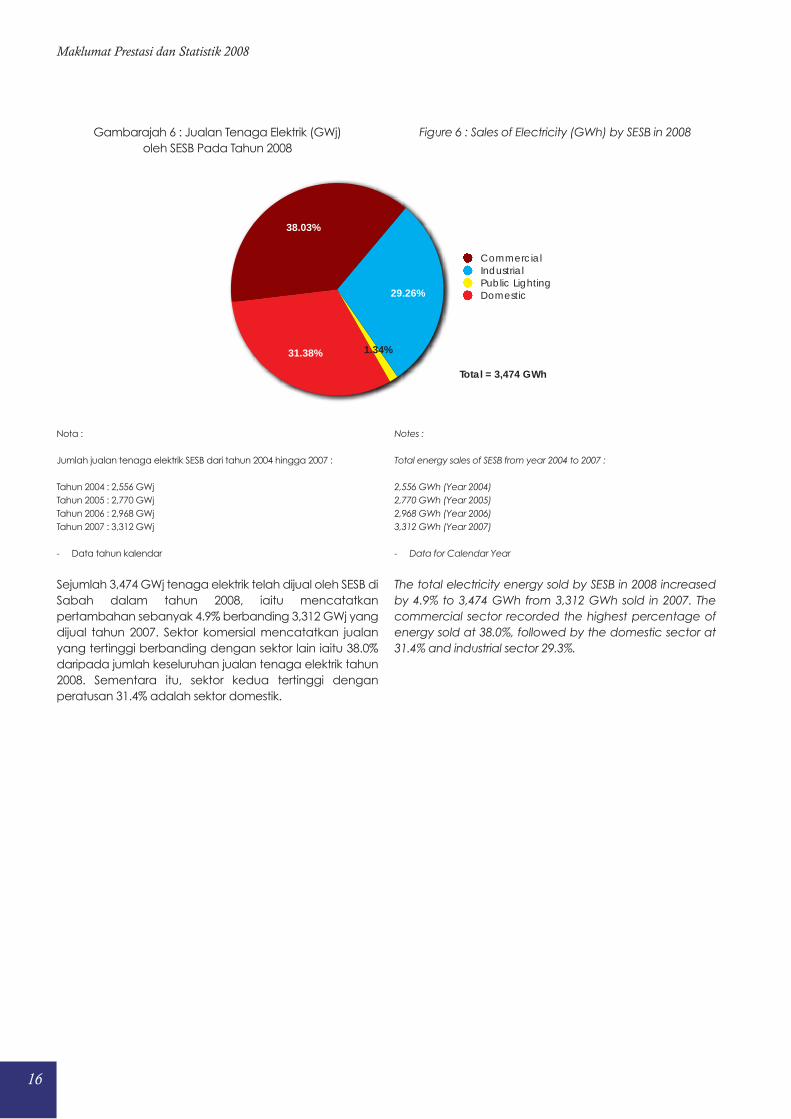
Gambarajah 6 : Jualan Tenaga Elektrik (GWj)
oleh SESB Pada Tahun 2008
Nota :
Jumlah jualan tenaga elektrik SESB dari tahun 2004 hingga 2007 :
Tahun 2004 : 2,556 GWj
Tahun 2005 : 2,770 GWj
Tahun 2006 : 2,968 GWj
Tahun 2007 : 3,312 GWj
- Data tahun kalendar
Sejumlah 3,474 GWj tenaga elektrik telah dijual oleh SESB di
Sabah dalam tahun 2008, iaitu mencatatkan
pertambahan sebanyak 4.9% berbanding 3,312 GWj yang
dijual tahun 2007. Sektor komersial mencatatkan jualan
yang tertinggi berbanding dengan sektor lain iaitu 38.0%
daripada jumlah keseluruhan jualan tenaga elektrik tahun
2008. Sementara itu, sektor kedua tertinggi dengan
peratusan 31.4% adalah sektor domestik.
Figure 6 : Sales of Electricity (GWh) by SESB in 2008
Notes :
Total energy sales of SESB from year 2004 to 2007 :
2,556 GWh (Year 2004)
2,770 GWh (Year 2005)
2,968 GWh (Year 2006)
3,312 GWh (Year 2007)
- Data for Calendar Year
The total electricity energy sold by SESB in 2008 increased
by 4.9% to 3,474 GWh from 3,312 GWh sold in 2007. The
commercial sector recorded the highest percentage of
energy sold at 38.0%, followed by the domestic sector at
31.4% and industrial sector 29.3%.
16
Maklumat Prestasi dan Statistik 2008
31.38% 1.34%
29.26%
38.03%
CommercialIndustrialPublic LightingDomestic
Total = 3,474 GWh
17
Performance and Statistical Information 2008
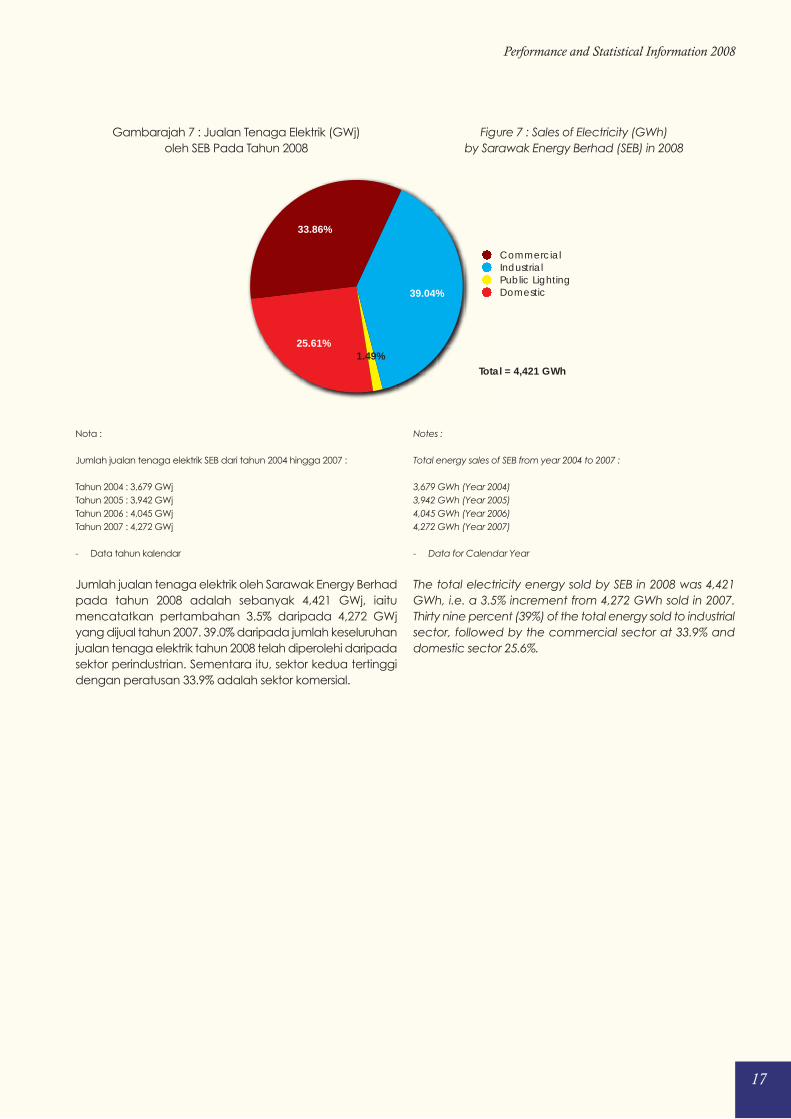
Gambarajah 7 : Jualan Tenaga Elektrik (GWj)
oleh SEB Pada Tahun 2008
Nota :
Jumlah jualan tenaga elektrik SEB dari tahun 2004 hingga 2007 :
Tahun 2004 : 3,679 GWj
Tahun 2005 : 3,942 GWj
Tahun 2006 : 4,045 GWj
Tahun 2007 : 4,272 GWj
- Data tahun kalendar
Jumlah jualan tenaga elektrik oleh Sarawak Energy Berhad
pada tahun 2008 adalah sebanyak 4,421 GWj, iaitu
mencatatkan pertambahan 3.5% daripada 4,272 GWj
yang dijual tahun 2007. 39.0% daripada jumlah keseluruhan
jualan tenaga elektrik tahun 2008 telah diperolehi daripada
sektor perindustrian. Sementara itu, sektor kedua tertinggi
dengan peratusan 33.9% adalah sektor komersial.
Figure 7 : Sales of Electricity (GWh)
by Sarawak Energy Berhad (SEB) in 2008
Notes :
Total energy sales of SEB from year 2004 to 2007 :
3,679 GWh (Year 2004)
3,942 GWh (Year 2005)
4,045 GWh (Year 2006)
4,272 GWh (Year 2007)
- Data for Calendar Year
The total electricity energy sold by SEB in 2008 was 4,421
GWh, i.e. a 3.5% increment from 4,272 GWh sold in 2007.
Thirty nine percent (39%) of the total energy sold to industrial
sector, followed by the commercial sector at 33.9% and
domestic sector 25.6%.
25.61%1.49%
39.04%
33.86%
CommercialIndustrialPublic LightingDomestic
Total = 4,421 GWh
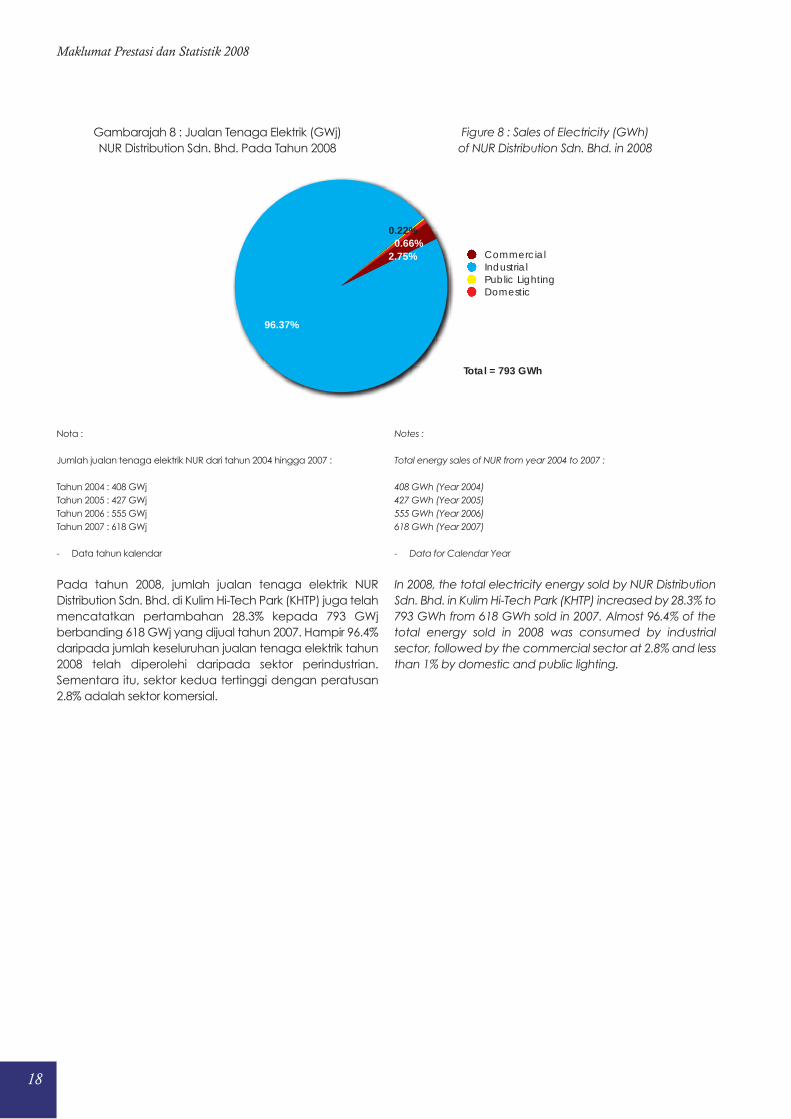
Gambarajah 8 : Jualan Tenaga Elektrik (GWj)
NUR Distribution Sdn. Bhd. Pada Tahun 2008
Nota :
Jumlah jualan tenaga elektrik NUR dari tahun 2004 hingga 2007 :
Tahun 2004 : 408 GWj
Tahun 2005 : 427 GWj
Tahun 2006 : 555 GWj
Tahun 2007 : 618 GWj
- Data tahun kalendar
Pada tahun 2008, jumlah jualan tenaga elektrik NUR
Distribution Sdn. Bhd. di Kulim Hi-Tech Park (KHTP) juga telah
mencatatkan pertambahan 28.3% kepada 793 GWj
berbanding 618 GWj yang dijual tahun 2007. Hampir 96.4%
daripada jumlah keseluruhan jualan tenaga elektrik tahun
2008 telah diperolehi daripada sektor perindustrian.
Sementara itu, sektor kedua tertinggi dengan peratusan
2.8% adalah sektor komersial.
Figure 8 : Sales of Electricity (GWh)
of NUR Distribution Sdn. Bhd. in 2008
Notes :
Total energy sales of NUR from year 2004 to 2007 :
408 GWh (Year 2004)
427 GWh (Year 2005)
555 GWh (Year 2006)
618 GWh (Year 2007)
- Data for Calendar Year
In 2008, the total electricity energy sold by NUR Distribution
Sdn. Bhd. in Kulim Hi-Tech Park (KHTP) increased by 28.3% to
793 GWh from 618 GWh sold in 2007. Almost 96.4% of the
total energy sold in 2008 was consumed by industrial
sector, followed by the commercial sector at 2.8% and less
than 1% by domestic and public lighting.
18
Maklumat Prestasi dan Statistik 2008
0.66%0.22%
96.37%
2.75% CommercialIndustrialPublic LightingDomestic
Total = 793 GWh
19
Performance and Statistical Information 2008
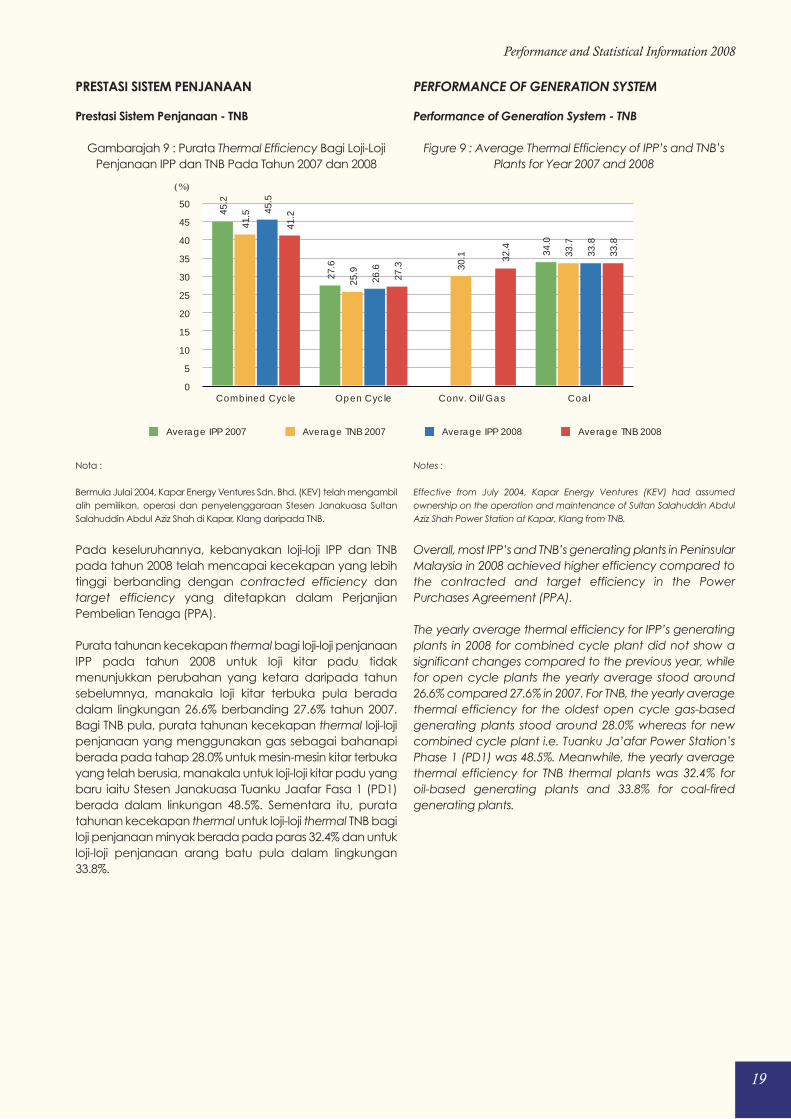
Prestasi Sistem Penjanaan - TNB
Gambarajah 9 : Purata Thermal Efficiency Bagi Loji-Loji
Penjanaan IPP dan TNB Pada Tahun 2007 dan 2008
Nota :
Bermula Julai 2004, Kapar Energy Ventures Sdn. Bhd. (KEV) telah mengambil
alih pemilikan, operasi dan penyelenggaraan Stesen Janakuasa Sultan
Salahuddin Abdul Aziz Shah di Kapar, Klang daripada TNB.
Pada keseluruhannya, kebanyakan loji-loji IPP dan TNB
pada tahun 2008 telah mencapai kecekapan yang lebih
tinggi berbanding dengan contracted efficiency dan
target efficiency yang ditetapkan dalam Perjanjian
Pembelian Tenaga (PPA).
Purata tahunan kecekapan thermal bagi loji-loji penjanaan
IPP pada tahun 2008 untuk loji kitar padu tidak
menunjukkan perubahan yang ketara daripada tahun
sebelumnya, manakala loji kitar terbuka pula berada
dalam lingkungan 26.6% berbanding 27.6% tahun 2007.
Bagi TNB pula, purata tahunan kecekapan thermal loji-loji
penjanaan yang menggunakan gas sebagai bahanapi
berada pada tahap 28.0% untuk mesin-mesin kitar terbuka
yang telah berusia, manakala untuk loji-loji kitar padu yang
baru iaitu Stesen Janakuasa Tuanku Jaafar Fasa 1 (PD1)
berada dalam linkungan 48.5%. Sementara itu, purata
tahunan kecekapan thermal untuk loji-loji thermal TNB bagi
loji penjanaan minyak berada pada paras 32.4% dan untuk
loji-loji penjanaan arang batu pula dalam lingkungan
33.8%.
Performance of Generation System - TNB
Figure 9 : Average Thermal Efficiency of IPP’s and TNB’s
Plants for Year 2007 and 2008
Notes :
Effective from July 2004, Kapar Energy Ventures (KEV) had assumed
ownership on the operation and maintenance of Sultan Salahuddin Abdul
Aziz Shah Power Station at Kapar, Klang from TNB.
Overall, most IPP’s and TNB’s generating plants in Peninsular
Malaysia in 2008 achieved higher efficiency compared to
the contracted and target efficiency in the Power
Purchases Agreement (PPA).
The yearly average thermal efficiency for IPP’s generating
plants in 2008 for combined cycle plant did not show a
significant changes compared to the previous year, while
for open cycle plants the yearly average stood around
26.6% compared 27.6% in 2007. For TNB, the yearly average
thermal efficiency for the oldest open cycle gas-based
generating plants stood around 28.0% whereas for new
combined cycle plant i.e. Tuanku Ja’afar Power Station’s
Phase 1 (PD1) was 48.5%. Meanwhile, the yearly average
thermal efficiency for TNB thermal plants was 32.4% for
oil-based generating plants and 33.8% for coal-fired
generating plants.
PRESTASI SISTEM PENJANAAN PERFORMANCE OF GENERATION SYSTEM
0
5
10
15
20
25
30
35
40
45
50
Combined Cycle Open Cycle Conv. Oil/Gas Coal
33.8
32.4
27.3
41.2
33.8
26.6
45.5
33.7
30.1
25.9
41.5
34.0
27.6
45.2
(%)
Average IPP 2007 Average TNB 2007 Average IPP 2008 Average TNB 2008
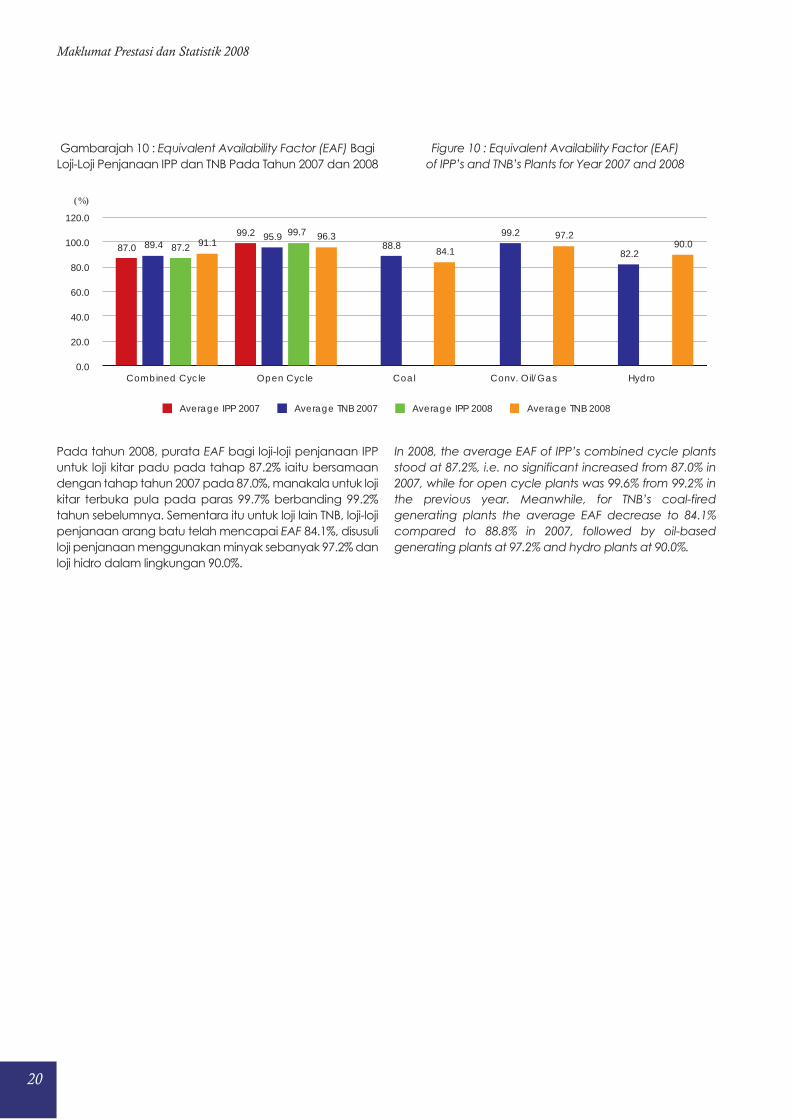
Gambarajah 10 : Equivalent Availability Factor (EAF) Bagi
Loji-Loji Penjanaan IPP dan TNB Pada Tahun 2007 dan 2008
Pada tahun 2008, purata EAF bagi loji-loji penjanaan IPP
untuk loji kitar padu pada tahap 87.2% iaitu bersamaan
dengan tahap tahun 2007 pada 87.0%, manakala untuk loji
kitar terbuka pula pada paras 99.7% berbanding 99.2%
tahun sebelumnya. Sementara itu untuk loji lain TNB, loji-loji
penjanaan arang batu telah mencapai EAF 84.1%, disusuli
loji penjanaan menggunakan minyak sebanyak 97.2% dan
loji hidro dalam lingkungan 90.0%.
Figure 10 : Equivalent Availability Factor (EAF)
of IPP’s and TNB’s Plants for Year 2007 and 2008
In 2008, the average EAF of IPP’s combined cycle plants
stood at 87.2%, i.e. no significant increased from 87.0% in
2007, while for open cycle plants was 99.6% from 99.2% in
the previous year. Meanwhile, for TNB’s coal-fired
generating plants the average EAF decrease to 84.1%
compared to 88.8% in 2007, followed by oil-based
generating plants at 97.2% and hydro plants at 90.0%.
20
Maklumat Prestasi dan Statistik 2008
0.0
20.0
40.0
60.0
80.0
100.0
120.0
Combined Cycle Open Cycle Coal Conv. Oil/Gas Hydro
90.097.2
84.1
96.391.1
99.7
87.282.2
99.288.8
95.989.4
99.2
87.0
(%)
Average IPP 2007 Average TNB 2007 Average IPP 2008 Average TNB 2008
21
Performance and Statistical Information 2008
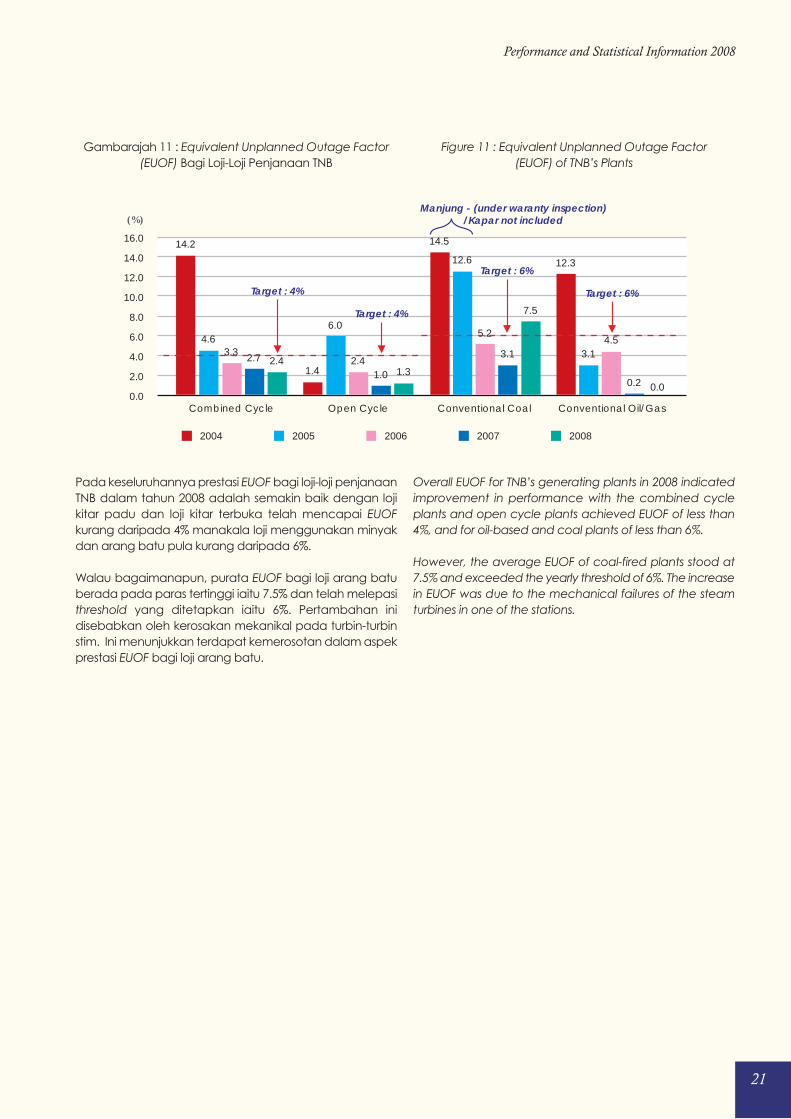
Gambarajah 11 : Equivalent Unplanned Outage Factor
(EUOF) Bagi Loji-Loji Penjanaan TNB
Pada keseluruhannya prestasi EUOF bagi loji-loji penjanaan
TNB dalam tahun 2008 adalah semakin baik dengan loji
kitar padu dan loji kitar terbuka telah mencapai EUOF
kurang daripada 4% manakala loji menggunakan minyak
dan arang batu pula kurang daripada 6%.
Walau bagaimanapun, purata EUOF bagi loji arang batu
berada pada paras tertinggi iaitu 7.5% dan telah melepasi
threshold yang ditetapkan iaitu 6%. Pertambahan ini
disebabkan oleh kerosakan mekanikal pada turbin-turbin
stim. Ini menunjukkan terdapat kemerosotan dalam aspek
prestasi EUOF bagi loji arang batu.
Figure 11 : Equivalent Unplanned Outage Factor
(EUOF) of TNB’s Plants
Overall EUOF for TNB’s generating plants in 2008 indicated
improvement in performance with the combined cycle
plants and open cycle plants achieved EUOF of less than
4%, and for oil-based and coal plants of less than 6%.
However, the average EUOF of coal-fired plants stood at
7.5% and exceeded the yearly threshold of 6%. The increase
in EUOF was due to the mechanical failures of the steam
turbines in one of the stations.
0.0
2.0
4.0
6.0
8.0
10.0
12.0
14.0
16.0
Combined Cycle Open Cycle Conventional Coal Conventional Oil/Gas
7.5
1.32.4
Target : 4%
Manjung - (under waranty inspection)/Kapar not included
0.2 0.0
3.1
1.0
2.7
4.55.2
2.43.3 3.1
12.6
6.04.6
12.3
14.5
1.4
14.2
(%)
2004 2005 2006 2007 2008
Target : 4%
Target : 6%
Target : 6%
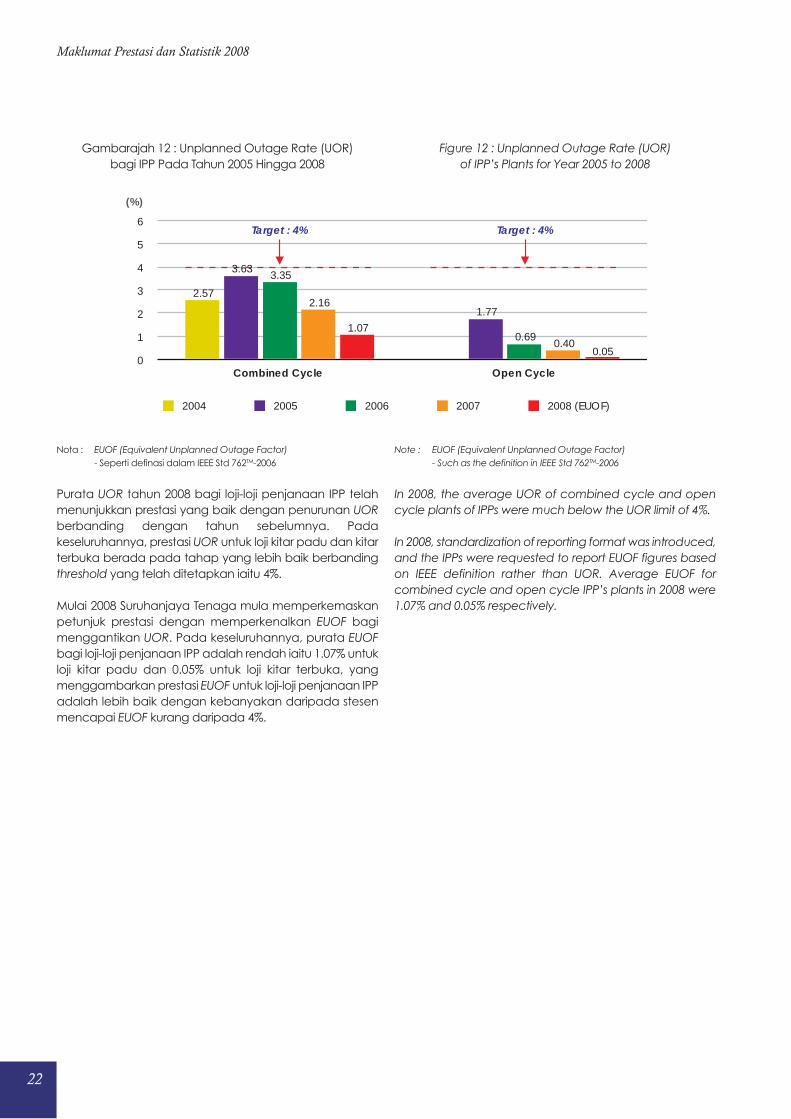
Gambarajah 12 : Unplanned Outage Rate (UOR)
bagi IPP Pada Tahun 2005 Hingga 2008
Nota : EUOF (Equivalent Unplanned Outage Factor)
- Seperti definasi dalam IEEE Std 762TM-2006
Purata UOR tahun 2008 bagi loji-loji penjanaan IPP telah
menunjukkan prestasi yang baik dengan penurunan UOR
berbanding dengan tahun sebelumnya. Pada
keseluruhannya, prestasi UOR untuk loji kitar padu dan kitar
terbuka berada pada tahap yang lebih baik berbanding
threshold yang telah ditetapkan iaitu 4%.
Mulai 2008 Suruhanjaya Tenaga mula memperkemaskan
petunjuk prestasi dengan memperkenalkan EUOF bagi
menggantikan UOR. Pada keseluruhannya, purata EUOF
bagi loji-loji penjanaan IPP adalah rendah iaitu 1.07% untuk
loji kitar padu dan 0.05% untuk loji kitar terbuka, yang
menggambarkan prestasi EUOF untuk loji-loji penjanaan IPP
adalah lebih baik dengan kebanyakan daripada stesen
mencapai EUOF kurang daripada 4%.
Figure 12 : Unplanned Outage Rate (UOR)
of IPP’s Plants for Year 2005 to 2008
Note : EUOF (Equivalent Unplanned Outage Factor)
- Such as the definition in IEEE Std 762TM-2006
In 2008, the average UOR of combined cycle and open
cycle plants of IPPs were much below the UOR limit of 4%.
In 2008, standardization of reporting format was introduced,
and the IPPs were requested to report EUOF figures based
on IEEE definition rather than UOR. Average EUOF for
combined cycle and open cycle IPP’s plants in 2008 were
1.07% and 0.05% respectively.
22
Maklumat Prestasi dan Statistik 2008
Target : 4% Target : 4%
0
1
2
3
4
5
6
Combined Cycle Open Cycle
0.05
1.070.40
2.16
0.69
3.35
1.77
3.63
2.57
(%)
2004 2005 2006 2007 2008 (EUOF)
23
Performance and Statistical Information 2008
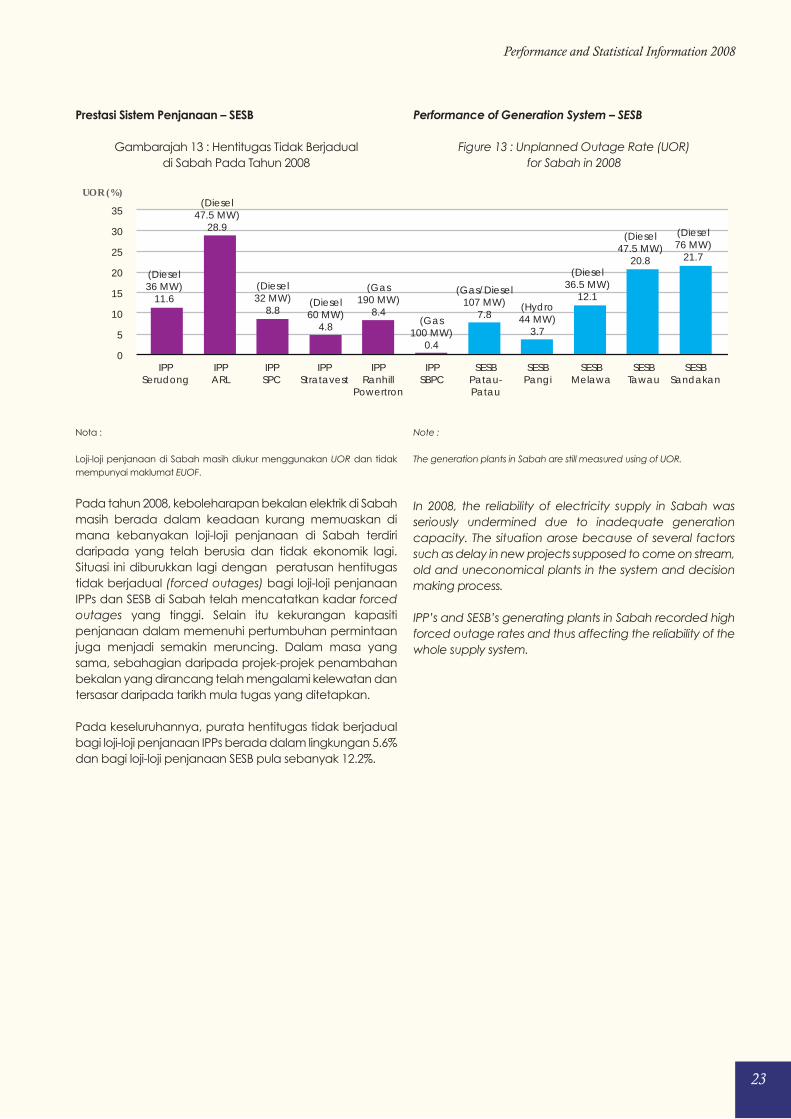
Prestasi Sistem Penjanaan – SESB
Gambarajah 13 : Hentitugas Tidak Berjadual
di Sabah Pada Tahun 2008
Nota :
Loji-loji penjanaan di Sabah masih diukur menggunakan UOR dan tidak
mempunyai maklumat EUOF.
Pada tahun 2008, keboleharapan bekalan elektrik di Sabah
masih berada dalam keadaan kurang memuaskan di
mana kebanyakan loji-loji penjanaan di Sabah terdiri
daripada yang telah berusia dan tidak ekonomik lagi.
Situasi ini diburukkan lagi dengan peratusan hentitugas
tidak berjadual (forced outages) bagi loji-loji penjanaan
IPPs dan SESB di Sabah telah mencatatkan kadar forced
outages yang tinggi. Selain itu kekurangan kapasiti
penjanaan dalam memenuhi pertumbuhan permintaan
juga menjadi semakin meruncing. Dalam masa yang
sama, sebahagian daripada projek-projek penambahan
bekalan yang dirancang telah mengalami kelewatan dan
tersasar daripada tarikh mula tugas yang ditetapkan.
Pada keseluruhannya, purata hentitugas tidak berjadual
bagi loji-loji penjanaan IPPs berada dalam lingkungan 5.6%
dan bagi loji-loji penjanaan SESB pula sebanyak 12.2%.
Performance of Generation System – SESB
Figure 13 : Unplanned Outage Rate (UOR)
for Sabah in 2008
Note :
The generation plants in Sabah are still measured using of UOR.
In 2008, the reliability of electricity supply in Sabah was
seriously undermined due to inadequate generation
capacity. The situation arose because of several factors
such as delay in new projects supposed to come on stream,
old and uneconomical plants in the system and decision
making process.
IPP’s and SESB’s generating plants in Sabah recorded high
forced outage rates and thus affecting the reliability of the
whole supply system.
0
5
10
15
20
25
30
35
IPPSerudong
IPPARL
IPPSPC
IPPStratavest
IPPRanhill
Powertron
IPPSBPC
SESBPatau-Patau
SESBPangi
SESBMelawa
SESBTawau
SESBSandakan
(Diesel76 MW)
21.7
(Diesel47.5 MW)
20.8(Diesel
36.5 MW)12.1
(Hydro44 MW)
3.7
(Gas/Diesel107 MW)
7.8(Gas
100 MW)0.4
(Gas190 MW)
8.4(Diesel60 MW)
4.8
(Diesel32 MW)
8.8
(Diesel47.5 MW)
28.9
(Diesel36 MW)
11.6
UOR (%)
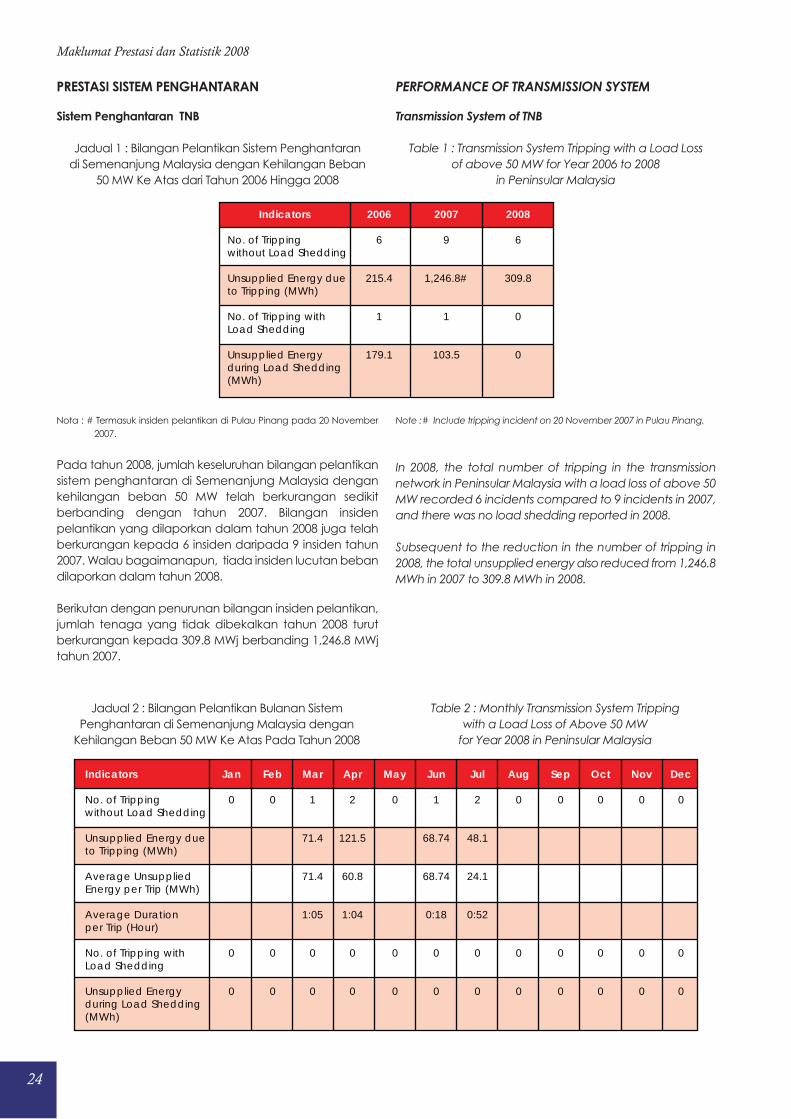
Sistem Penghantaran TNB
Jadual 1 : Bilangan Pelantikan Sistem Penghantaran
di Semenanjung Malaysia dengan Kehilangan Beban
50 MW Ke Atas dari Tahun 2006 Hingga 2008
Nota : # Termasuk insiden pelantikan di Pulau Pinang pada 20 November
2007.
Pada tahun 2008, jumlah keseluruhan bilangan pelantikan
sistem penghantaran di Semenanjung Malaysia dengan
kehilangan beban 50 MW telah berkurangan sedikit
berbanding dengan tahun 2007. Bilangan insiden
pelantikan yang dilaporkan dalam tahun 2008 juga telah
berkurangan kepada 6 insiden daripada 9 insiden tahun
2007. Walau bagaimanapun, tiada insiden lucutan beban
dilaporkan dalam tahun 2008.
Berikutan dengan penurunan bilangan insiden pelantikan,
jumlah tenaga yang tidak dibekalkan tahun 2008 turut
berkurangan kepada 309.8 MWj berbanding 1,246.8 MWj
tahun 2007.
Transmission System of TNB
Table 1 : Transmission System Tripping with a Load Loss
of above 50 MW for Year 2006 to 2008
in Peninsular Malaysia
Note :# Include tripping incident on 20 November 2007 in Pulau Pinang.
In 2008, the total number of tripping in the transmission
network in Peninsular Malaysia with a load loss of above 50
MW recorded 6 incidents compared to 9 incidents in 2007,
and there was no load shedding reported in 2008.
Subsequent to the reduction in the number of tripping in
2008, the total unsupplied energy also reduced from 1,246.8
MWh in 2007 to 309.8 MWh in 2008.
PRESTASI SISTEM PENGHANTARAN PERFORMANCE OF TRANSMISSION SYSTEM
24
Maklumat Prestasi dan Statistik 2008
2008
6
309.8
0
0
2007
9
1,246.8#
1
103.5
2006
6
215.4
1
179.1
Indicators
No. of Trippingwithout Load Shedding
Unsupplied Energy dueto Tripping (MWh)
No. of Tripping withLoad Shedding
Unsupplied Energyduring Load Shedding(MWh)
Jadual 2 : Bilangan Pelantikan Bulanan Sistem
Penghantaran di Semenanjung Malaysia dengan
Kehilangan Beban 50 MW Ke Atas Pada Tahun 2008
Table 2 : Monthly Transmission System Tripping
with a Load Loss of Above 50 MW
for Year 2008 in Peninsular Malaysia
Indicators
No. of Trippingwithout Load Shedding
Unsupplied Energy dueto Tripping (MWh)
Average UnsuppliedEnergy per Trip (MWh)
Average Durationper Trip (Hour)
No. of Tripping withLoad Shedding
Unsupplied Energyduring Load Shedding(MWh)
Jan
0
0
0
Feb
0
0
0
Mar
1
71.4
71.4
1:05
0
0
Apr
2
121.5
60.8
1:04
0
0
May
0
0
0
Jun
1
68.74
68.74
0:18
0
0
Jul
2
48.1
24.1
0:52
0
0
Aug
0
0
0
Sep
0
0
0
Oct
0
0
0
Nov
0
0
0
Dec
0
0
0
25
Performance and Statistical Information 2008
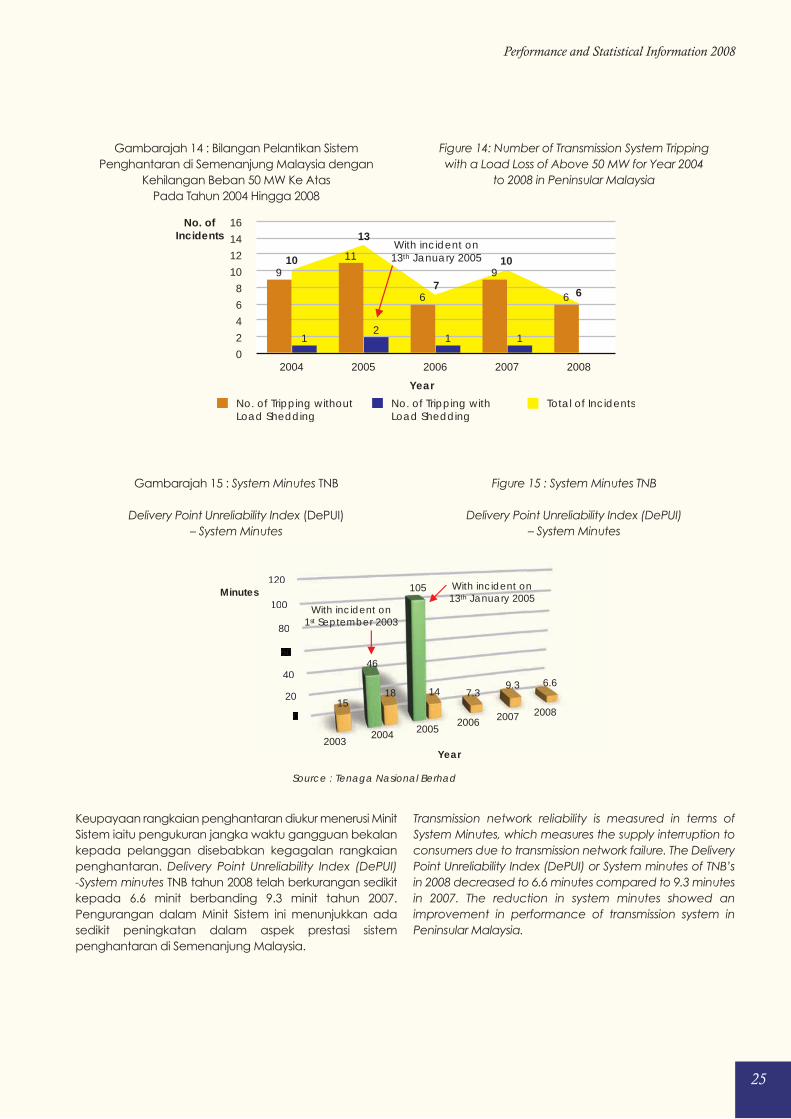
Gambarajah 14 : Bilangan Pelantikan Sistem
Penghantaran di Semenanjung Malaysia dengan
Kehilangan Beban 50 MW Ke Atas
Pada Tahun 2004 Hingga 2008
Gambarajah 15 : System Minutes TNB
Delivery Point Unreliability Index (DePUI)
– System Minutes
Keupayaan rangkaian penghantaran diukur menerusi Minit
Sistem iaitu pengukuran jangka waktu gangguan bekalan
kepada pelanggan disebabkan kegagalan rangkaian
penghantaran. Delivery Point Unreliability Index (DePUI)
-System minutes TNB tahun 2008 telah berkurangan sedikit
kepada 6.6 minit berbanding 9.3 minit tahun 2007.
Pengurangan dalam Minit Sistem ini menunjukkan ada
sedikit peningkatan dalam aspek prestasi sistem
penghantaran di Semenanjung Malaysia.
Figure 14: Number of Transmission System Tripping
with a Load Loss of Above 50 MW for Year 2004
to 2008 in Peninsular Malaysia
Figure 15 : System Minutes TNB
Delivery Point Unreliability Index (DePUI)
– System Minutes
Transmission network reliability is measured in terms of
System Minutes, which measures the supply interruption to
consumers due to transmission network failure. The Delivery
Point Unreliability Index (DePUI) or System minutes of TNB’s
in 2008 decreased to 6.6 minutes compared to 9.3 minutes
in 2007. The reduction in system minutes showed an
improvement in performance of transmission system in
Peninsular Malaysia.
0
2
4
6
8
10
12
14
16
2004 2005 2006 2007 2008
112
1
6
9
6
11
9
No. ofIncidents
With incident on13th January 2005
Year
No. of Tripping withoutLoad Shedding
No. of Tripping withLoad Shedding
Total of Incidents
10
13
7
10
6
0
20
40
60
80
100
120
0
20
40
60
80
100
120
46
105
1518 14 7.3
9.3 6.6
20032004 2005
2006 2007 2008
Minutes
Year
Source : Tenaga Nasional Berhad
With incident on1st September 2003
With incident on13th January 2005
26
Maklumat Prestasi dan Statistik 2008
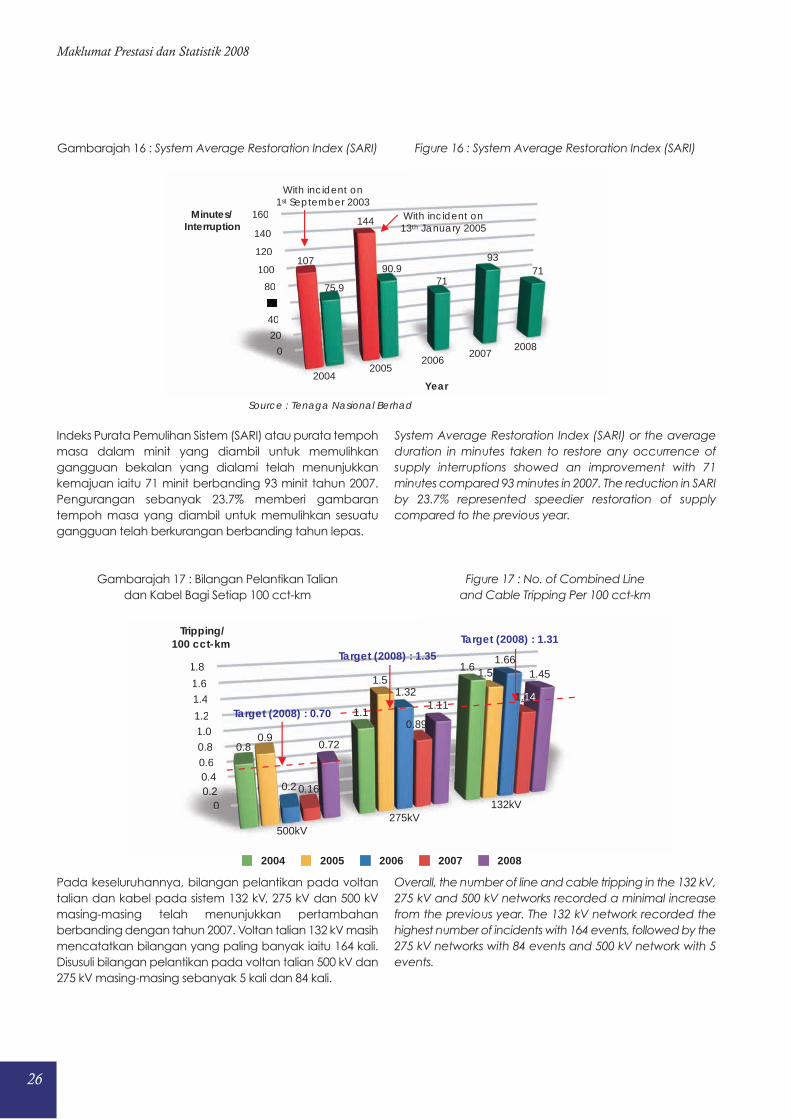
Gambarajah 16 : System Average Restoration Index (SARI)
Indeks Purata Pemulihan Sistem (SARI) atau purata tempoh
masa dalam minit yang diambil untuk memulihkan
gangguan bekalan yang dialami telah menunjukkan
kemajuan iaitu 71 minit berbanding 93 minit tahun 2007.
Pengurangan sebanyak 23.7% memberi gambaran
tempoh masa yang diambil untuk memulihkan sesuatu
gangguan telah berkurangan berbanding tahun lepas.
Gambarajah 17 : Bilangan Pelantikan Talian
dan Kabel Bagi Setiap 100 cct-km
Pada keseluruhannya, bilangan pelantikan pada voltan
talian dan kabel pada sistem 132 kV, 275 kV dan 500 kV
masing-masing telah menunjukkan pertambahan
berbanding dengan tahun 2007. Voltan talian 132 kV masih
mencatatkan bilangan yang paling banyak iaitu 164 kali.
Disusuli bilangan pelantikan pada voltan talian 500 kV dan
275 kV masing-masing sebanyak 5 kali dan 84 kali.
Figure 16 : System Average Restoration Index (SARI)
System Average Restoration Index (SARI) or the average
duration in minutes taken to restore any occurrence of
supply interruptions showed an improvement with 71
minutes compared 93 minutes in 2007. The reduction in SARI
by 23.7% represented speedier restoration of supply
compared to the previous year.
Figure 17 : No. of Combined Line
and Cable Tripping Per 100 cct-km
Overall, the number of line and cable tripping in the 132 kV,
275 kV and 500 kV networks recorded a minimal increase
from the previous year. The 132 kV network recorded the
highest number of incidents with 164 events, followed by the
275 kV networks with 84 events and 500 kV network with 5
events.
0
20
40
60
80
100
120
140
160
0
20
40
60
80
100
120
140
160
107
144
75.9
90.971
9371
20042005
20062007
2008
Minutes/Interruption
Year
Source : Tenaga Nasional Berhad
With incident on1st September 2003
With incident on13th January 2005
00.20.40.60.81.01.2
1.41.6
1.8
00.20.40.60.81.01.2
1.41.6
1.8
0.8
1.6
0.9
1.51.5
0.2
1.32
0.16
0.89
0.72
1.45
500kV275kV
132kV
2004 2005 2006 2007 2008
Tripping/100 cct-km
Target (2008) : 0.70
Target (2008) : 1.35
Target (2008) : 1.31
1.11.11
1.14
1.66
27
Performance and Statistical Information 2008
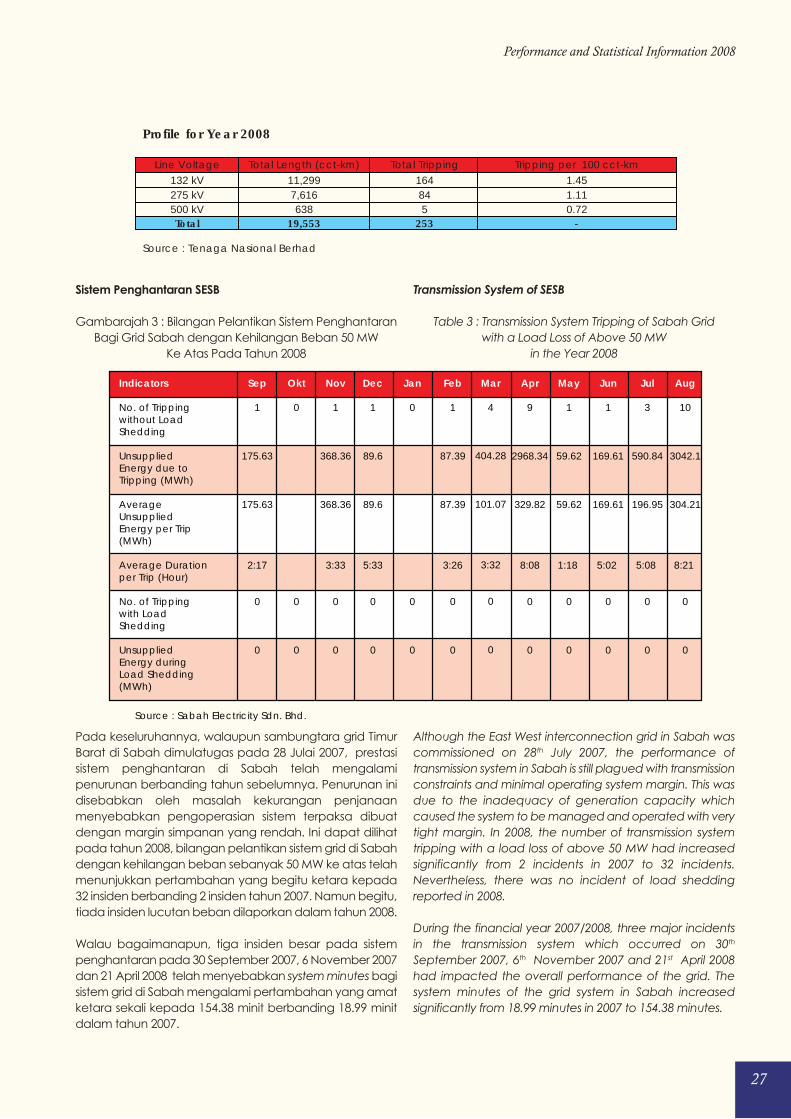
Sistem Penghantaran SESB
Gambarajah 3 : Bilangan Pelantikan Sistem Penghantaran
Bagi Grid Sabah dengan Kehilangan Beban 50 MW
Ke Atas Pada Tahun 2008
Pada keseluruhannya, walaupun sambungtara grid Timur
Barat di Sabah dimulatugas pada 28 Julai 2007, prestasi
sistem penghantaran di Sabah telah mengalami
penurunan berbanding tahun sebelumnya. Penurunan ini
disebabkan oleh masalah kekurangan penjanaan
menyebabkan pengoperasian sistem terpaksa dibuat
dengan margin simpanan yang rendah. Ini dapat dilihat
pada tahun 2008, bilangan pelantikan sistem grid di Sabah
dengan kehilangan beban sebanyak 50 MW ke atas telah
menunjukkan pertambahan yang begitu ketara kepada
32 insiden berbanding 2 insiden tahun 2007. Namun begitu,
tiada insiden lucutan beban dilaporkan dalam tahun 2008.
Walau bagaimanapun, tiga insiden besar pada sistem
penghantaran pada 30 September 2007, 6 November 2007
dan 21 April 2008 telah menyebabkan system minutes bagi
sistem grid di Sabah mengalami pertambahan yang amat
ketara sekali kepada 154.38 minit berbanding 18.99 minit
dalam tahun 2007.
Transmission System of SESB
Table 3 : Transmission System Tripping of Sabah Grid
with a Load Loss of Above 50 MW
in the Year 2008
Although the East West interconnection grid in Sabah was
commissioned on 28th July 2007, the performance of
transmission system in Sabah is still plagued with transmission
constraints and minimal operating system margin. This was
due to the inadequacy of generation capacity which
caused the system to be managed and operated with very
tight margin. In 2008, the number of transmission system
tripping with a load loss of above 50 MW had increased
significantly from 2 incidents in 2007 to 32 incidents.
Nevertheless, there was no incident of load shedding
reported in 2008.
During the financial year 2007/2008, three major incidents
in the transmission system which occurred on 30th
September 2007, 6th November 2007 and 21st April 2008
had impacted the overall performance of the grid. The
system minutes of the grid system in Sabah increased
significantly from 18.99 minutes in 2007 to 154.38 minutes.
Profile for Year 2008
Line Voltage Total Length (cct-km) Total Tripping Tripping per 100 cct-km132 kV 11,299 164 1.45275 kV 7,616 84 1.11500 kV 638 5 0.72Total 19,553 253 -
Source : Tenaga Nasional Berhad
Source : Sabah Electricity Sdn. Bhd.
Indicators
No. of Trippingwithout LoadShedding
UnsuppliedEnergy due toTripping (MWh)
AverageUnsuppliedEnergy per Trip(MWh)
Average Durationper Trip (Hour)
No. of Trippingwith LoadShedding
UnsuppliedEnergy duringLoad Shedding(MWh)
Jan
0
0
0
Feb
1
87.39
87.39
3:26
0
0
Mar
4
404.28
101.07
3:32
0
0
Apr
9
2968.34
329.82
8:08
0
0
May
1
59.62
59.62
1:18
0
0
Jun
1
169.61
169.61
5:02
0
0
Jul
3
590.84
196.95
5:08
0
0
Aug
10
3042.1
304.21
8:21
0
0
Sep
1
175.63
175.63
2:17
0
0
Okt
0
0
0
Nov
1
368.36
368.36
3:33
0
0
Dec
1
89.6
89.6
5:33
0
0
28
Maklumat Prestasi dan Statistik 2008
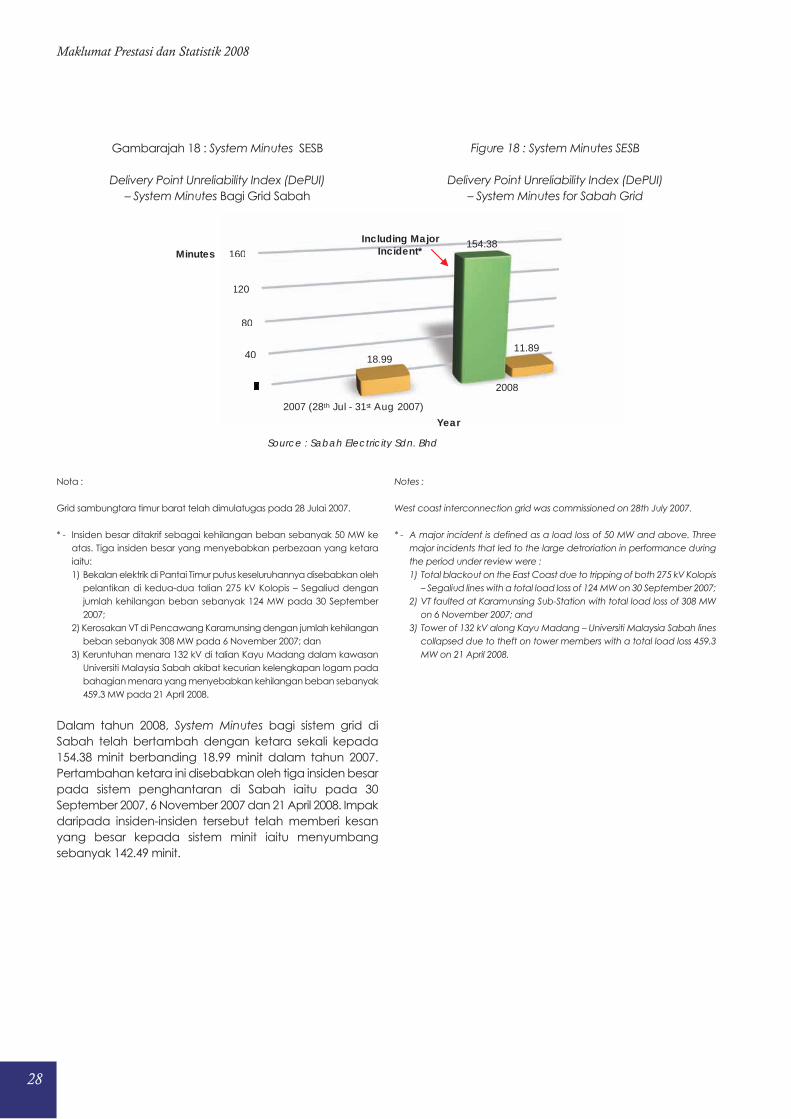
Gambarajah 18 : System Minutes SESB
Delivery Point Unreliability Index (DePUI)
– System Minutes Bagi Grid Sabah
Nota :
Grid sambungtara timur barat telah dimulatugas pada 28 Julai 2007.
* - Insiden besar ditakrif sebagai kehilangan beban sebanyak 50 MW ke
atas. Tiga insiden besar yang menyebabkan perbezaan yang ketara
iaitu:
1) Bekalan elektrik di Pantai Timur putus keseluruhannya disebabkan oleh
pelantikan di kedua-dua talian 275 kV Kolopis – Segaliud dengan
jumlah kehilangan beban sebanyak 124 MW pada 30 September
2007;
2) Kerosakan VT di Pencawang Karamunsing dengan jumlah kehilangan
beban sebanyak 308 MW pada 6 November 2007; dan
3) Keruntuhan menara 132 kV di talian Kayu Madang dalam kawasan
Universiti Malaysia Sabah akibat kecurian kelengkapan logam pada
bahagian menara yang menyebabkan kehilangan beban sebanyak
459.3 MW pada 21 April 2008.
Dalam tahun 2008, System Minutes bagi sistem grid di
Sabah telah bertambah dengan ketara sekali kepada
154.38 minit berbanding 18.99 minit dalam tahun 2007.
Pertambahan ketara ini disebabkan oleh tiga insiden besar
pada sistem penghantaran di Sabah iaitu pada 30
September 2007, 6 November 2007 dan 21 April 2008. Impak
daripada insiden-insiden tersebut telah memberi kesan
yang besar kepada sistem minit iaitu menyumbang
sebanyak 142.49 minit.
Figure 18 : System Minutes SESB
Delivery Point Unreliability Index (DePUI)
– System Minutes for Sabah Grid
Notes :
West coast interconnection grid was commissioned on 28th July 2007.
* - A major incident is defined as a load loss of 50 MW and above. Three
major incidents that led to the large detroriation in performance during
the period under review were :
1) Total blackout on the East Coast due to tripping of both 275 kV Kolopis
– Segaliud lines with a total load loss of 124 MW on 30 September 2007;
2) VT faulted at Karamunsing Sub-Station with total load loss of 308 MW
on 6 November 2007; and
3) Tower of 132 kV along Kayu Madang – Universiti Malaysia Sabah lines
collapsed due to theft on tower members with a total load loss 459.3
MW on 21 April 2008.
0
40
80
120
160
0
40
80
120
160154.38
18.9911.89
2007 (28th Jul - 31st Aug 2007)
2008
MinutesIncluding Major
Incident*
Year
Source : Sabah Electricity Sdn. Bhd
29
Performance and Statistical Information 2008
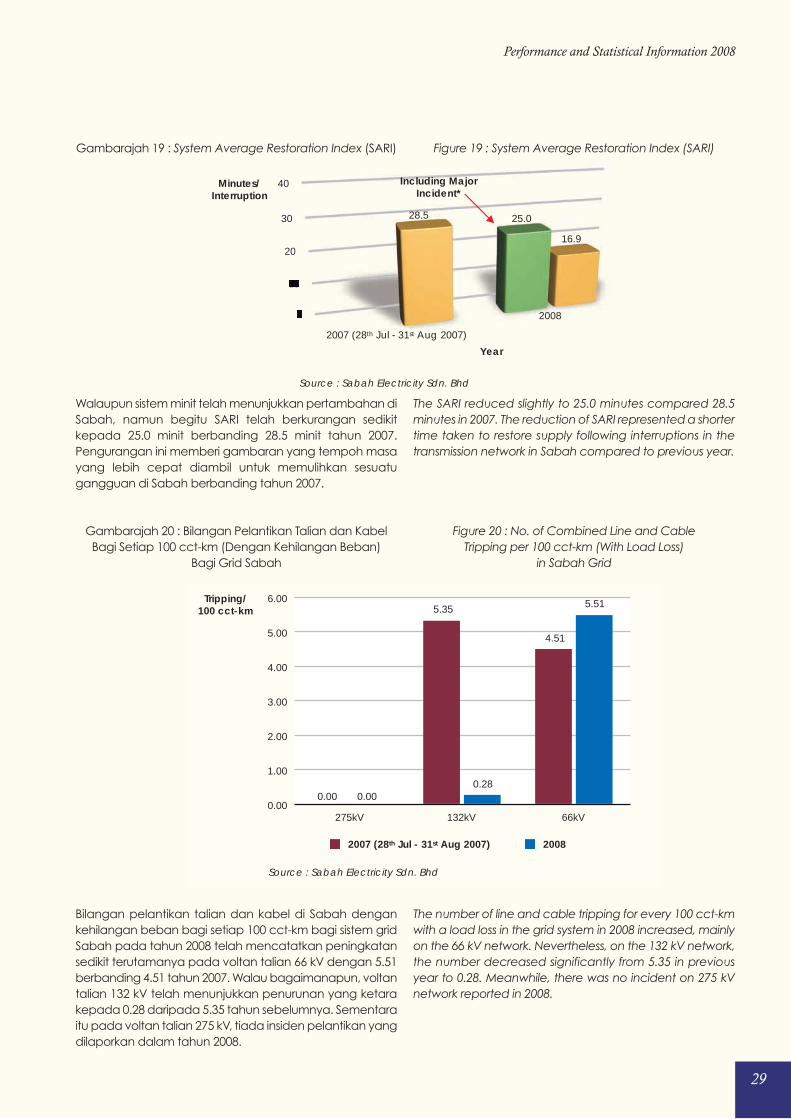
Gambarajah 19 : System Average Restoration Index (SARI)
Walaupun sistem minit telah menunjukkan pertambahan di
Sabah, namun begitu SARI telah berkurangan sedikit
kepada 25.0 minit berbanding 28.5 minit tahun 2007.
Pengurangan ini memberi gambaran yang tempoh masa
yang lebih cepat diambil untuk memulihkan sesuatu
gangguan di Sabah berbanding tahun 2007.
Figure 19 : System Average Restoration Index (SARI)
The SARI reduced slightly to 25.0 minutes compared 28.5
minutes in 2007. The reduction of SARI represented a shorter
time taken to restore supply following interruptions in the
transmission network in Sabah compared to previous year.
0
10
20
30
40
0
10
20
30
40
25.028.5
16.9
2007 (28th Jul - 31st Aug 2007)
2008
Minutes/Interruption
Including MajorIncident*
Year
Source : Sabah Electricity Sdn. Bhd
Gambarajah 20 : Bilangan Pelantikan Talian dan Kabel
Bagi Setiap 100 cct-km (Dengan Kehilangan Beban)
Bagi Grid Sabah
Bilangan pelantikan talian dan kabel di Sabah dengan
kehilangan beban bagi setiap 100 cct-km bagi sistem grid
Sabah pada tahun 2008 telah mencatatkan peningkatan
sedikit terutamanya pada voltan talian 66 kV dengan 5.51
berbanding 4.51 tahun 2007. Walau bagaimanapun, voltan
talian 132 kV telah menunjukkan penurunan yang ketara
kepada 0.28 daripada 5.35 tahun sebelumnya. Sementara
itu pada voltan talian 275 kV, tiada insiden pelantikan yang
dilaporkan dalam tahun 2008.
Figure 20 : No. of Combined Line and Cable
Tripping per 100 cct-km (With Load Loss)
in Sabah Grid
The number of line and cable tripping for every 100 cct-km
with a load loss in the grid system in 2008 increased, mainly
on the 66 kV network. Nevertheless, on the 132 kV network,
the number decreased significantly from 5.35 in previous
year to 0.28. Meanwhile, there was no incident on 275 kV
network reported in 2008.
0.00
1.00
2.00
3.00
4.00
5.00
6.00
275kV 132kV 66kV
5.51
0.28
4.51
0.000.00
5.35
2007 (28th Jul - 31st Aug 2007) 2008
Tripping/100 cct-km
Source : Sabah Electricity Sdn. Bhd
30
Maklumat Prestasi dan Statistik 2008
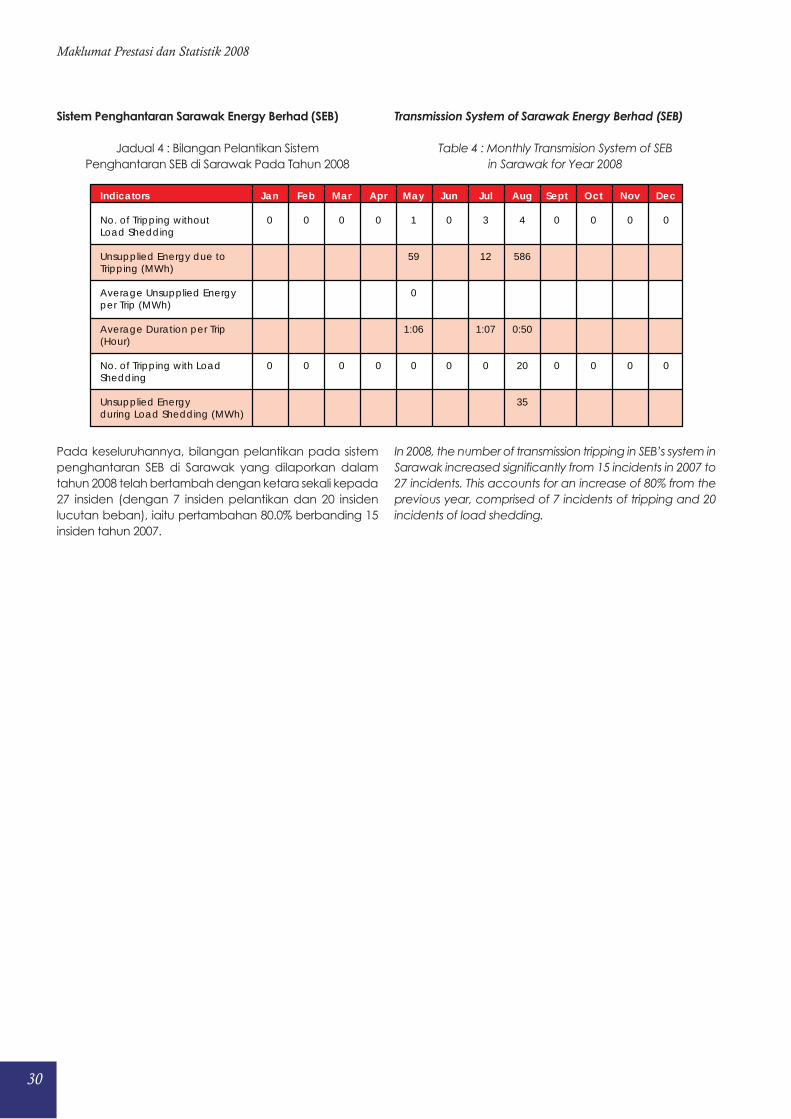
Sistem Penghantaran Sarawak Energy Berhad (SEB)
Jadual 4 : Bilangan Pelantikan Sistem
Penghantaran SEB di Sarawak Pada Tahun 2008
Pada keseluruhannya, bilangan pelantikan pada sistem
penghantaran SEB di Sarawak yang dilaporkan dalam
tahun 2008 telah bertambah dengan ketara sekali kepada
27 insiden (dengan 7 insiden pelantikan dan 20 insiden
lucutan beban), iaitu pertambahan 80.0% berbanding 15
insiden tahun 2007.
Transmission System of Sarawak Energy Berhad (SEB)
Table 4 : Monthly Transmision System of SEB
in Sarawak for Year 2008
In 2008, the number of transmission tripping in SEB’s system in
Sarawak increased significantly from 15 incidents in 2007 to
27 incidents. This accounts for an increase of 80% from the
previous year, comprised of 7 incidents of tripping and 20
incidents of load shedding.
Indicators
No. of Tripping withoutLoad Shedding
Unsupplied Energy due toTripping (MWh)
Average Unsupplied Energyper Trip (MWh)
Average Duration per Trip(Hour)
No. of Tripping with LoadShedding
Unsupplied Energyduring Load Shedding (MWh)
Jan
0
0
Feb
0
0
Mar
0
0
Apr
0
0
May
1
59
0
1:06
0
Jun
0
0
Jul
3
12
1:07
0
Aug
4
586
0:50
20
35
Sept
0
0
Oct
0
0
Nov
0
0
Dec
0
0
31
Performance and Statistical Information 2008
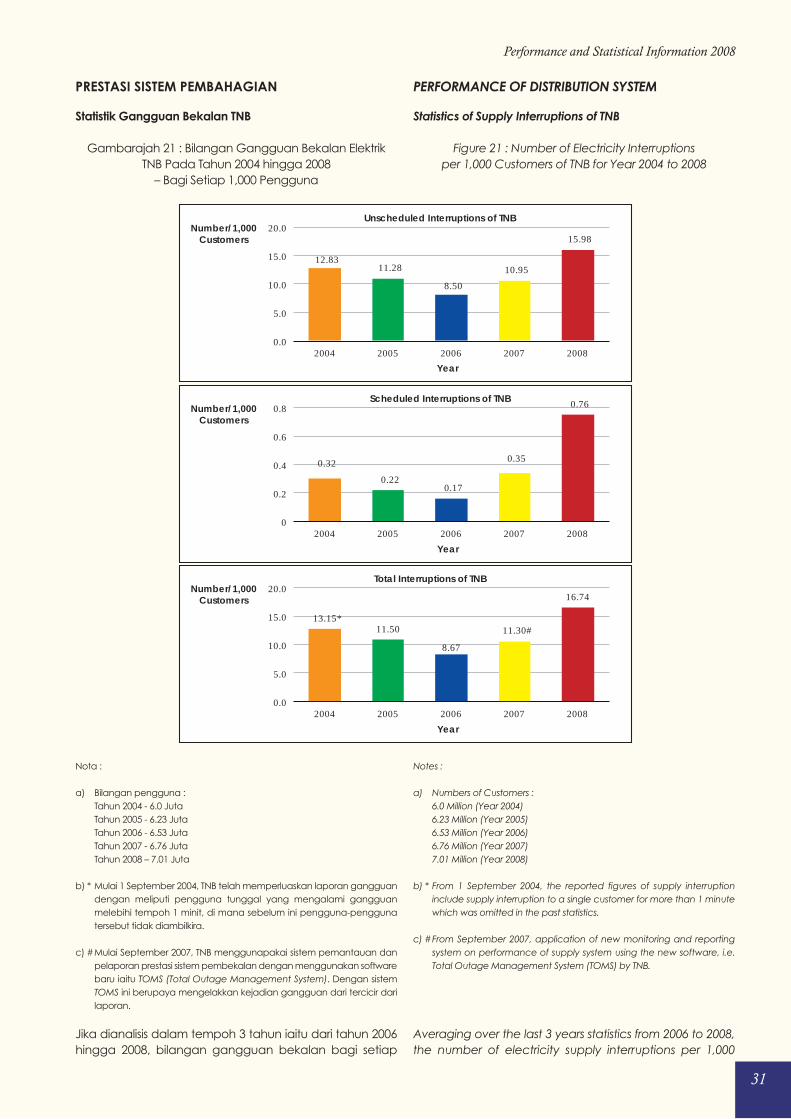
Statistik Gangguan Bekalan TNB
Gambarajah 21 : Bilangan Gangguan Bekalan Elektrik
TNB Pada Tahun 2004 hingga 2008
– Bagi Setiap 1,000 Pengguna
Nota :
a) Bilangan pengguna :
Tahun 2004 - 6.0 Juta
Tahun 2005 - 6.23 Juta
Tahun 2006 - 6.53 Juta
Tahun 2007 - 6.76 Juta
Tahun 2008 – 7.01 Juta
b) * Mulai 1 September 2004, TNB telah memperluaskan laporan gangguan
dengan meliputi pengguna tunggal yang mengalami gangguan
melebihi tempoh 1 minit, di mana sebelum ini pengguna-pengguna
tersebut tidak diambilkira.
c) #Mulai September 2007, TNB menggunapakai sistem pemantauan dan
pelaporan prestasi sistem pembekalan dengan menggunakan software
baru iaitu TOMS (Total Outage Management System). Dengan sistem
TOMS ini berupaya mengelakkan kejadian gangguan dari tercicir dari
laporan.
Jika dianalisis dalam tempoh 3 tahun iaitu dari tahun 2006
hingga 2008, bilangan gangguan bekalan bagi setiap
Statistics of Supply Interruptions of TNB
Figure 21 : Number of Electricity Interruptions
per 1,000 Customers of TNB for Year 2004 to 2008
Notes :
a) Numbers of Customers :
6.0 Million (Year 2004)
6.23 Million (Year 2005)
6.53 Million (Year 2006)
6.76 Million (Year 2007)
7.01 Million (Year 2008)
b) * From 1 September 2004, the reported figures of supply interruption
include supply interruption to a single customer for more than 1 minute
which was omitted in the past statistics.
c) #From September 2007, application of new monitoring and reporting
system on performance of supply system using the new software, i.e.
Total Outage Management System (TOMS) by TNB.
Averaging over the last 3 years statistics from 2006 to 2008,
the number of electricity supply interruptions per 1,000
PRESTASI SISTEM PEMBAHAGIAN PERFORMANCE OF DISTRIBUTION SYSTEM
0.0
5.0
10.0
15.0
20.0
2004 2005 2006 2007 2008
15.98
10.95
8.50
11.2812.83
Year
Number/1,000Customers
Unscheduled Interruptions of TNB
Number/1,000Customers
0
0.2
0.4
0.6
0.8
2004 2005 2006 2007 2008
0.76
0.35
0.170.22
0.32
Year
Scheduled Interruptions of TNB
0.0
5.0
10.0
15.0
20.0
2004 2005 2006 2007 2008
16.74
11.30#
8.67
11.5013.15*
Year
Number/1,000Customers
Total Interruptions of TNB
32
Maklumat Prestasi dan Statistik 2008
1,000 pengguna pada sistem pembekalan TNB di
Semenanjung Malaysia telah menunjukkan trend
bertambah dari setahun ke setahun. Dalam pada itu, bagi
memperkemaskan dan meningkatkan kredibiliti dalam
pengumpulan data, TNB telah melancarkan penggunaan
sistem pemantauan dan pelaporan prestasi sistem
pembekalan yang baru iaitu TOMS (Total Outage
Management System).
Pada keseluruhannya, selaras dengan dengan
penggunaan sistem baru tersebut menunjukkan bilangan
gangguan bekalan elektrik bagi setiap 1,000 pengguna
pada tahun 2008 telah bertambah kepada 16.74
gangguan berbanding 11.30 gangguan tahun 2007, iaitu
pertambahan sebanyak 48.1%. Pertambahan ini adalah
disebabkan ciri-ciri kawalan data yang lebih ketat oleh
TOMS dari peringkat penerimaan aduan sehingga ke
peringkat pemulihan bekalan. Hampir 95.5% daripada
jumlah keseluruhan gangguan bekalan tahun 2008 adalah
disebabkan oleh gangguan tidak berjadual manakala
gangguan berjadual hanya mencatat peratusan 4.5%
sahaja.
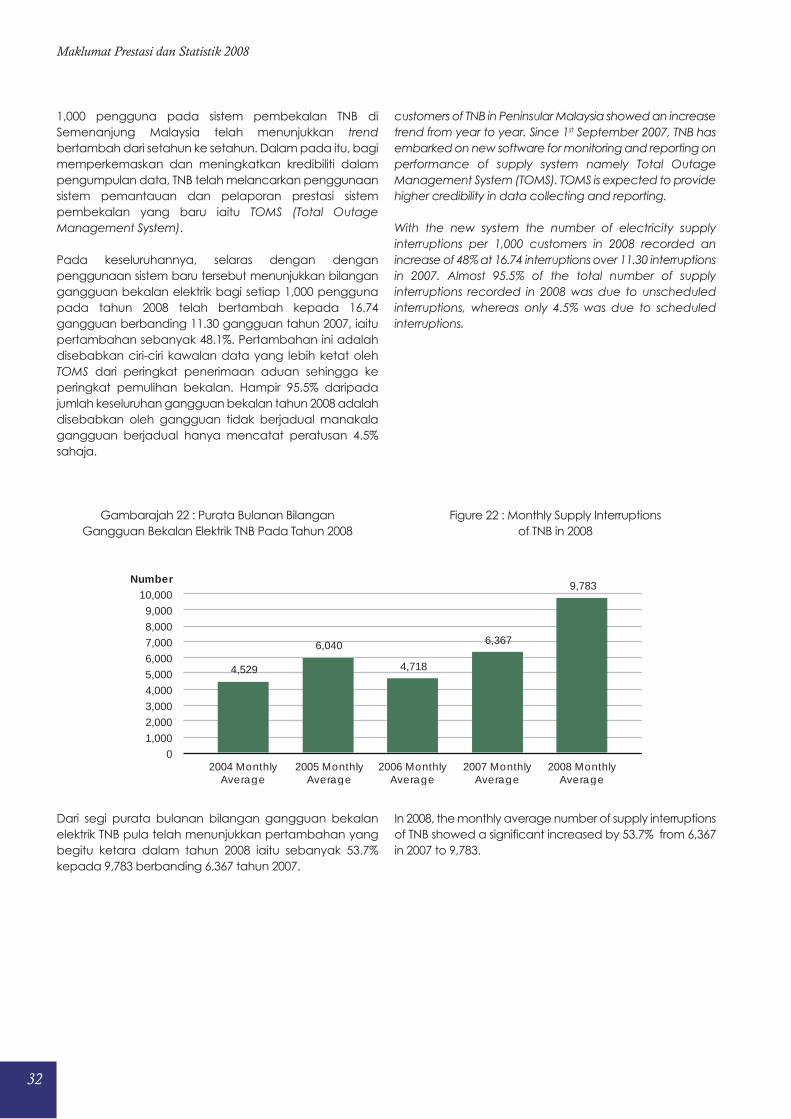
Gambarajah 22 : Purata Bulanan Bilangan
Gangguan Bekalan Elektrik TNB Pada Tahun 2008
Dari segi purata bulanan bilangan gangguan bekalan
elektrik TNB pula telah menunjukkan pertambahan yang
begitu ketara dalam tahun 2008 iaitu sebanyak 53.7%
kepada 9,783 berbanding 6,367 tahun 2007.
customers of TNB in Peninsular Malaysia showed an increase
trend from year to year. Since 1st September 2007, TNB has
embarked on new software for monitoring and reporting on
performance of supply system namely Total Outage
Management System (TOMS). TOMS is expected to provide
higher credibility in data collecting and reporting.
With the new system the number of electricity supply
interruptions per 1,000 customers in 2008 recorded an
increase of 48% at 16.74 interruptions over 11.30 interruptions
in 2007. Almost 95.5% of the total number of supply
interruptions recorded in 2008 was due to unscheduled
interruptions, whereas only 4.5% was due to scheduled
interruptions.
Figure 22 : Monthly Supply Interruptions
of TNB in 2008
In 2008, the monthly average number of supply interruptions
of TNB showed a significant increased by 53.7% from 6,367
in 2007 to 9,783.
01,0002,0003,0004,0005,0006,0007,0008,0009,000
10,000
2004 MonthlyAverage
2005 MonthlyAverage
2006 MonthlyAverage
2007 MonthlyAverage
2008 MonthlyAverage
9,783
6,367
4,718
6,040
4,529
Number
33
Performance and Statistical Information 2008
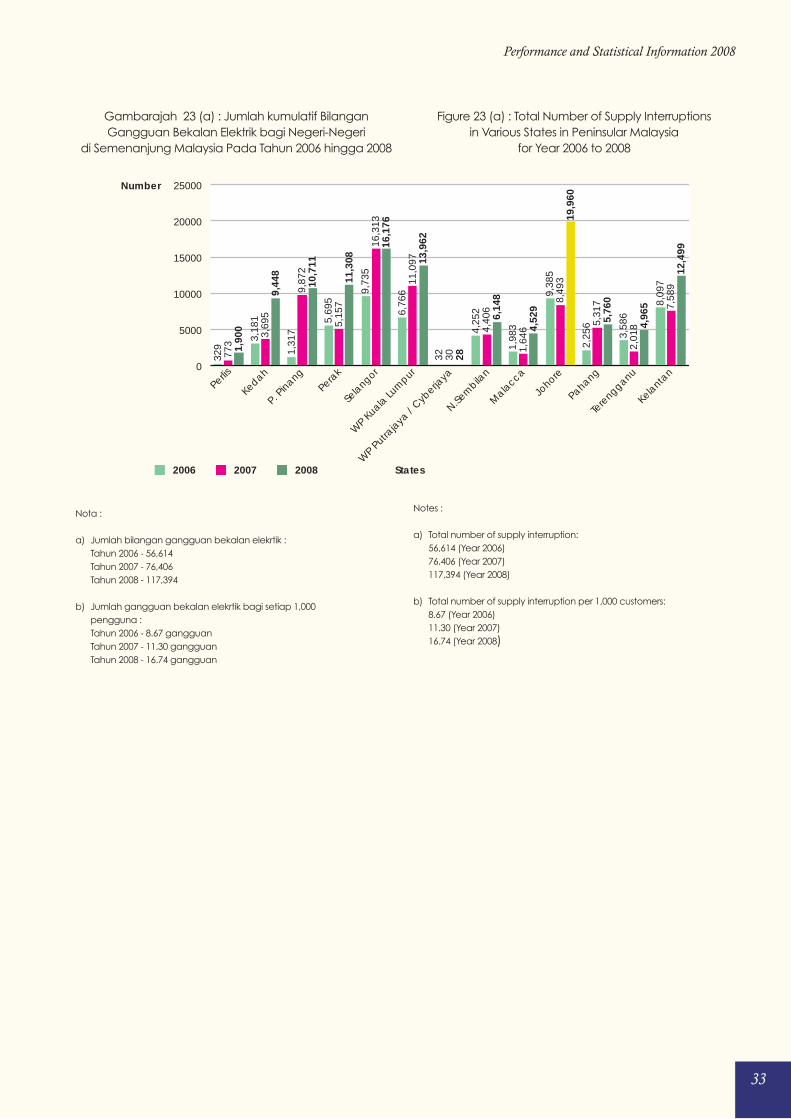
Gambarajah 23 (a) : Jumlah kumulatif Bilangan
Gangguan Bekalan Elektrik bagi Negeri-Negeri
di Semenanjung Malaysia Pada Tahun 2006 hingga 2008
Nota :
a) Jumlah bilangan gangguan bekalan elekrtik :
Tahun 2006 - 56,614
Tahun 2007 - 76,406
Tahun 2008 - 117,394
b) Jumlah gangguan bekalan elekrtik bagi setiap 1,000
pengguna :
Tahun 2006 - 8.67 gangguan
Tahun 2007 - 11.30 gangguan
Tahun 2008 - 16.74 gangguan
Figure 23 (a) : Total Number of Supply Interruptions
in Various States in Peninsular Malaysia
for Year 2006 to 2008
Notes :
a) Total number of supply interruption:
56,614 (Year 2006)
76,406 (Year 2007)
117,394 (Year 2008)
b) Total number of supply interruption per 1,000 customers:
8.67 (Year 2006)
11.30 (Year 2007)
16.74 (Year 2008)
0
5000
10000
15000
20000
25000
Perlis
Kedah
P. Pinang
Perak
Sela
ngor
WP K
uala Lu
mpur
WP P
utraja
ya /
Cyberja
ya
N.Sem
bilan
Mala
cca
Pahang
Kelanta
n
Johore
Tere
ngganu
12,4
99
4,96
5
5,76
0
19,9
60
4,52
9
6,14
8
28
13,9
6216,1
76
11,3
08
10,7
11
9,44
8
1,90
0
7,58
9
2,01
85,31
78,49
3
1,64
64,40
6
30
11,0
97
16,3
13
5,15
7
9,87
2
3,69
5
773
8,09
7
3,58
6
2,25
6
9,38
5
1,98
34,25
2
32
6,76
69,73
5
5,69
5
1,31
7
3,18
1
329
2006 2007 2008
Number
States
34
Maklumat Prestasi dan Statistik 2008
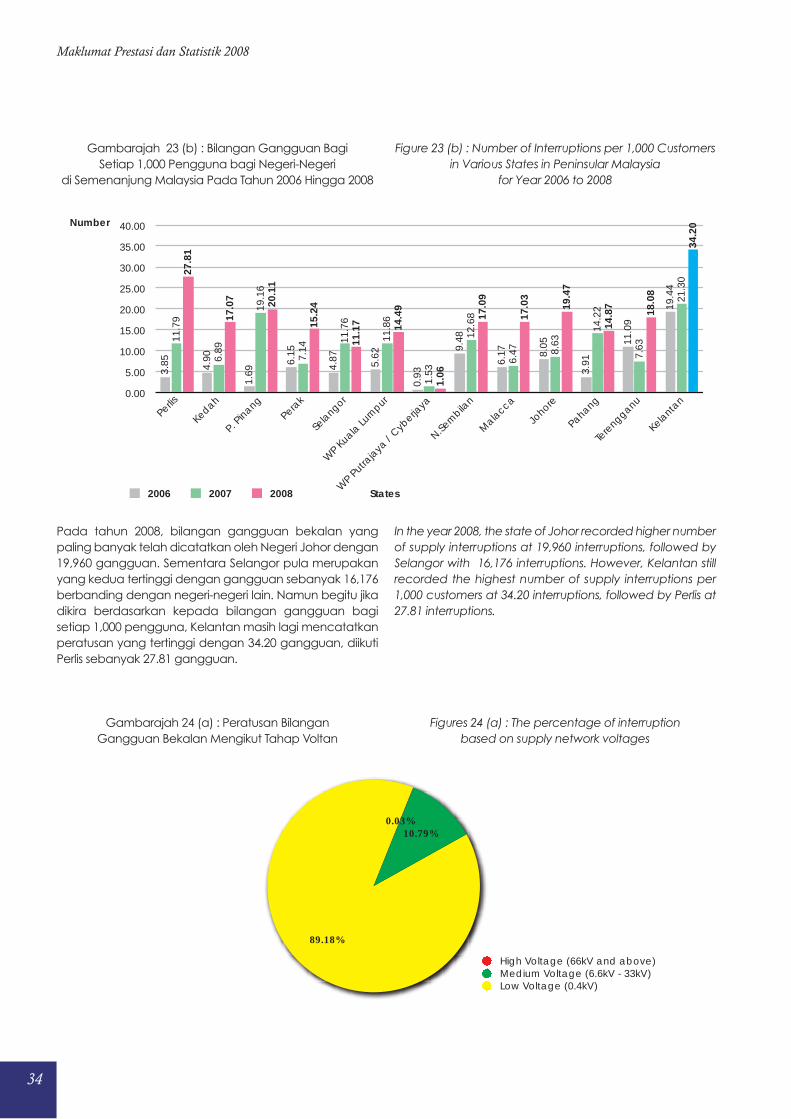
Gambarajah 23 (b) : Bilangan Gangguan Bagi
Setiap 1,000 Pengguna bagi Negeri-Negeri
di Semenanjung Malaysia Pada Tahun 2006 Hingga 2008
Pada tahun 2008, bilangan gangguan bekalan yang
paling banyak telah dicatatkan oleh Negeri Johor dengan
19,960 gangguan. Sementara Selangor pula merupakan
yang kedua tertinggi dengan gangguan sebanyak 16,176
berbanding dengan negeri-negeri lain. Namun begitu jika
dikira berdasarkan kepada bilangan gangguan bagi
setiap 1,000 pengguna, Kelantan masih lagi mencatatkan
peratusan yang tertinggi dengan 34.20 gangguan, diikuti
Perlis sebanyak 27.81 gangguan.
Gambarajah 24 (a) : Peratusan Bilangan
Gangguan Bekalan Mengikut Tahap Voltan
Figure 23 (b) : Number of Interruptions per 1,000 Customers
in Various States in Peninsular Malaysia
for Year 2006 to 2008
In the year 2008, the state of Johor recorded higher number
of supply interruptions at 19,960 interruptions, followed by
Selangor with 16,176 interruptions. However, Kelantan still
recorded the highest number of supply interruptions per
1,000 customers at 34.20 interruptions, followed by Perlis at
27.81 interruptions.
Figures 24 (a) : The percentage of interruption
based on supply network voltages
0.00
5.00
10.00
15.00
20.00
25.00
30.00
35.00
40.00
34.2
0
18.0
8
14.8
719.4
7
17.0
3
17.0
9
1.06
14.4
9
11.1
715.2
420.1
1
17.0
7
27.8
1
21.3
0
7.63
14.2
2
8.63
6.47
12.6
8
1.53
11.8
6
11.7
6
7.14
19.1
6
6.89
11.7
9
19.4
4
11.0
9
3.91
8.05
6.179.
48
0.93
5.62
4.876.15
1.69
4.90
3.85
2006 2007 2008
Number
Perlis
Kedah
P. Pinang
Perak
Sela
ngor
WP K
uala Lu
mpur
WP P
utraja
ya /
Cyberja
ya
N.Sem
bilan
Mala
cca
Pahang
Kelanta
n
Johore
Tere
ngganu
States
89.18%
10.79%0.03%
High Voltage (66kV and above)Medium Voltage (6.6kV - 33kV)Low Voltage (0.4kV)
35
Performance and Statistical Information 2008
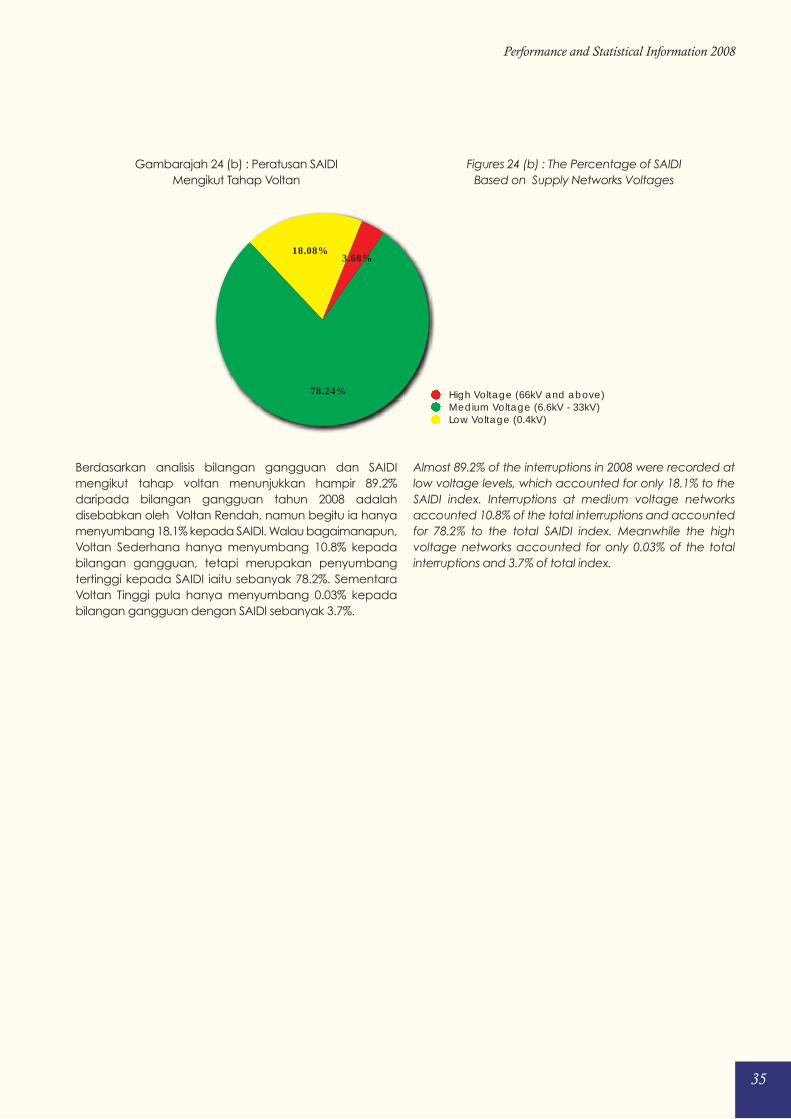
Gambarajah 24 (b) : Peratusan SAIDI
Mengikut Tahap Voltan
Berdasarkan analisis bilangan gangguan dan SAIDI
mengikut tahap voltan menunjukkan hampir 89.2%
daripada bilangan gangguan tahun 2008 adalah
disebabkan oleh Voltan Rendah, namun begitu ia hanya
menyumbang 18.1% kepada SAIDI. Walau bagaimanapun,
Voltan Sederhana hanya menyumbang 10.8% kepada
bilangan gangguan, tetapi merupakan penyumbang
tertinggi kepada SAIDI iaitu sebanyak 78.2%. Sementara
Voltan Tinggi pula hanya menyumbang 0.03% kepada
bilangan gangguan dengan SAIDI sebanyak 3.7%.
Figures 24 (b) : The Percentage of SAIDI
Based on Supply Networks Voltages
Almost 89.2% of the interruptions in 2008 were recorded at
low voltage levels, which accounted for only 18.1% to the
SAIDI index. Interruptions at medium voltage networks
accounted 10.8% of the total interruptions and accounted
for 78.2% to the total SAIDI index. Meanwhile the high
voltage networks accounted for only 0.03% of the total
interruptions and 3.7% of total index.
18.08%
78.24%
3.68%
High Voltage (66kV and above)Medium Voltage (6.6kV - 33kV)Low Voltage (0.4kV)
36
Maklumat Prestasi dan Statistik 2008
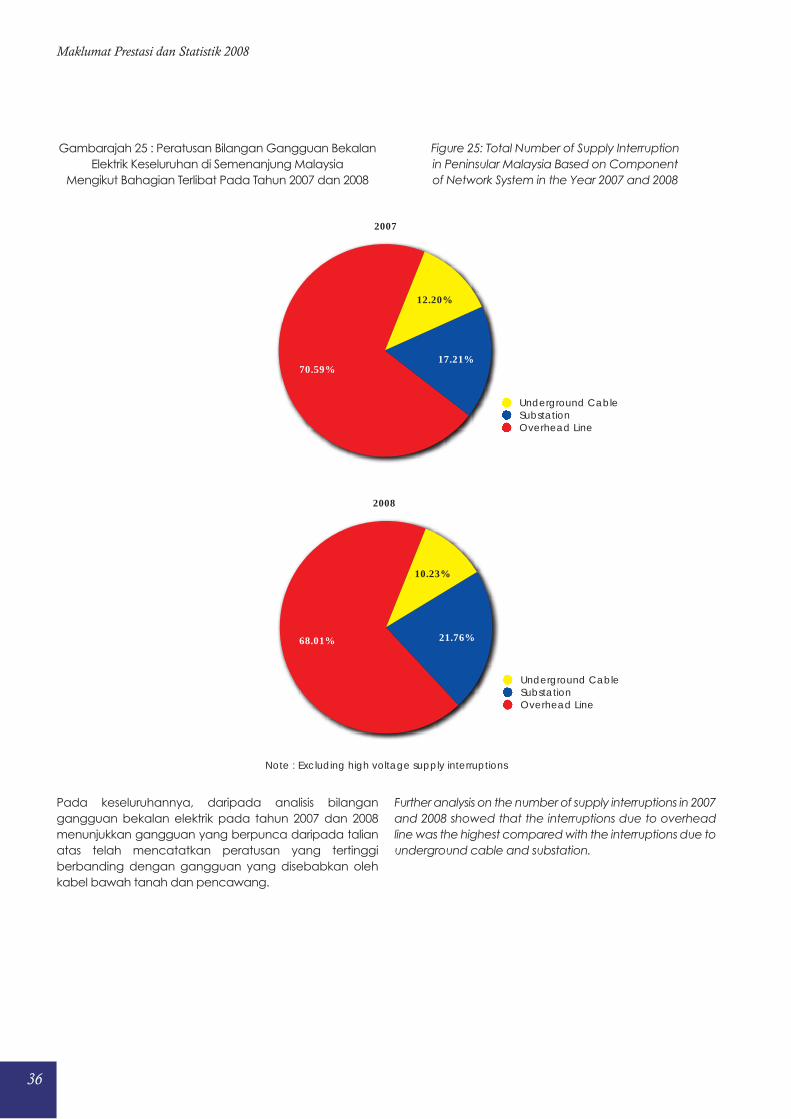
Gambarajah 25 : Peratusan Bilangan Gangguan Bekalan
Elektrik Keseluruhan di Semenanjung Malaysia
Mengikut Bahagian Terlibat Pada Tahun 2007 dan 2008
Pada keseluruhannya, daripada analisis bilangan
gangguan bekalan elektrik pada tahun 2007 dan 2008
menunjukkan gangguan yang berpunca daripada talian
atas telah mencatatkan peratusan yang tertinggi
berbanding dengan gangguan yang disebabkan oleh
kabel bawah tanah dan pencawang.
Figure 25: Total Number of Supply Interruption
in Peninsular Malaysia Based on Component
of Network System in the Year 2007 and 2008
Further analysis on the number of supply interruptions in 2007
and 2008 showed that the interruptions due to overhead
line was the highest compared with the interruptions due to
underground cable and substation.
70.59%17.21%
12.20%
2007
Underground CableSubstationOverhead Line
68.01% 21.76%
10.23%
2008
Underground CableSubstationOverhead Line
Note : Excluding high voltage supply interruptions
37
Performance and Statistical Information 2008
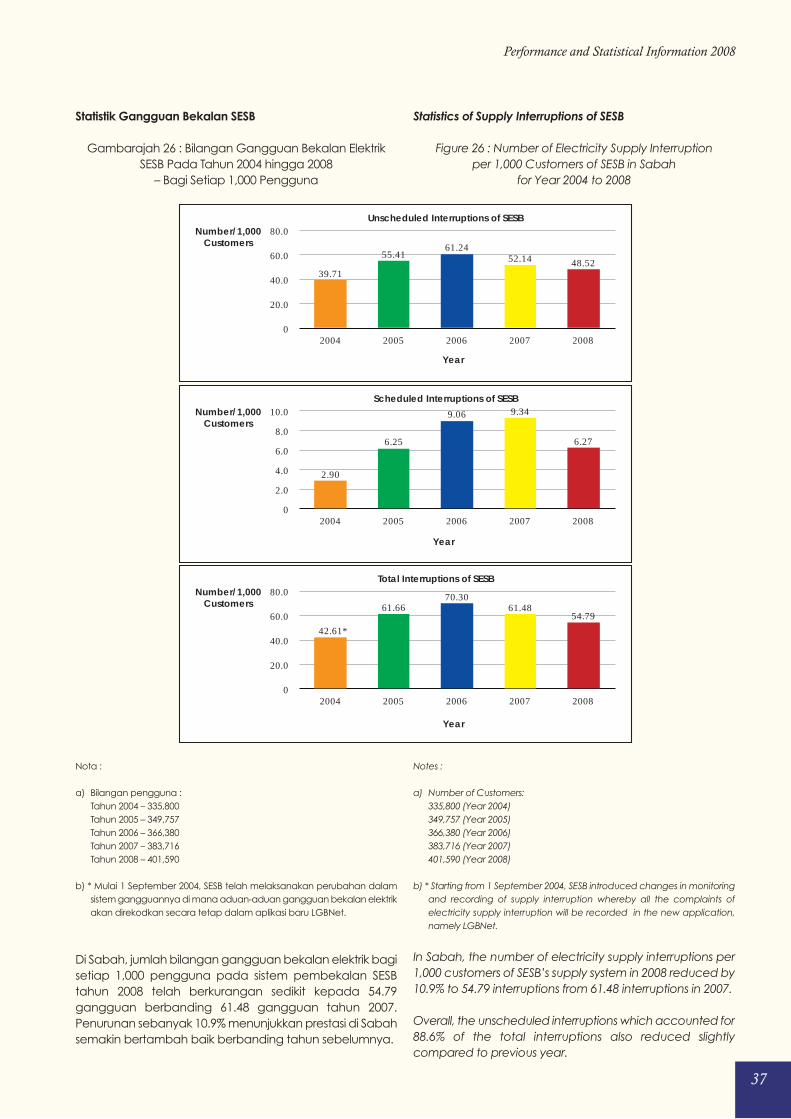
Statistik Gangguan Bekalan SESB
Gambarajah 26 : Bilangan Gangguan Bekalan Elektrik
SESB Pada Tahun 2004 hingga 2008
– Bagi Setiap 1,000 Pengguna
Nota :
a) Bilangan pengguna :
Tahun 2004 – 335,800
Tahun 2005 – 349,757
Tahun 2006 – 366,380
Tahun 2007 – 383,716
Tahun 2008 – 401,590
b) * Mulai 1 September 2004, SESB telah melaksanakan perubahan dalam
sistem gangguannya di mana aduan-aduan gangguan bekalan elektrik
akan direkodkan secara tetap dalam aplikasi baru LGBNet.
Di Sabah, jumlah bilangan gangguan bekalan elektrik bagi
setiap 1,000 pengguna pada sistem pembekalan SESB
tahun 2008 telah berkurangan sedikit kepada 54.79
gangguan berbanding 61.48 gangguan tahun 2007.
Penurunan sebanyak 10.9% menunjukkan prestasi di Sabah
semakin bertambah baik berbanding tahun sebelumnya.
Statistics of Supply Interruptions of SESB
Figure 26 : Number of Electricity Supply Interruption
per 1,000 Customers of SESB in Sabah
for Year 2004 to 2008
Notes :
a) Number of Customers:
335,800 (Year 2004)
349,757 (Year 2005)
366,380 (Year 2006)
383,716 (Year 2007)
401,590 (Year 2008)
b) * Starting from 1 September 2004, SESB introduced changes in monitoring
and recording of supply interruption whereby all the complaints of
electricity supply interruption will be recorded in the new application,
namely LGBNet.
In Sabah, the number of electricity supply interruptions per
1,000 customers of SESB’s supply system in 2008 reduced by
10.9% to 54.79 interruptions from 61.48 interruptions in 2007.
Overall, the unscheduled interruptions which accounted for
88.6% of the total interruptions also reduced slightly
compared to previous year.
0
20.0
40.0
60.0
80.0
2004 2005 2006 2007 2008
48.5252.1461.24
55.41
39.71
Year
Number/1,000Customers
Unscheduled Interruptions of SESB
0
2.0
4.0
6.0
8.0
10.0
Year
Number/1,000Customers
2004 2005 2006 2007 2008
6.27
9.349.06
6.25
2.90
Scheduled Interruptions of SESB
0
20.0
40.0
60.0
80.0
2004 2005 2006 2007 2008
54.7961.48
70.3061.66
42.61*
Year
Number/1,000Customers
Total Interruptions of SESB
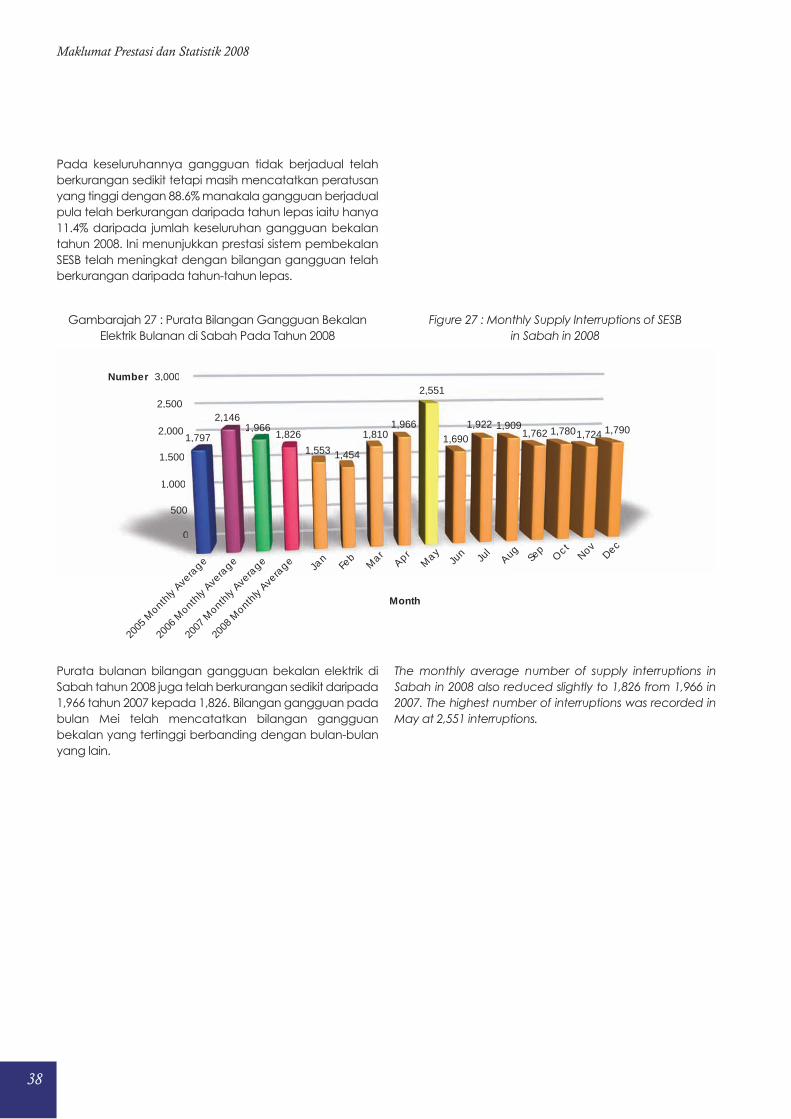
38
Maklumat Prestasi dan Statistik 2008
Pada keseluruhannya gangguan tidak berjadual telah
berkurangan sedikit tetapi masih mencatatkan peratusan
yang tinggi dengan 88.6% manakala gangguan berjadual
pula telah berkurangan daripada tahun lepas iaitu hanya
11.4% daripada jumlah keseluruhan gangguan bekalan
tahun 2008. Ini menunjukkan prestasi sistem pembekalan
SESB telah meningkat dengan bilangan gangguan telah
berkurangan daripada tahun-tahun lepas.
Gambarajah 27 : Purata Bilangan Gangguan Bekalan
Elektrik Bulanan di Sabah Pada Tahun 2008
Purata bulanan bilangan gangguan bekalan elektrik di
Sabah tahun 2008 juga telah berkurangan sedikit daripada
1,966 tahun 2007 kepada 1,826. Bilangan gangguan pada
bulan Mei telah mencatatkan bilangan gangguan
bekalan yang tertinggi berbanding dengan bulan-bulan
yang lain.
Figure 27 : Monthly Supply Interruptions of SESB
in Sabah in 2008
The monthly average number of supply interruptions in
Sabah in 2008 also reduced slightly to 1,826 from 1,966 in
2007. The highest number of interruptions was recorded in
May at 2,551 interruptions.
0
500
1,000
1,500
2,000
2,500
3,000
0
500
1,000
1,500
2,000
2,500
3,000
1,797
2,1461,966
1,826
1,553 1,454
1,8101,966
2,551
1,6901,922 1,909
1,762 1,7801,724 1,790
2005
Month
ly Ave
rage
2006
Month
ly Ave
rage
2007
Month
ly Ave
rage
2008
Month
ly Ave
rage Ja
nFe
bM
arApr
May
Jun Ju
lAug
Sep
Oct
NovDec
Month
Number
1
0
1,797,966
,
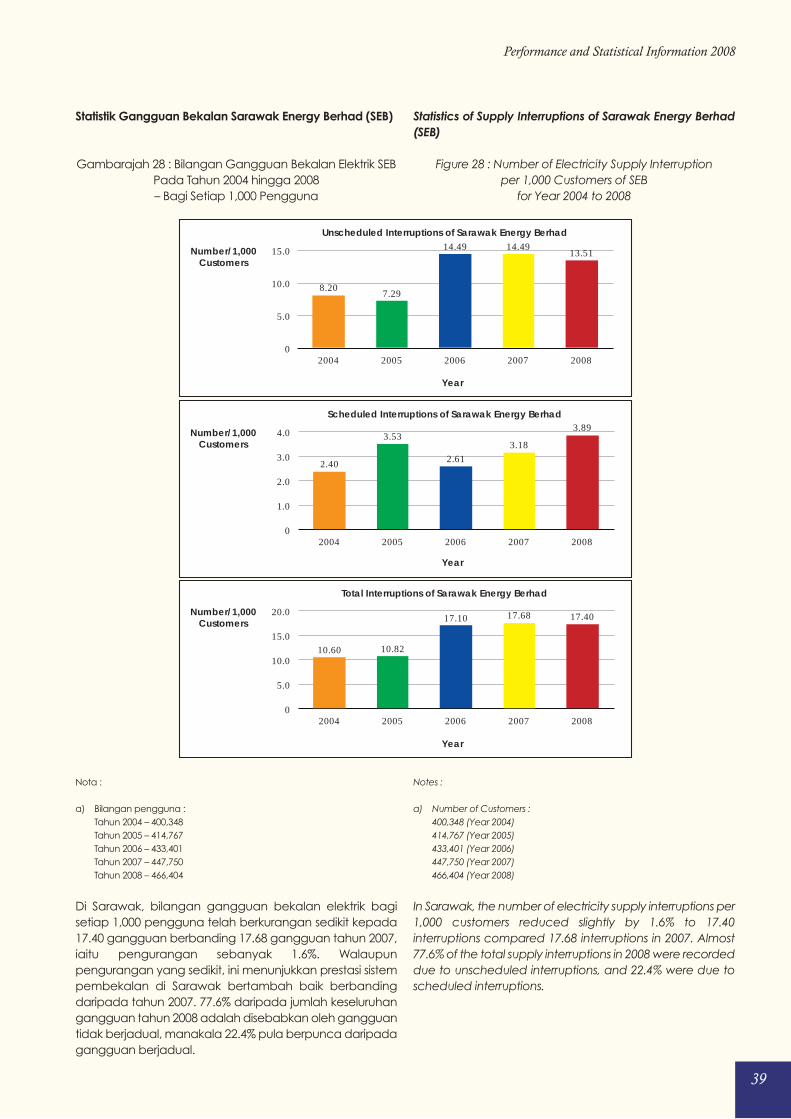
39
Performance and Statistical Information 2008
Statistik Gangguan Bekalan Sarawak Energy Berhad (SEB)
Gambarajah 28 : Bilangan Gangguan Bekalan Elektrik SEB
Pada Tahun 2004 hingga 2008
– Bagi Setiap 1,000 Pengguna
Nota :
a) Bilangan pengguna :
Tahun 2004 – 400,348
Tahun 2005 – 414,767
Tahun 2006 – 433,401
Tahun 2007 – 447,750
Tahun 2008 – 466,404
Di Sarawak, bilangan gangguan bekalan elektrik bagi
setiap 1,000 pengguna telah berkurangan sedikit kepada
17.40 gangguan berbanding 17.68 gangguan tahun 2007,
iaitu pengurangan sebanyak 1.6%. Walaupun
pengurangan yang sedikit, ini menunjukkan prestasi sistem
pembekalan di Sarawak bertambah baik berbanding
daripada tahun 2007. 77.6% daripada jumlah keseluruhan
gangguan tahun 2008 adalah disebabkan oleh gangguan
tidak berjadual, manakala 22.4% pula berpunca daripada
gangguan berjadual.
Statistics of Supply Interruptions of Sarawak Energy Berhad
(SEB)
Figure 28 : Number of Electricity Supply Interruption
per 1,000 Customers of SEB
for Year 2004 to 2008
Notes :
a) Number of Customers :
400,348 (Year 2004)
414,767 (Year 2005)
433,401 (Year 2006)
447,750 (Year 2007)
466,404 (Year 2008)
In Sarawak, the number of electricity supply interruptions per
1,000 customers reduced slightly by 1.6% to 17.40
interruptions compared 17.68 interruptions in 2007. Almost
77.6% of the total supply interruptions in 2008 were recorded
due to unscheduled interruptions, and 22.4% were due to
scheduled interruptions.
0
5.0
10.0
15.0
2004 2005 2006 2007 2008
13.5114.4914.49
7.298.20
Year
Number/1,000Customers
Unscheduled Interruptions of Sarawak Energy Berhad
Year
0
1.0
2.0
4.0
3.0
2004 2005 2006 2007 2008
3.89
3.182.61
3.53
2.40
Number/1,000Customers
Scheduled Interruptions of Sarawak Energy Berhad
Year
0
5.0
10.0
15.0
20.0
2004 2005 2006 2007 2008
17.4017.6817.10
10.8210.60
Number/1,000Customers
Total Interruptions of Sarawak Energy Berhad
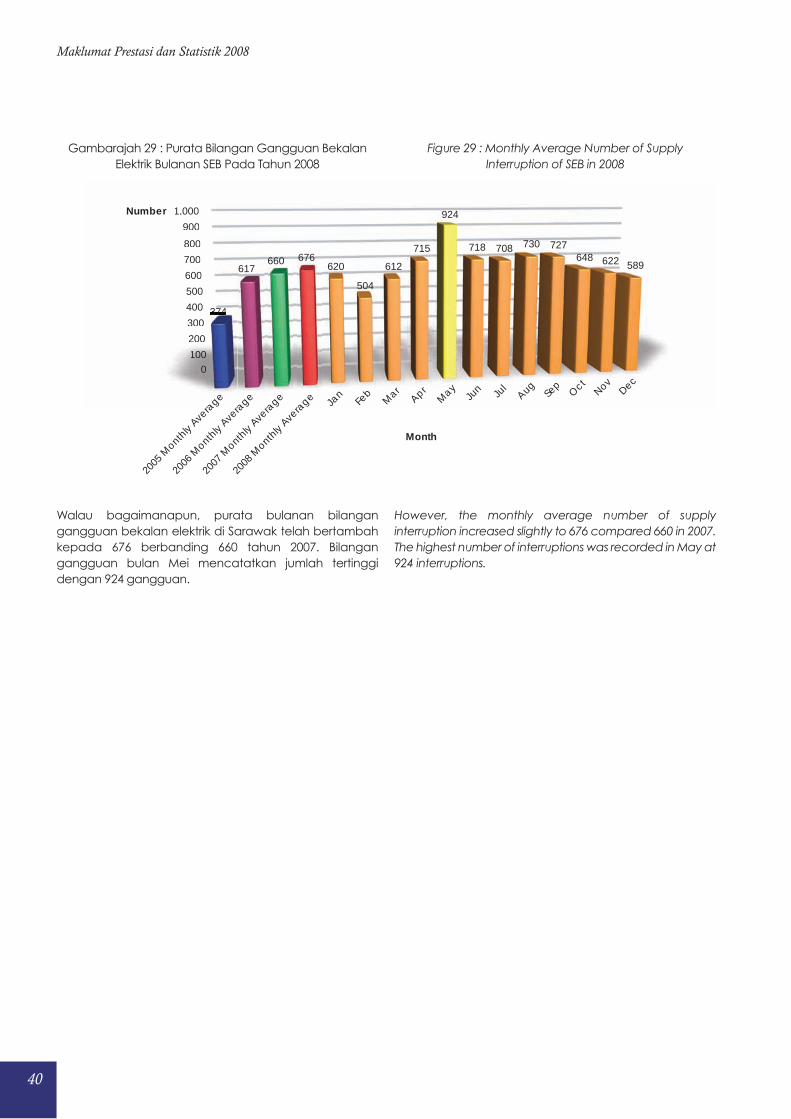
40
Maklumat Prestasi dan Statistik 2008
Gambarajah 29 : Purata Bilangan Gangguan Bekalan
Elektrik Bulanan SEB Pada Tahun 2008
Walau bagaimanapun, purata bulanan bilangan
gangguan bekalan elektrik di Sarawak telah bertambah
kepada 676 berbanding 660 tahun 2007. Bilangan
gangguan bulan Mei mencatatkan jumlah tertinggi
dengan 924 gangguan.
Figure 29 : Monthly Average Number of Supply
Interruption of SEB in 2008
However, the monthly average number of supply
interruption increased slightly to 676 compared 660 in 2007.
The highest number of interruptions was recorded in May at
924 interruptions.
0100
200
300
400
500
600
700
800
900
1,000
0100
200
300
400
500
600
700
800
900
1,000
374
617660 676
620
504
612
715
924
718 708 730 727648 622 589
2005
Month
ly Ave
rage
2006
Month
ly Ave
rage
2007
Month
ly Ave
rage
2008
Month
ly Ave
rage Ja
nFe
bM
arApr
May
Jun Ju
lAug
Sep
Oct
NovDec
Month
Number
676660
374
6 7
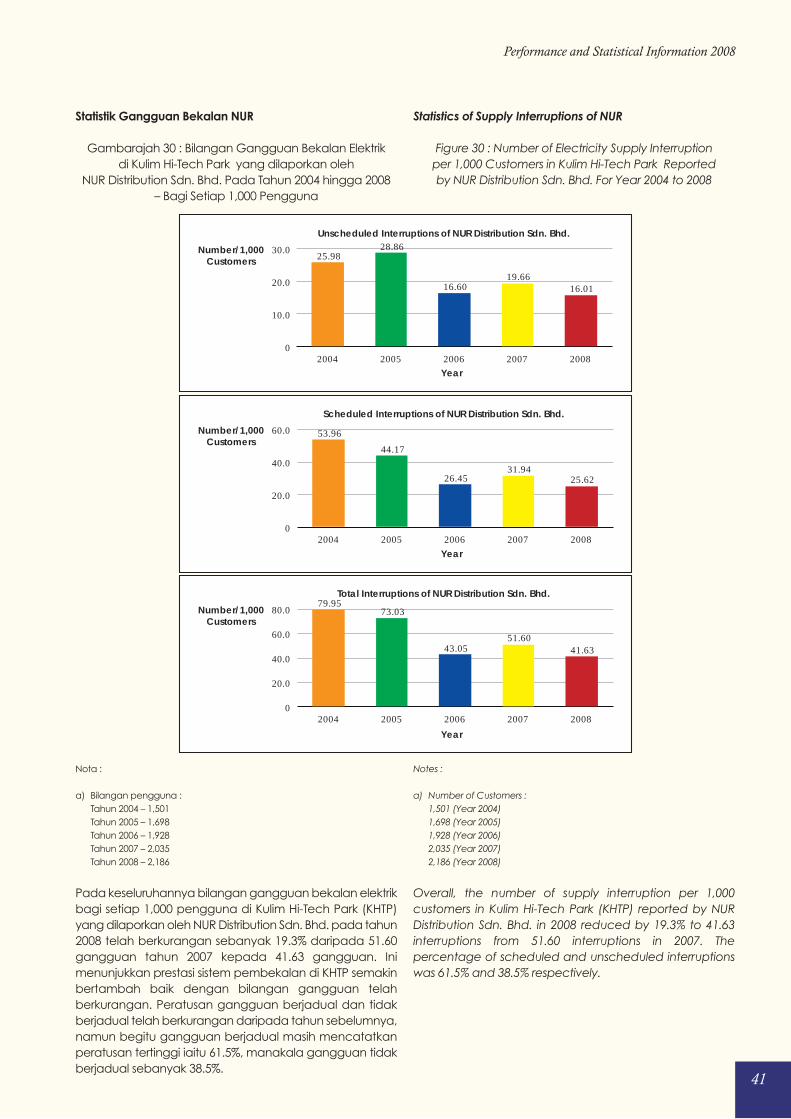
41
Performance and Statistical Information 2008
Statistik Gangguan Bekalan NUR
Gambarajah 30 : Bilangan Gangguan Bekalan Elektrik
di Kulim Hi-Tech Park yang dilaporkan oleh
NUR Distribution Sdn. Bhd. Pada Tahun 2004 hingga 2008
– Bagi Setiap 1,000 Pengguna
Nota :
a) Bilangan pengguna :
Tahun 2004 – 1,501
Tahun 2005 – 1,698
Tahun 2006 – 1,928
Tahun 2007 – 2,035
Tahun 2008 – 2,186
Pada keseluruhannya bilangan gangguan bekalan elektrik
bagi setiap 1,000 pengguna di Kulim Hi-Tech Park (KHTP)
yang dilaporkan oleh NUR Distribution Sdn. Bhd. pada tahun
2008 telah berkurangan sebanyak 19.3% daripada 51.60
gangguan tahun 2007 kepada 41.63 gangguan. Ini
menunjukkan prestasi sistem pembekalan di KHTP semakin
bertambah baik dengan bilangan gangguan telah
berkurangan. Peratusan gangguan berjadual dan tidak
berjadual telah berkurangan daripada tahun sebelumnya,
namun begitu gangguan berjadual masih mencatatkan
peratusan tertinggi iaitu 61.5%, manakala gangguan tidak
berjadual sebanyak 38.5%.
Statistics of Supply Interruptions of NUR
Figure 30 : Number of Electricity Supply Interruption
per 1,000 Customers in Kulim Hi-Tech Park Reported
by NUR Distribution Sdn. Bhd. For Year 2004 to 2008
Notes :
a) Number of Customers :
1,501 (Year 2004)
1,698 (Year 2005)
1,928 (Year 2006)
2,035 (Year 2007)
2,186 (Year 2008)
Overall, the number of supply interruption per 1,000
customers in Kulim Hi-Tech Park (KHTP) reported by NUR
Distribution Sdn. Bhd. in 2008 reduced by 19.3% to 41.63
interruptions from 51.60 interruptions in 2007. The
percentage of scheduled and unscheduled interruptions
was 61.5% and 38.5% respectively.
0
10.0
20.0
30.0
2004 2005 2006 2007 2008
16.0119.66
16.60
28.8625.98
Year
Number/1,000Customers
Unscheduled Interruptions of NUR Distribution Sdn. Bhd.
0
20.0
40.0
60.0
2004 2005 2006 2007 2008
25.6231.94
26.45
44.17
53.96
Year
Number/1,000Customers
Scheduled Interruptions of NUR Distribution Sdn. Bhd.
0
20.0
40.0
60.0
80.0
2004 2005 2006 2007 2008
41.6351.60
43.05
73.0379.95
Year
Number/1,000Customers
Total Interruptions of NUR Distribution Sdn. Bhd.
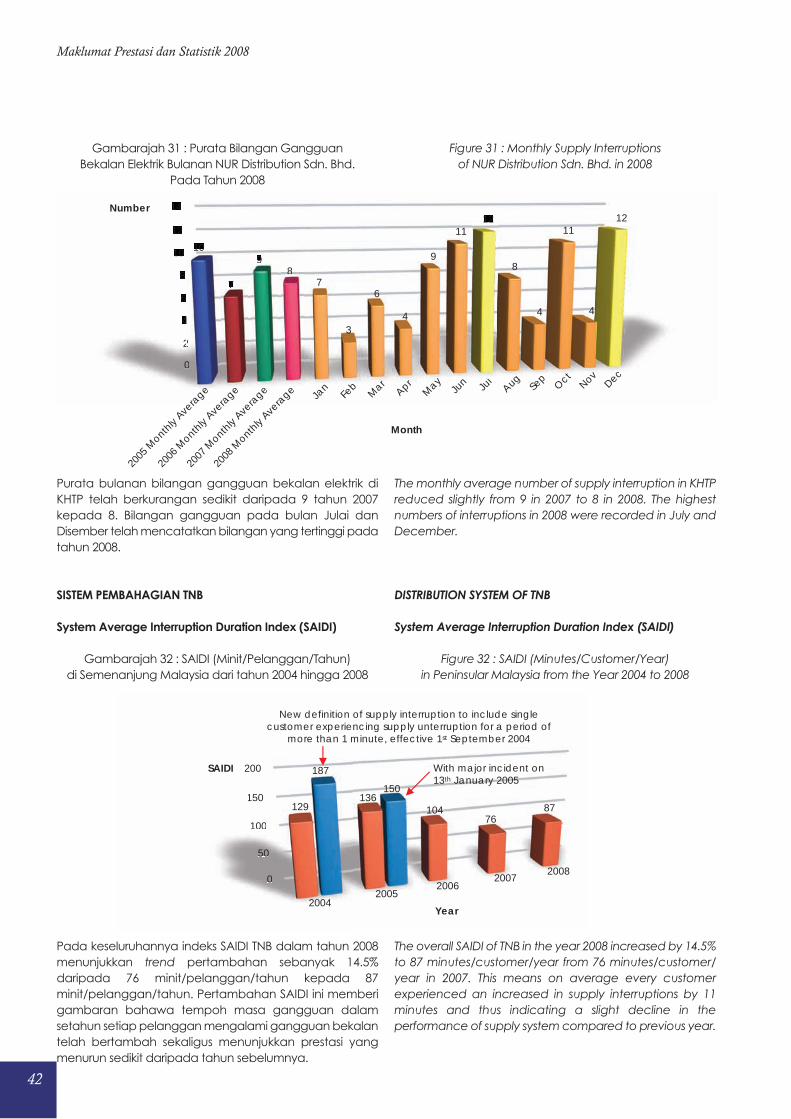
42
Maklumat Prestasi dan Statistik 2008
Gambarajah 31 : Purata Bilangan Gangguan
Bekalan Elektrik Bulanan NUR Distribution Sdn. Bhd.
Pada Tahun 2008
Purata bulanan bilangan gangguan bekalan elektrik di
KHTP telah berkurangan sedikit daripada 9 tahun 2007
kepada 8. Bilangan gangguan pada bulan Julai dan
Disember telah mencatatkan bilangan yang tertinggi pada
tahun 2008.
SISTEM PEMBAHAGIAN TNB
System Average Interruption Duration Index (SAIDI)
Gambarajah 32 : SAIDI (Minit/Pelanggan/Tahun)
di Semenanjung Malaysia dari tahun 2004 hingga 2008
Pada keseluruhannya indeks SAIDI TNB dalam tahun 2008
menunjukkan trend pertambahan sebanyak 14.5%
daripada 76 minit/pelanggan/tahun kepada 87
minit/pelanggan/tahun. Pertambahan SAIDI ini memberi
gambaran bahawa tempoh masa gangguan dalam
setahun setiap pelanggan mengalami gangguan bekalan
telah bertambah sekaligus menunjukkan prestasi yang
menurun sedikit daripada tahun sebelumnya.
Figure 31 : Monthly Supply Interruptions
of NUR Distribution Sdn. Bhd. in 2008
The monthly average number of supply interruption in KHTP
reduced slightly from 9 in 2007 to 8 in 2008. The highest
numbers of interruptions in 2008 were recorded in July and
December.
DISTRIBUTION SYSTEM OF TNB
System Average Interruption Duration Index (SAIDI)
Figure 32 : SAIDI (Minutes/Customer/Year)
in Peninsular Malaysia from the Year 2004 to 2008
The overall SAIDI of TNB in the year 2008 increased by 14.5%
to 87 minutes/customer/year from 76 minutes/customer/
year in 2007. This means on average every customer
experienced an increased in supply interruptions by 11
minutes and thus indicating a slight decline in the
performance of supply system compared to previous year.
0
2
4
6
8
10
12
14
0
2
4
6
8
10
12
14
10
7
98
7
3
6
4
9
1112
8
4
11
4
12Number
2005
Month
ly Ave
rage
2006
Month
ly Ave
rage
2007
Month
ly Ave
rage
2008
Month
ly Ave
rage Ja
nFe
bM
arApr
May
Jun Ju
lAug
Sep
Oct
NovDec
Month
9
7
0
2
4
10
8
l
0
50
100
150
200
0
50
100
150
200
129136
10476
87
187
150
20042005
20062007
2008
Year
SAIDI
New definition of supply interruption to include singlecustomer experiencing supply unterruption for a period of
more than 1 minute, effective 1st September 2004
With major incident on13th January 2005
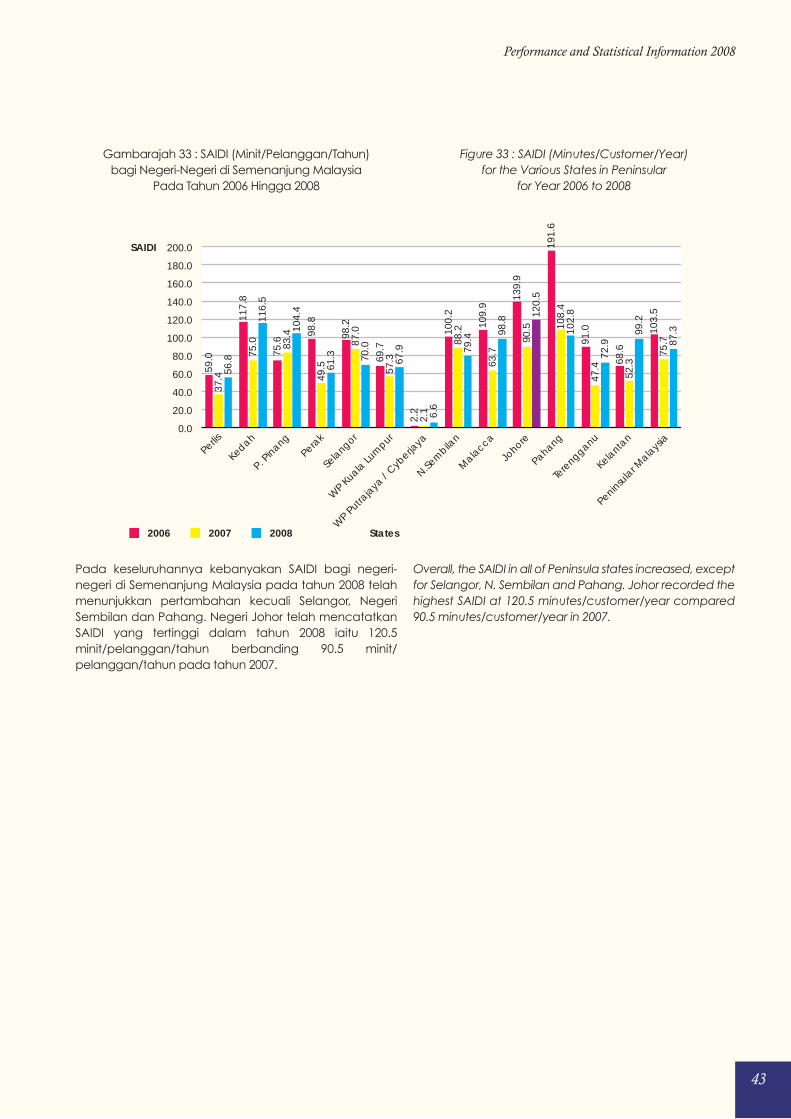
43
Performance and Statistical Information 2008
Gambarajah 33 : SAIDI (Minit/Pelanggan/Tahun)
bagi Negeri-Negeri di Semenanjung Malaysia
Pada Tahun 2006 Hingga 2008
Pada keseluruhannya kebanyakan SAIDI bagi negeri-
negeri di Semenanjung Malaysia pada tahun 2008 telah
menunjukkan pertambahan kecuali Selangor, Negeri
Sembilan dan Pahang. Negeri Johor telah mencatatkan
SAIDI yang tertinggi dalam tahun 2008 iaitu 120.5
minit/pelanggan/tahun berbanding 90.5 minit/
pelanggan/tahun pada tahun 2007.
Figure 33 : SAIDI (Minutes/Customer/Year)
for the Various States in Peninsular
for Year 2006 to 2008
Overall, the SAIDI in all of Peninsula states increased, except
for Selangor, N. Sembilan and Pahang. Johor recorded the
highest SAIDI at 120.5 minutes/customer/year compared
90.5 minutes/customer/year in 2007.
0.0
20.0
40.0
60.0
80.0
100.0
120.0
140.0
160.0
180.0
200.0
87.399
.2
72.9
102.
8120.
5
98.8
79.4
6.6
67.9
70.0
61.3
104.
4
116.
5
56.8
75.7
52.3
47.4
108.
4
90.5
63.7
88.2
2.1
57.3
87.0
49.5
83.4
75.0
37.4
103.
5
68.6
91.0
191.
6
139.
9
109.
9
100.
2
2.2
69.7
98.2
98.8
75.6
117.
8
59.0
2006 2007 2008
SAIDI
Perlis
Kedah
P. Pinang
Perak
Sela
ngor
WP K
uala Lu
mpur
WP P
utraja
ya /
Cyberja
ya
N.Sem
bilan
Mala
cca
Pahang
Kelanta
n
Peninsula
r Mala
ysia
Johore
Tere
ngganu
States
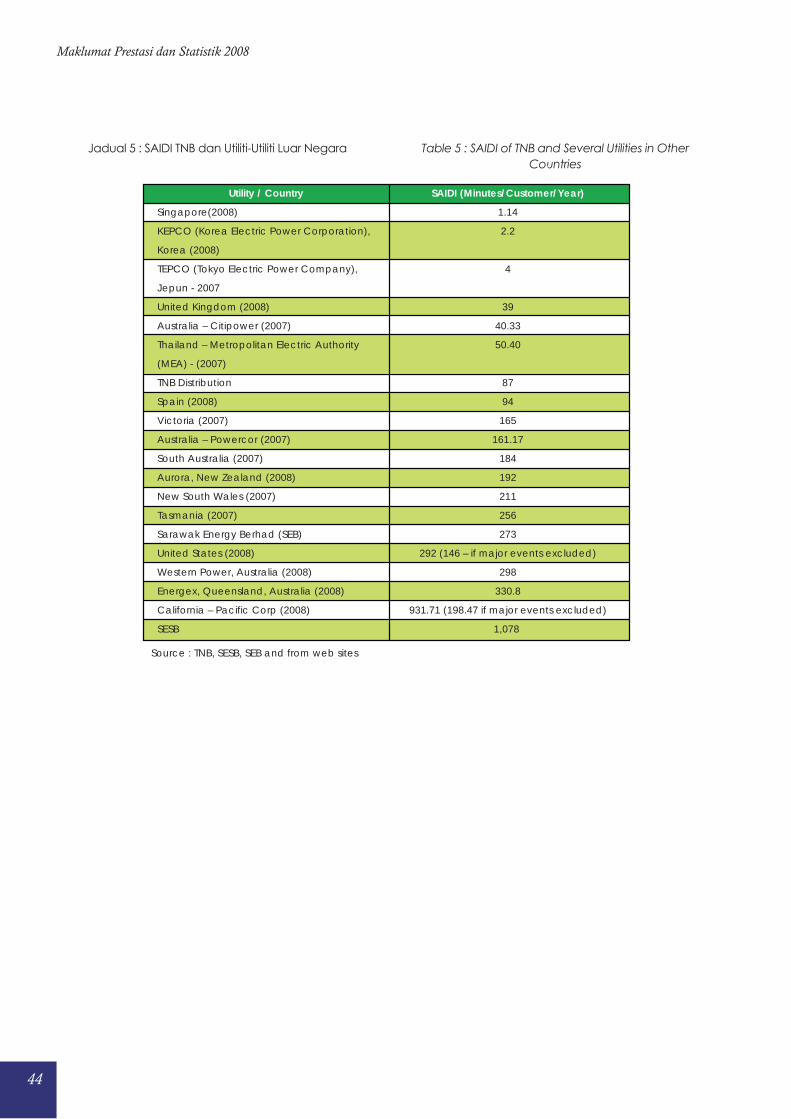
Jadual 5 : SAIDI TNB dan Utiliti-Utiliti Luar Negara Table 5 : SAIDI of TNB and Several Utilities in Other
Countries
44
Maklumat Prestasi dan Statistik 2008
Source : TNB, SESB, SEB and from web sites
Utility / Country
Singapore(2008)
KEPCO (Korea Electric Power Corporation),
Korea (2008)
TEPCO (Tokyo Electric Power Company),
Jepun - 2007
United Kingdom (2008)
Australia – Citipower (2007)
Thailand – Metropolitan Electric Authority
(MEA) - (2007)
TNB Distribution
Spain (2008)
Victoria (2007)
Australia – Powercor (2007)
South Australia (2007)
Aurora, New Zealand (2008)
New South Wales (2007)
Tasmania (2007)
Sarawak Energy Berhad (SEB)
United States (2008)
Western Power, Australia (2008)
Energex, Queensland, Australia (2008)
California – Pacific Corp (2008)
SESB
SAIDI (Minutes/Customer/Year)
1.14
2.2
4
39
40.33
50.40
87
94
165
161.17
184
192
211
256
273
292 (146 – if major events excluded)
298
330.8
931.71 (198.47 if major events excluded)
1,078
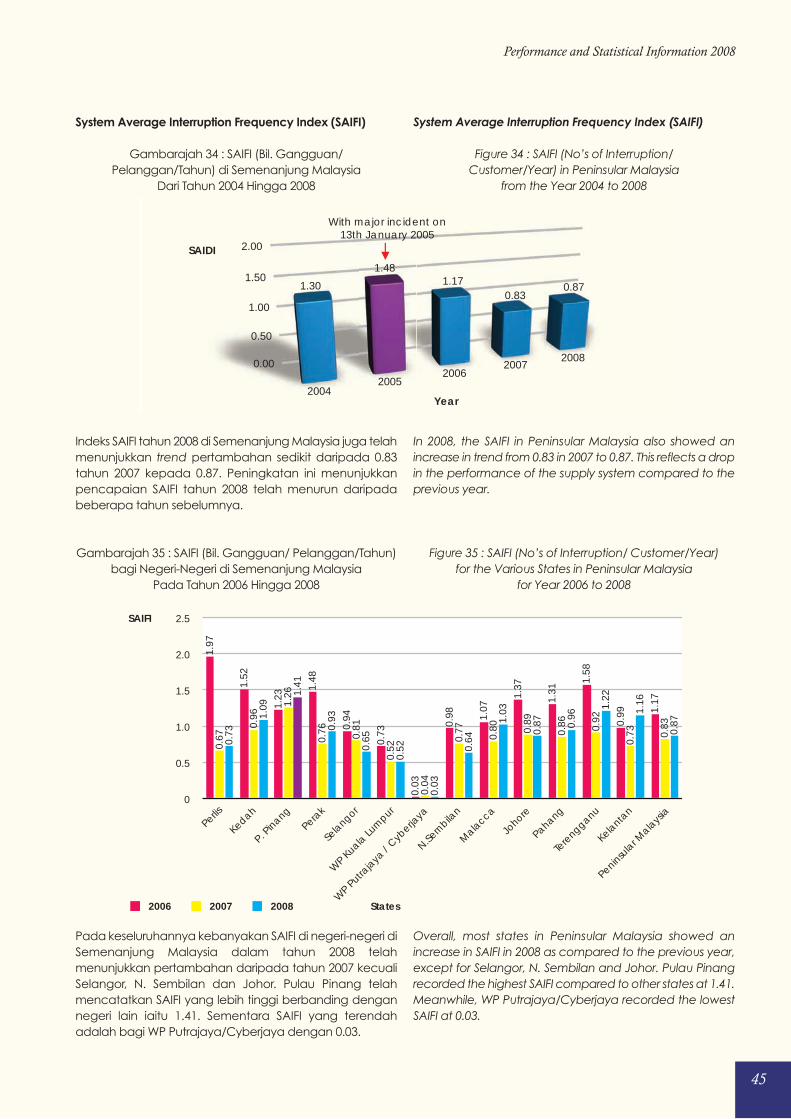
45
Performance and Statistical Information 2008
System Average Interruption Frequency Index (SAIFI)
Gambarajah 34 : SAIFI (Bil. Gangguan/
Pelanggan/Tahun) di Semenanjung Malaysia
Dari Tahun 2004 Hingga 2008
Indeks SAIFI tahun 2008 di Semenanjung Malaysia juga telah
menunjukkan trend pertambahan sedikit daripada 0.83
tahun 2007 kepada 0.87. Peningkatan ini menunjukkan
pencapaian SAIFI tahun 2008 telah menurun daripada
beberapa tahun sebelumnya.
Gambarajah 35 : SAIFI (Bil. Gangguan/ Pelanggan/Tahun)
bagi Negeri-Negeri di Semenanjung Malaysia
Pada Tahun 2006 Hingga 2008
Pada keseluruhannya kebanyakan SAIFI di negeri-negeri di
Semenanjung Malaysia dalam tahun 2008 telah
menunjukkan pertambahan daripada tahun 2007 kecuali
Selangor, N. Sembilan dan Johor. Pulau Pinang telah
mencatatkan SAIFI yang lebih tinggi berbanding dengan
negeri lain iaitu 1.41. Sementara SAIFI yang terendah
adalah bagi WP Putrajaya/Cyberjaya dengan 0.03.
System Average Interruption Frequency Index (SAIFI)
Figure 34 : SAIFI (No’s of Interruption/
Customer/Year) in Peninsular Malaysia
from the Year 2004 to 2008
In 2008, the SAIFI in Peninsular Malaysia also showed an
increase in trend from 0.83 in 2007 to 0.87. This reflects a drop
in the performance of the supply system compared to the
previous year.
Figure 35 : SAIFI (No’s of Interruption/ Customer/Year)
for the Various States in Peninsular Malaysia
for Year 2006 to 2008
Overall, most states in Peninsular Malaysia showed an
increase in SAIFI in 2008 as compared to the previous year,
except for Selangor, N. Sembilan and Johor. Pulau Pinang
recorded the highest SAIFI compared to other states at 1.41.
Meanwhile, WP Putrajaya/Cyberjaya recorded the lowest
SAIFI at 0.03.
0.00
0.50
1.00
1.50
2.00
1.30
1.481.17
0.830.87
20042005
20062007
2008
Year
SAIDI
With major incident on13th January 2005
0
0.5
1.0
1.5
2.0
2.5
0.87
1.161.22
0.96
0.871.
03
0.64
0.03
0.520.
65
0.93
1.41
1.09
0.73 0.
83
0.730.
92
0.86
0.89
0.80
0.77
0.04
0.52
0.81
0.76
1.26
0.96
0.67
1.17
0.99
1.58
1.311.37
1.07
0.98
0.03
0.73
0.94
1.48
1.23
1.52
1.97
2006 2007 2008
SAIFI
Perlis
Kedah
P. Pinang
Perak
Sela
ngor
WP K
uala Lu
mpur
WP P
utraja
ya /
Cyberja
ya
N.Sem
bilan
Mala
cca
Pahang
Kelanta
n
Peninsula
r Mala
ysia
Johore
Tere
ngganu
States
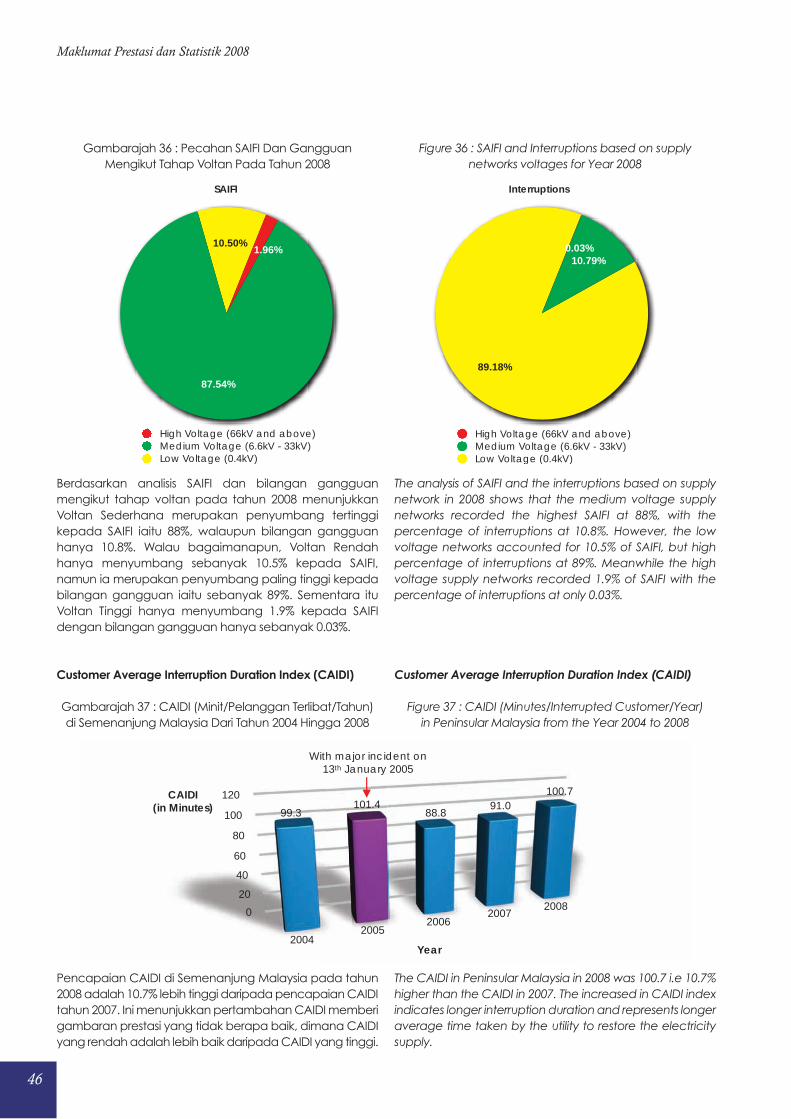
46
Maklumat Prestasi dan Statistik 2008
Gambarajah 36 : Pecahan SAIFI Dan Gangguan
Mengikut Tahap Voltan Pada Tahun 2008
Berdasarkan analisis SAIFI dan bilangan gangguan
mengikut tahap voltan pada tahun 2008 menunjukkan
Voltan Sederhana merupakan penyumbang tertinggi
kepada SAIFI iaitu 88%, walaupun bilangan gangguan
hanya 10.8%. Walau bagaimanapun, Voltan Rendah
hanya menyumbang sebanyak 10.5% kepada SAIFI,
namun ia merupakan penyumbang paling tinggi kepada
bilangan gangguan iaitu sebanyak 89%. Sementara itu
Voltan Tinggi hanya menyumbang 1.9% kepada SAIFI
dengan bilangan gangguan hanya sebanyak 0.03%.
Customer Average Interruption Duration Index (CAIDI)
Gambarajah 37 : CAIDI (Minit/Pelanggan Terlibat/Tahun)
di Semenanjung Malaysia Dari Tahun 2004 Hingga 2008
Pencapaian CAIDI di Semenanjung Malaysia pada tahun
2008 adalah 10.7% lebih tinggi daripada pencapaian CAIDI
tahun 2007. Ini menunjukkan pertambahan CAIDI memberi
gambaran prestasi yang tidak berapa baik, dimana CAIDI
yang rendah adalah lebih baik daripada CAIDI yang tinggi.
Figure 36 : SAIFI and Interruptions based on supply
networks voltages for Year 2008
The analysis of SAIFI and the interruptions based on supply
network in 2008 shows that the medium voltage supply
networks recorded the highest SAIFI at 88%, with the
percentage of interruptions at 10.8%. However, the low
voltage networks accounted for 10.5% of SAIFI, but high
percentage of interruptions at 89%. Meanwhile the high
voltage supply networks recorded 1.9% of SAIFI with the
percentage of interruptions at only 0.03%.
Customer Average Interruption Duration Index (CAIDI)
Figure 37 : CAIDI (Minutes/Interrupted Customer/Year)
in Peninsular Malaysia from the Year 2004 to 2008
The CAIDI in Peninsular Malaysia in 2008 was 100.7 i.e 10.7%
higher than the CAIDI in 2007. The increased in CAIDI index
indicates longer interruption duration and represents longer
average time taken by the utility to restore the electricity
supply.
10.50%
87.54%
1.96%
SAIFI
High Voltage (66kV and above)Medium Voltage (6.6kV - 33kV)Low Voltage (0.4kV)
89.18%
10.79%0.03%
Interruptions
High Voltage (66kV and above)Medium Voltage (6.6kV - 33kV)Low Voltage (0.4kV)
0
20
40
60
80
100
120
99.3101.4
88.891.0
100.7
20042005
20062007
2008
Year
CAIDI(in Minutes)
With major incident on13th January 2005
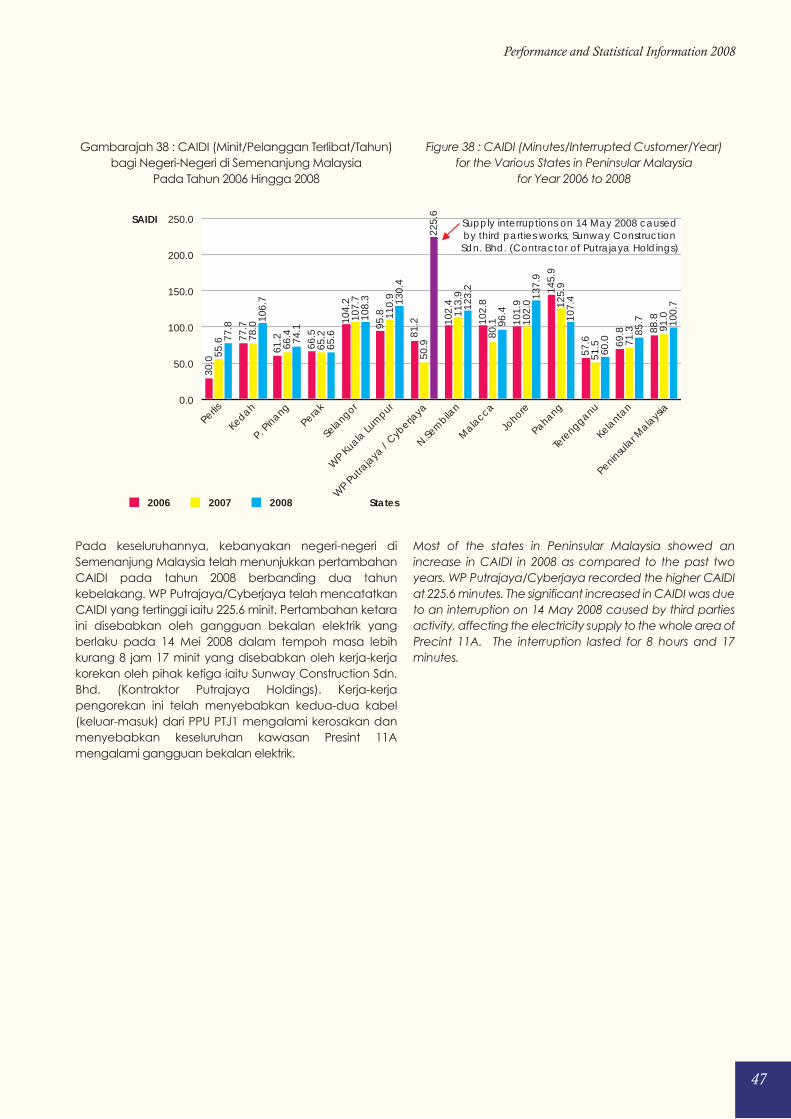
47
Performance and Statistical Information 2008
Gambarajah 38 : CAIDI (Minit/Pelanggan Terlibat/Tahun)
bagi Negeri-Negeri di Semenanjung Malaysia
Pada Tahun 2006 Hingga 2008
Pada keseluruhannya, kebanyakan negeri-negeri di
Semenanjung Malaysia telah menunjukkan pertambahan
CAIDI pada tahun 2008 berbanding dua tahun
kebelakang. WP Putrajaya/Cyberjaya telah mencatatkan
CAIDI yang tertinggi iaitu 225.6 minit. Pertambahan ketara
ini disebabkan oleh gangguan bekalan elektrik yang
berlaku pada 14 Mei 2008 dalam tempoh masa lebih
kurang 8 jam 17 minit yang disebabkan oleh kerja-kerja
korekan oleh pihak ketiga iaitu Sunway Construction Sdn.
Bhd. (Kontraktor Putrajaya Holdings). Kerja-kerja
pengorekan ini telah menyebabkan kedua-dua kabel
(keluar-masuk) dari PPU PTJ1 mengalami kerosakan dan
menyebabkan keseluruhan kawasan Presint 11A
mengalami gangguan bekalan elektrik.
Figure 38 : CAIDI (Minutes/Interrupted Customer/Year)
for the Various States in Peninsular Malaysia
for Year 2006 to 2008
Most of the states in Peninsular Malaysia showed an
increase in CAIDI in 2008 as compared to the past two
years. WP Putrajaya/Cyberjaya recorded the higher CAIDI
at 225.6 minutes. The significant increased in CAIDI was due
to an interruption on 14 May 2008 caused by third parties
activity, affecting the electricity supply to the whole area of
Precint 11A. The interruption lasted for 8 hours and 17
minutes.
0.0
50.0
100.0
150.0
200.0
250.0
100.
7
85.7
60.0
107.
4137.
9
96.412
3.2
225.
6
130.
4
108.
3
65.674
.1
106.
7
77.8 91
.0
71.3
51.5
125.
9
102.
0
80.1
113.
9
50.9
110.
9
107.
7
65.2
66.478
.0
55.6
88.8
69.8
57.6
145.
9
101.
9
102.
8
102.
4
81.295
.8104.
2
66.5
61.277
.7
30.0
2006 2007 2008
SAIDI Supply interruptions on 14 May 2008 causedby third parties works, Sunway ConstructionSdn. Bhd. (Contractor of Putrajaya Holdings)
Perlis
Kedah
P. Pinang
Perak
Sela
ngor
WP K
uala Lu
mpur
WP P
utraja
ya /
Cyberja
ya
N.Sem
bilan
Mala
cca
Pahang
Kelanta
n
Peninsula
r Mala
ysia
Johore
Tere
ngganu
States
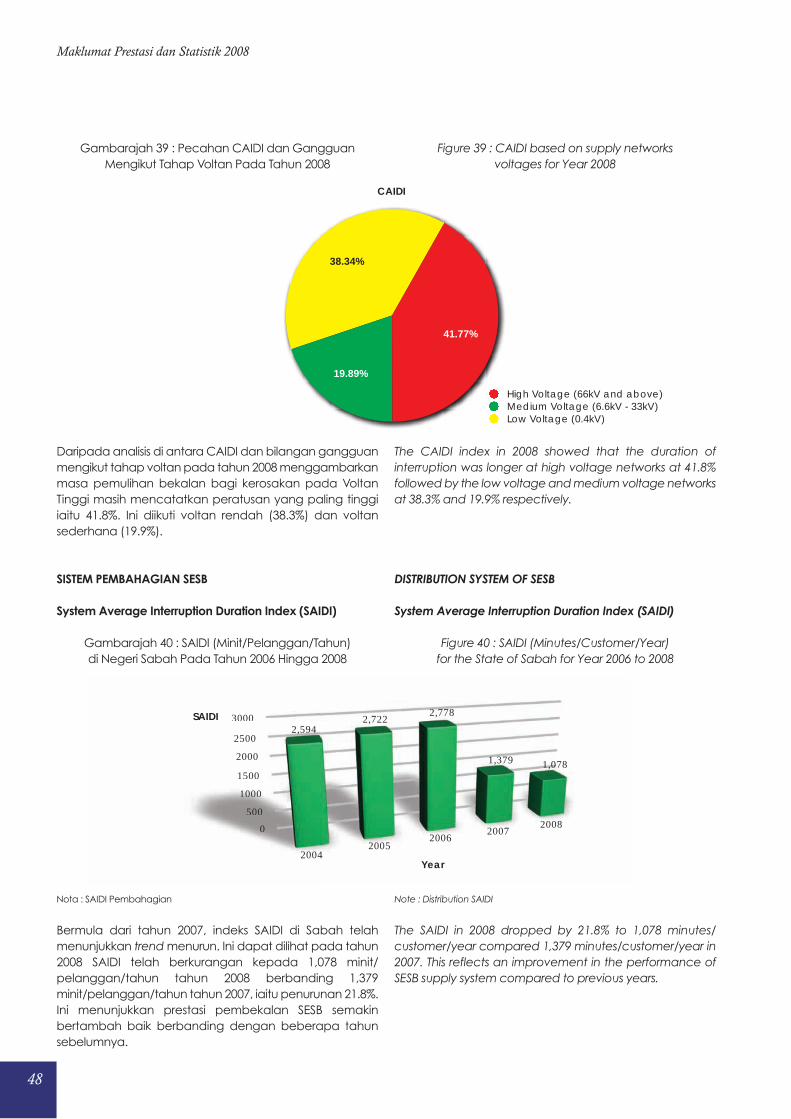
Gambarajah 39 : Pecahan CAIDI dan Gangguan
Mengikut Tahap Voltan Pada Tahun 2008
Daripada analisis di antara CAIDI dan bilangan gangguan
mengikut tahap voltan pada tahun 2008 menggambarkan
masa pemulihan bekalan bagi kerosakan pada Voltan
Tinggi masih mencatatkan peratusan yang paling tinggi
iaitu 41.8%. Ini diikuti voltan rendah (38.3%) dan voltan
sederhana (19.9%).
SISTEM PEMBAHAGIAN SESB
System Average Interruption Duration Index (SAIDI)
Gambarajah 40 : SAIDI (Minit/Pelanggan/Tahun)
di Negeri Sabah Pada Tahun 2006 Hingga 2008
Nota : SAIDI Pembahagian
Bermula dari tahun 2007, indeks SAIDI di Sabah telah
menunjukkan trend menurun. Ini dapat dilihat pada tahun
2008 SAIDI telah berkurangan kepada 1,078 minit/
pelanggan/tahun tahun 2008 berbanding 1,379
minit/pelanggan/tahun tahun 2007, iaitu penurunan 21.8%.
Ini menunjukkan prestasi pembekalan SESB semakin
bertambah baik berbanding dengan beberapa tahun
sebelumnya.
Figure 39 : CAIDI based on supply networks
voltages for Year 2008
The CAIDI index in 2008 showed that the duration of
interruption was longer at high voltage networks at 41.8%
followed by the low voltage and medium voltage networks
at 38.3% and 19.9% respectively.
DISTRIBUTION SYSTEM OF SESB
System Average Interruption Duration Index (SAIDI)
Figure 40 : SAIDI (Minutes/Customer/Year)
for the State of Sabah for Year 2006 to 2008
Note : Distribution SAIDI
The SAIDI in 2008 dropped by 21.8% to 1,078 minutes/
customer/year compared 1,379 minutes/customer/year in
2007. This reflects an improvement in the performance of
SESB supply system compared to previous years.
48
Maklumat Prestasi dan Statistik 2008
38.34%
19.89%
41.77%
CAIDI
High Voltage (66kV and above)Medium Voltage (6.6kV - 33kV)Low Voltage (0.4kV)
0
500
1000
1500
2000
2500
3000
0
500
1000
1500
2000
2500
30002,594
2,7222,778
1,379 1,078
20042005
20062007
2008
Year
SAIDI
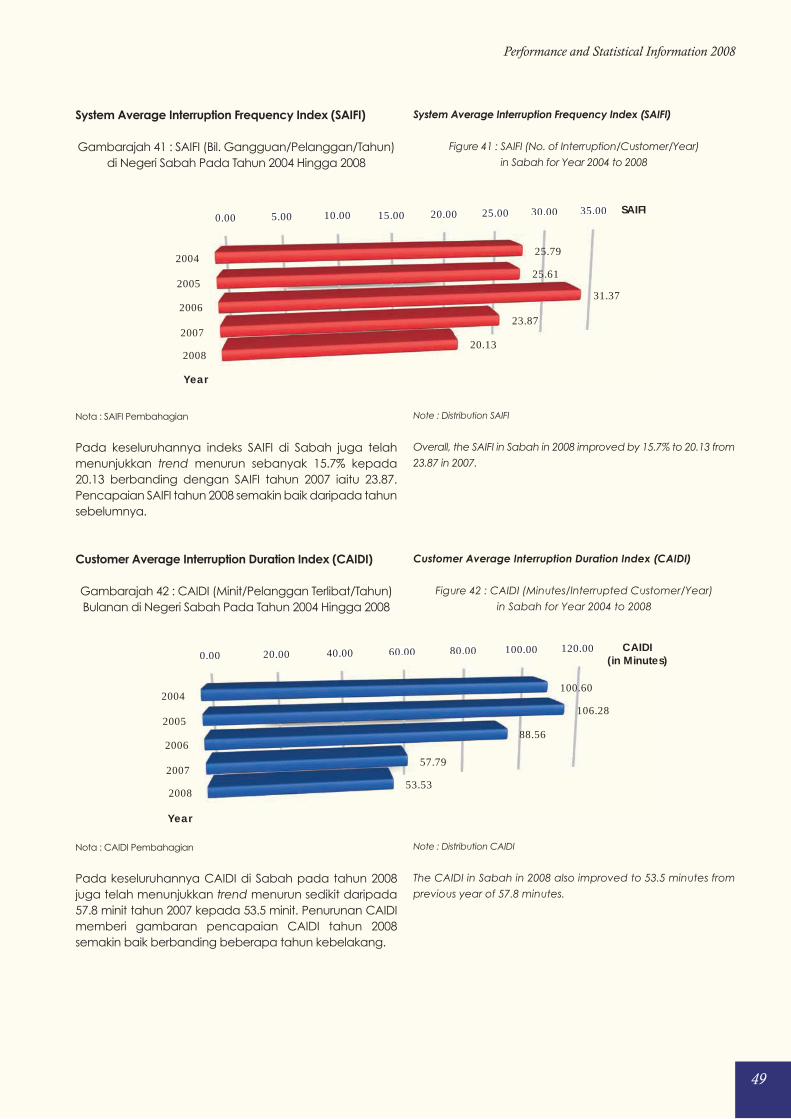
49
Performance and Statistical Information 2008
System Average Interruption Frequency Index (SAIFI)
Gambarajah 41 : SAIFI (Bil. Gangguan/Pelanggan/Tahun)
di Negeri Sabah Pada Tahun 2004 Hingga 2008
Nota : SAIFI Pembahagian
Pada keseluruhannya indeks SAIFI di Sabah juga telah
menunjukkan trend menurun sebanyak 15.7% kepada
20.13 berbanding dengan SAIFI tahun 2007 iaitu 23.87.
Pencapaian SAIFI tahun 2008 semakin baik daripada tahun
sebelumnya.
Customer Average Interruption Duration Index (CAIDI)
Gambarajah 42 : CAIDI (Minit/Pelanggan Terlibat/Tahun)
Bulanan di Negeri Sabah Pada Tahun 2004 Hingga 2008
Nota : CAIDI Pembahagian
Pada keseluruhannya CAIDI di Sabah pada tahun 2008
juga telah menunjukkan trend menurun sedikit daripada
57.8 minit tahun 2007 kepada 53.5 minit. Penurunan CAIDI
memberi gambaran pencapaian CAIDI tahun 2008
semakin baik berbanding beberapa tahun kebelakang.
System Average Interruption Frequency Index (SAIFI)
Figure 41 : SAIFI (No. of Interruption/Customer/Year)
in Sabah for Year 2004 to 2008
Note : Distribution SAIFI
Overall, the SAIFI in Sabah in 2008 improved by 15.7% to 20.13 from
23.87 in 2007.
Customer Average Interruption Duration Index (CAIDI)
Figure 42 : CAIDI (Minutes/Interrupted Customer/Year)
in Sabah for Year 2004 to 2008
Note : Distribution CAIDI
The CAIDI in Sabah in 2008 also improved to 53.5 minutes from
previous year of 57.8 minutes.
0.00 5.00 10.00 15.00 20.00 25.00 30.00 35.000.00 5.00 10.00 15.00 20.00 25.00 30.00 35.00
25.79
25.61
31.37
23.87
20.13
2004
2005
2006
2007
2008
Year
SAIFI
0.00 20.00 40.00 60.00 80.00 100.00 120.000.00 20.00 40.00 60.00 80.00 100.00 120.00
100.60
106.28
88.56
57.79
53.53
2004
2005
2006
2007
2008
Year
CAIDI (in Minutes)
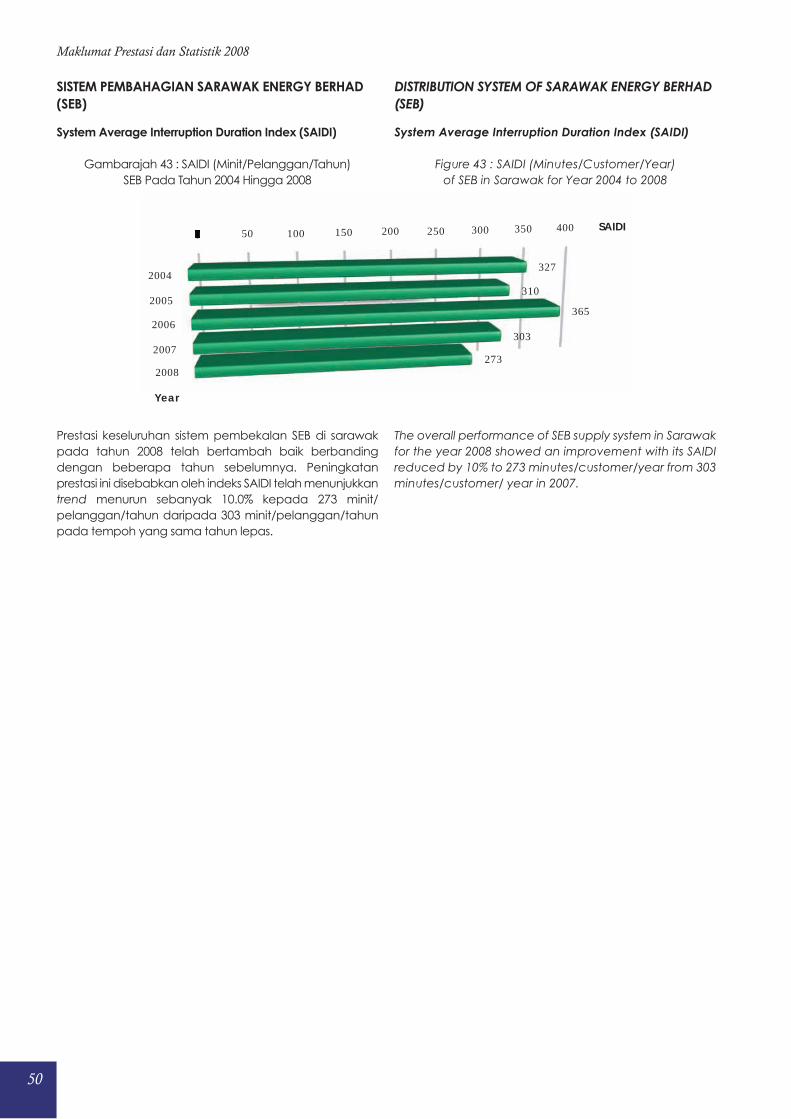
50
Maklumat Prestasi dan Statistik 2008
System Average Interruption Duration Index (SAIDI)
Gambarajah 43 : SAIDI (Minit/Pelanggan/Tahun)
SEB Pada Tahun 2004 Hingga 2008
Prestasi keseluruhan sistem pembekalan SEB di sarawak
pada tahun 2008 telah bertambah baik berbanding
dengan beberapa tahun sebelumnya. Peningkatan
prestasi ini disebabkan oleh indeks SAIDI telah menunjukkan
trend menurun sebanyak 10.0% kepada 273 minit/
pelanggan/tahun daripada 303 minit/pelanggan/tahun
pada tempoh yang sama tahun lepas.
System Average Interruption Duration Index (SAIDI)
Figure 43 : SAIDI (Minutes/Customer/Year)
of SEB in Sarawak for Year 2004 to 2008
The overall performance of SEB supply system in Sarawak
for the year 2008 showed an improvement with its SAIDI
reduced by 10% to 273 minutes/customer/year from 303
minutes/customer/ year in 2007.
SISTEM PEMBAHAGIAN SARAWAK ENERGY BERHAD
(SEB)
DISTRIBUTION SYSTEM OF SARAWAK ENERGY BERHAD
(SEB)
0 50 100 150 200 250 300 350 4000 50 100 150 200 250 300 350 400
327
310
365
303
273
2004
2005
2006
2007
2008
Year
SAIDI
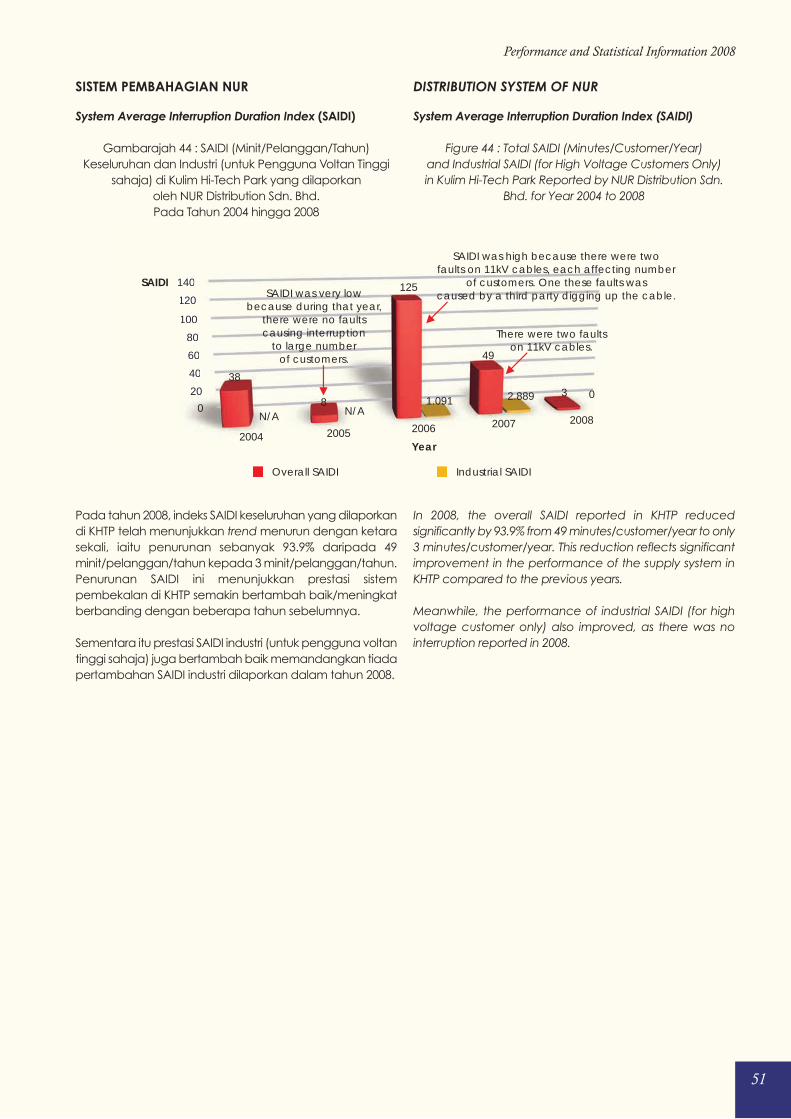
51
Performance and Statistical Information 2008
System Average Interruption Duration Index (SAIDI)
Gambarajah 44 : SAIDI (Minit/Pelanggan/Tahun)
Keseluruhan dan Industri (untuk Pengguna Voltan Tinggi
sahaja) di Kulim Hi-Tech Park yang dilaporkan
oleh NUR Distribution Sdn. Bhd.
Pada Tahun 2004 hingga 2008
Pada tahun 2008, indeks SAIDI keseluruhan yang dilaporkan
di KHTP telah menunjukkan trend menurun dengan ketara
sekali, iaitu penurunan sebanyak 93.9% daripada 49
minit/pelanggan/tahun kepada 3 minit/pelanggan/tahun.
Penurunan SAIDI ini menunjukkan prestasi sistem
pembekalan di KHTP semakin bertambah baik/meningkat
berbanding dengan beberapa tahun sebelumnya.
Sementara itu prestasi SAIDI industri (untuk pengguna voltan
tinggi sahaja) juga bertambah baik memandangkan tiada
pertambahan SAIDI industri dilaporkan dalam tahun 2008.
System Average Interruption Duration Index (SAIDI)
Figure 44 : Total SAIDI (Minutes/Customer/Year)
and Industrial SAIDI (for High Voltage Customers Only)
in Kulim Hi-Tech Park Reported by NUR Distribution Sdn.
Bhd. for Year 2004 to 2008
In 2008, the overall SAIDI reported in KHTP reduced
significantly by 93.9% from 49 minutes/customer/year to only
3 minutes/customer/year. This reduction reflects significant
improvement in the performance of the supply system in
KHTP compared to the previous years.
Meanwhile, the performance of industrial SAIDI (for high
voltage customer only) also improved, as there was no
interruption reported in 2008.
SISTEM PEMBAHAGIAN NUR DISTRIBUTION SYSTEM OF NUR
0
20
40
60
80
100
120
140
0
20
40
60
80
100
120
140
38
8
125
49
3 0
N/AN/A1.091 2.889
2004 2005 2006 2007 2008
Overall SAIDI Industrial SAIDI
Year
SAIDISAIDI was very low
because during that year,there were no faultscausing interruption
to large numberof customers.
There were two faultson 11kV cables.
SAIDI was high because there were twofaults on 11kV cables, each affecting number
of customers. One these faults wascaused by a third party digging up the cable.
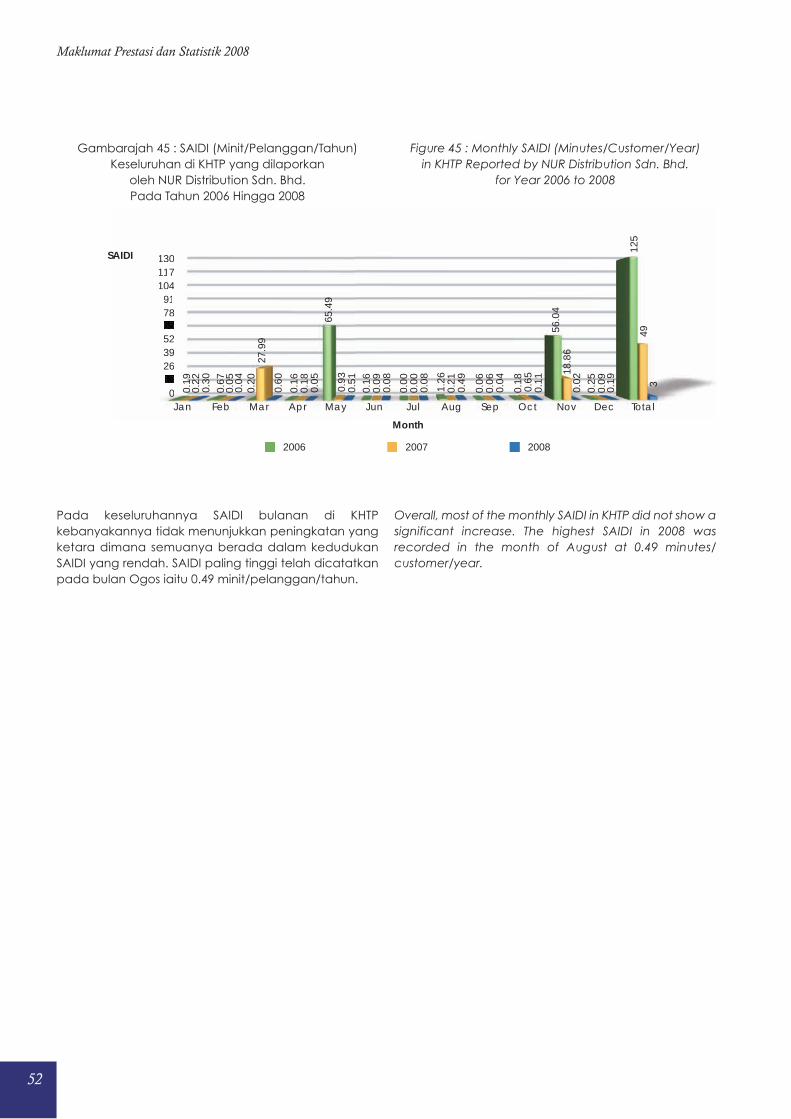
52
Maklumat Prestasi dan Statistik 2008
Gambarajah 45 : SAIDI (Minit/Pelanggan/Tahun)
Keseluruhan di KHTP yang dilaporkan
oleh NUR Distribution Sdn. Bhd.
Pada Tahun 2006 Hingga 2008
Pada keseluruhannya SAIDI bulanan di KHTP
kebanyakannya tidak menunjukkan peningkatan yang
ketara dimana semuanya berada dalam kedudukan
SAIDI yang rendah. SAIDI paling tinggi telah dicatatkan
pada bulan Ogos iaitu 0.49 minit/pelanggan/tahun.
Figure 45 : Monthly SAIDI (Minutes/Customer/Year)
in KHTP Reported by NUR Distribution Sdn. Bhd.
for Year 2006 to 2008
Overall, most of the monthly SAIDI in KHTP did not show a
significant increase. The highest SAIDI in 2008 was
recorded in the month of August at 0.49 minutes/
customer/year.
013263952657891
104117130
013263952657891
104117130
0.19
0.67
0.20
0.16
65.4
9
0.16
0.00
1.26
0.06
0.18
56.0
4
0.25
125
0.22
0.05
27.9
9
0.18
0.93
0.09
0.00
0.21
0.06
0.65
18.8
6
0.09
49
0.30
0.04
0.60
0.05
0.51
0.08
0.08
0.49
0.04
0.11
0.02
0.19 3
Jan Feb Mar Apr May Jun Jul Aug Sep Oct Nov Dec Total
2006 2007 2008
SAIDI
Month
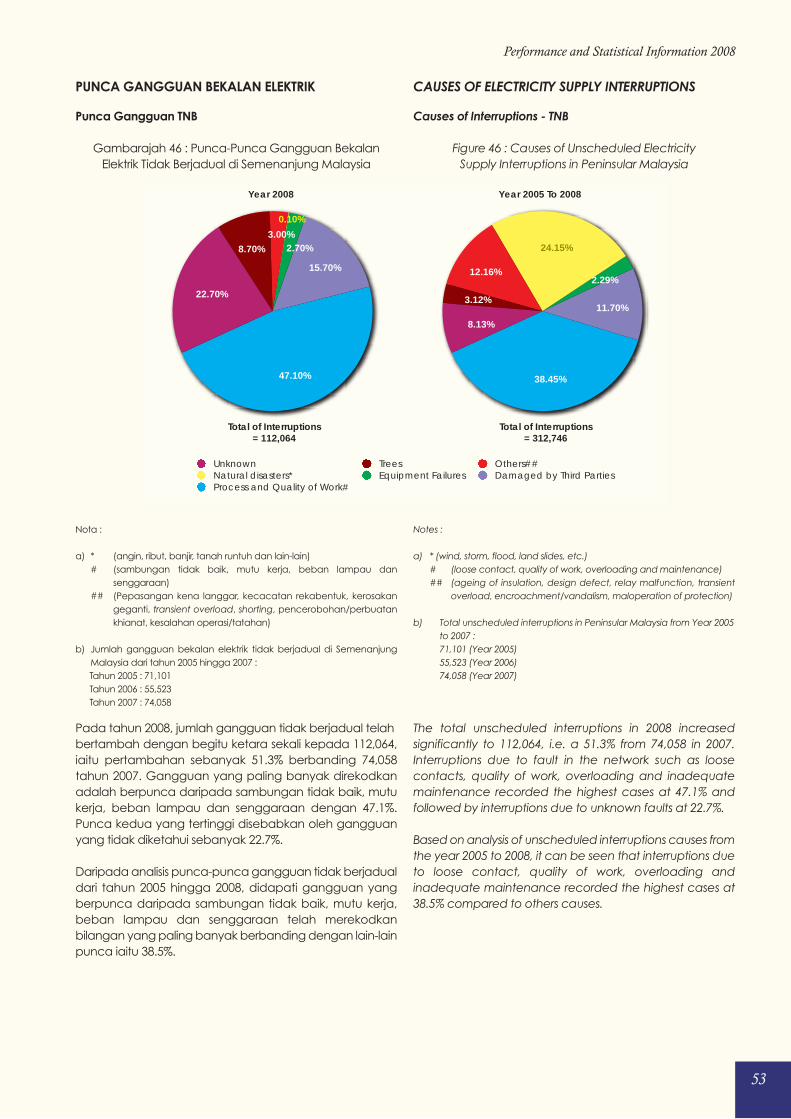
53
Performance and Statistical Information 2008
Punca Gangguan TNB
Gambarajah 46 : Punca-Punca Gangguan Bekalan
Elektrik Tidak Berjadual di Semenanjung Malaysia
Nota :
a) * (angin, ribut, banjir, tanah runtuh dan lain-lain)
# (sambungan tidak baik, mutu kerja, beban lampau dan
senggaraan)
## (Pepasangan kena langgar, kecacatan rekabentuk, kerosakan
geganti, transient overload, shorting, pencerobohan/perbuatan
khianat, kesalahan operasi/tatahan)
b) Jumlah gangguan bekalan elektrik tidak berjadual di Semenanjung
Malaysia dari tahun 2005 hingga 2007 :
Tahun 2005 : 71,101
Tahun 2006 : 55,523
Tahun 2007 : 74,058
Pada tahun 2008, jumlah gangguan tidak berjadual telah
bertambah dengan begitu ketara sekali kepada 112,064,
iaitu pertambahan sebanyak 51.3% berbanding 74,058
tahun 2007. Gangguan yang paling banyak direkodkan
adalah berpunca daripada sambungan tidak baik, mutu
kerja, beban lampau dan senggaraan dengan 47.1%.
Punca kedua yang tertinggi disebabkan oleh gangguan
yang tidak diketahui sebanyak 22.7%.
Daripada analisis punca-punca gangguan tidak berjadual
dari tahun 2005 hingga 2008, didapati gangguan yang
berpunca daripada sambungan tidak baik, mutu kerja,
beban lampau dan senggaraan telah merekodkan
bilangan yang paling banyak berbanding dengan lain-lain
punca iaitu 38.5%.
Causes of Interruptions - TNB
Figure 46 : Causes of Unscheduled Electricity
Supply Interruptions in Peninsular Malaysia
Notes :
a) * (wind, storm, flood, land slides, etc.)
# (loose contact, quality of work, overloading and maintenance)
## (ageing of insulation, design defect, relay malfunction, transient
overload, encroachment/vandalism, maloperation of protection)
b) Total unscheduled interruptions in Peninsular Malaysia from Year 2005
to 2007 :
71,101 (Year 2005)
55,523 (Year 2006)
74,058 (Year 2007)
The total unscheduled interruptions in 2008 increased
significantly to 112,064, i.e. a 51.3% from 74,058 in 2007.
Interruptions due to fault in the network such as loose
contacts, quality of work, overloading and inadequate
maintenance recorded the highest cases at 47.1% and
followed by interruptions due to unknown faults at 22.7%.
Based on analysis of unscheduled interruptions causes from
the year 2005 to 2008, it can be seen that interruptions due
to loose contact, quality of work, overloading and
inadequate maintenance recorded the highest cases at
38.5% compared to others causes.
PUNCA GANGGUAN BEKALAN ELEKTRIK CAUSES OF ELECTRICITY SUPPLY INTERRUPTIONS
Unknown Trees Others##Natural disasters* Equipment Failures Damaged by Third PartiesProcess and Quality of Work#
47.10%
15.70%
2.70%
0.10%
3.00%
8.70%
22.70%
Year 2008
38.45%
11.70%
2.29%
24.15%
12.16%
3.12%
8.13%
Year 2005 To 2008
Total of Interruptions= 112,064
Total of Interruptions= 312,746
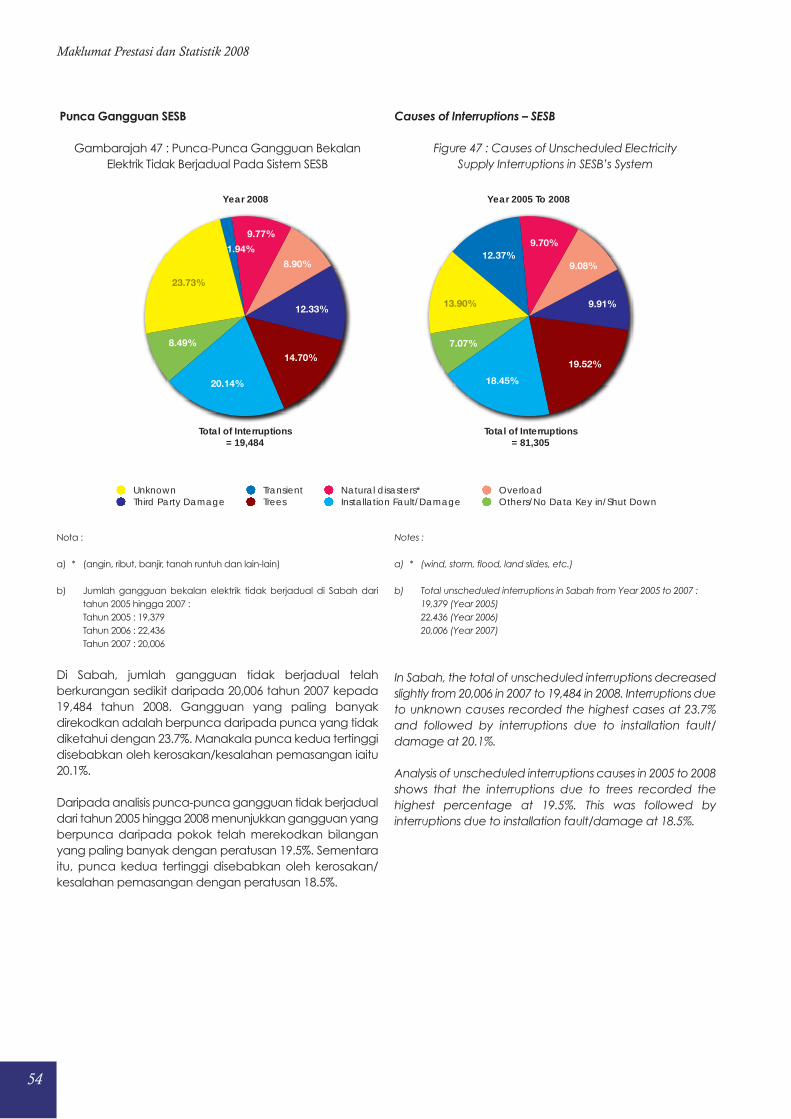
54
Maklumat Prestasi dan Statistik 2008
Punca Gangguan SESB
Gambarajah 47 : Punca-Punca Gangguan Bekalan
Elektrik Tidak Berjadual Pada Sistem SESB
Nota :
a) * (angin, ribut, banjir, tanah runtuh dan lain-lain)
b) Jumlah gangguan bekalan elektrik tidak berjadual di Sabah dari
tahun 2005 hingga 2007 :
Tahun 2005 : 19,379
Tahun 2006 : 22,436
Tahun 2007 : 20,006
Di Sabah, jumlah gangguan tidak berjadual telah
berkurangan sedikit daripada 20,006 tahun 2007 kepada
19,484 tahun 2008. Gangguan yang paling banyak
direkodkan adalah berpunca daripada punca yang tidak
diketahui dengan 23.7%. Manakala punca kedua tertinggi
disebabkan oleh kerosakan/kesalahan pemasangan iaitu
20.1%.
Daripada analisis punca-punca gangguan tidak berjadual
dari tahun 2005 hingga 2008 menunjukkan gangguan yang
berpunca daripada pokok telah merekodkan bilangan
yang paling banyak dengan peratusan 19.5%. Sementara
itu, punca kedua tertinggi disebabkan oleh kerosakan/
kesalahan pemasangan dengan peratusan 18.5%.
Causes of Interruptions – SESB
Figure 47 : Causes of Unscheduled Electricity
Supply Interruptions in SESB’s System
Notes :
a) * (wind, storm, flood, land slides, etc.)
b) Total unscheduled interruptions in Sabah from Year 2005 to 2007 :
19,379 (Year 2005)
22,436 (Year 2006)
20,006 (Year 2007)
In Sabah, the total of unscheduled interruptions decreased
slightly from 20,006 in 2007 to 19,484 in 2008. Interruptions due
to unknown causes recorded the highest cases at 23.7%
and followed by interruptions due to installation fault/
damage at 20.1%.
Analysis of unscheduled interruptions causes in 2005 to 2008
shows that the interruptions due to trees recorded the
highest percentage at 19.5%. This was followed by
interruptions due to installation fault/damage at 18.5%.
Unknown Transient Natural disasters* OverloadThird Party Damage Trees Installation Fault/Damage Others/No Data Key in/Shut Down
8.49%
20.14%
14.70%
12.33%
8.90%
9.77%
1.94%
23.73%
Year 2008
Total of Interruptions= 19,484
7.07%
18.45%
19.52%
9.91%
9.08%
9.70%12.37%
13.90%
Year 2005 To 2008
Total of Interruptions= 81,305
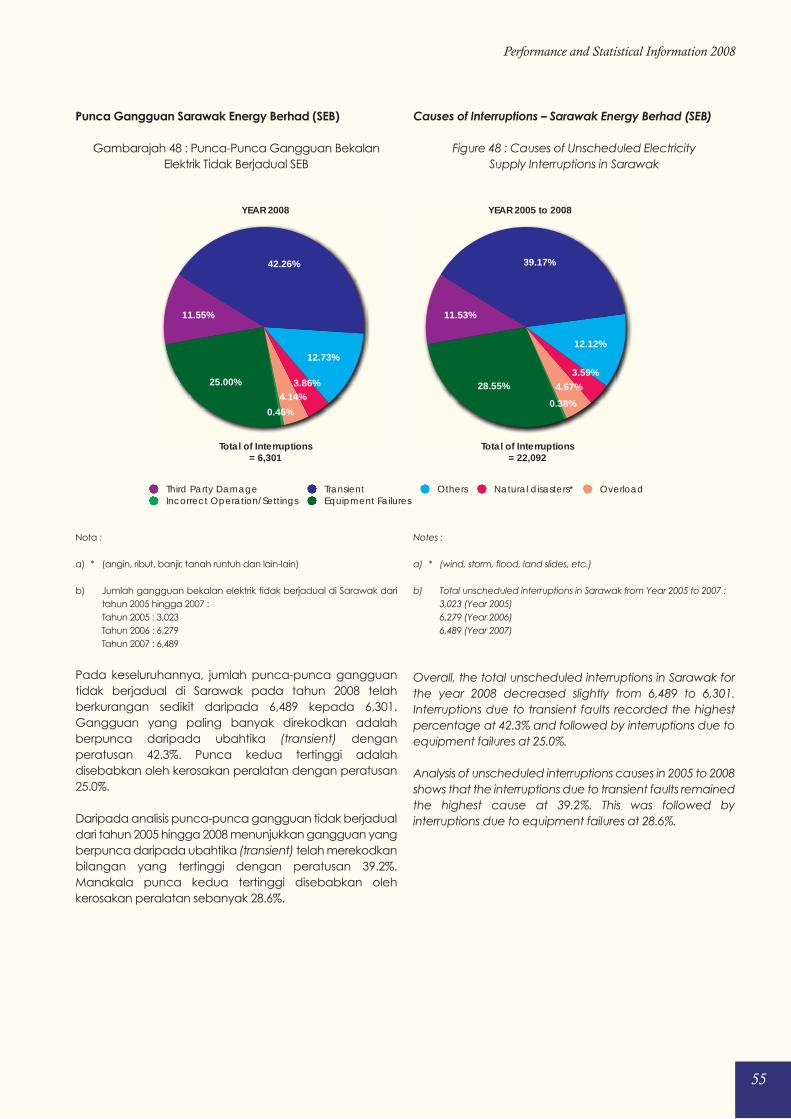
55
Performance and Statistical Information 2008
Punca Gangguan Sarawak Energy Berhad (SEB)
Gambarajah 48 : Punca-Punca Gangguan Bekalan
Elektrik Tidak Berjadual SEB
Nota :
a) * (angin, ribut, banjir, tanah runtuh dan lain-lain)
b) Jumlah gangguan bekalan elektrik tidak berjadual di Sarawak dari
tahun 2005 hingga 2007 :
Tahun 2005 : 3,023
Tahun 2006 : 6,279
Tahun 2007 : 6,489
Pada keseluruhannya, jumlah punca-punca gangguan
tidak berjadual di Sarawak pada tahun 2008 telah
berkurangan sedikit daripada 6,489 kepada 6,301.
Gangguan yang paling banyak direkodkan adalah
berpunca daripada ubahtika (transient) dengan
peratusan 42.3%. Punca kedua tertinggi adalah
disebabkan oleh kerosakan peralatan dengan peratusan
25.0%.
Daripada analisis punca-punca gangguan tidak berjadual
dari tahun 2005 hingga 2008 menunjukkan gangguan yang
berpunca daripada ubahtika (transient) telah merekodkan
bilangan yang tertinggi dengan peratusan 39.2%.
Manakala punca kedua tertinggi disebabkan oleh
kerosakan peralatan sebanyak 28.6%.
Causes of Interruptions – Sarawak Energy Berhad (SEB)
Figure 48 : Causes of Unscheduled Electricity
Supply Interruptions in Sarawak
Notes :
a) * (wind, storm, flood, land slides, etc.)
b) Total unscheduled interruptions in Sarawak from Year 2005 to 2007 :
3,023 (Year 2005)
6,279 (Year 2006)
6,489 (Year 2007)
Overall, the total unscheduled interruptions in Sarawak for
the year 2008 decreased slightly from 6,489 to 6,301.
Interruptions due to transient faults recorded the highest
percentage at 42.3% and followed by interruptions due to
equipment failures at 25.0%.
Analysis of unscheduled interruptions causes in 2005 to 2008
shows that the interruptions due to transient faults remained
the highest cause at 39.2%. This was followed by
interruptions due to equipment failures at 28.6%.
Third Party Damage Transient Others Natural disasters* OverloadIncorrect Operation/Settings Equipment Failures
25.00%
0.46%
4.14%3.86%
12.73%
42.26%
11.55%
YEAR 2008
Total of Interruptions= 6,301
28.55%
0.38%
4.67%3.59%
12.12%
39.17%
11.53%
YEAR 2005 to 2008
Total of Interruptions= 22,092
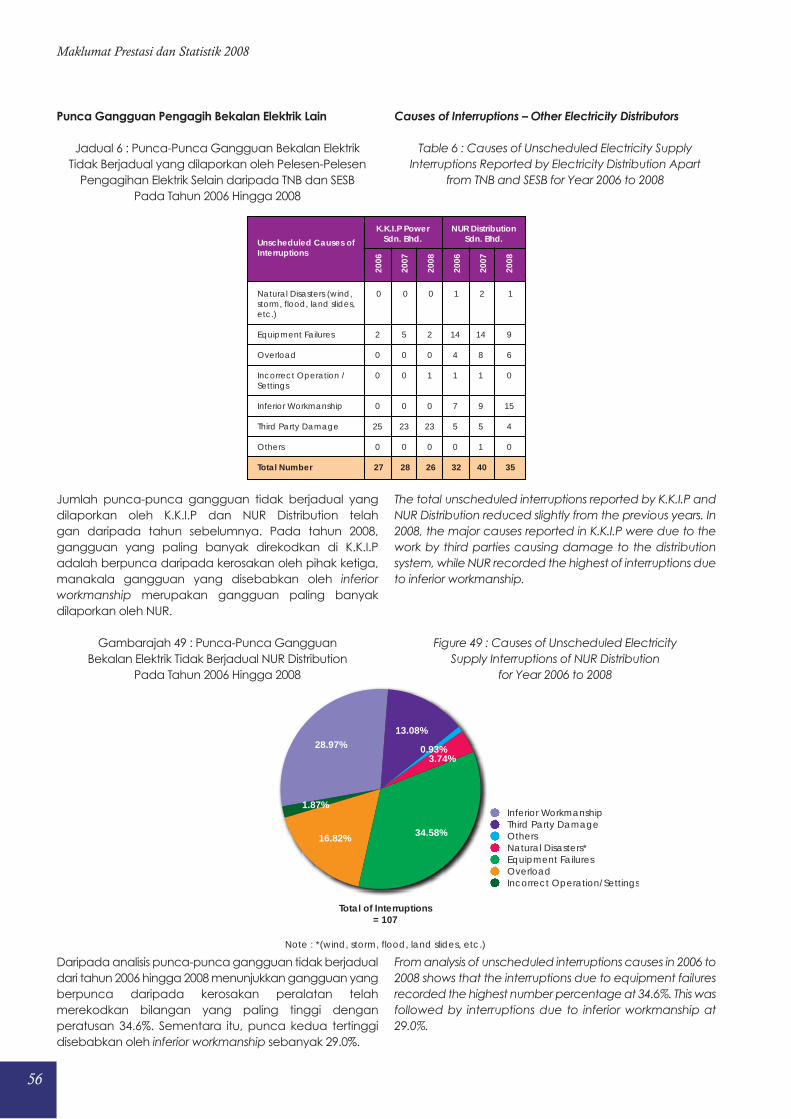
56
Maklumat Prestasi dan Statistik 2008
Punca Gangguan Pengagih Bekalan Elektrik Lain
Jadual 6 : Punca-Punca Gangguan Bekalan Elektrik
Tidak Berjadual yang dilaporkan oleh Pelesen-Pelesen
Pengagihan Elektrik Selain daripada TNB dan SESB
Pada Tahun 2006 Hingga 2008
Jumlah punca-punca gangguan tidak berjadual yang
dilaporkan oleh K.K.I.P dan NUR Distribution telah
gan daripada tahun sebelumnya. Pada tahun 2008,
gangguan yang paling banyak direkodkan di K.K.I.P
adalah berpunca daripada kerosakan oleh pihak ketiga,
manakala gangguan yang disebabkan oleh inferior
workmanship merupakan gangguan paling banyak
dilaporkan oleh NUR.
Gambarajah 49 : Punca-Punca Gangguan
Bekalan Elektrik Tidak Berjadual NUR Distribution
Pada Tahun 2006 Hingga 2008
Daripada analisis punca-punca gangguan tidak berjadual
dari tahun 2006 hingga 2008 menunjukkan gangguan yang
berpunca daripada kerosakan peralatan telah
merekodkan bilangan yang paling tinggi dengan
peratusan 34.6%. Sementara itu, punca kedua tertinggi
disebabkan oleh inferior workmanship sebanyak 29.0%.
Causes of Interruptions – Other Electricity Distributors
Table 6 : Causes of Unscheduled Electricity Supply
Interruptions Reported by Electricity Distribution Apart
from TNB and SESB for Year 2006 to 2008
The total unscheduled interruptions reported by K.K.I.P and
NUR Distribution reduced slightly from the previous years. In
2008, the major causes reported in K.K.I.P were due to the
work by third parties causing damage to the distribution
system, while NUR recorded the highest of interruptions due
to inferior workmanship.
Figure 49 : Causes of Unscheduled Electricity
Supply Interruptions of NUR Distribution
for Year 2006 to 2008
From analysis of unscheduled interruptions causes in 2006 to
2008 shows that the interruptions due to equipment failures
recorded the highest number percentage at 34.6%. This was
followed by interruptions due to inferior workmanship at
29.0%.
Unscheduled Causes ofInterruptions
Natural Disasters (wind,storm, flood, land slides,etc.)
Equipment Failures
Overload
Incorrect Operation /Settings
Inferior Workmanship
Third Party Damage
Others
Total Number
0
2
0
0
0
25
0
27
0
5
0
0
0
23
0
28
0
2
0
1
0
23
0
26
1
14
4
1
7
5
0
32
2
14
8
1
9
5
1
40
1
9
6
0
15
4
0
35
K.K.I.P PowerSdn. Bhd.
NUR DistributionSdn. Bhd.
2006
2007
2008
2006
2007
2008
1.87%
16.82% 34.58%
3.74%0.93%
13.08%28.97%
Inferior WorkmanshipThird Party DamageOthersNatural Disasters*Equipment FailuresOverloadIncorrect Operation/Settings
Total of Interruptions= 107
Note : *(wind, storm, flood, land slides, etc.)
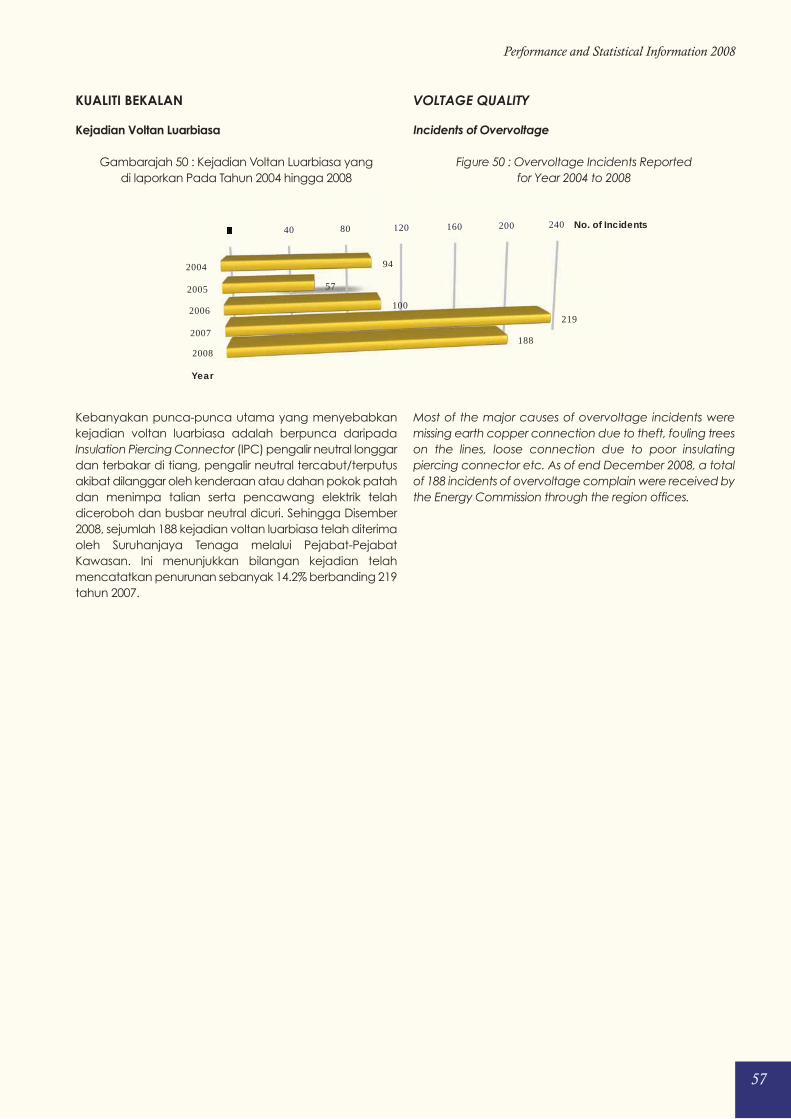
57
Performance and Statistical Information 2008
Kejadian Voltan Luarbiasa
Gambarajah 50 : Kejadian Voltan Luarbiasa yang
di laporkan Pada Tahun 2004 hingga 2008
Kebanyakan punca-punca utama yang menyebabkan
kejadian voltan luarbiasa adalah berpunca daripada
Insulation Piercing Connector (IPC) pengalir neutral longgar
dan terbakar di tiang, pengalir neutral tercabut/terputus
akibat dilanggar oleh kenderaan atau dahan pokok patah
dan menimpa talian serta pencawang elektrik telah
diceroboh dan busbar neutral dicuri. Sehingga Disember
2008, sejumlah 188 kejadian voltan luarbiasa telah diterima
oleh Suruhanjaya Tenaga melalui Pejabat-Pejabat
Kawasan. Ini menunjukkan bilangan kejadian telah
mencatatkan penurunan sebanyak 14.2% berbanding 219
tahun 2007.
Incidents of Overvoltage
Figure 50 : Overvoltage Incidents Reported
for Year 2004 to 2008
Most of the major causes of overvoltage incidents were
missing earth copper connection due to theft, fouling trees
on the lines, loose connection due to poor insulating
piercing connector etc. As of end December 2008, a total
of 188 incidents of overvoltage complain were received by
the Energy Commission through the region offices.
KUALITI BEKALAN VOLTAGE QUALITY
0 40 80 120 160 200 2400 40 80 120 160 200 240
94
57
100219
188
2004
2005
2006
2007
2008
Year
No. of Incidents
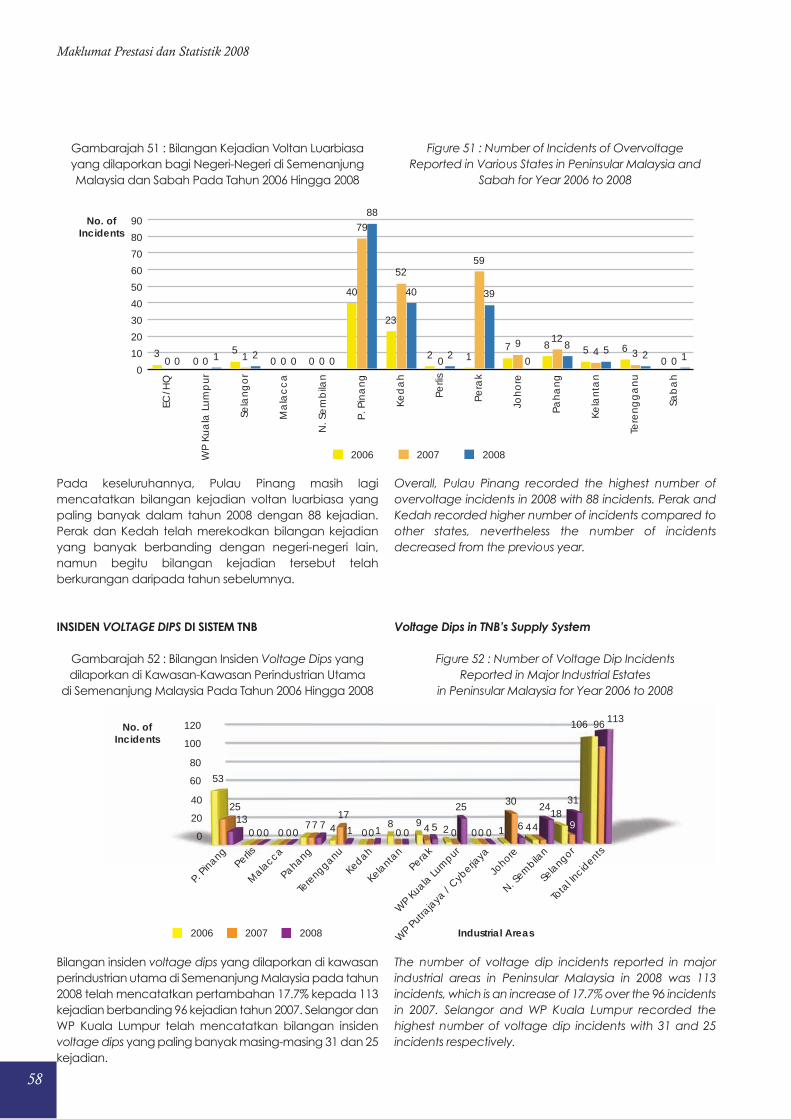
Gambarajah 51 : Bilangan Kejadian Voltan Luarbiasa
yang dilaporkan bagi Negeri-Negeri di Semenanjung
Malaysia dan Sabah Pada Tahun 2006 Hingga 2008
Pada keseluruhannya, Pulau Pinang masih lagi
mencatatkan bilangan kejadian voltan luarbiasa yang
paling banyak dalam tahun 2008 dengan 88 kejadian.
Perak dan Kedah telah merekodkan bilangan kejadian
yang banyak berbanding dengan negeri-negeri lain,
namun begitu bilangan kejadian tersebut telah
berkurangan daripada tahun sebelumnya.
INSIDEN VOLTAGE DIPS DI SISTEM TNB
Gambarajah 52 : Bilangan Insiden Voltage Dips yang
dilaporkan di Kawasan-Kawasan Perindustrian Utama
di Semenanjung Malaysia Pada Tahun 2006 Hingga 2008
Bilangan insiden voltage dips yang dilaporkan di kawasan
perindustrian utama di Semenanjung Malaysia pada tahun
2008 telah mencatatkan pertambahan 17.7% kepada 113
kejadian berbanding 96 kejadian tahun 2007. Selangor dan
WP Kuala Lumpur telah mencatatkan bilangan insiden
voltage dips yang paling banyak masing-masing 31 dan 25
kejadian.
Figure 51 : Number of Incidents of Overvoltage
Reported in Various States in Peninsular Malaysia and
Sabah for Year 2006 to 2008
Overall, Pulau Pinang recorded the highest number of
overvoltage incidents in 2008 with 88 incidents. Perak and
Kedah recorded higher number of incidents compared to
other states, nevertheless the number of incidents
decreased from the previous year.
Voltage Dips in TNB’s Supply System
Figure 52 : Number of Voltage Dip Incidents
Reported in Major Industrial Estates
in Peninsular Malaysia for Year 2006 to 2008
The number of voltage dip incidents reported in major
industrial areas in Peninsular Malaysia in 2008 was 113
incidents, which is an increase of 17.7% over the 96 incidents
in 2007. Selangor and WP Kuala Lumpur recorded the
highest number of voltage dip incidents with 31 and 25
incidents respectively.
58
Maklumat Prestasi dan Statistik 2008
0
10
20
30
40
50
60
70
80
90
Sab
ah
Tere
ng
ga
nu
Kela
nta
n
Pah
an
g
Joh
ore
Pera
k
Perli
s
Ked
ah
P. P
ina
ng
N. S
em
bila
n
Ma
lac
ca
Sela
ng
or
WP
Kua
la L
um
pu
r
EC/H
Q
1258
39
2
40
88
21 34129
5952
79
16587
12
23
40
5000 0 0 00 000
30 0 0 0
2006 2007 2008
No. ofIncidents
No. ofIncidents
0
20
40
60
80
100
120
53
0 07 4 0
8 92 0 1 4
18
106
25
0 07
17
0 0 4 0 0
30
4 9
96
130 0
7 1 1 0 5
25
06
2431
113
Industrial Areas
P. Pinang
Perlis
Mala
cca
Pahang
Tere
ngganu
Kedah
Kelanta
n
Perak
WP K
uala Lu
mpur
WP P
utraja
ya /
Cyberja
ya
Johore
N. Sem
bilan
Sela
ngor
Tota
l Incid
ents
2006 2007 2008
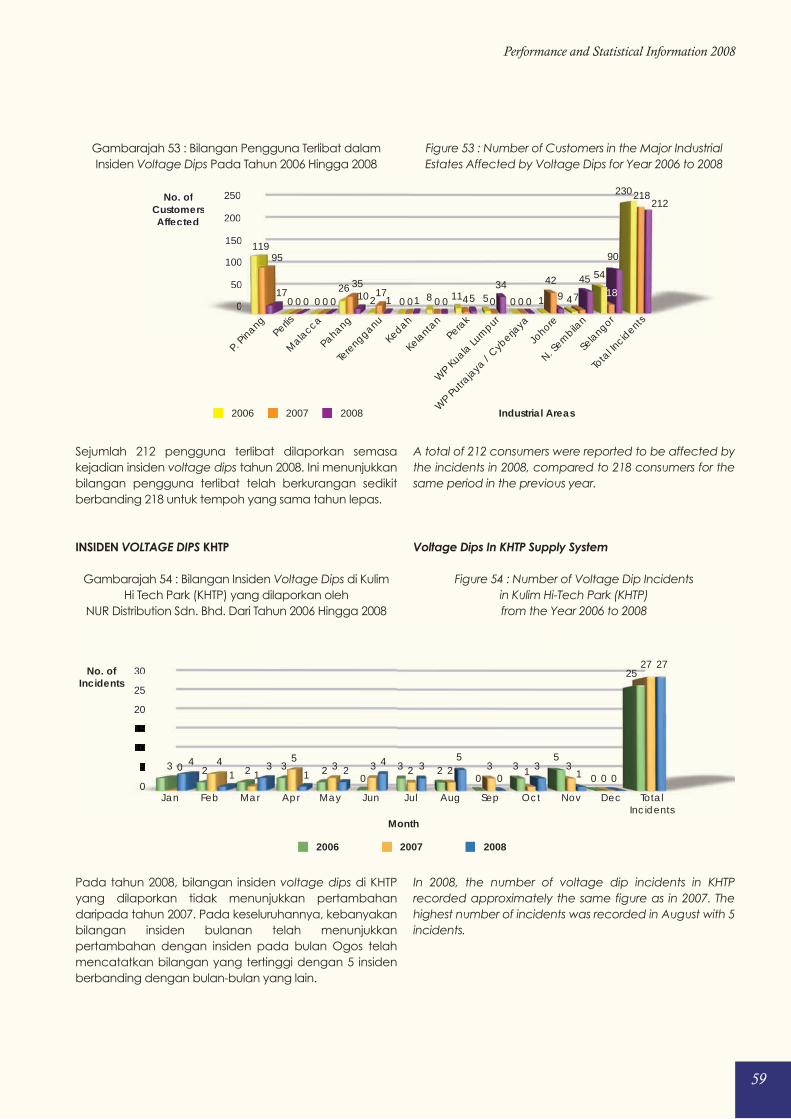
59
Performance and Statistical Information 2008
Gambarajah 53 : Bilangan Pengguna Terlibat dalam
Insiden Voltage Dips Pada Tahun 2006 Hingga 2008
Sejumlah 212 pengguna terlibat dilaporkan semasa
kejadian insiden voltage dips tahun 2008. Ini menunjukkan
bilangan pengguna terlibat telah berkurangan sedikit
berbanding 218 untuk tempoh yang sama tahun lepas.
INSIDEN VOLTAGE DIPS KHTP
Gambarajah 54 : Bilangan Insiden Voltage Dips di Kulim
Hi Tech Park (KHTP) yang dilaporkan oleh
NUR Distribution Sdn. Bhd. Dari Tahun 2006 Hingga 2008
Pada tahun 2008, bilangan insiden voltage dips di KHTP
yang dilaporkan tidak menunjukkan pertambahan
daripada tahun 2007. Pada keseluruhannya, kebanyakan
bilangan insiden bulanan telah menunjukkan
pertambahan dengan insiden pada bulan Ogos telah
mencatatkan bilangan yang tertinggi dengan 5 insiden
berbanding dengan bulan-bulan yang lain.
Figure 53 : Number of Customers in the Major Industrial
Estates Affected by Voltage Dips for Year 2006 to 2008
A total of 212 consumers were reported to be affected by
the incidents in 2008, compared to 218 consumers for the
same period in the previous year.
Voltage Dips In KHTP Supply System
Figure 54 : Number of Voltage Dip Incidents
in Kulim Hi-Tech Park (KHTP)
from the Year 2006 to 2008
In 2008, the number of voltage dip incidents in KHTP
recorded approximately the same figure as in 2007. The
highest number of incidents was recorded in August with 5
incidents.
No. of Customers Affected
0
50
100
150
200
250No. of Customers Affected
0
50
100
150
200
250
119
0 026
2 0 8 11 5 0 1 4
54
230
95
0 0
3517
0 0 4 0 0
42
7 18
218
170 0 10 1 1 0 5
34
0 9
45
90
212
Industrial Areas
P. Pinang
Perlis
Mala
cca
Pahang
Tere
ngganu
Kedah
Kelanta
n
Perak
WP K
uala Lu
mpur
WP P
utraja
ya /
Cyberja
ya
Johore
N. Sem
bilan
Sela
ngor
Tota
l Incid
ents
2006 2007 2008
0
5
10
15
20
25
30
0
5
10
15
20
25
30
3 2 2 3 20
3 20
35
0
25
0 41
53 3 2 2 3 1 3
0
27
41
31 2
4 35
03
1 0
27
Jan Feb Mar Apr May Jun Jul Aug Sep Oct Nov Dec TotalIncidents
2006 2007 2008
No. ofIncidents
Month
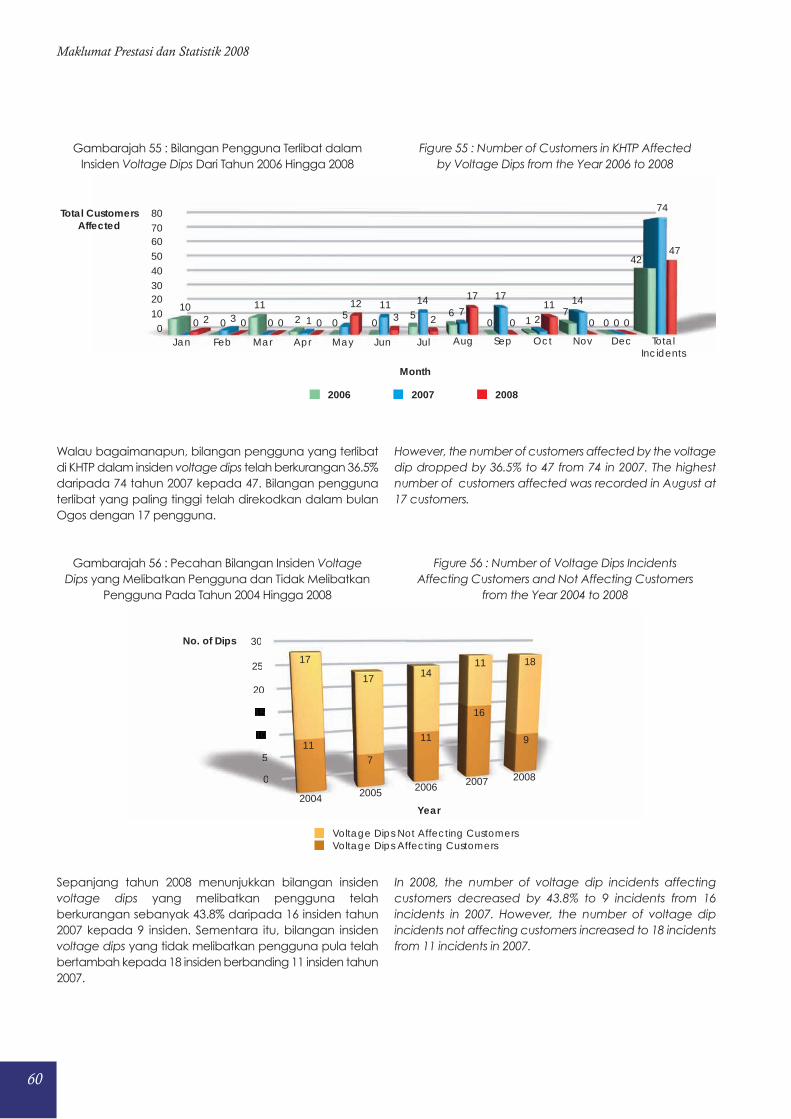
60
Maklumat Prestasi dan Statistik 2008
Gambarajah 55 : Bilangan Pengguna Terlibat dalam
Insiden Voltage Dips Dari Tahun 2006 Hingga 2008
Walau bagaimanapun, bilangan pengguna yang terlibat
di KHTP dalam insiden voltage dips telah berkurangan 36.5%
daripada 74 tahun 2007 kepada 47. Bilangan pengguna
terlibat yang paling tinggi telah direkodkan dalam bulan
Ogos dengan 17 pengguna.
Gambarajah 56 : Pecahan Bilangan Insiden Voltage
Dips yang Melibatkan Pengguna dan Tidak Melibatkan
Pengguna Pada Tahun 2004 Hingga 2008
Sepanjang tahun 2008 menunjukkan bilangan insiden
voltage dips yang melibatkan pengguna telah
berkurangan sebanyak 43.8% daripada 16 insiden tahun
2007 kepada 9 insiden. Sementara itu, bilangan insiden
voltage dips yang tidak melibatkan pengguna pula telah
bertambah kepada 18 insiden berbanding 11 insiden tahun
2007.
Figure 55 : Number of Customers in KHTP Affected
by Voltage Dips from the Year 2006 to 2008
However, the number of customers affected by the voltage
dip dropped by 36.5% to 47 from 74 in 2007. The highest
number of customers affected was recorded in August at
17 customers.
Figure 56 : Number of Voltage Dips Incidents
Affecting Customers and Not Affecting Customers
from the Year 2004 to 2008
In 2008, the number of voltage dip incidents affecting
customers decreased by 43.8% to 9 incidents from 16
incidents in 2007. However, the number of voltage dip
incidents not affecting customers increased to 18 incidents
from 11 incidents in 2007.
01020304050607080
10
0
112 0 0
5 60 1
70
42
0 3 0 1 511 14
7
17
2
14
0
74
2 0 0 0
123 2
17
0
11
0 0
47
Jan Feb Mar Apr May Jun Jul Aug Sep Oct Nov Dec TotalIncidents
2006 2007 2008
Total Customers Affected
Month
0
5
10
15
20
25
30
0
5
10
15
20
25
30
117
11
16
9
17
17 1411 18
2004 2005 2006 2007 2008
Voltage Dips Affecting CustomersVoltage Dips Not Affecting Customers
No. of Dips
Year
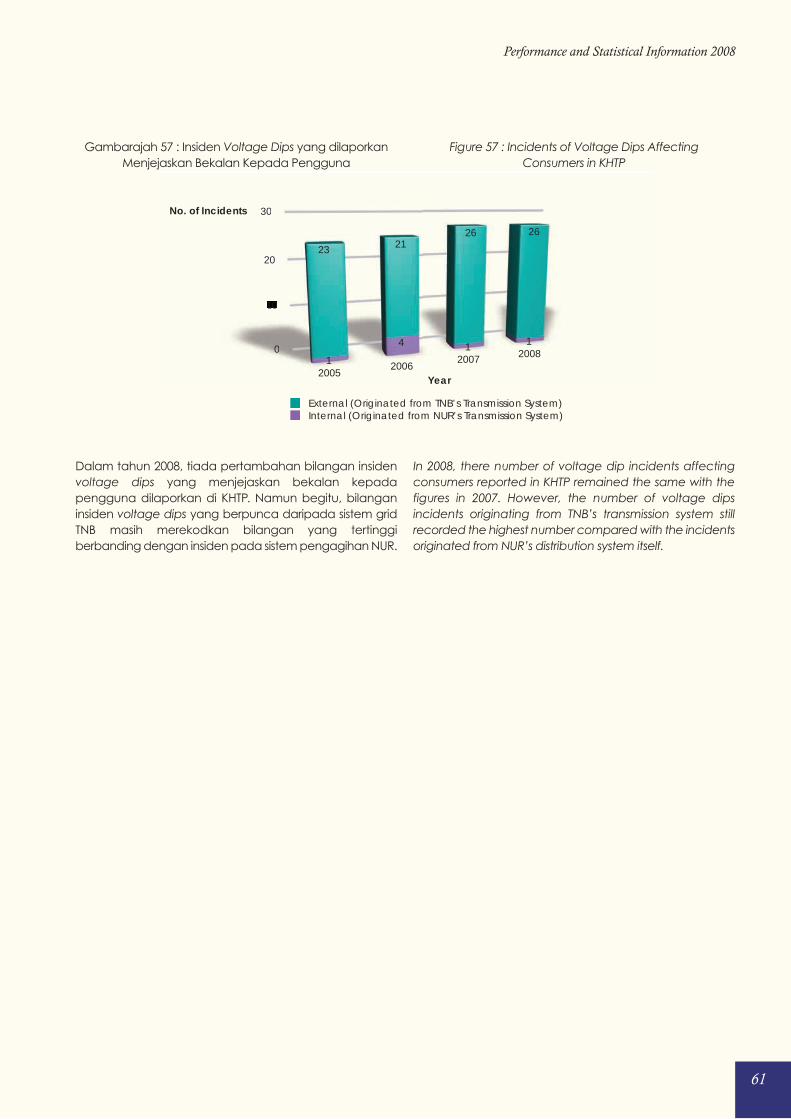
61
Performance and Statistical Information 2008
Gambarajah 57 : Insiden Voltage Dips yang dilaporkan
Menjejaskan Bekalan Kepada Pengguna
Dalam tahun 2008, tiada pertambahan bilangan insiden
voltage dips yang menjejaskan bekalan kepada
pengguna dilaporkan di KHTP. Namun begitu, bilangan
insiden voltage dips yang berpunca daripada sistem grid
TNB masih merekodkan bilangan yang tertinggi
berbanding dengan insiden pada sistem pengagihan NUR.
Figure 57 : Incidents of Voltage Dips Affecting
Consumers in KHTP
In 2008, there number of voltage dip incidents affecting
consumers reported in KHTP remained the same with the
figures in 2007. However, the number of voltage dips
incidents originating from TNB’s transmission system still
recorded the highest number compared with the incidents
originated from NUR’s distribution system itself.
0
10
20
30
0
10
20
30
1
4 1 1
23 2126 26
20052006
2007 2008
Internal (Originated from NUR’s Transmission System)External (Originated from TNB’s Transmission System)
No. of Incidents
Year
Laporan Pematuhan Standard-Standard Prestasi Perkhid-
matan
Pihak utiliti terutamanya TNB (Syarat 15), SESB (Syarat 42)
dan NUR (Syarat 34) perlu mengemukakan laporan prestasi
perkhidmatan kepada Suruhanjaya Tenaga setiap tahun
seperti yang dikehendaki dalam syarat-syarat dan
terma-terma lesen yang ditetapkan seperti di Lampiran I,
Lampiran II dan Lampiran III. Pada tahun 2008, SESB dan
NUR telah mengemukakan laporan prestasi perkhidmatan
pelanggan dengan menggunapakai standard prestasi
yang baru yang mengandungi 20 perkara perkhidmatan.
Namun begitu, laporan prestasi perkhidmatan pelanggan
yang dikemukakan oleh TNB masih lagi menggunapakai
standard prestasi perkhidmatan yang lama yang
mengandungi 15 perkara perkhidmatan.
Pada keseluruhannya, berdasarkan kepada penilaian dan
penganalisisan ke atas laporan prestasi perkhidmatan
pelanggan yang dikemukakan oleh utiliti menunjukkan
tahap prestasi pembekalan TNB, SESB dan NUR ada
menunjukkan peningkatan serta semakin bertambah baik
dibandingkan dengan prestasi tahun-tahun sebelumnya.
Walau bagaimanapun, pihak utiliti perlu meningkatkan
usaha serta memberi perhatian yang sewajarnya supaya
dapat memberikan perkhidmatan yang bermutu serta
berkualiti kepada pengguna-pengguna di Semenanjung
Malaysia.
Annual Performance Report on Customer Services
As stipulated under the license conditions, TNB (condition
15), SESB (condition 42) and NUR (condition 34) are required
to submit annual report on the performance of customer
services to the Energy Commission as shown in Appendix I,
Appendix II and Appendix III. In 2008, SESB and NUR
submitted annual report on the performance of customer
services using the new standard which covers 20 types of
services. However, the report submitted by TNB was still using
the old standard of performance of customer services
which covers 15 types of services.
Overall, based on the assessment and analysis of the report
on the performance of customer services submitted by the
major utilities showed that the performance level of services
of TNB, SESB and NUR were improving compared with the
performance of previous year.
KUALITI PERKHIDMATAN QUALITY OF SERVICES
62
Maklumat Prestasi dan Statistik 2008
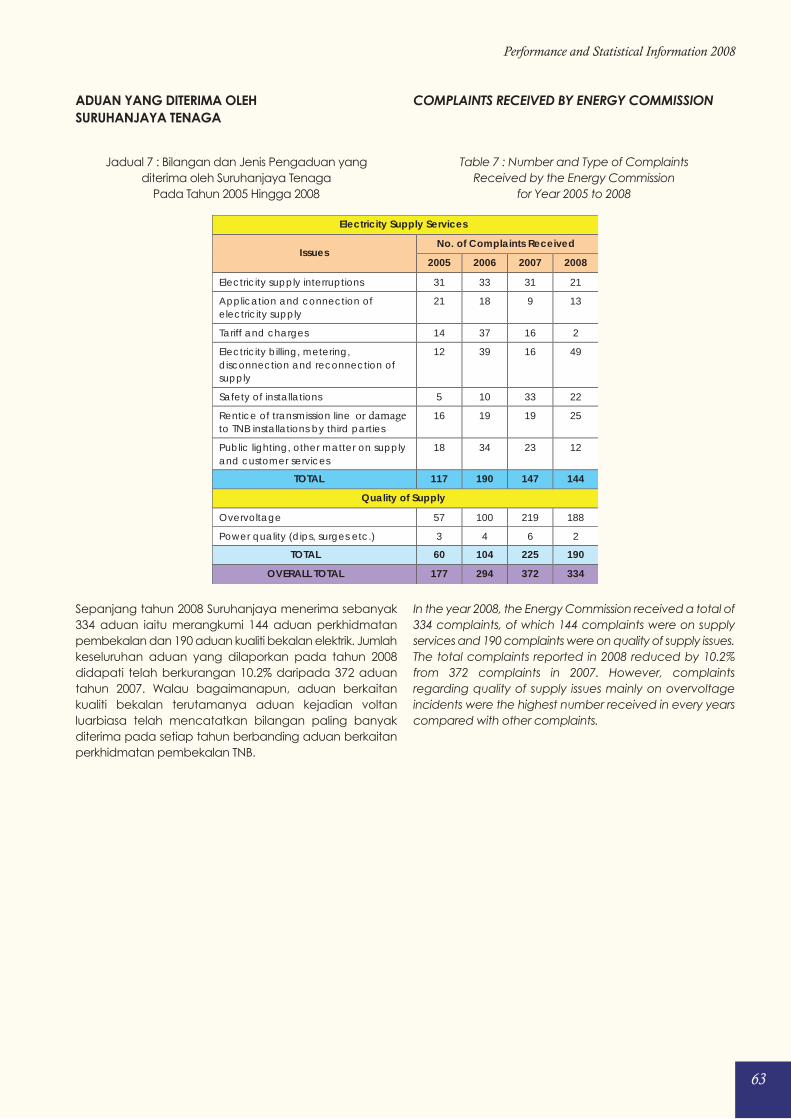
63
Performance and Statistical Information 2008
Jadual 7 : Bilangan dan Jenis Pengaduan yang
diterima oleh Suruhanjaya Tenaga
Pada Tahun 2005 Hingga 2008
Sepanjang tahun 2008 Suruhanjaya menerima sebanyak
334 aduan iaitu merangkumi 144 aduan perkhidmatan
pembekalan dan 190 aduan kualiti bekalan elektrik. Jumlah
keseluruhan aduan yang dilaporkan pada tahun 2008
didapati telah berkurangan 10.2% daripada 372 aduan
tahun 2007. Walau bagaimanapun, aduan berkaitan
kualiti bekalan terutamanya aduan kejadian voltan
luarbiasa telah mencatatkan bilangan paling banyak
diterima pada setiap tahun berbanding aduan berkaitan
perkhidmatan pembekalan TNB.
Table 7 : Number and Type of Complaints
Received by the Energy Commission
for Year 2005 to 2008
In the year 2008, the Energy Commission received a total of
334 complaints, of which 144 complaints were on supply
services and 190 complaints were on quality of supply issues.
The total complaints reported in 2008 reduced by 10.2%
from 372 complaints in 2007. However, complaints
regarding quality of supply issues mainly on overvoltage
incidents were the highest number received in every years
compared with other complaints.
ADUAN YANG DITERIMA OLEH
SURUHANJAYA TENAGA
COMPLAINTS RECEIVED BY ENERGY COMMISSION
Electricity Supply Services
No. of Complaints ReceivedIssues
2005 2006 2007 2008
Electricity supply interruptions 31 33 31 21
Application and connection of electricity supply
21 18 9 13
Tariff and charges 14 37 16 2
Electricity billing, metering,disconnection and reconnection of supply
12 39 16 49
Safety of installations 5 10 33 22
Rentice of transmission line or damage to TNB installations by third parties
16 19 19 25
Public lighting, other matter on supply and customer services
18 34 23 12
TOTAL 117 190 147 144
Quality of Supply
Overvoltage 57 100 219 188
Power quality (dips, surges etc.) 3 4 6 2
TOTAL 60 104 225 190
OVERALL TOTAL 177 294 372 334
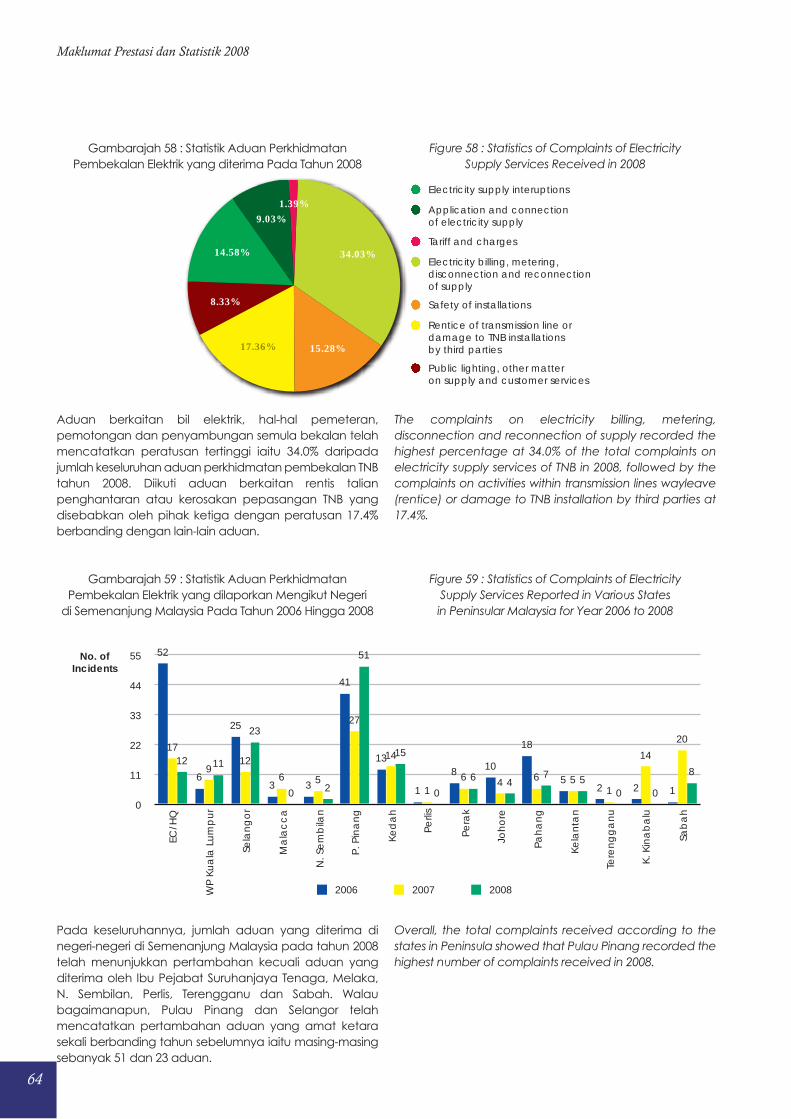
Gambarajah 58 : Statistik Aduan Perkhidmatan
Pembekalan Elektrik yang diterima Pada Tahun 2008
Aduan berkaitan bil elektrik, hal-hal pemeteran,
pemotongan dan penyambungan semula bekalan telah
mencatatkan peratusan tertinggi iaitu 34.0% daripada
jumlah keseluruhan aduan perkhidmatan pembekalan TNB
tahun 2008. Diikuti aduan berkaitan rentis talian
penghantaran atau kerosakan pepasangan TNB yang
disebabkan oleh pihak ketiga dengan peratusan 17.4%
berbanding dengan lain-lain aduan.
Gambarajah 59 : Statistik Aduan Perkhidmatan
Pembekalan Elektrik yang dilaporkan Mengikut Negeri
di Semenanjung Malaysia Pada Tahun 2006 Hingga 2008
Pada keseluruhannya, jumlah aduan yang diterima di
negeri-negeri di Semenanjung Malaysia pada tahun 2008
telah menunjukkan pertambahan kecuali aduan yang
diterima oleh Ibu Pejabat Suruhanjaya Tenaga, Melaka,
N. Sembilan, Perlis, Terengganu dan Sabah. Walau
bagaimanapun, Pulau Pinang dan Selangor telah
mencatatkan pertambahan aduan yang amat ketara
sekali berbanding tahun sebelumnya iaitu masing-masing
sebanyak 51 dan 23 aduan.
Figure 58 : Statistics of Complaints of Electricity
Supply Services Received in 2008
The complaints on electricity billing, metering,
disconnection and reconnection of supply recorded the
highest percentage at 34.0% of the total complaints on
electricity supply services of TNB in 2008, followed by the
complaints on activities within transmission lines wayleave
(rentice) or damage to TNB installation by third parties at
17.4%.
Figure 59 : Statistics of Complaints of Electricity
Supply Services Reported in Various States
in Peninsular Malaysia for Year 2006 to 2008
Overall, the total complaints received according to the
states in Peninsula showed that Pulau Pinang recorded the
highest number of complaints received in 2008.
64
Maklumat Prestasi dan Statistik 2008
8.33%
17.36% 15.28%
34.03%
1.39%9.03%
14.58%
Electricity supply interuptions
Application and connectionof electricity supply
Tariff and charges
Electricity billing, metering,disconnection and reconnectionof supply
Safety of installations
Rentice of transmission line ordamage to TNB installationsby third parties
Public lighting, other matteron supply and customer services
0
11
22
33
44
55
8
0057
46
0
15
51
20
23
1112
20
14
15646
1
14
27
56
129
17
1225
18
108
1
13
41
33
25
6
52
2006 2007 2008
No. ofIncidents
K. K
ina
ba
lu
Sab
ah
Tere
ng
ga
nu
Kela
nta
n
Pah
an
g
Joh
ore
Pera
k
Perli
s
Ked
ah
P. P
ina
ng
N. S
em
bila
n
Ma
lac
ca
Sela
ng
or
WP
Kua
la L
um
pu
r
EC/H
Q
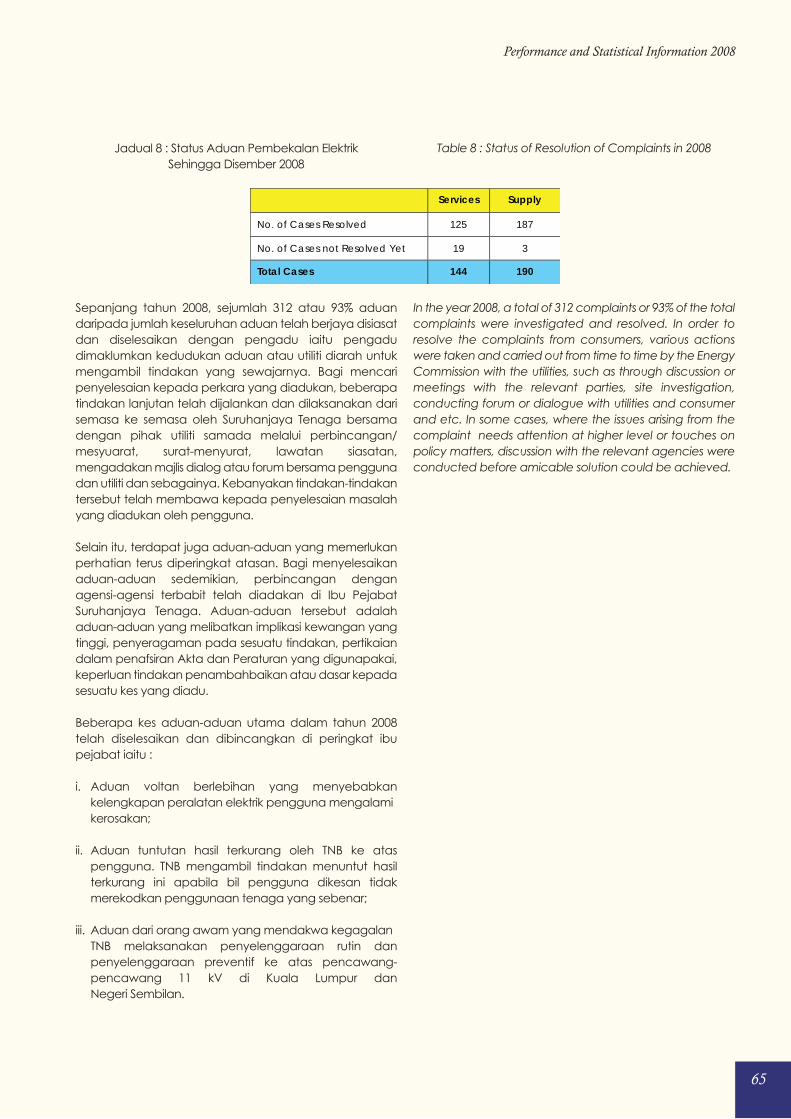
65
Performance and Statistical Information 2008
Jadual 8 : Status Aduan Pembekalan Elektrik
Sehingga Disember 2008
Sepanjang tahun 2008, sejumlah 312 atau 93% aduan
daripada jumlah keseluruhan aduan telah berjaya disiasat
dan diselesaikan dengan pengadu iaitu pengadu
dimaklumkan kedudukan aduan atau utiliti diarah untuk
mengambil tindakan yang sewajarnya. Bagi mencari
penyelesaian kepada perkara yang diadukan, beberapa
tindakan lanjutan telah dijalankan dan dilaksanakan dari
semasa ke semasa oleh Suruhanjaya Tenaga bersama
dengan pihak utiliti samada melalui perbincangan/
mesyuarat, surat-menyurat, lawatan siasatan,
mengadakan majlis dialog atau forum bersama pengguna
dan utiliti dan sebagainya. Kebanyakan tindakan-tindakan
tersebut telah membawa kepada penyelesaian masalah
yang diadukan oleh pengguna.
Selain itu, terdapat juga aduan-aduan yang memerlukan
perhatian terus diperingkat atasan. Bagi menyelesaikan
aduan-aduan sedemikian, perbincangan dengan
agensi-agensi terbabit telah diadakan di Ibu Pejabat
Suruhanjaya Tenaga. Aduan-aduan tersebut adalah
aduan-aduan yang melibatkan implikasi kewangan yang
tinggi, penyeragaman pada sesuatu tindakan, pertikaian
dalam penafsiran Akta dan Peraturan yang digunapakai,
keperluan tindakan penambahbaikan atau dasar kepada
sesuatu kes yang diadu.
Beberapa kes aduan-aduan utama dalam tahun 2008
telah diselesaikan dan dibincangkan di peringkat ibu
pejabat iaitu :
i. Aduan voltan berlebihan yang menyebabkan
kelengkapan peralatan elektrik pengguna mengalami
kerosakan;
ii. Aduan tuntutan hasil terkurang oleh TNB ke atas
pengguna. TNB mengambil tindakan menuntut hasil
terkurang ini apabila bil pengguna dikesan tidak
merekodkan penggunaan tenaga yang sebenar;
iii. Aduan dari orang awam yang mendakwa kegagalan
TNB melaksanakan penyelenggaraan rutin dan
penyelenggaraan preventif ke atas pencawang-
pencawang 11 kV di Kuala Lumpur dan
Negeri Sembilan.
Table 8 : Status of Resolution of Complaints in 2008
In the year 2008, a total of 312 complaints or 93% of the total
complaints were investigated and resolved. In order to
resolve the complaints from consumers, various actions
were taken and carried out from time to time by the Energy
Commission with the utilities, such as through discussion or
meetings with the relevant parties, site investigation,
conducting forum or dialogue with utilities and consumer
and etc. In some cases, where the issues arising from the
complaint needs attention at higher level or touches on
policy matters, discussion with the relevant agencies were
conducted before amicable solution could be achieved.
Services Supply
No. of Cases Resolved 125 187
No. of Cases not Resolved Yet 19 3
Total Cases 144 190
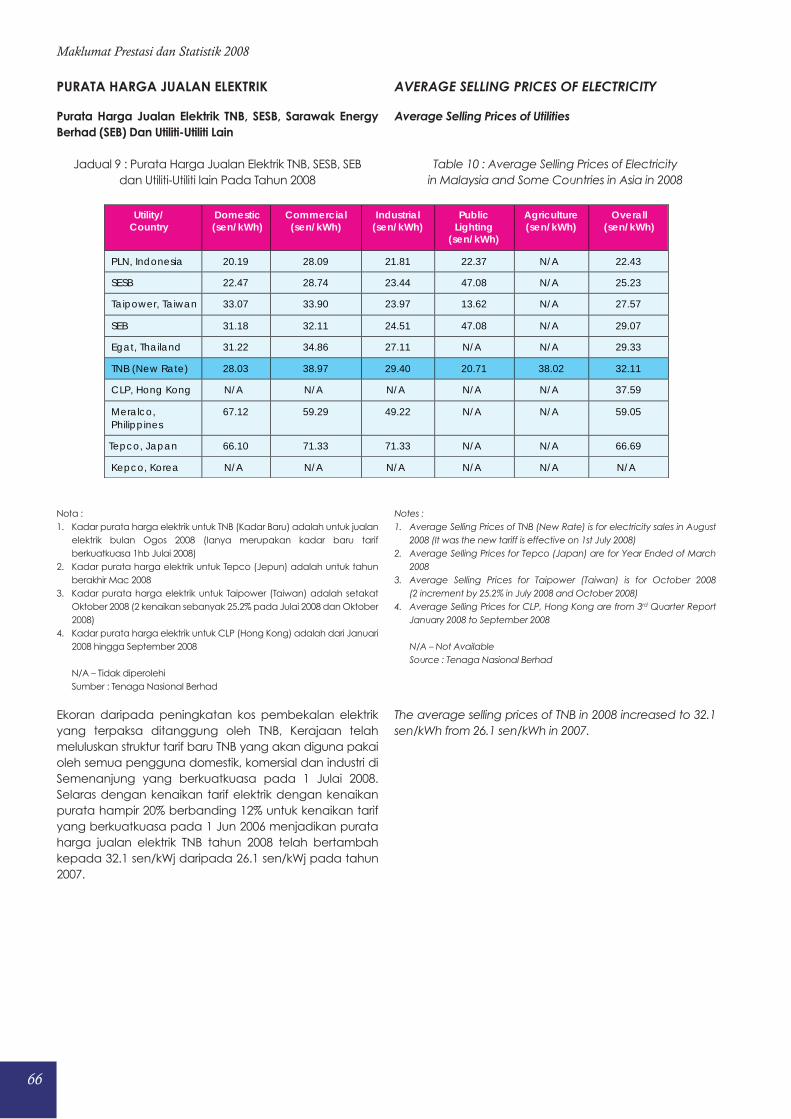
66
Maklumat Prestasi dan Statistik 2008
Purata Harga Jualan Elektrik TNB, SESB, Sarawak Energy
Berhad (SEB) Dan Utiliti-Utiliti Lain
Jadual 9 : Purata Harga Jualan Elektrik TNB, SESB, SEB
dan Utiliti-Utiliti lain Pada Tahun 2008
Nota :
1. Kadar purata harga elektrik untuk TNB (Kadar Baru) adalah untuk jualan
elektrik bulan Ogos 2008 (Ianya merupakan kadar baru tarif
berkuatkuasa 1hb Julai 2008)
2. Kadar purata harga elektrik untuk Tepco (Jepun) adalah untuk tahun
berakhir Mac 2008
3. Kadar purata harga elektrik untuk Taipower (Taiwan) adalah setakat
Oktober 2008 (2 kenaikan sebanyak 25.2% pada Julai 2008 dan Oktober
2008)
4. Kadar purata harga elektrik untuk CLP (Hong Kong) adalah dari Januari
2008 hingga September 2008
N/A – Tidak diperolehi
Sumber : Tenaga Nasional Berhad
Ekoran daripada peningkatan kos pembekalan elektrik
yang terpaksa ditanggung oleh TNB, Kerajaan telah
meluluskan struktur tarif baru TNB yang akan diguna pakai
oleh semua pengguna domestik, komersial dan industri di
Semenanjung yang berkuatkuasa pada 1 Julai 2008.
Selaras dengan kenaikan tarif elektrik dengan kenaikan
purata hampir 20% berbanding 12% untuk kenaikan tarif
yang berkuatkuasa pada 1 Jun 2006 menjadikan purata
harga jualan elektrik TNB tahun 2008 telah bertambah
kepada 32.1 sen/kWj daripada 26.1 sen/kWj pada tahun
2007.
Average Selling Prices of Utilities
Table 10 : Average Selling Prices of Electricity
in Malaysia and Some Countries in Asia in 2008
Notes :
1. Average Selling Prices of TNB (New Rate) is for electricity sales in August
2008 (It was the new tariff is effective on 1st July 2008)
2. Average Selling Prices for Tepco (Japan) are for Year Ended of March
2008
3. Average Selling Prices for Taipower (Taiwan) is for October 2008
(2 increment by 25.2% in July 2008 and October 2008)
4. Average Selling Prices for CLP, Hong Kong are from 3rd Quarter Report
January 2008 to September 2008
N/A – Not Available
Source : Tenaga Nasional Berhad
The average selling prices of TNB in 2008 increased to 32.1
sen/kWh from 26.1 sen/kWh in 2007.
PURATA HARGA JUALAN ELEKTRIK AVERAGE SELLING PRICES OF ELECTRICITY
Utility/Country
Domestic(sen/kWh)
Commercial(sen/kWh)
Industrial(sen/kWh)
PublicLighting
(sen/kWh)
Agriculture(sen/kWh)
Overall(sen/kWh)
PLN, Indonesia 20.19 28.09 21.81 22.37 N/A 22.43
SESB 22.47 28.74 23.44 47.08 N/A 25.23
Taipower, Taiwan 33.07 33.90 23.97 13.62 N/A 27.57
SEB 31.18 32.11 24.51 47.08 N/A 29.07
Egat, Thailand 31.22 34.86 27.11 N/A N/A 29.33
TNB (New Rate) 28.03 38.97 29.40 20.71 38.02 32.11
CLP, Hong Kong N/A N/A N/A N/A N/A 37.59
Meralco, Philippines
67.12 59.29 49.22 N/A N/A 59.05
Tepco, Japan 66.10 71.33 71.33 N/A N/A 66.69
Kepco, Korea N/A N/A N/A N/A N/A N/A
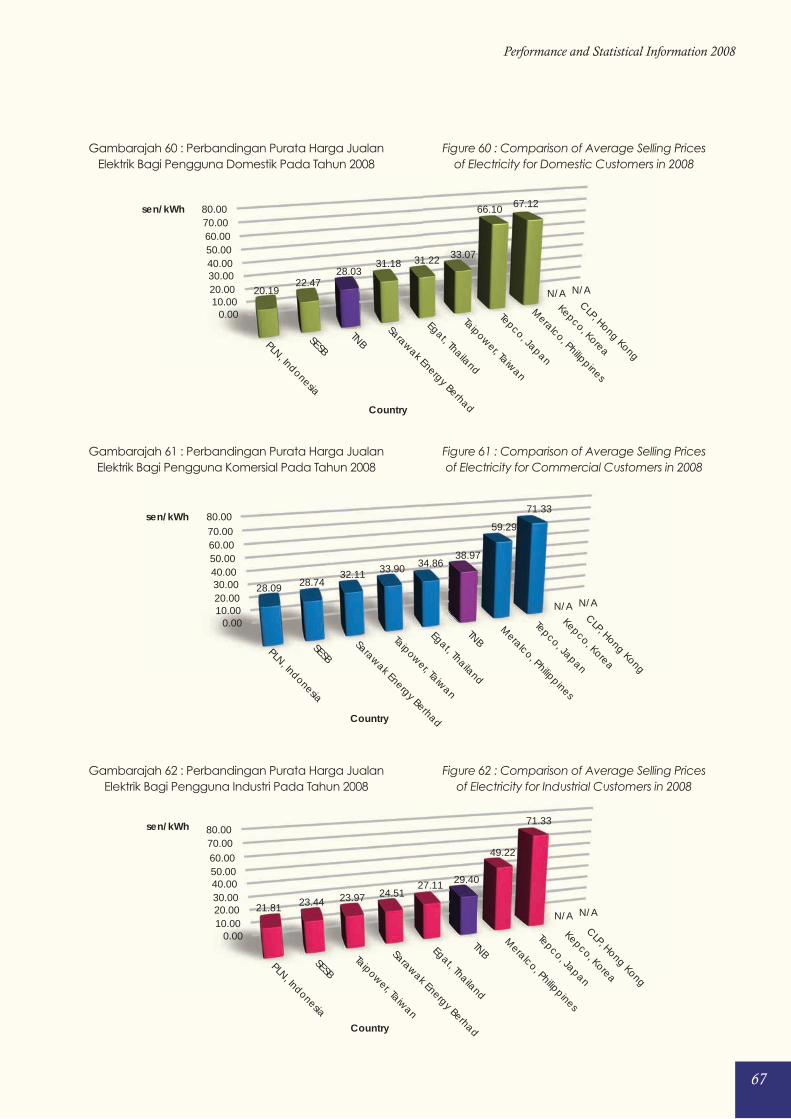
67
Performance and Statistical Information 2008
Gambarajah 60 : Perbandingan Purata Harga Jualan
Elektrik Bagi Pengguna Domestik Pada Tahun 2008
Gambarajah 61 : Perbandingan Purata Harga Jualan
Elektrik Bagi Pengguna Komersial Pada Tahun 2008
Gambarajah 62 : Perbandingan Purata Harga Jualan
Elektrik Bagi Pengguna Industri Pada Tahun 2008
Figure 60 : Comparison of Average Selling Prices
of Electricity for Domestic Customers in 2008
Figure 61 : Comparison of Average Selling Prices
of Electricity for Commercial Customers in 2008
Figure 62 : Comparison of Average Selling Prices
of Electricity for Industrial Customers in 2008
0.0010.0020.0030.0040.0050.0060.0070.0080.00
20.1922.47
28.0331.18 31.22 33.07
66.10 67.12
N/A N/A
PLN, Indonesia
SESB
TNBSarawak Energy Berhad
Egat, Thailand
Taipower, Taiwan
Tepco, Japan
Meralco, Philippines
Kepco, Korea
CLP, Hong Kong
Country
sen/kWh
0.0010.0020.0030.0040.0050.0060.0070.0080.00
28.09 28.7432.11 33.90 34.86
38.97
59.29
71.33
PLN, Indonesia
SESBSarawak Energy Berhad
Taipower, Taiwan
Egat, Thailand
TNBM
eralco, Philippines
Tepco, Japan
Kepco, Korea
CLP, Hong Kong
Country
sen/kWh
N/A N/A
0.0010.0020.0030.0040.0050.0060.0070.0080.00
21.81 23.44 23.97 24.5127.11 29.40
49.22
71.33
PLN, Indonesia
SESBTaipower, Taiwan
Sarawak Energy Berhad
Egat, Thailand
TNBM
eralco, Philippines
Tepco, Japan
Kepco, Korea
CLP, Hong Kong
sen/kWh
N/A N/A
Country
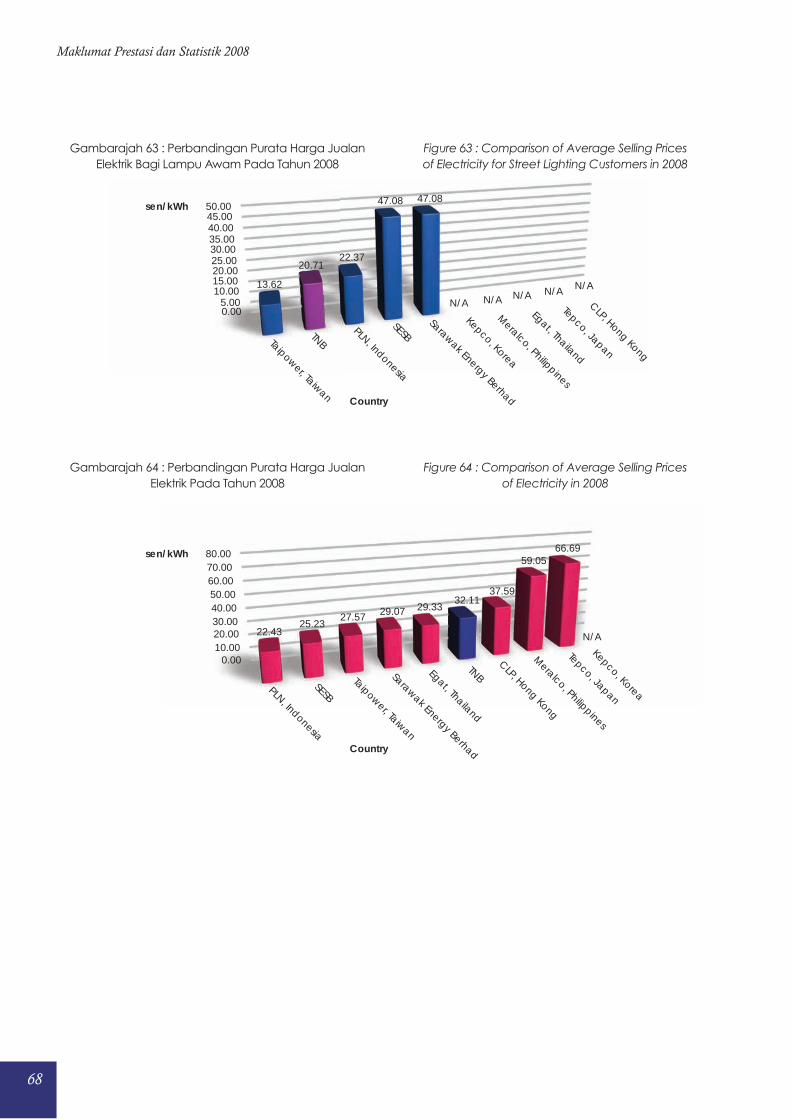
68
Maklumat Prestasi dan Statistik 2008
Gambarajah 63 : Perbandingan Purata Harga Jualan
Elektrik Bagi Lampu Awam Pada Tahun 2008
Gambarajah 64 : Perbandingan Purata Harga Jualan
Elektrik Pada Tahun 2008
Figure 63 : Comparison of Average Selling Prices
of Electricity for Street Lighting Customers in 2008
Figure 64 : Comparison of Average Selling Prices
of Electricity in 2008
0.005.00
10.0015.0020.0025.0030.0035.0040.0045.0050.00
13.62
20.7122.37
47.08 47.08
Taipower, Taiwan
TNBPLN, Indonesia
SESBSarawak Energy Berhad
Kepco, Korea
Meralco, Philippines
Egat, Thailand
Tepco, Japan
CLP, Hong Kong
sen/kWh
Country
N/A N/AN/A N/A
N/A
0.0010.0020.0030.0040.0050.0060.0070.0080.00
22.4325.23
27.57 29.07 29.3332.11
37.59
59.0566.69
N/A
PLN, Indonesia
SESB
Taipower, Taiwan
Sarawak Energy Berhad
Egat, Thailand
TNBCLP, Hong Kong
Meralco, Philippines
Tepco, Japan
Kepco, Korea
sen/kWh
Country

69
Performance and Statistical Information 2008
LAMPIRAN I • APPENDIX I
LAPORAN PRESTASI PERKHIDMATAN TNB UNTUK TAHUN 2004 HINGGA 2008
REPORT ON THE PERFORMANCE OF CUSTOMER SERVICES OF TNB FOR YEARS 2004 TO 2008

70
Maklumat Prestasi dan Statistik 2008
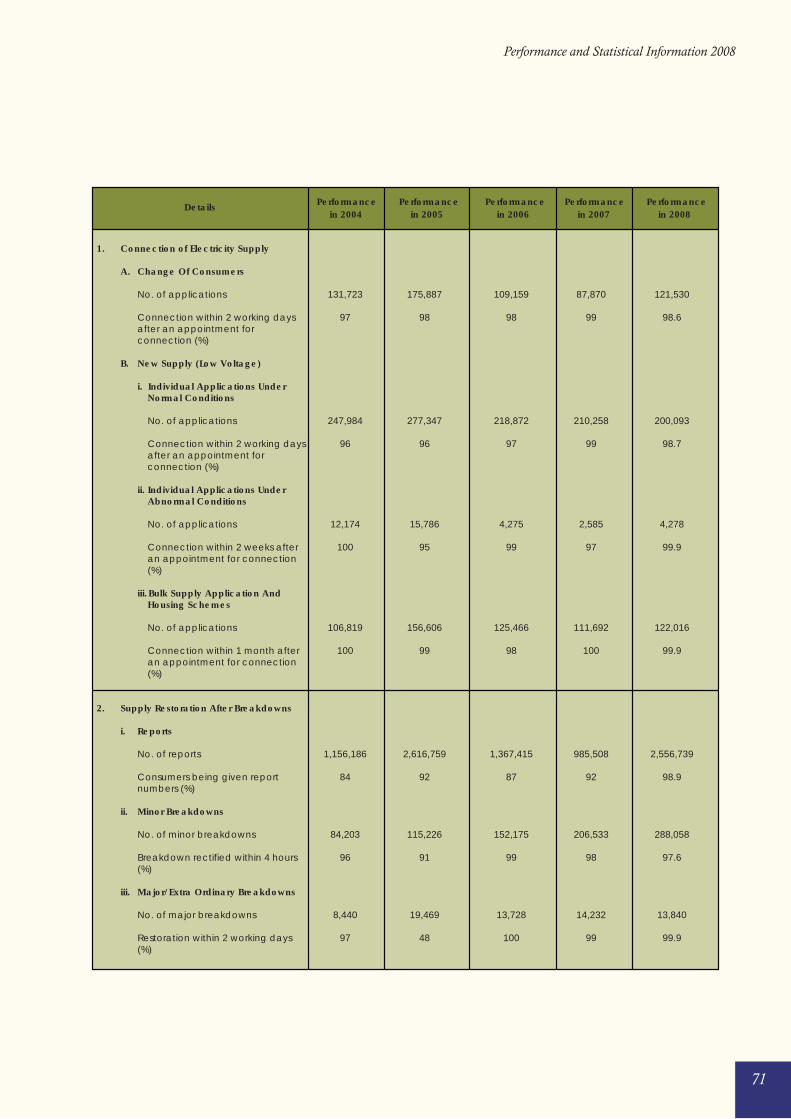
71
Performance and Statistical Information 2008
Details Performance in 2004
Performance in 2005
Performance in 2006
Performance in 2007
Performance in 2008
1. Connection of Electricity Supply
A. Change Of Consumers
No. of applications
Connection within 2 working days after an appointment for connection (%)
B. New Supply (Low Voltage)
i. Individual Applications Under Normal Conditions
No. of applications
Connection within 2 working days after an appointment for connection (%)
ii. Individual Applications Under Abnormal Conditions
No. of applications
Connection within 2 weeks after an appointment for connection (%)
iii. Bulk Supply Application And Housing Schemes
No. of applications
Connection within 1 month after an appointment for connection (%)
2. Supply Restoration After Breakdowns
i. Reports
No. of reports
Consumers being given report numbers (%)
ii. Minor Breakdowns
No. of minor breakdowns
Breakdown rectified within 4 hours (%)
iii. Major/Extra Ordinary Breakdowns
No. of major breakdowns
Restoration within 2 working days (%)
131,723
97
247,984
96
12,174
100
106,819
100
1,156,186
84
84,203
96
8,440
97
175,887
98
277,347
96
15,786
95
156,606
99
2,616,759
92
115,226
91
19,469
48
109,159
98
218,872
97
4,275
99
125,466
98
1,367,415
87
152,175
99
13,728
100
87,870
99
210,258
99
2,585
97
111,692
100
985,508
92
206,533
98
14,232
99
121,530
98.6
200,093
98.7
4,278
99.9
122,016
99.9
2,556,739
98.9
288,058
97.6
13,840
99.9
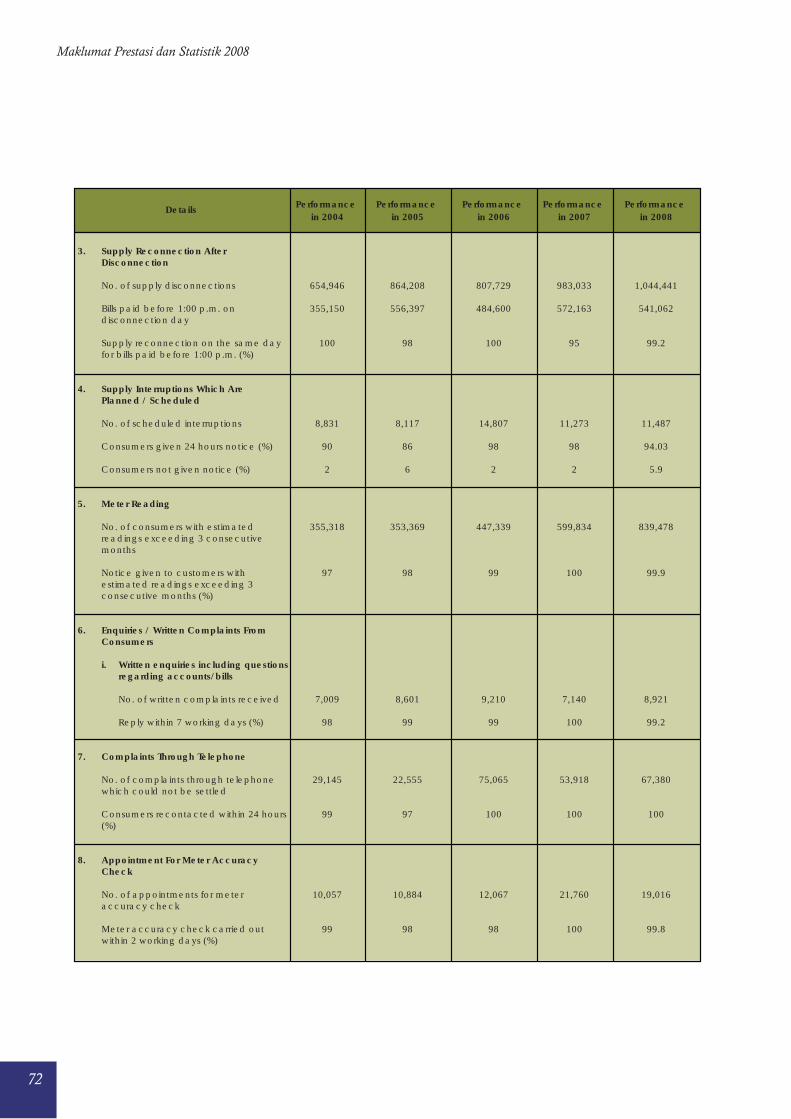
72
Maklumat Prestasi dan Statistik 2008
Details Performance in 2004
Performance in 2005
Performance in 2006
Performance in 2007
Performance in 2008
3. Supply Reconnection After Disconnection
No. of supply disconnections
Bills paid before 1:00 p.m. on disconnection day
Supply reconnection on the same day for bills paid before 1:00 p.m. (%)
4. Supply Interruptions Which Are Planned / Scheduled
No. of scheduled interruptions
Consumers given 24 hours notice (%)
Consumers not given notice (%)
5. Meter Reading
No. of consumers with estimated readings exceeding 3 consecutive months
Notice given to customers with estimated readings exceeding 3 consecutive months (%)
6. Enquiries / Written Complaints From Consumers
i. Written enquiries including questions regarding accounts/bills
No. of written complaints received
Reply within 7 working days (%)
7. Complaints Through Telephone
No. of complaints through telephone which could not be settled
Consumers recontacted within 24 hours (%)
8. Appointment For Meter Accuracy Check
No. of appointments for meter accuracy check
Meter accuracy check carried out within 2 working days (%)
654,946
355,150
100
8,831
90
2
355,318
97
7,009
98
29,145
99
10,057
99
864,208
556,397
98
8,117
86
6
353,369
98
8,601
99
22,555
97
10,884
98
807,729
484,600
100
14,807
98
2
447,339
99
9,210
99
75,065
100
12,067
98
983,033
572,163
95
11,273
98
2
599,834
100
7,140
100
53,918
100
21,760
100
1,044,441
541,062
99.2
11,487
94.03
5.9
839,478
99.9
8,921
99.2
67,380
100
19,016
99.8
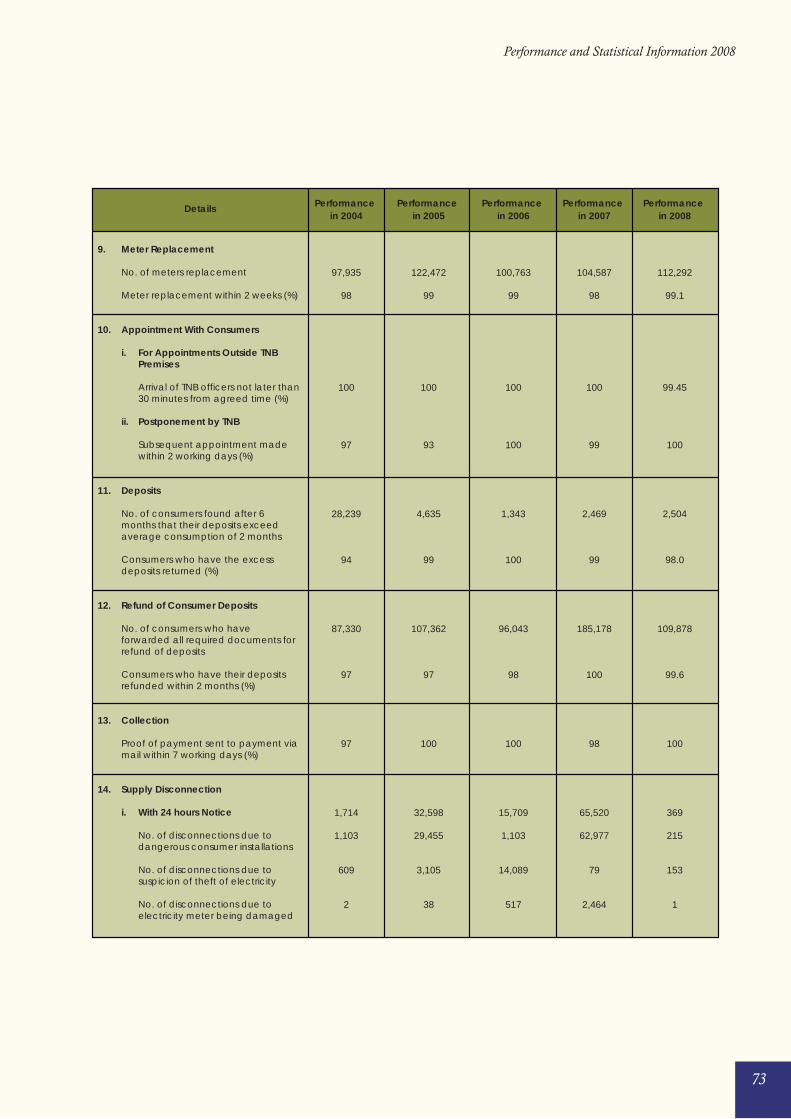
73
Performance and Statistical Information 2008
Details Performance in 2004
Performance in 2005
Performance in 2006
Performance in 2007
Performance in 2008
9. Meter Replacement
No. of meters replacement
Meter replacement within 2 weeks (%)
10. Appointment With Consumers
i. For Appointments Outside TNB Premises
Arrival of TNB officers not later than 30 minutes from agreed time (%)
ii. Postponement by TNB
Subsequent appointment made within 2 working days (%)
11. Deposits
No. of consumers found after 6 months that their deposits exceed average consumption of 2 months
Consumers who have the excess deposits returned (%)
12. Refund of Consumer Deposits
No. of consumers who have forwarded all required documents for refund of deposits
Consumers who have their deposits refunded within 2 months (%)
13. Collection
Proof of payment sent to payment via mail within 7 working days (%)
14. Supply Disconnection
i. With 24 hours Notice
No. of disconnections due to dangerous consumer installations
No. of disconnections due to suspicion of theft of electricity
No. of disconnections due to electricity meter being damaged
97,935
98
100
97
28,239
94
87,330
97
97
1,714
1,103
609
2
122,472
99
100
93
4,635
99
107,362
97
100
32,598
29,455
3,105
38
100,763
99
100
100
1,343
100
96,043
98
100
15,709
1,103
14,089
517
104,587
98
100
99
2,469
99
185,178
100
98
65,520
62,977
79
2,464
112,292
99.1
99.45
100
2,504
98.0
109,878
99.6
100
369
215
153
1
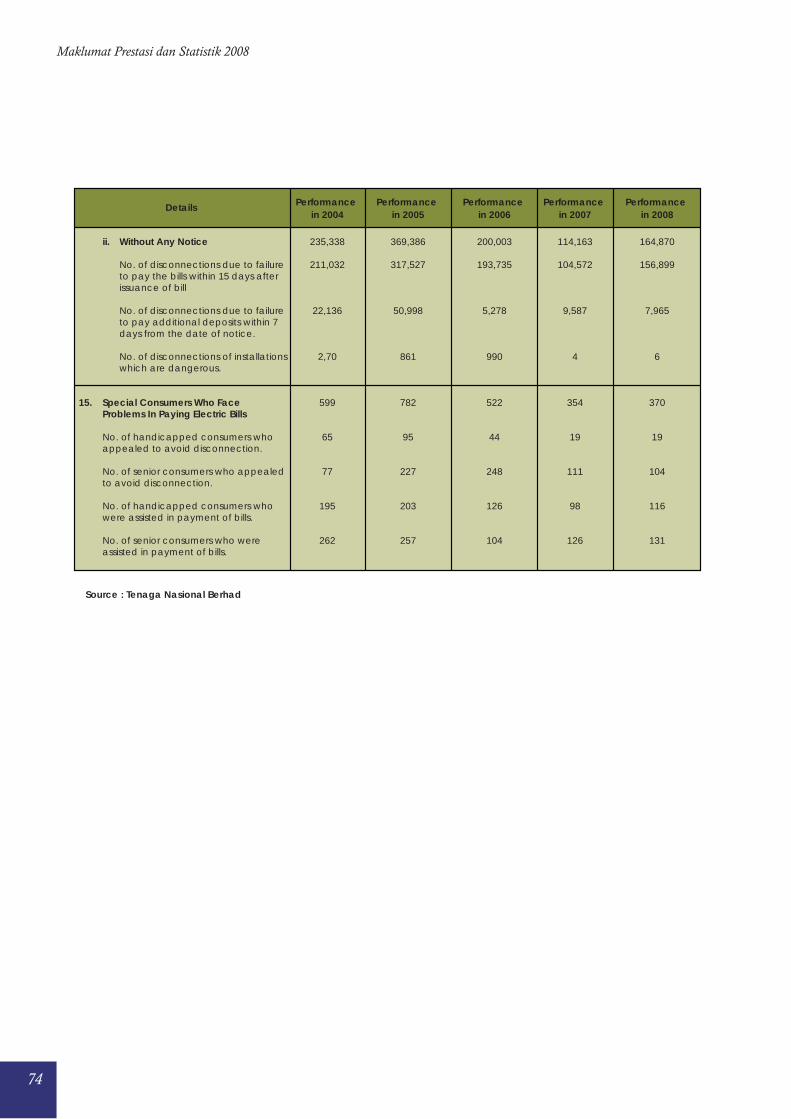
74
Maklumat Prestasi dan Statistik 2008
Details Performance in 2004
Performance in 2005
Performance in 2006
Performance in 2007
Performance in 2008
Source : Tenaga Nasional Berhad
ii. Without Any Notice
No. of disconnections due to failure to pay the bills within 15 days after issuance of bill
No. of disconnections due to failure to pay additional deposits within 7 days from the date of notice.
No. of disconnections of installations which are dangerous.
15. Special Consumers Who Face Problems In Paying Electric Bills
No. of handicapped consumers who appealed to avoid disconnection.
No. of senior consumers who appealed to avoid disconnection.
No. of handicapped consumers who were assisted in payment of bills.
No. of senior consumers who were assisted in payment of bills.
235,338
211,032
22,136
2,70
599
65
77
195
262
369,386
317,527
50,998
861
782
95
227
203
257
200,003
193,735
5,278
990
522
44
248
126
104
114,163
104,572
9,587
4
354
19
111
98
126
164,870
156,899
7,965
6
370
19
104
116
131

75
Performance and Statistical Information 2008
LAMPIRAN II • APPENDIX II
LAPORAN PRESTASI PERKHIDMATAN SESB UNTUK TAHUN 2004 HINGGA 2008
REPORT ON THE PERFORMANCE OF CUSTOMER SERVICES OF SESB FOR YEARS 2004 TO 2008

76
Maklumat Prestasi dan Statistik 2008
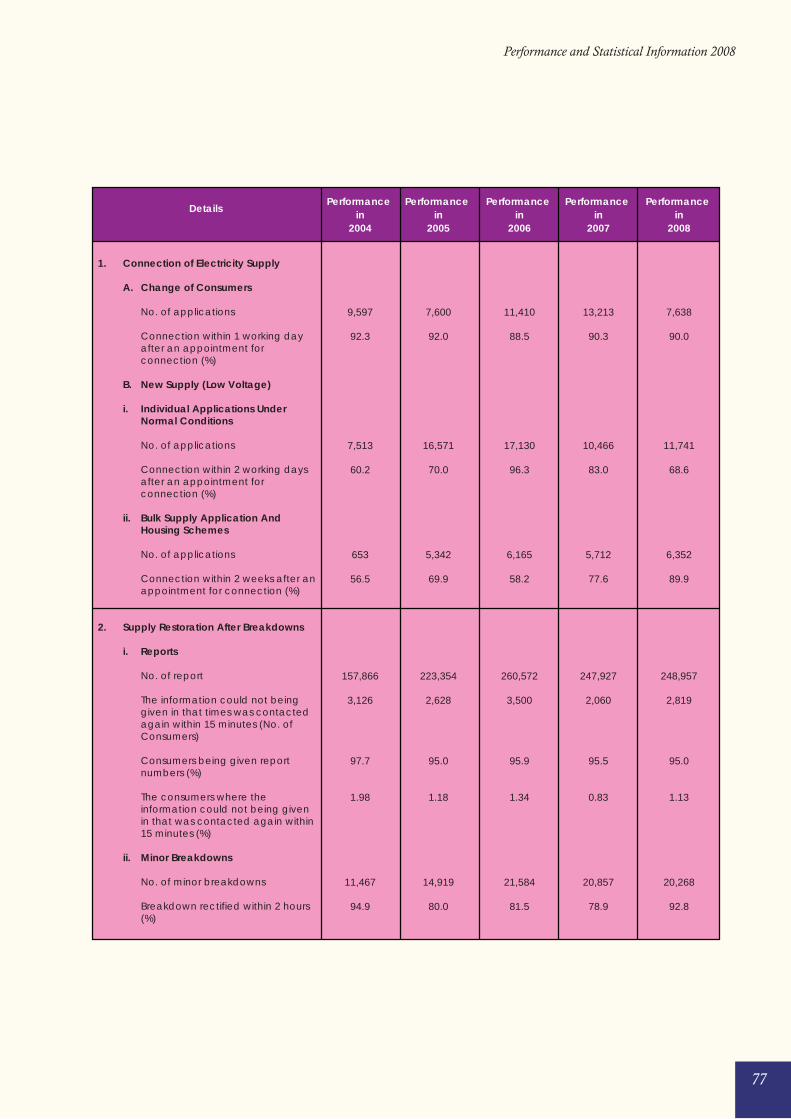
77
Performance and Statistical Information 2008
DetailsPerformance
in2004
Performance in
2005
Performance in
2006
Performance in
2007
Performance in
2008
1. Connection of Electricity Supply
A. Change of Consumers
No. of applications
Connection within 1 working day after an appointment for connection (%)
B. New Supply (Low Voltage)
i. Individual Applications Under Normal Conditions
No. of applications
Connection within 2 working days after an appointment for connection (%)
ii. Bulk Supply Application And Housing Schemes
No. of applications
Connection within 2 weeks after an appointment for connection (%)
2. Supply Restoration After Breakdowns
i. Reports
No. of report
The information could not being given in that times was contacted again within 15 minutes (No. of Consumers)
Consumers being given report numbers (%)
The consumers where the information could not being given in that was contacted again within 15 minutes (%)
ii. Minor Breakdowns
No. of minor breakdowns
Breakdown rectified within 2 hours (%)
9,597
92.3
7,513
60.2
653
56.5
157,866
3,126
97.7
1.98
11,467
94.9
7,600
92.0
16,571
70.0
5,342
69.9
223,354
2,628
95.0
1.18
14,919
80.0
11,410
88.5
17,130
96.3
6,165
58.2
260,572
3,500
95.9
1.34
21,584
81.5
13,213
90.3
10,466
83.0
5,712
77.6
247,927
2,060
95.5
0.83
20,857
78.9
7,638
90.0
11,741
68.6
6,352
89.9
248,957
2,819
95.0
1.13
20,268
92.8

78
Maklumat Prestasi dan Statistik 2008
DetailsPerformance
in2004
Performance in
2005
Performance in
2006
Performance in
2007
Performance in
2008
iii. Major/Extra Ordinary Breakdowns
No. of major breakdowns
Restoration within 12 hours (%)
3. Supply Reconnection After Disconnection
No. of supply disconnections
Bills paid before 1:00 p.m. on disconnection day
Supply reconnection on the same day for bills paid before 1:00 p.m. (%)
4. Supply Interruptions Which Are Planned / Scheduled
i) Scheduled Interruptions
No. of scheduled interruptions
Consumers being given notice within 7 days before interruptions (%)
ii) Planning of Scheduled Interruptions
No. of scheduled interruptions planning of yearly and monthly
No. of large consumers which was expected affecting
No. of large consumers which was expected affecting informed about the planning of scheduled interruptions (%)
5. Meter Reading
No. of consumers with estimated readings exceeding 3 consecutive months
Notice given to customers with estimated readings exceeding 3 consecutive months (%)
791
89.9
52,126
26,793
98.2
1,003
72.9
70
9,393
90.7
12,215
47.5
3,124
90.0
56,746
55,611
98.0
1,659
80.0
231
30,052
90.0
13,251
49.5
928
81.9
74,474
70,510
94.7
2,010
80.0
154
120,099
82.5
4,398
1.32
2,993
79.3
77,350
42,681
55.2
618
66.4
320
164,790
100.0
5,525
50.0
404
96.5
86,317
60,421
70.0
3,020
70.0
332
78,625
93.8
6,762
50.0
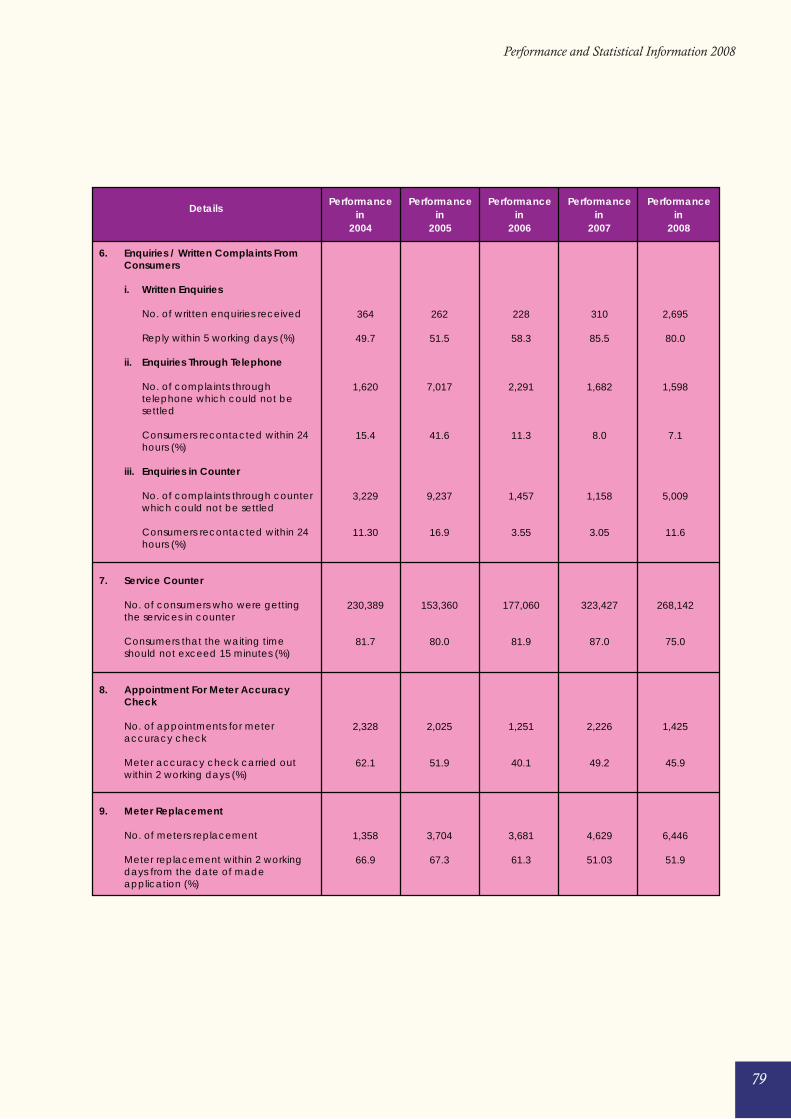
79
Performance and Statistical Information 2008
DetailsPerformance
in2004
Performance in
2005
Performance in
2006
Performance in
2007
Performance in
2008
6. Enquiries / Written Complaints From Consumers
i. Written Enquiries
No. of written enquiries received
Reply within 5 working days (%)
ii. Enquiries Through Telephone
No. of complaints through telephone which could not be settled
Consumers recontacted within 24 hours (%)
iii. Enquiries in Counter
No. of complaints through counter which could not be settled
Consumers recontacted within 24 hours (%)
7. Service Counter
No. of consumers who were getting the services in counter
Consumers that the waiting time should not exceed 15 minutes (%)
8. Appointment For Meter Accuracy Check
No. of appointments for meter accuracy check
Meter accuracy check carried out within 2 working days (%)
9. Meter Replacement
No. of meters replacement
Meter replacement within 2 working days from the date of made application (%)
364
49.7
1,620
15.4
3,229
11.30
230,389
81.7
2,328
62.1
1,358
66.9
262
51.5
7,017
41.6
9,237
16.9
153,360
80.0
2,025
51.9
3,704
67.3
228
58.3
2,291
11.3
1,457
3.55
177,060
81.9
1,251
40.1
3,681
61.3
310
85.5
1,682
8.0
1,158
3.05
323,427
87.0
2,226
49.2
4,629
51.03
2,695
80.0
1,598
7.1
5,009
11.6
268,142
75.0
1,425
45.9
6,446
51.9
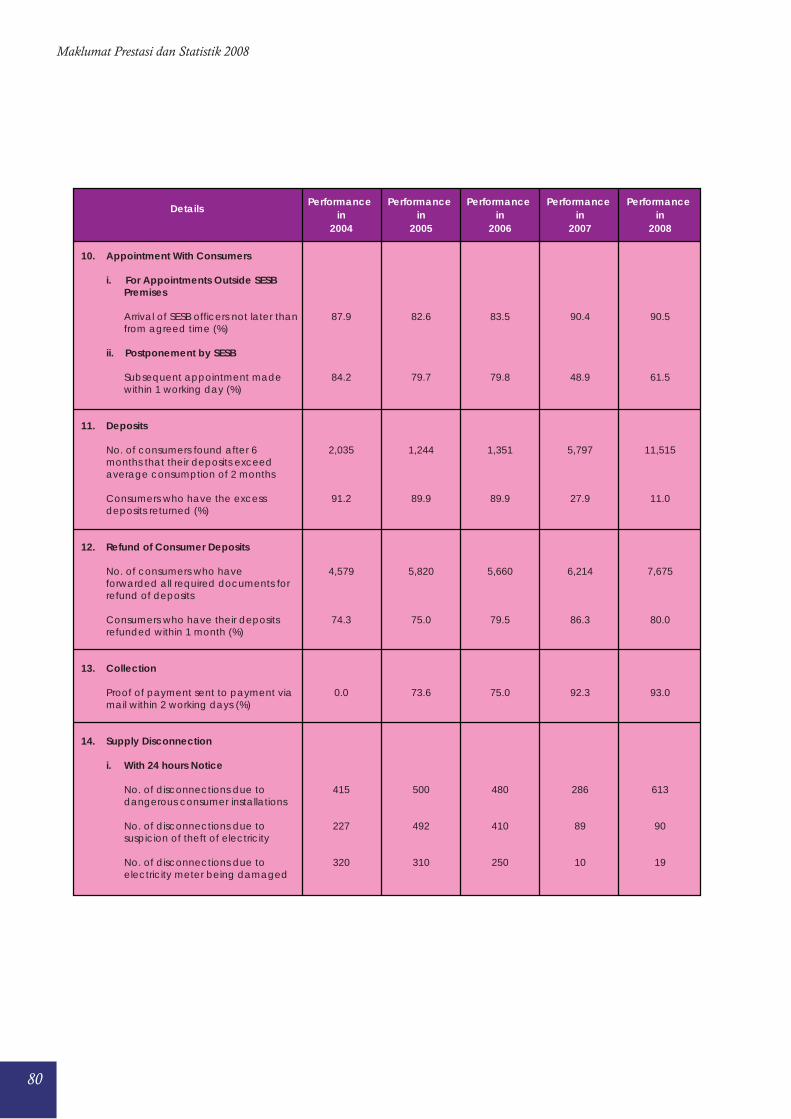
80
Maklumat Prestasi dan Statistik 2008
DetailsPerformance
in2004
Performance in
2005
Performance in
2006
Performance in
2007
Performance in
2008
10. Appointment With Consumers
i. For Appointments Outside SESB Premises
Arrival of SESB officers not later than from agreed time (%)
ii. Postponement by SESB
Subsequent appointment made within 1 working day (%)
11. Deposits
No. of consumers found after 6 months that their deposits exceed average consumption of 2 months
Consumers who have the excess deposits returned (%)
12. Refund of Consumer Deposits
No. of consumers who have forwarded all required documents for refund of deposits
Consumers who have their deposits refunded within 1 month (%)
13. Collection
Proof of payment sent to payment via mail within 2 working days (%)
14. Supply Disconnection
i. With 24 hours Notice
No. of disconnections due to dangerous consumer installations
No. of disconnections due to suspicion of theft of electricity
No. of disconnections due to electricity meter being damaged
87.9
84.2
2,035
91.2
4,579
74.3
0.0
415
227
320
82.6
79.7
1,244
89.9
5,820
75.0
73.6
500
492
310
83.5
79.8
1,351
89.9
5,660
79.5
75.0
480
410
250
90.4
48.9
5,797
27.9
6,214
86.3
92.3
286
89
10
90.5
61.5
11,515
11.0
7,675
80.0
93.0
613
90
19
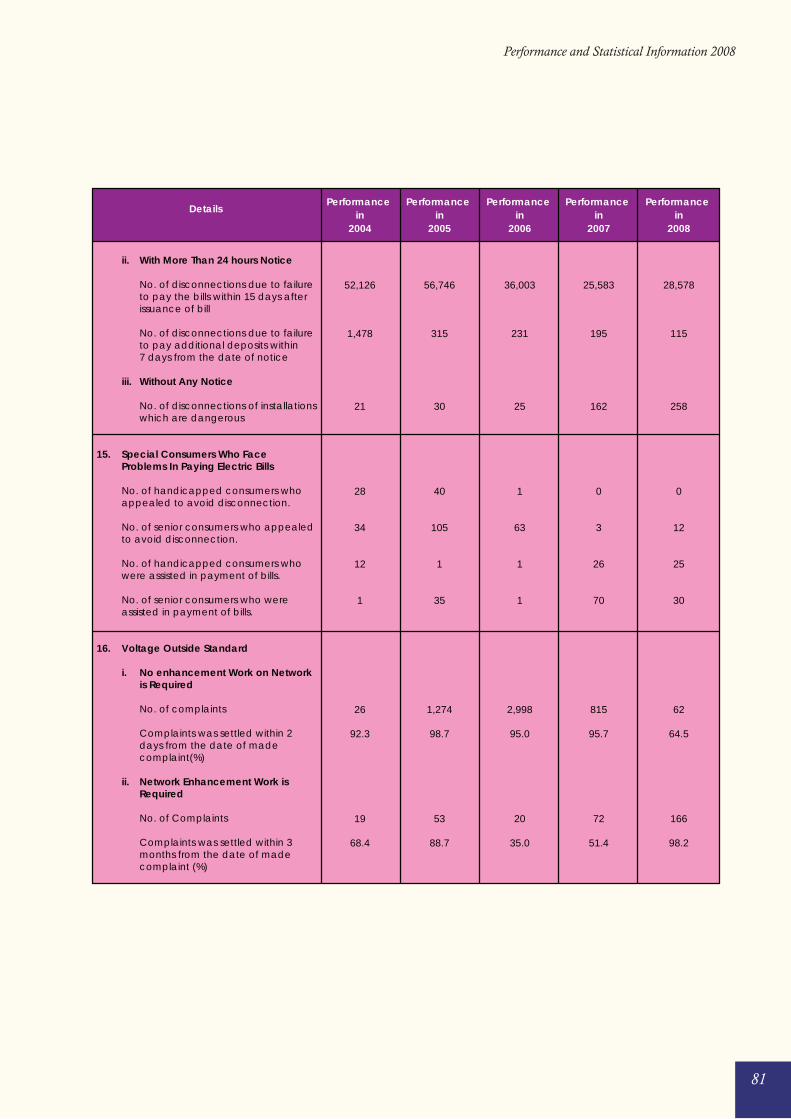
81
Performance and Statistical Information 2008
DetailsPerformance
in2004
Performance in
2005
Performance in
2006
Performance in
2007
Performance in
2008
ii. With More Than 24 hours Notice
No. of disconnections due to failure to pay the bills within 15 days after issuance of bill
No. of disconnections due to failure to pay additional deposits within 7 days from the date of notice
iii. Without Any Notice
No. of disconnections of installations which are dangerous
15. Special Consumers Who Face Problems In Paying Electric Bills
No. of handicapped consumers who appealed to avoid disconnection.
No. of senior consumers who appealed to avoid disconnection.
No. of handicapped consumers who were assisted in payment of bills.
No. of senior consumers who were assisted in payment of bills.
16. Voltage Outside Standard
i. No enhancement Work on Network is Required
No. of complaints
Complaints was settled within 2 days from the date of made complaint(%)
ii. Network Enhancement Work is Required
No. of Complaints
Complaints was settled within 3 months from the date of made complaint (%)
52,126
1,478
21
28
34
12
1
26
92.3
19
68.4
56,746
315
30
40
105
1
35
1,274
98.7
53
88.7
36,003
231
25
1
63
1
1
2,998
95.0
20
35.0
25,583
195
162
0
3
26
70
815
95.7
72
51.4
28,578
115
258
0
12
25
30
62
64.5
166
98.2
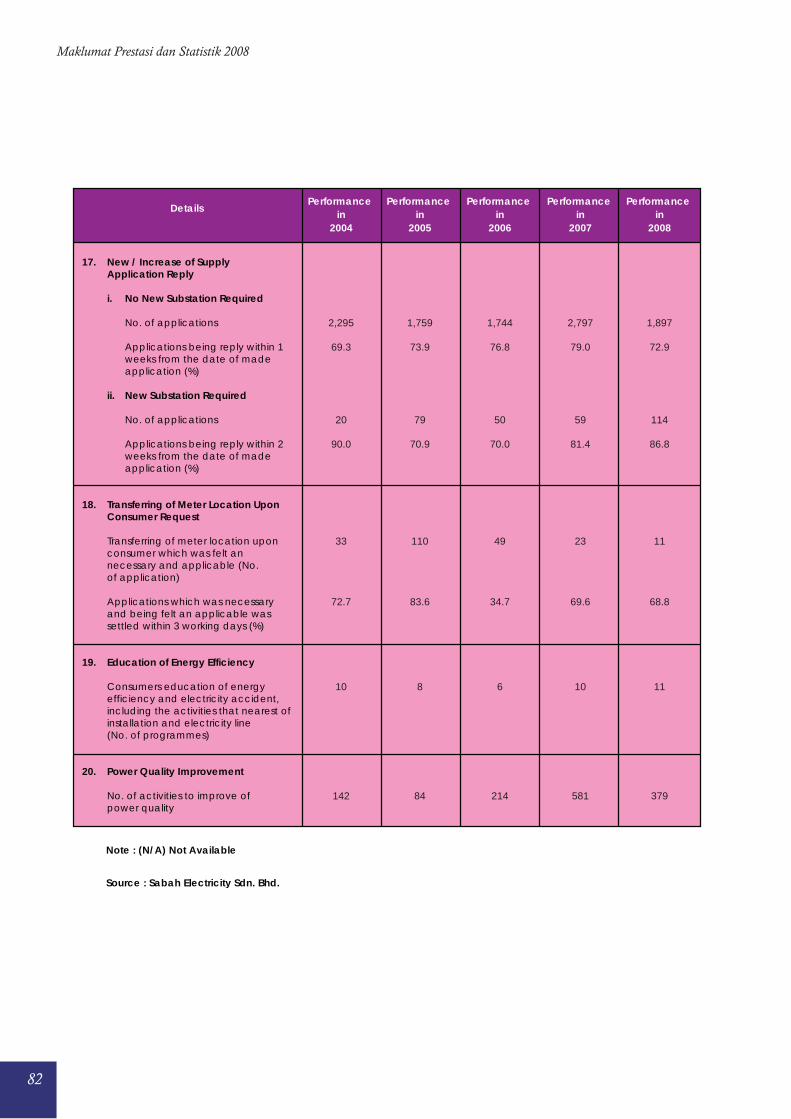
82
Maklumat Prestasi dan Statistik 2008
DetailsPerformance
in2004
Performance in
2005
Performance in
2006
Performance in
2007
Performance in
2008
Note : (N/A) Not Available
Source : Sabah Electricity Sdn. Bhd.
17. New / Increase of Supply Application Reply
i. No New Substation Required
No. of applications
Applications being reply within 1 weeks from the date of made application (%)
ii. New Substation Required
No. of applications
Applications being reply within 2 weeks from the date of made application (%)
18. Transferring of Meter Location Upon Consumer Request
Transferring of meter location upon consumer which was felt an necessary and applicable (No. of application)
Applications which was necessary and being felt an applicable was settled within 3 working days (%)
19. Education of Energy Efficiency
Consumers education of energy efficiency and electricity accident, including the activities that nearest of installation and electricity line (No. of programmes)
20. Power Quality Improvement
No. of activities to improve of power quality
2,295
69.3
20
90.0
33
72.7
10
142
1,759
73.9
79
70.9
110
83.6
8
84
1,744
76.8
50
70.0
49
34.7
6
214
2,797
79.0
59
81.4
23
69.6
10
581
1,897
72.9
114
86.8
11
68.8
11
379

83
Performance and Statistical Information 2008
LAMPIRAN III • APPENDIX III
LAPORAN PRESTASI PERKHIDMATAN NUR DISTRIBUTION SDN. BHD.
PADA TAHUN 2005 HINGGA 2008
REPORT ON THE PERFORMANCE OF CUSTOMER SERVICES OF NUR DISTRIBUTION SDN BHD
FOR THE YEARS 2005 TO 2008

84
Maklumat Prestasi dan Statistik 2008
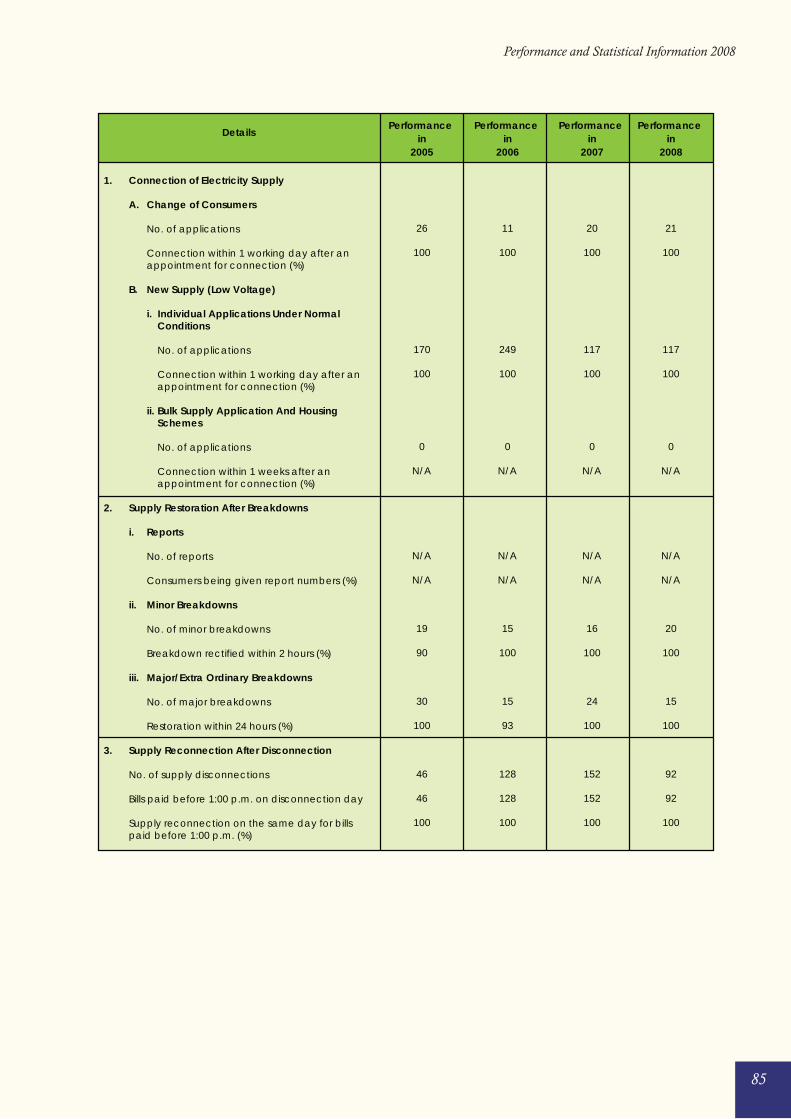
85
Performance and Statistical Information 2008
Details
Performance in
2005
Performance in
2006
Performance in
2007
Performance in
2008
1. Connection of Electricity Supply
A. Change of Consumers
No. of applications
Connection within 1 working day after an appointment for connection (%)
B. New Supply (Low Voltage)
i. Individual Applications Under Normal Conditions
No. of applications
Connection within 1 working day after an appointment for connection (%)
ii. Bulk Supply Application And Housing Schemes
No. of applications
Connection within 1 weeks after an appointment for connection (%)
2. Supply Restoration After Breakdowns
i. Reports
No. of reports
Consumers being given report numbers (%)
ii. Minor Breakdowns
No. of minor breakdowns
Breakdown rectified within 2 hours (%)
iii. Major/Extra Ordinary Breakdowns
No. of major breakdowns
Restoration within 24 hours (%)
3. Supply Reconnection After Disconnection
No. of supply disconnections
Bills paid before 1:00 p.m. on disconnection day
Supply reconnection on the same day for bills paid before 1:00 p.m. (%)
26
100
170
100
0
N/A
N/A
N/A
19
90
30
100
46
46
100
11
100
249
100
0
N/A
N/A
N/A
15
100
15
93
128
128
100
20
100
117
100
0
N/A
N/A
N/A
16
100
24
100
152
152
100
21
100
117
100
0
N/A
N/A
N/A
20
100
15
100
92
92
100
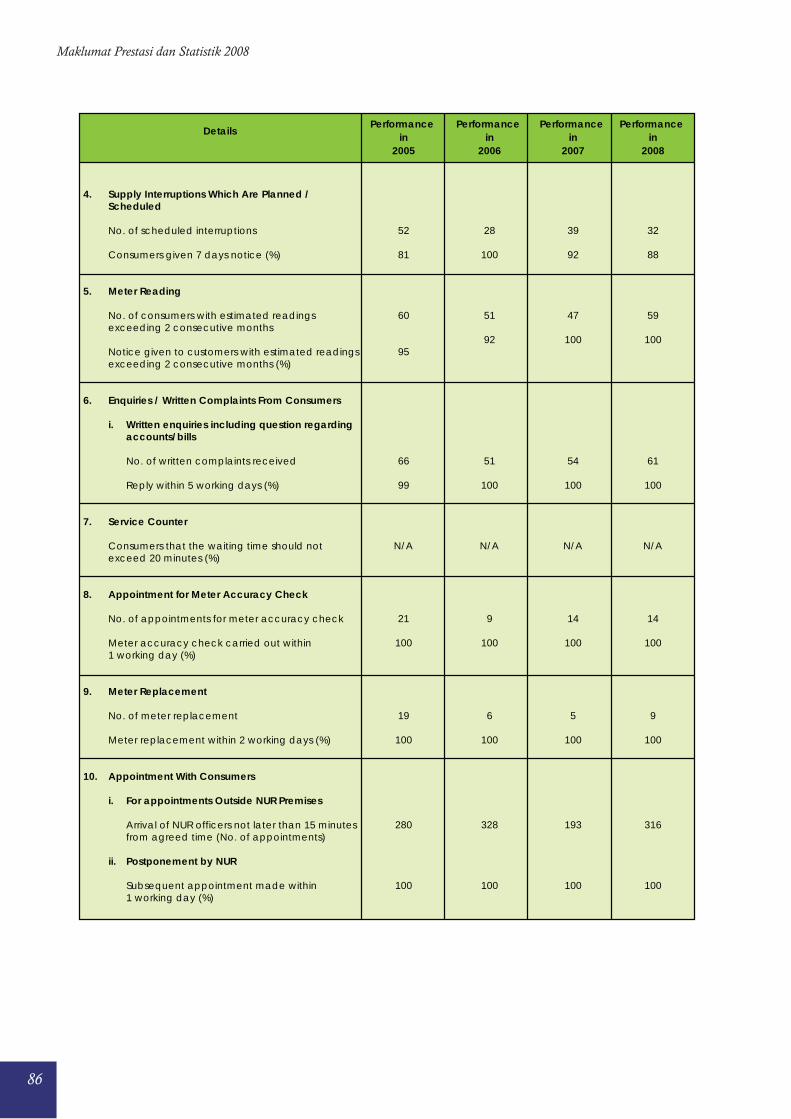
86
Maklumat Prestasi dan Statistik 2008
DetailsPerformance
in2005
Performance in
2006
Performance in
2007
Performance in
2008
4. Supply Interruptions Which Are Planned / Scheduled
No. of scheduled interruptions
Consumers given 7 days notice (%)
5. Meter Reading
No. of consumers with estimated readings exceeding 2 consecutive months
Notice given to customers with estimated readings exceeding 2 consecutive months (%)
6. Enquiries / Written Complaints From Consumers
i. Written enquiries including question regarding accounts/bills
No. of written complaints received
Reply within 5 working days (%)
7. Service Counter
Consumers that the waiting time should not exceed 20 minutes (%)
8. Appointment for Meter Accuracy Check
No. of appointments for meter accuracy check
Meter accuracy check carried out within 1 working day (%)
9. Meter Replacement
No. of meter replacement
Meter replacement within 2 working days (%)
10. Appointment With Consumers
i. For appointments Outside NUR Premises
Arrival of NUR officers not later than 15 minutes from agreed time (No. of appointments)
ii. Postponement by NUR
Subsequent appointment made within 1 working day (%)
52
81
60
95
66
99
N/A
21
100
19
100
280
100
28
100
51
92
51
100
N/A
9
100
6
100
328
100
39
92
47
100
54
100
N/A
14
100
5
100
193
100
32
88
59
100
61
100
N/A
14
100
9
100
316
100
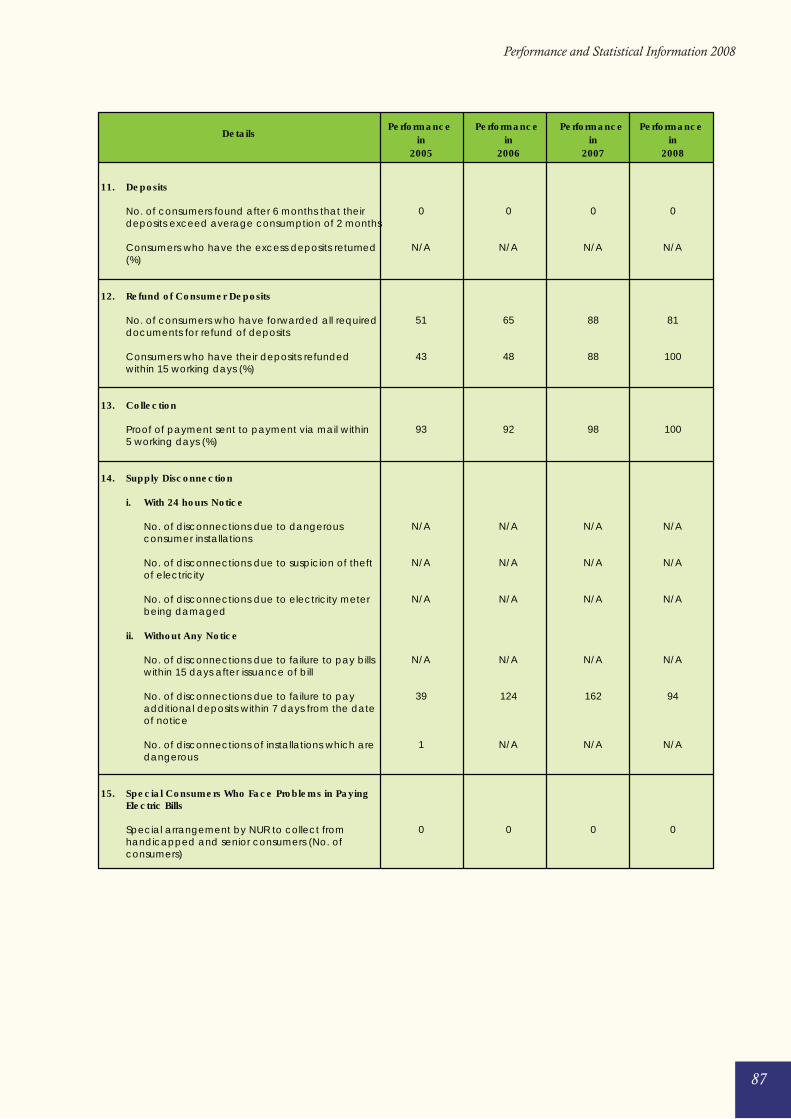
87
Performance and Statistical Information 2008
DetailsPerformance
in2005
Performance in
2006
Performance in
2007
Performance in
2008
11. Deposits
No. of consumers found after 6 months that their deposits exceed average consumption of 2 months
Consumers who have the excess deposits returned (%)
12. Refund of Consumer Deposits
No. of consumers who have forwarded all required documents for refund of deposits
Consumers who have their deposits refunded within 15 working days (%)
13. Collection
Proof of payment sent to payment via mail within 5 working days (%)
14. Supply Disconnection
i. With 24 hours Notice
No. of disconnections due to dangerous consumer installations
No. of disconnections due to suspicion of theft of electricity
No. of disconnections due to electricity meter being damaged
ii. Without Any Notice
No. of disconnections due to failure to pay bills within 15 days after issuance of bill
No. of disconnections due to failure to pay additional deposits within 7 days from the date of notice
No. of disconnections of installations which are dangerous
15. Special Consumers Who Face Problems in Paying Electric Bills
Special arrangement by NUR to collect from handicapped and senior consumers (No. of consumers)
0
N/A
51
43
93
N/A
N/A
N/A
N/A
39
1
0
0
N/A
65
48
92
N/A
N/A
N/A
N/A
124
N/A
0
0
N/A
88
88
98
N/A
N/A
N/A
N/A
162
N/A
0
0
N/A
81
100
100
N/A
N/A
N/A
N/A
94
N/A
0
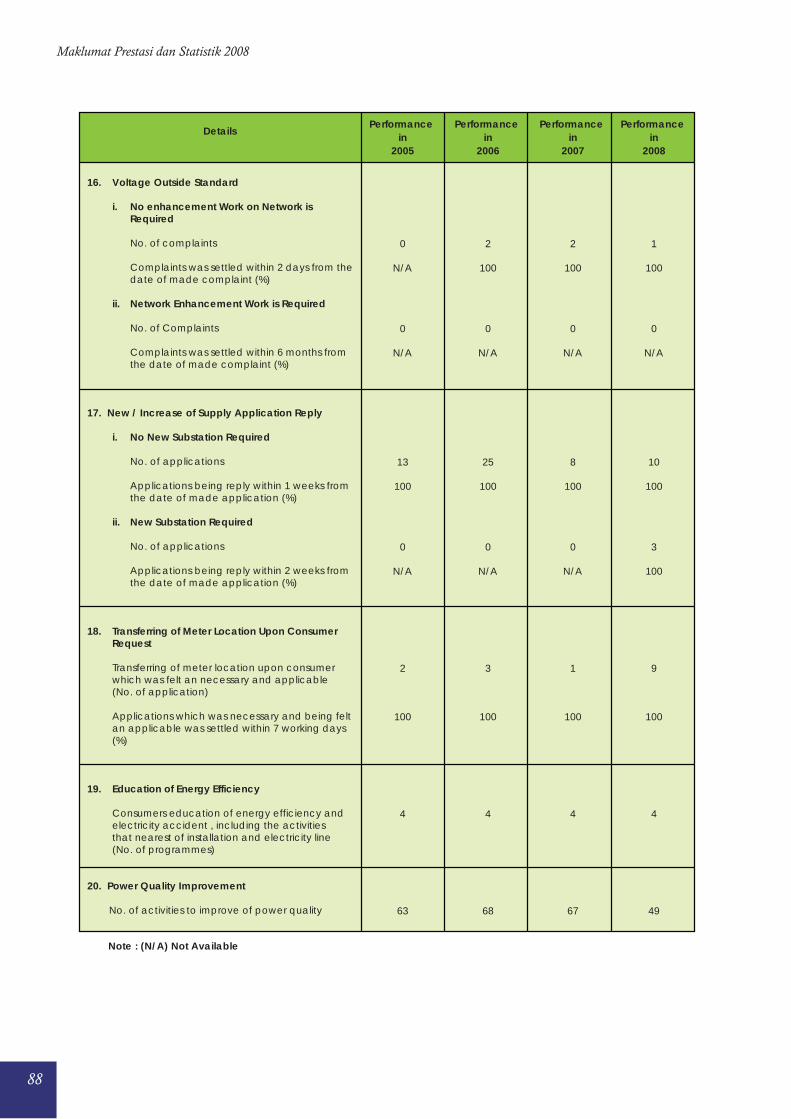
88
Maklumat Prestasi dan Statistik 2008
DetailsPerformance
in2005
Performance in
2006
Performance in
2007
Performance in
2008
Note : (N/A) Not Available
16. Voltage Outside Standard
i. No enhancement Work on Network is Required
No. of complaints
Complaints was settled within 2 days from the date of made complaint (%)
ii. Network Enhancement Work is Required
No. of Complaints
Complaints was settled within 6 months from the date of made complaint (%)
17. New / Increase of Supply Application Reply
i. No New Substation Required
No. of applications
Applications being reply within 1 weeks from the date of made application (%)
ii. New Substation Required
No. of applications
Applications being reply within 2 weeks from the date of made application (%)
18. Transferring of Meter Location Upon Consumer Request
Transferring of meter location upon consumer which was felt an necessary and applicable (No. of application)
Applications which was necessary and being felt an applicable was settled within 7 working days (%)
19. Education of Energy Efficiency
Consumers education of energy efficiency and electricity accident , including the activities that nearest of installation and electricity line (No. of programmes)
20. Power Quality Improvement
No. of activities to improve of power quality
0
N/A
0
N/A
13
100
0
N/A
2
100
4
63
2
100
0
N/A
25
100
0
N/A
3
100
4
68
2
100
0
N/A
8
100
0
N/A
1
100
4
67
1
100
0
N/A
10
100
3
100
9
100
4
49
Performance and Statistical Information 2008
MAKLUMAT DAN STATISTIK INDUSTRI
• Kadar Tarif Di Malaysia
• Statistik Tenaga Nasional Berhad (TNB)
• Statistik Sabah Electricity Sdn. Bhd. (SESB)
• Statistik Sarawak Energy Berhad (SEB)
• Senarai Penjana Kuasa Bebas
• Senarai Penjana Kuasa Menggunakan
Sumber Tenaga Yang Boleh Diperbaharui
• Senarai Pengagih Elektrik
• Senarai Co-Generators Utama
• Statistik Penjanaan Persendirian
• Statistik Dan Maklumat Lain Yang Penting
Untuk Industri Bekalan Elektrik
• Alamat Perhubungan
INDUSTRY STATISTICS ANDINFORMATION
• Tariff Rates in Malaysia
• Statistics of Tenaga Nasional Berhad (TNB)
• Statistics of Sabah Electricity Sdn. Bhd.
(SESB)
• Statistics of Sarawak Energy Berhad (SEB)
• List of Independent Power Producers (IPPs)
• List of Small Renewable Energy Power
Producers (SREP)
• List of Electricity Distributors
• List of Major Co-Generators
• Statistics of Self-Generation
• Other Important Statistics and Information
of the Electricity Supply Industry
• Key Contacts
89

90
Maklumat Prestasi dan Statistik 2008

91
Performance and Statistical Information 2008
Kadar Tarif Di Malaysia
Tariff Rates in Malaysia

92
Maklumat Prestasi dan Statistik 2008
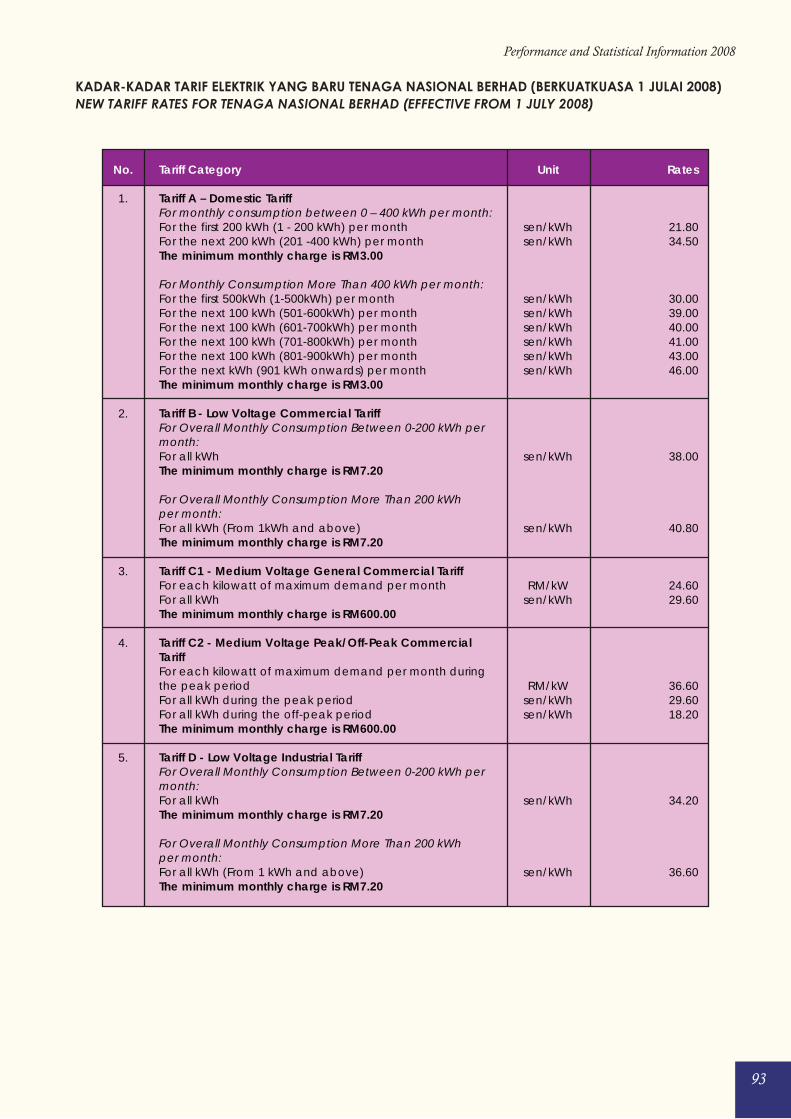
93
Performance and Statistical Information 2008
KADAR-KADAR TARIF ELEKTRIK YANG BARU TENAGA NASIONAL BERHAD (BERKUATKUASA 1 JULAI 2008)
NEW TARIFF RATES FOR TENAGA NASIONAL BERHAD (EFFECTIVE FROM 1 JULY 2008)
No.
1.
2.
3.
4.
5.
Unit
sen/kWhsen/kWh
sen/kWhsen/kWhsen/kWhsen/kWhsen/kWhsen/kWh
sen/kWh
sen/kWh
RM/kWsen/kWh
RM/kWsen/kWhsen/kWh
sen/kWh
sen/kWh
Rates
21.8034.50
30.0039.0040.0041.0043.0046.00
38.00
40.80
24.6029.60
36.6029.6018.20
34.20
36.60
Tariff Category
Tariff A – Domestic TariffFor monthly consumption between 0 – 400 kWh per month:For the first 200 kWh (1 - 200 kWh) per monthFor the next 200 kWh (201 -400 kWh) per monthThe minimum monthly charge is RM3.00
For Monthly Consumption More Than 400 kWh per month:For the first 500kWh (1-500kWh) per monthFor the next 100 kWh (501-600kWh) per monthFor the next 100 kWh (601-700kWh) per monthFor the next 100 kWh (701-800kWh) per monthFor the next 100 kWh (801-900kWh) per monthFor the next kWh (901 kWh onwards) per monthThe minimum monthly charge is RM3.00
Tariff B - Low Voltage Commercial TariffFor Overall Monthly Consumption Between 0-200 kWh permonth:For all kWhThe minimum monthly charge is RM7.20
For Overall Monthly Consumption More Than 200 kWhper month:For all kWh (From 1kWh and above)The minimum monthly charge is RM7.20
Tariff C1 - Medium Voltage General Commercial TariffFor each kilowatt of maximum demand per monthFor all kWhThe minimum monthly charge is RM600.00
Tariff C2 - Medium Voltage Peak/Off-Peak CommercialTariffFor each kilowatt of maximum demand per month duringthe peak periodFor all kWh during the peak periodFor all kWh during the off-peak periodThe minimum monthly charge is RM600.00
Tariff D - Low Voltage Industrial TariffFor Overall Monthly Consumption Between 0-200 kWh permonth:For all kWhThe minimum monthly charge is RM7.20
For Overall Monthly Consumption More Than 200 kWhper month:For all kWh (From 1 kWh and above)The minimum monthly charge is RM7.20
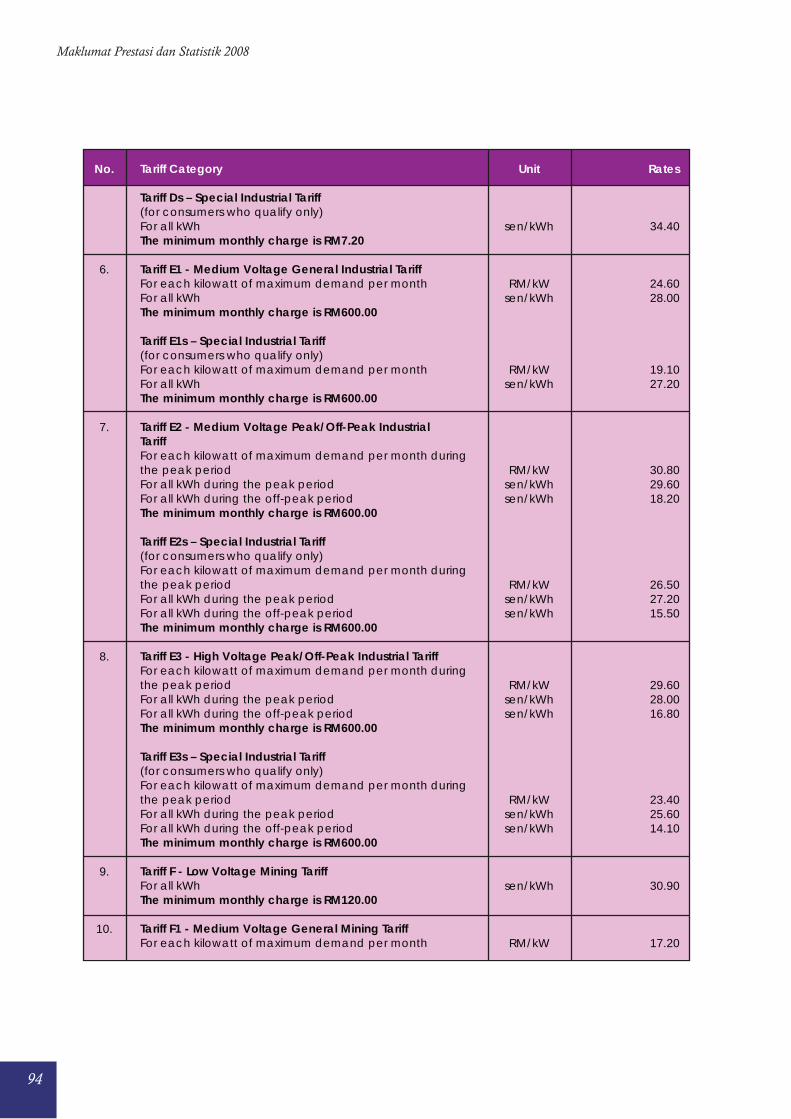
94
Maklumat Prestasi dan Statistik 2008
No.
6.
7.
8.
9.
10.
Unit
sen/kWh
RM/kWsen/kWh
RM/kWsen/kWh
RM/kWsen/kWhsen/kWh
RM/kWsen/kWhsen/kWh
RM/kWsen/kWhsen/kWh
RM/kWsen/kWhsen/kWh
sen/kWh
RM/kW
Rates
34.40
24.6028.00
19.1027.20
30.8029.6018.20
26.5027.2015.50
29.6028.0016.80
23.4025.6014.10
30.90
17.20
Tariff Category
Tariff Ds – Special Industrial Tariff(for consumers who qualify only)For all kWhThe minimum monthly charge is RM7.20
Tariff E1 - Medium Voltage General Industrial TariffFor each kilowatt of maximum demand per monthFor all kWhThe minimum monthly charge is RM600.00
Tariff E1s – Special Industrial Tariff(for consumers who qualify only)For each kilowatt of maximum demand per monthFor all kWhThe minimum monthly charge is RM600.00
Tariff E2 - Medium Voltage Peak/Off-Peak IndustrialTariffFor each kilowatt of maximum demand per month duringthe peak periodFor all kWh during the peak periodFor all kWh during the off-peak periodThe minimum monthly charge is RM600.00
Tariff E2s – Special Industrial Tariff(for consumers who qualify only)For each kilowatt of maximum demand per month duringthe peak periodFor all kWh during the peak periodFor all kWh during the off-peak periodThe minimum monthly charge is RM600.00
Tariff E3 - High Voltage Peak/Off-Peak Industrial TariffFor each kilowatt of maximum demand per month duringthe peak periodFor all kWh during the peak periodFor all kWh during the off-peak periodThe minimum monthly charge is RM600.00
Tariff E3s – Special Industrial Tariff(for consumers who qualify only)For each kilowatt of maximum demand per month duringthe peak periodFor all kWh during the peak periodFor all kWh during the off-peak periodThe minimum monthly charge is RM600.00
Tariff F - Low Voltage Mining TariffFor all kWhThe minimum monthly charge is RM120.00
Tariff F1 - Medium Voltage General Mining TariffFor each kilowatt of maximum demand per month
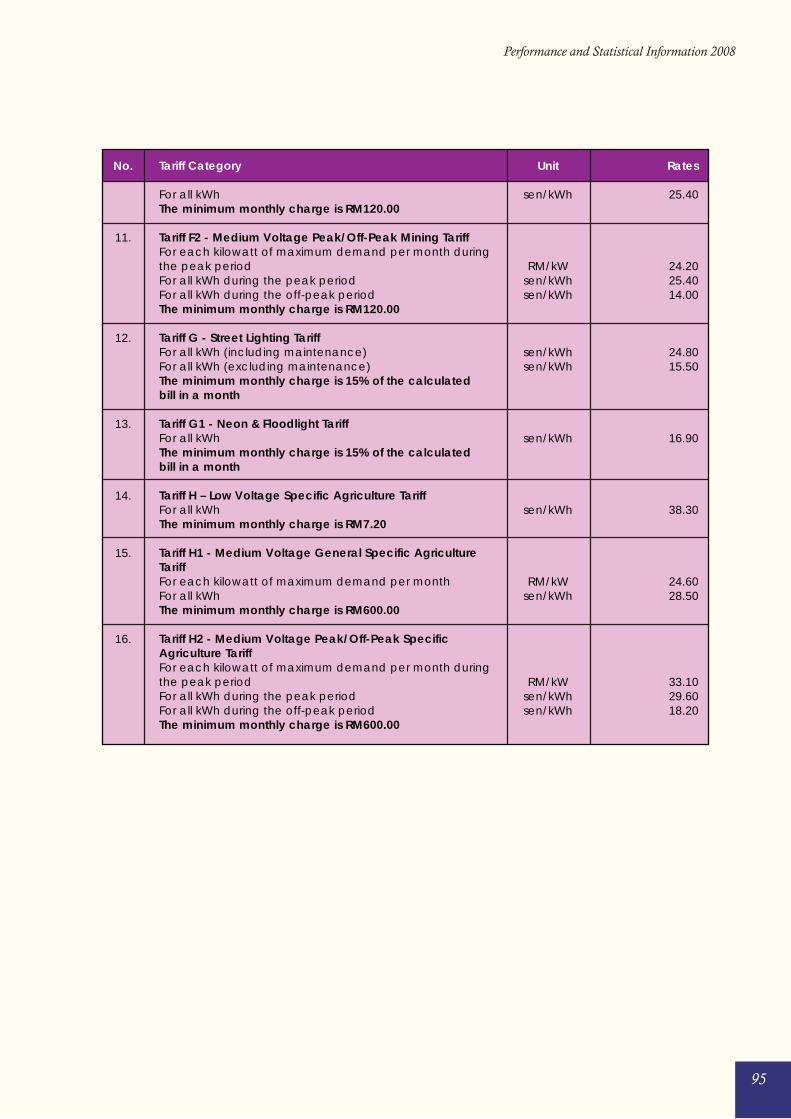
95
Performance and Statistical Information 2008
No.
11.
12.
13.
14.
15.
16.
Unit
sen/kWh
RM/kWsen/kWhsen/kWh
sen/kWhsen/kWh
sen/kWh
sen/kWh
RM/kWsen/kWh
RM/kWsen/kWhsen/kWh
Rates
25.40
24.2025.4014.00
24.8015.50
16.90
38.30
24.6028.50
33.1029.6018.20
Tariff Category
For all kWhThe minimum monthly charge is RM120.00
Tariff F2 - Medium Voltage Peak/Off-Peak Mining TariffFor each kilowatt of maximum demand per month duringthe peak periodFor all kWh during the peak periodFor all kWh during the off-peak periodThe minimum monthly charge is RM120.00
Tariff G - Street Lighting TariffFor all kWh (including maintenance)For all kWh (excluding maintenance)The minimum monthly charge is 15% of the calculatedbill in a month
Tariff G1 - Neon & Floodlight TariffFor all kWhThe minimum monthly charge is 15% of the calculatedbill in a month
Tariff H – Low Voltage Specific Agriculture TariffFor all kWhThe minimum monthly charge is RM7.20
Tariff H1 - Medium Voltage General Specific AgricultureTariffFor each kilowatt of maximum demand per monthFor all kWhThe minimum monthly charge is RM600.00
Tariff H2 - Medium Voltage Peak/Off-Peak SpecificAgriculture TariffFor each kilowatt of maximum demand per month duringthe peak periodFor all kWh during the peak periodFor all kWh during the off-peak periodThe minimum monthly charge is RM600.00
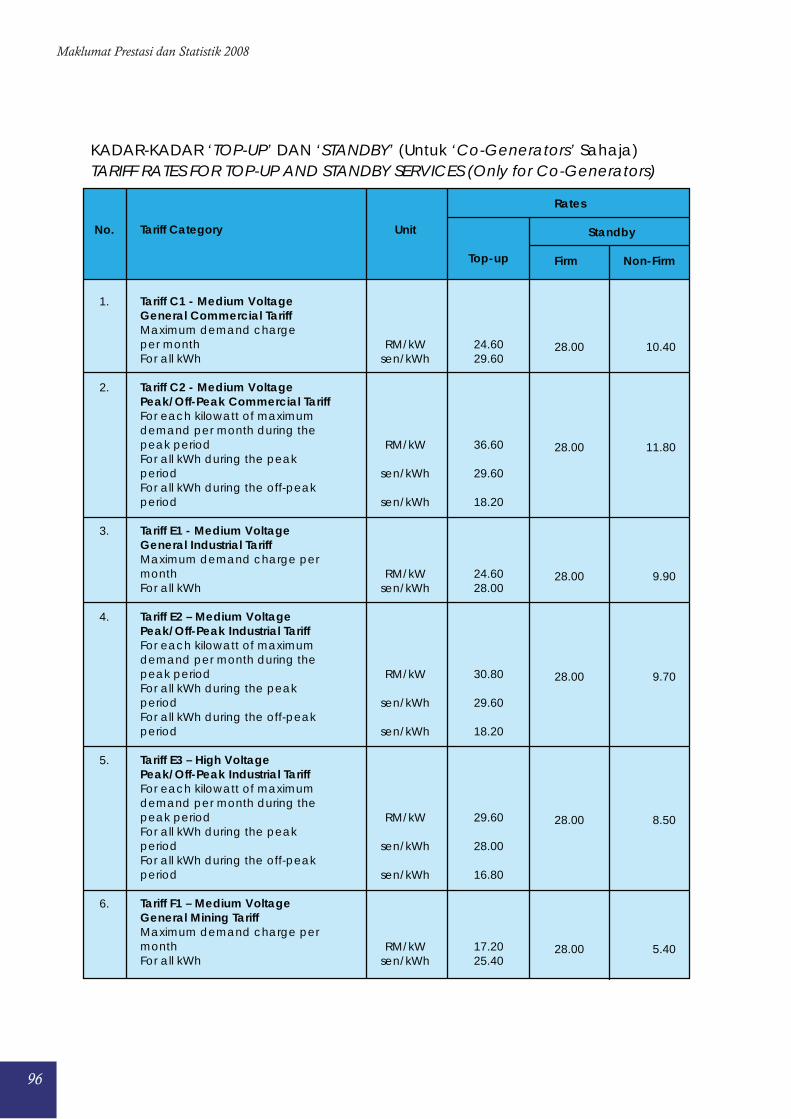
96
Maklumat Prestasi dan Statistik 2008
KADAR-KADAR ‘TOP-UP’ DAN ‘STANDBY’ (Untuk ‘Co-Generators’ Sahaja)TARIFF RATES FOR TOP-UP AND STANDBY SERVICES (Only for Co-Generators)
No.
1.
2.
3.
4.
5.
6.
Unit
RM/kWsen/kWh
RM/kW
sen/kWh
sen/kWh
RM/kWsen/kWh
RM/kW
sen/kWh
sen/kWh
RM/kW
sen/kWh
sen/kWh
RM/kWsen/kWh
Rates
Standby
Firm
28.00
28.00
28.00
28.00
28.00
28.00
Non-Firm
10.40
11.80
9.90
9.70
8.50
5.40
Top-up
24.6029.60
36.60
29.60
18.20
24.6028.00
30.80
29.60
18.20
29.60
28.00
16.80
17.2025.40
Tariff Category
Tariff C1 - Medium VoltageGeneral Commercial TariffMaximum demand chargeper monthFor all kWh
Tariff C2 - Medium VoltagePeak/Off-Peak Commercial TariffFor each kilowatt of maximumdemand per month during thepeak periodFor all kWh during the peakperiodFor all kWh during the off-peakperiod
Tariff E1 - Medium VoltageGeneral Industrial TariffMaximum demand charge permonthFor all kWh
Tariff E2 – Medium VoltagePeak/Off-Peak Industrial TariffFor each kilowatt of maximumdemand per month during thepeak periodFor all kWh during the peakperiodFor all kWh during the off-peakperiod
Tariff E3 – High VoltagePeak/Off-Peak Industrial TariffFor each kilowatt of maximumdemand per month during thepeak periodFor all kWh during the peakperiodFor all kWh during the off-peakperiod
Tariff F1 – Medium VoltageGeneral Mining TariffMaximum demand charge permonthFor all kWh
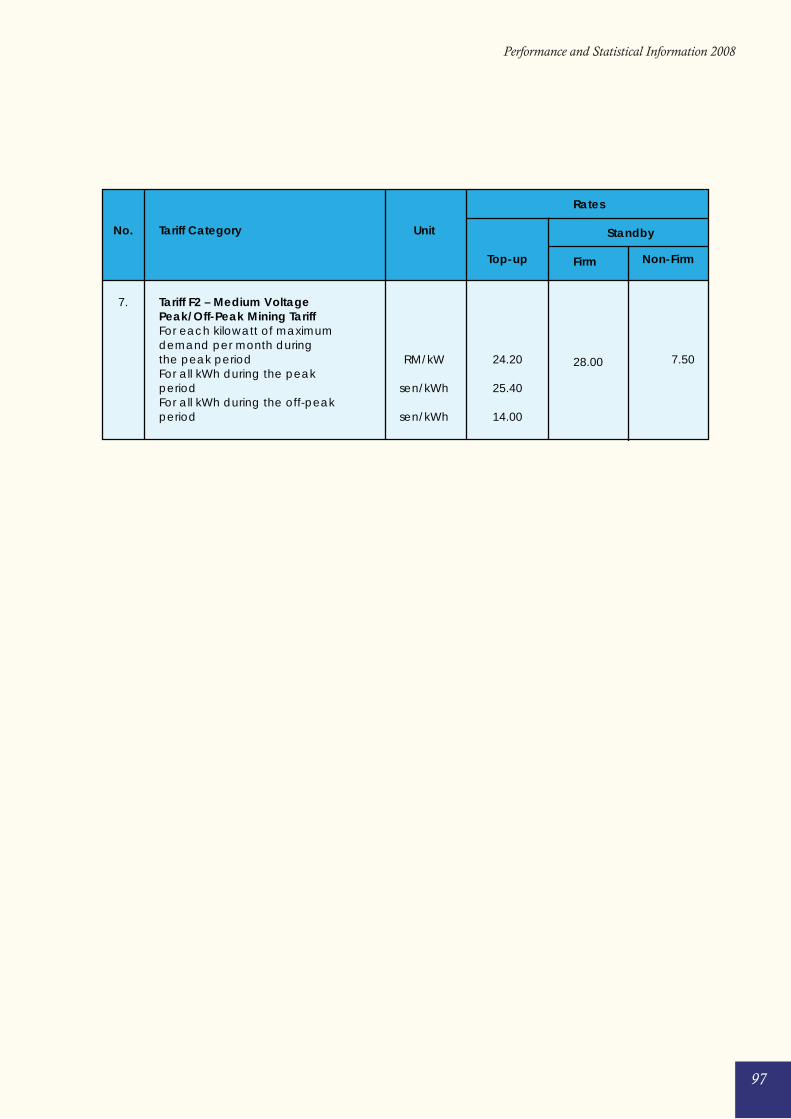
97
Performance and Statistical Information 2008
No.
7.
Unit
RM/kW
sen/kWh
sen/kWh
Rates
Standby
Firm
28.00
Non-Firm
7.50
Top-up
24.20
25.40
14.00
Tariff Category
Tariff F2 – Medium VoltagePeak/Off-Peak Mining TariffFor each kilowatt of maximumdemand per month duringthe peak periodFor all kWh during the peakperiodFor all kWh during the off-peakperiod
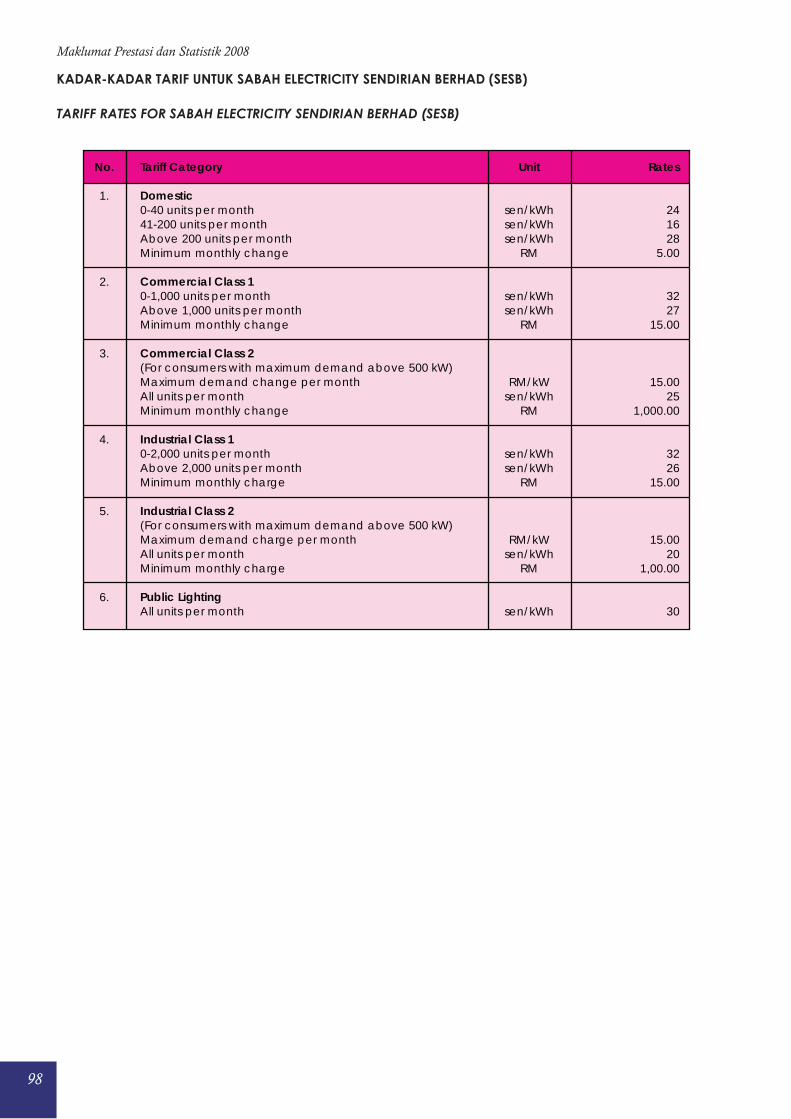
98
Maklumat Prestasi dan Statistik 2008
No.
1.
2.
3.
4.
5.
6.
Unit
sen/kWhsen/kWhsen/kWh
RM
sen/kWhsen/kWh
RM
RM/kWsen/kWh
RM
sen/kWhsen/kWh
RM
RM/kWsen/kWh
RM
sen/kWh
Rates
241628
5.00
3227
15.00
15.0025
1,000.00
3226
15.00
15.0020
1,00.00
30
Tariff Category
Domestic0-40 units per month41-200 units per monthAbove 200 units per monthMinimum monthly change
Commercial Class 10-1,000 units per monthAbove 1,000 units per monthMinimum monthly change
Commercial Class 2(For consumers with maximum demand above 500 kW)Maximum demand change per monthAll units per monthMinimum monthly change
Industrial Class 10-2,000 units per monthAbove 2,000 units per monthMinimum monthly charge
Industrial Class 2(For consumers with maximum demand above 500 kW)Maximum demand charge per monthAll units per monthMinimum monthly charge
Public LightingAll units per month
KADAR-KADAR TARIF UNTUK SABAH ELECTRICITY SENDIRIAN BERHAD (SESB)
TARIFF RATES FOR SABAH ELECTRICITY SENDIRIAN BERHAD (SESB)
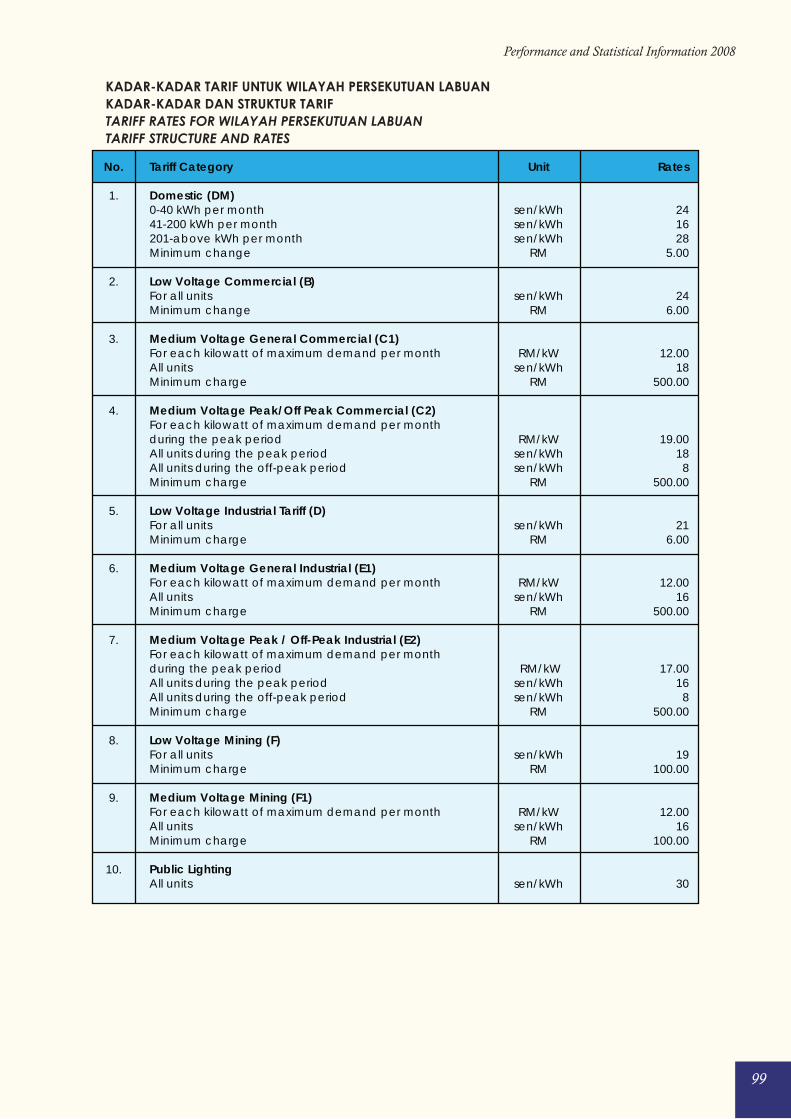
99
Performance and Statistical Information 2008
No.
1.
2.
3.
4.
5.
6.
7.
8.
9.
10.
Unit
sen/kWhsen/kWhsen/kWh
RM
sen/kWhRM
RM/kWsen/kWh
RM
RM/kWsen/kWhsen/kWh
RM
sen/kWhRM
RM/kWsen/kWh
RM
RM/kWsen/kWhsen/kWh
RM
sen/kWhRM
RM/kWsen/kWh
RM
sen/kWh
Rates
241628
5.00
246.00
12.0018
500.00
19.0018
8500.00
216.00
12.0016
500.00
17.0016
8500.00
19100.00
12.0016
100.00
30
Tariff Category
Domestic (DM)0-40 kWh per month41-200 kWh per month201-above kWh per monthMinimum change
Low Voltage Commercial (B)For all unitsMinimum change
Medium Voltage General Commercial (C1)For each kilowatt of maximum demand per monthAll unitsMinimum charge
Medium Voltage Peak/Off Peak Commercial (C2)For each kilowatt of maximum demand per monthduring the peak periodAll units during the peak periodAll units during the off-peak periodMinimum charge
Low Voltage Industrial Tariff (D)For all unitsMinimum charge
Medium Voltage General Industrial (E1)For each kilowatt of maximum demand per monthAll unitsMinimum charge
Medium Voltage Peak / Off-Peak Industrial (E2)For each kilowatt of maximum demand per monthduring the peak periodAll units during the peak periodAll units during the off-peak periodMinimum charge
Low Voltage Mining (F)For all unitsMinimum charge
Medium Voltage Mining (F1)For each kilowatt of maximum demand per monthAll unitsMinimum charge
Public LightingAll units
KADAR-KADAR TARIF UNTUK WILAYAH PERSEKUTUAN LABUAN
KADAR-KADAR DAN STRUKTUR TARIF
TARIFF RATES FOR WILAYAH PERSEKUTUAN LABUAN
TARIFF STRUCTURE AND RATES
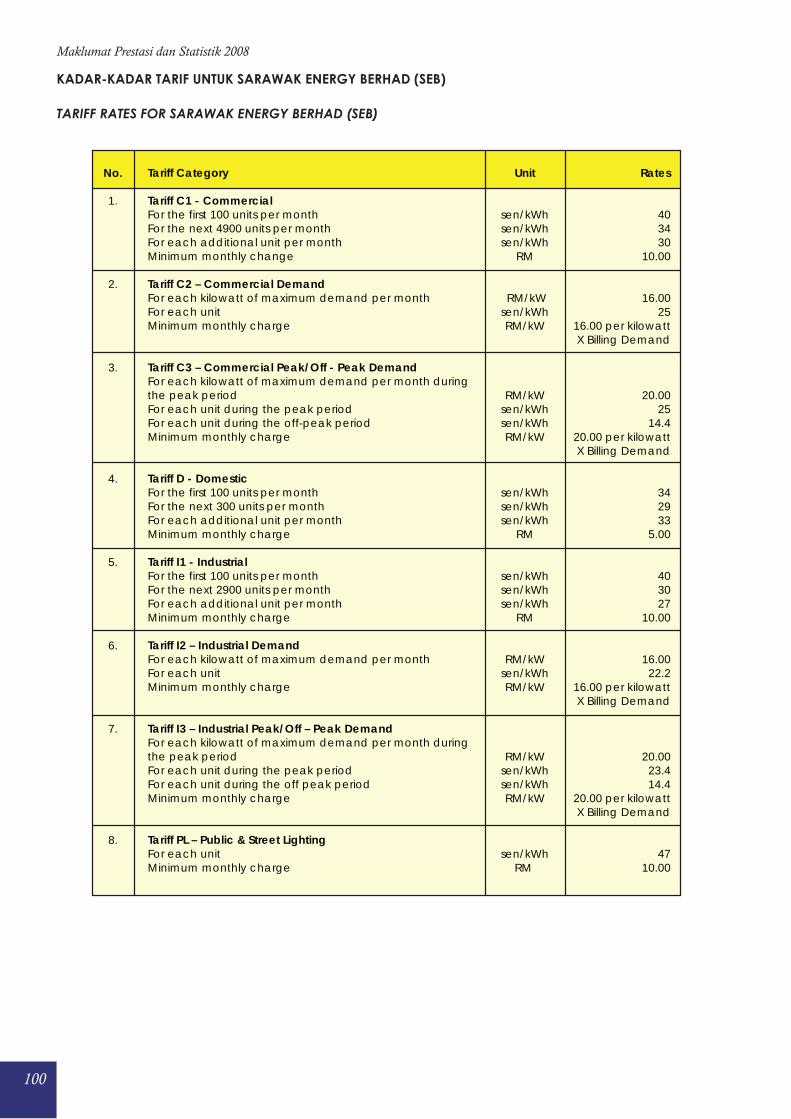
100
Maklumat Prestasi dan Statistik 2008
No.
1.
2.
3.
4.
5.
6.
7.
8.
Unit
sen/kWhsen/kWhsen/kWh
RM
RM/kWsen/kWhRM/kW
RM/kWsen/kWhsen/kWhRM/kW
sen/kWhsen/kWhsen/kWh
RM
sen/kWhsen/kWhsen/kWh
RM
RM/kWsen/kWhRM/kW
RM/kW
sen/kWhsen/kWhRM/kW
sen/kWhRM
Rates
403430
10.00
16.0025
16.00 per kilowattX Billing Demand
20.0025
14.420.00 per kilowattX Billing Demand
342933
5.00
403027
10.00
16.0022.2
16.00 per kilowattX Billing Demand
20.0023.414.4
20.00 per kilowattX Billing Demand
4710.00
Tariff Category
Tariff C1 - CommercialFor the first 100 units per monthFor the next 4900 units per monthFor each additional unit per monthMinimum monthly change
Tariff C2 – Commercial DemandFor each kilowatt of maximum demand per monthFor each unitMinimum monthly charge
Tariff C3 – Commercial Peak/Off - Peak DemandFor each kilowatt of maximum demand per month duringthe peak periodFor each unit during the peak periodFor each unit during the off-peak periodMinimum monthly charge
Tariff D - DomesticFor the first 100 units per monthFor the next 300 units per monthFor each additional unit per monthMinimum monthly charge
Tariff I1 - IndustrialFor the first 100 units per monthFor the next 2900 units per monthFor each additional unit per monthMinimum monthly charge
Tariff I2 – Industrial DemandFor each kilowatt of maximum demand per monthFor each unitMinimum monthly charge
Tariff I3 – Industrial Peak/Off – Peak DemandFor each kilowatt of maximum demand per month duringthe peak periodFor each unit during the peak periodFor each unit during the off peak periodMinimum monthly charge
Tariff PL – Public & Street LightingFor each unitMinimum monthly charge
KADAR-KADAR TARIF UNTUK SARAWAK ENERGY BERHAD (SEB)
TARIFF RATES FOR SARAWAK ENERGY BERHAD (SEB)

101
Performance and Statistical Information 2008
Statistik Tenaga Nasional Berhad (TNB)
Statistics of Tenaga Nasional Berhad (TNB)

102
Maklumat Prestasi dan Statistik 2008
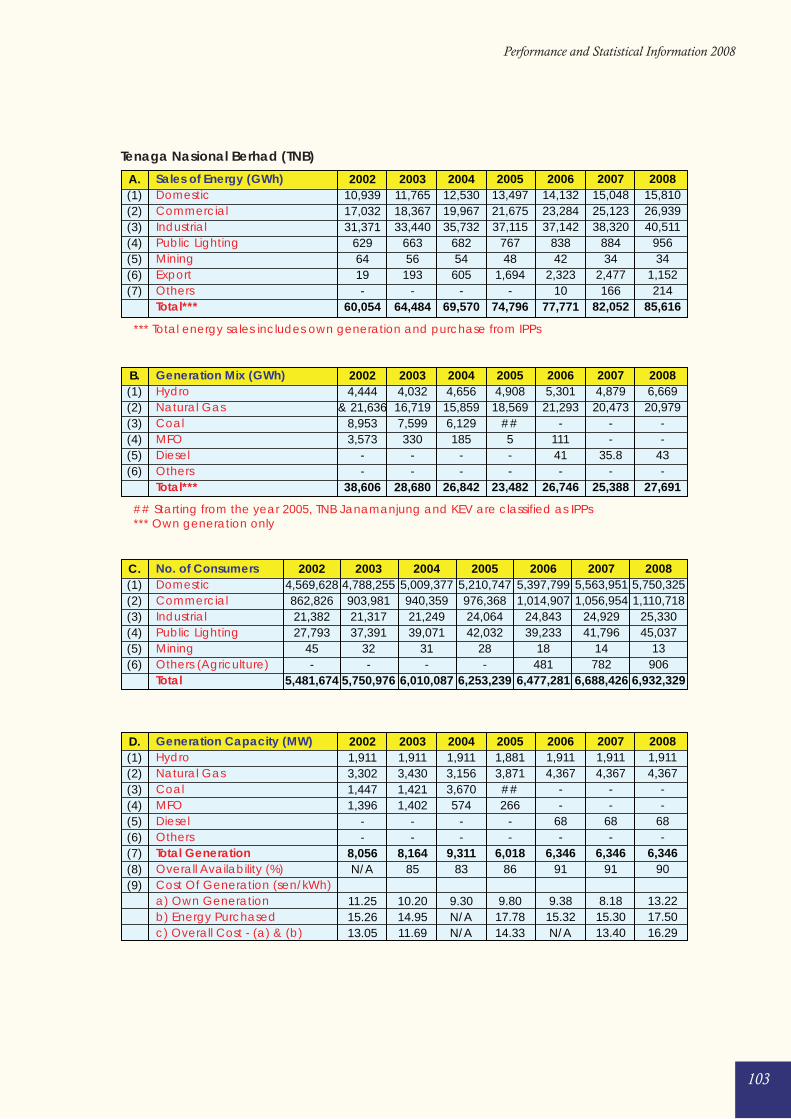
103
Performance and Statistical Information 2008
## Starting from the year 2005, TNB Janamanjung and KEV are classified as IPPs*** Own generation only
Tenaga Nasional Berhad (TNB)
B.(1)(2)(3)(4)(5)(6)
20024,444
& 21,6368,9533,573
--
38,606
20034,032
16,7197,599330
--
28,680
20044,656
15,8596,129185
--
26,842
20054,908
18,569##5--
23,482
20065,301
21,293-
11141-
26,746
20074,879
20,473--
35.8-
25,388
20086,669
20,979--
43-
27,691
Generation Mix (GWh)HydroNatural GasCoalMFODieselOthersTotal***
C.(1)(2)(3)(4)(5)(6)
20024,569,628862,82621,38227,793
45-
5,481,674
20034,788,255903,98121,31737,391
32-
5,750,976
20045,009,377940,35921,24939,071
31-
6,010,087
20055,210,747976,36824,06442,032
28-
6,253,239
20065,397,7991,014,907
24,84339,233
18481
6,477,281
20075,563,9511,056,954
24,92941,796
14782
6,688,426
20085,750,3251,110,718
25,33045,037
13906
6,932,329
No. of ConsumersDomesticCommercialIndustrialPublic LightingMiningOthers (Agriculture)Total
D.(1)(2)(3)(4)(5)(6)(7)(8)(9)
20021,9113,3021,4471,396
--
8,056N/A
11.2515.2613.05
20031,9113,4301,4211,402
--
8,16485
10.2014.9511.69
20041,9113,1563,670574
--
9,31183
9.30N/AN/A
20051,8813,871##266
--
6,01886
9.8017.7814.33
20061,9114,367
--
68-
6,34691
9.3815.32N/A
20071,9114,367
--
68-
6,34691
8.1815.3013.40
20081,9114,367
--
68-
6,34690
13.2217.5016.29
Generation Capacity (MW)HydroNatural GasCoalMFODieselOthersTotal GenerationOverall Availability (%)Cost Of Generation (sen/kWh)a) Own Generationb) Energy Purchasedc) Overall Cost - (a) & (b)
*** Total energy sales includes own generation and purchase from IPPs
A.(1)(2)(3)(4)(5)(6)(7)
200210,93917,03231,371
6296419-
60,054
200311,76518,36733,440
66356
193-
64,484
200412,53019,96735,732
68254
605-
69,570
200513,49721,67537,115
76748
1,694-
74,796
200614,13223,28437,142
83842
2,32310
77,771
200715,04825,12338,320
88434
2,477166
82,052
200815,81026,93940,511
95634
1,152214
85,616
Sales of Energy (GWh)DomesticCommercialIndustrialPublic LightingMiningExportOthersTotal***
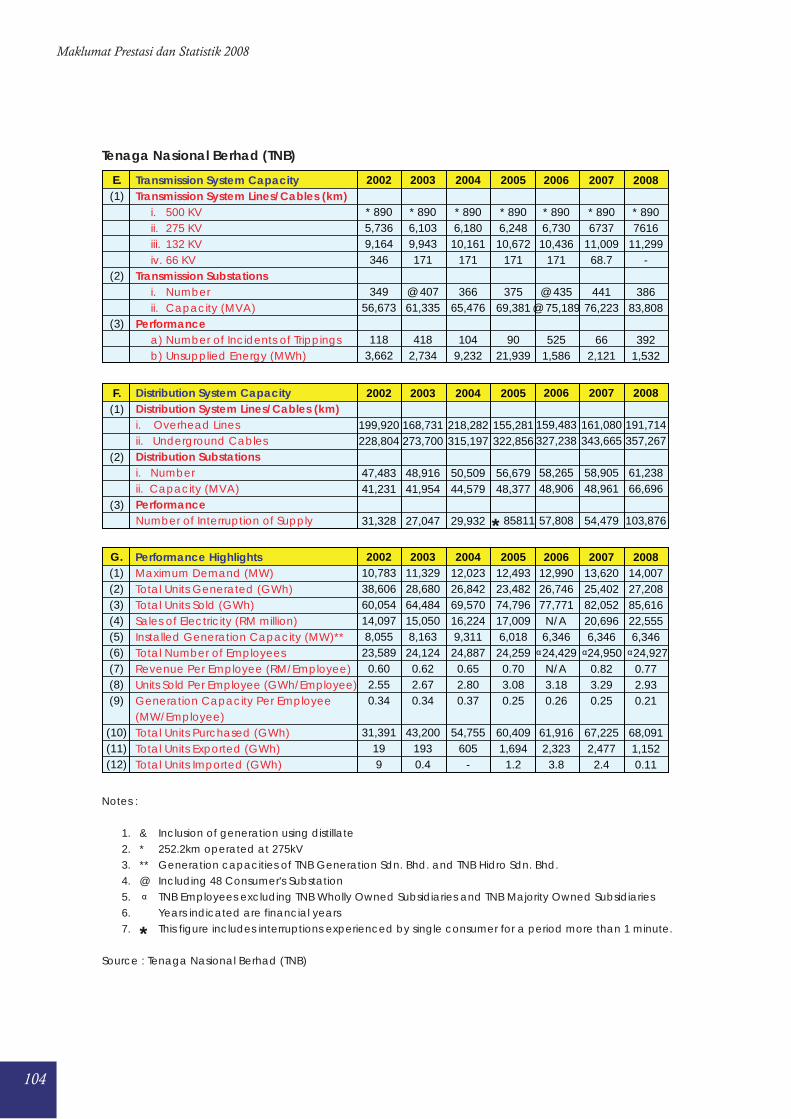
104
Maklumat Prestasi dan Statistik 2008
G.(1)(2)(3)(4)(5)(6)(7)(8)(9)
(10)(11)(12)
200210,78338,60660,05414,0978,05523,589
0.602.550.34
31,391199
200311,32928,68064,48415,0508,16324,124
0.622.670.34
43,2001930.4
200412,02326,84269,57016,2249,31124,887
0.652.800.37
54,755605
-
200512,49323,48274,79617,0096,01824,259
0.703.080.25
60,4091,694
1.2
200612,99026,74677,771
N/A6,346
24,429N/A3.180.26
61,9162,323
3.8
200713,62025,40282,05220,6966,346
24,9500.823.290.25
67,2252,477
2.4
200814,00727,20885,61622,5556,346
24,9270.772.930.21
68,0911,1520.11
Performance HighlightsMaximum Demand (MW)Total Units Generated (GWh)Total Units Sold (GWh)Sales of Electricity (RM million)Installed Generation Capacity (MW)**Total Number of EmployeesRevenue Per Employee (RM/Employee)Units Sold Per Employee (GWh/Employee)Generation Capacity Per Employee(MW/Employee)Total Units Purchased (GWh)Total Units Exported (GWh)Total Units Imported (GWh)
Notes :
1. & Inclusion of generation using distillate 2. * 252.2km operated at 275kV 3. ** Generation capacities of TNB Generation Sdn. Bhd. and TNB Hidro Sdn. Bhd. 4. @ Including 48 Consumer's Substation 5. TNB Employees excluding TNB Wholly Owned Subsidiaries and TNB Majority Owned Subsidiaries 6. Years indicated are financial years 7. * This figure includes interruptions experienced by single consumer for a period more than 1 minute.
Source : Tenaga Nasional Berhad (TNB)
E.(1)
(2)
(3)
2002
* 8905,7369,164346
34956,673
1183,662
2003
* 8906,1039,943171
@ 40761,335
4182,734
2004
* 8906,18010,161
171
36665,476
1049,232
2005
* 8906,24810,672
171
37569,381
9021,939
2006
* 8906,73010,436
171
@ 435@ 75,189
5251,586
2007
* 8906737
11,00968.7
44176,223
662,121
2008
* 8907616
11,299-
38683,808
3921,532
Transmission System CapacityTransmission System Lines/Cables (km) i. 500 KV ii. 275 KV iii. 132 KV iv. 66 KVTransmission Substations i. Number ii. Capacity (MVA)Performance a) Number of Incidents of Trippings b) Unsupplied Energy (MWh)
F.(1)
(2)
(3)
2002
199,920228,804
47,48341,231
31,328
2003
168,731273,700
48,91641,954
27,047
2004
218,282315,197
50,50944,579
29,932
2005
155,281322,856
56,67948,377
* 85811
2006
159,483327,238
58,26548,906
57,808
2007
161,080343,665
58,90548,961
54,479
2008
191,714357,267
61,23866,696
103,876
Distribution System CapacityDistribution System Lines/Cables (km)i. Overhead Linesii. Underground CablesDistribution Substationsi. Numberii. Capacity (MVA)PerformanceNumber of Interruption of Supply
Tenaga Nasional Berhad (TNB)

105
Performance and Statistical Information 2008
Statistik Sabah Electricity Sdn. Bhd (SESB)
Statistics of Sabah Electricity Sdn. Bhd (SESB)

106
Maklumat Prestasi dan Statistik 2008
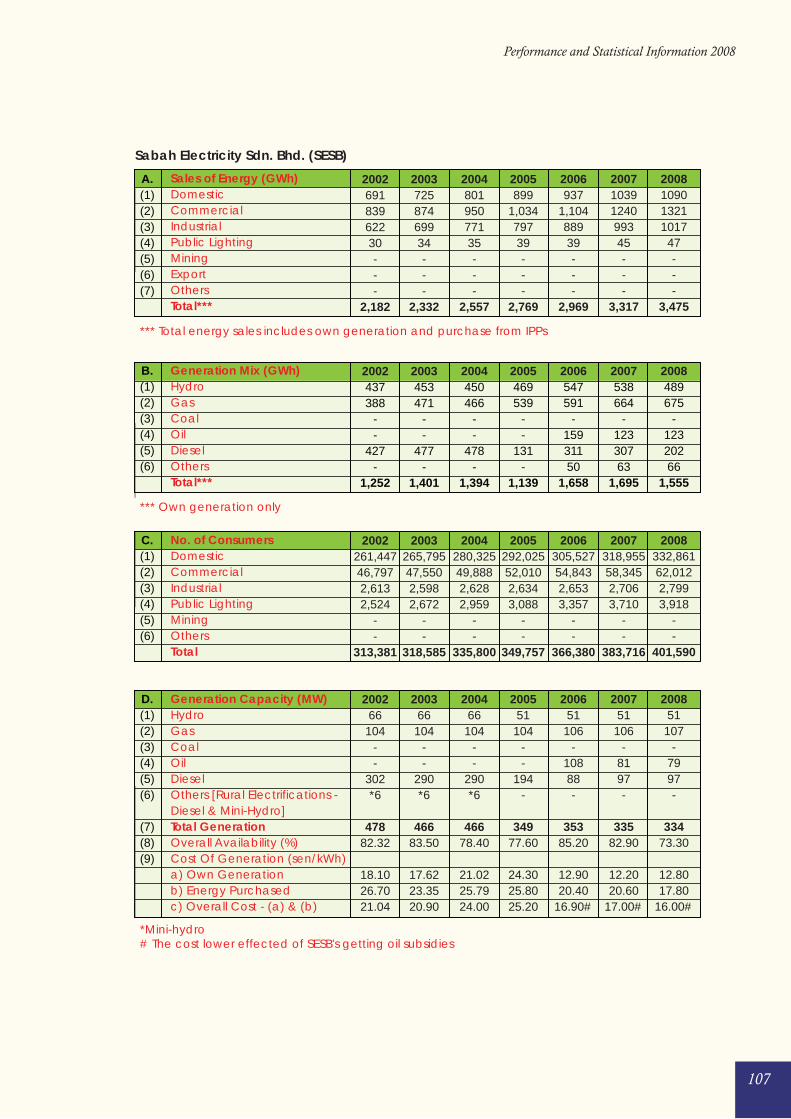
107
Performance and Statistical Information 2008
200269183962230---
2,182
200372587469934---
2,332
200480195077135---
2,557
2005899
1,03479739---
2,769
2006937
1,10488939---
2,969
20071039124099345---
3,317
200810901321101747---
3,475
A.(1)(2)(3)(4)(5)(6)(7)
2002437388
--
427-
1,252
2003453471
--
477-
1,401
2004450466
--
478-
1,394
2005469539
--
131-
1,139
2006547591
-15931150
1,658
2007538664
-12330763
1,695
2008489675
-12320266
1,555
2002261,44746,7972,6132,524
--
313,381
2003265,79547,5502,5982,672
--
318,585
2004280,32549,8882,6282,959
--
335,800
2005292,02552,0102,6343,088
--
349,757
2006305,52754,8432,6533,357
--
366,380
2007318,95558,3452,7063,710
--
383,716
2008332,86162,0122,7993,918
--
401,590
200266
104--
302*6
47882.32
18.1026.7021.04
200366
104--
290*6
46683.50
17.6223.3520.90
200466
104--
290*6
46678.40
21.0225.7924.00
200551
104--
194-
34977.60
24.3025.8025.20
200651
106-
10888-
35385.20
12.9020.40
16.90#
200751
106-
8197-
33582.90
12.2020.60
17.00#
200851
107-
7997-
33473.30
12.8017.80
16.00#
B.(1)(2)(3)(4)(5)(6)
C.(1)(2)(3)(4)(5)(6)
D.(1)(2)(3)(4)(5)(6)
(7)(8)(9)
Sales of Energy (GWh)DomesticCommercialIndustrialPublic LightingMiningExportOthersTotal***
*** Total energy sales includes own generation and purchase from IPPs
Generation Mix (GWh)HydroGasCoalOilDieselOthersTotal***
Generation Capacity (MW)HydroGasCoalOilDieselOthers [Rural Electrifications - Diesel & Mini-Hydro]Total GenerationOverall Availability (%)Cost Of Generation (sen/kWh)a) Own Generationb) Energy Purchasedc) Overall Cost - (a) & (b)
No. of ConsumersDomesticCommercialIndustrialPublic LightingMiningOthersTotal
*** Own generation only
Sabah Electricity Sdn. Bhd. (SESB)
*Mini-hydro# The cost lower effected of SESB's getting oil subsidies
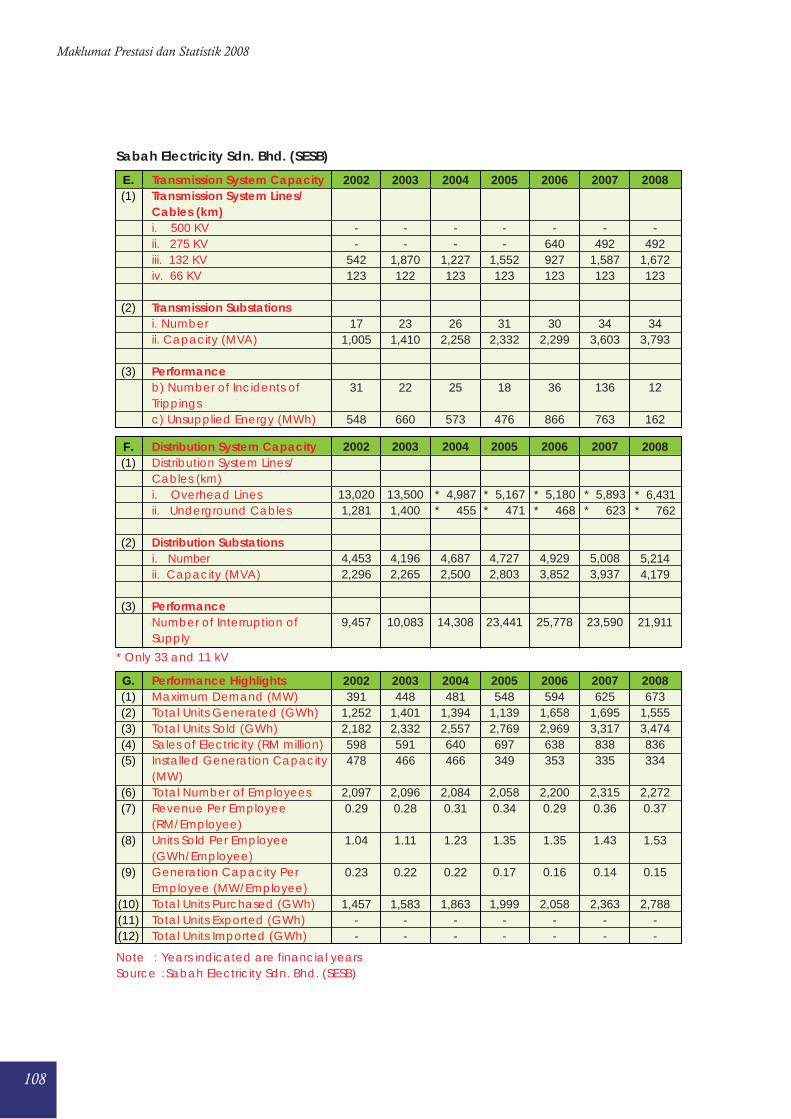
108
Maklumat Prestasi dan Statistik 2008
Distribution System CapacityDistribution System Lines/Cables (km)i. Overhead Linesii. Underground Cables
Distribution Substationsi. Numberii. Capacity (MVA)
PerformanceNumber of Interruption ofSupply
Note : Years indicated are financial yearsSource : Sabah Electricity Sdn. Bhd. (SESB)
* Only 33 and 11 kV
Sabah Electricity Sdn. Bhd. (SESB)
2002
--
542123
171,005
31
548
2003
--
1,870122
231,410
22
660
2004
--
1,227123
262,258
25
573
2005
--
1,552123
312,332
18
476
2006
-640927123
302,299
36
866
2007
-492
1,587123
343,603
136
763
2008
-492
1,672123
343,793
12
162
E.(1)
(2)
(3)
Transmission System CapacityTransmission System Lines/Cables (km)i. 500 KVii. 275 KViii. 132 KViv. 66 KV
Transmission Substationsi. Numberii. Capacity (MVA)
Performanceb) Number of Incidents of Trippingsc) Unsupplied Energy (MWh)
2002
13,0201,281
4,4532,296
9,457
2003
13,5001,400
4,1962,265
10,083
2004
* 4,987* 455
4,6872,500
14,308
2005
* 5,167* 471
4,7272,803
23,441
2006
* 5,180* 468
4,9293,852
25,778
2007
* 5,893* 623
5,0083,937
23,590
2008
* 6,431* 762
5,2144,179
21,911
F.(1)
(2)
(3)
2002391
1,2522,182598478
2,0970.29
1.04
0.23
1,457--
2003448
1,4012,332591466
2,0960.28
1.11
0.22
1,583--
2004481
1,3942,557640466
2,0840.31
1.23
0.22
1,863--
2005548
1,1392,769697349
2,0580.34
1.35
0.17
1,999--
2006594
1,6582,969638353
2,2000.29
1.35
0.16
2,058--
2007625
1,6953,317838335
2,3150.36
1.43
0.14
2,363--
2008673
1,5553,474836334
2,2720.37
1.53
0.15
2,788--
G.(1)(2)(3)(4)(5)
(6)(7)
(8)
(9)
(10)(11)(12)
Performance HighlightsMaximum Demand (MW)Total Units Generated (GWh)Total Units Sold (GWh)Sales of Electricity (RM million)Installed Generation Capacity(MW)Total Number of EmployeesRevenue Per Employee(RM/Employee)Units Sold Per Employee(GWh/Employee)Generation Capacity PerEmployee (MW/Employee)Total Units Purchased (GWh)Total Units Exported (GWh)Total Units Imported (GWh)
109
Performance and Statistical Information 2008
Statistik Sarawak Energy Berhad (SEB)
Statistics of Sarawak Energy Berhad (SEB)

110
Maklumat Prestasi dan Statistik 2008
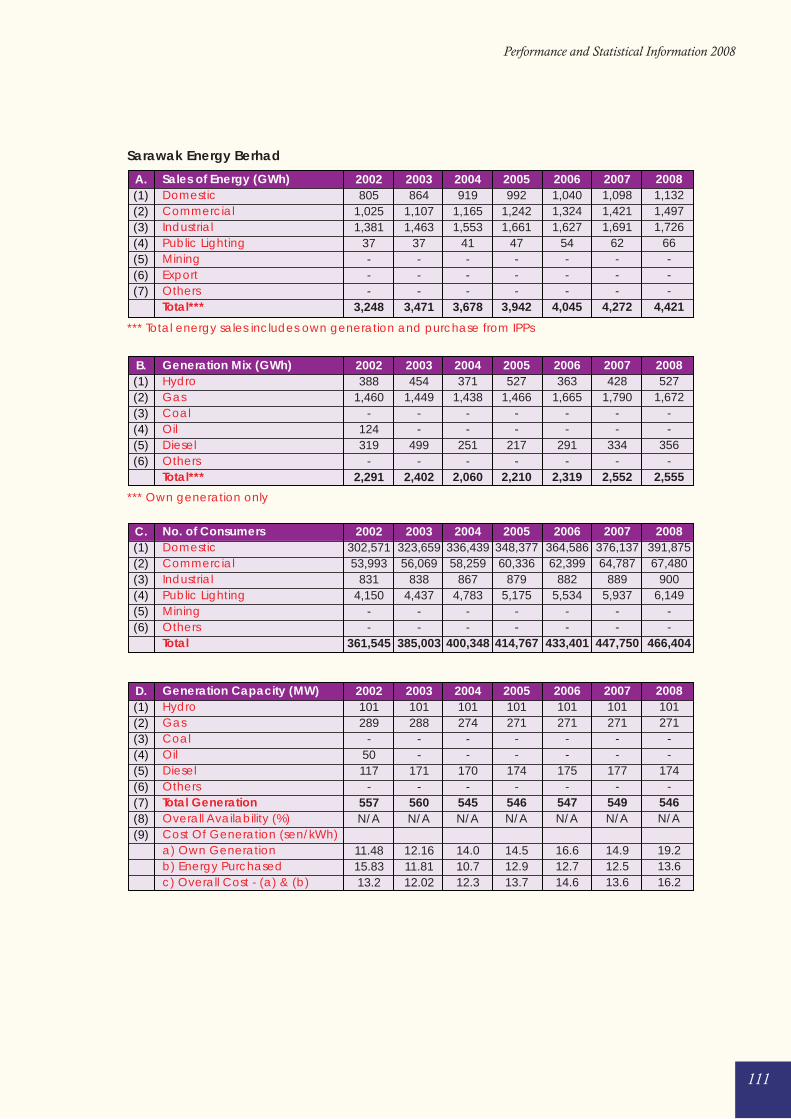
111
Performance and Statistical Information 2008
*** Own generation only
Sarawak Energy Berhad
*** Total energy sales includes own generation and purchase from IPPs
A.(1)(2)(3)(4)(5)(6)(7)
2002805
1,0251,381
37---
3,248
2003864
1,1071,463
37---
3,471
2004919
1,1651,553
41---
3,678
2005992
1,2421,661
47---
3,942
20061,0401,3241,627
54---
4,045
20071,0981,4211,691
62---
4,272
20081,1321,4971,726
66---
4,421
Sales of Energy (GWh)DomesticCommercialIndustrialPublic LightingMiningExportOthersTotal***
B.(1)(2)(3)(4)(5)(6)
2002388
1,460-
124319
-2,291
2003454
1,449--
499-
2,402
2004371
1,438--
251-
2,060
2005527
1,466--
217-
2,210
2006363
1,665--
291-
2,319
2007428
1,790--
334-
2,552
2008527
1,672--
356-
2,555
Generation Mix (GWh)HydroGasCoalOilDieselOthersTotal***
C.(1)(2)(3)(4)(5)(6)
2002302,57153,993
8314,150
--
361,545
2003323,65956,069
8384,437
--
385,003
2004336,43958,259
8674,783
--
400,348
2005348,37760,336
8795,175
--
414,767
2006364,58662,399
8825,534
--
433,401
2007376,13764,787
8895,937
--
447,750
2008391,87567,480
9006,149
--
466,404
No. of ConsumersDomesticCommercialIndustrialPublic LightingMiningOthersTotal
D.(1)(2)(3)(4)(5)(6)(7)(8)(9)
2002101289
-50117
-557N/A
11.4815.8313.2
2003101288
--
171-
560N/A
12.1611.8112.02
2004101274
--
170-
545N/A
14.010.712.3
2005101271
--
174-
546N/A
14.512.913.7
2006101271
--
175-
547N/A
16.612.714.6
2007101271
--
177-
549N/A
14.912.513.6
2008101271
--
174-
546N/A
19.213.616.2
Generation Capacity (MW)HydroGasCoalOilDieselOthersTotal GenerationOverall Availability (%)Cost Of Generation (sen/kWh)a) Own Generationb) Energy Purchasedc) Overall Cost - (a) & (b)
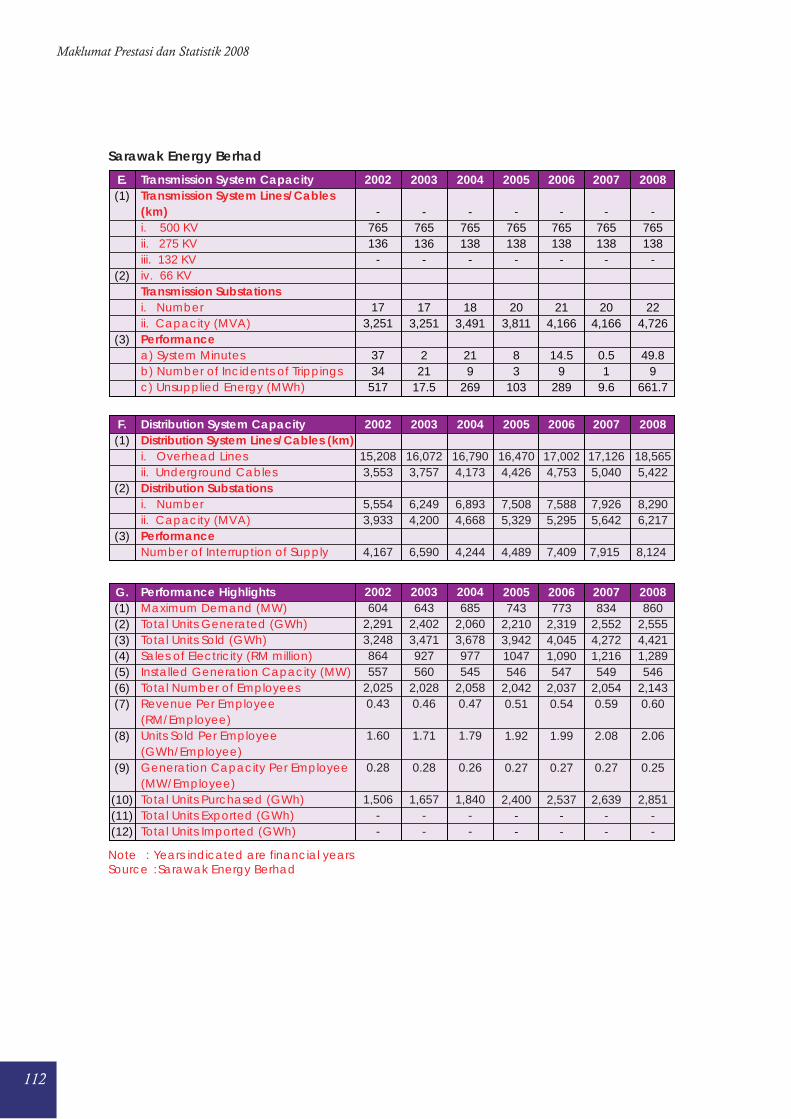
112
Maklumat Prestasi dan Statistik 2008
Note : Years indicated are financial yearsSource : Sarawak Energy Berhad
Sarawak Energy Berhad
E.(1)
(2)
(3)
2003
-765136
-
173,251
221
17.5
2004
-765138
-
183,491
219
269
2005
-765138
-
203,811
83
103
2006
-765138
-
214,166
14.59
289
2007
-765138
-
204,166
0.51
9.6
2008
-765138
-
224,726
49.89
661.7
Transmission System CapacityTransmission System Lines/Cables(km)i. 500 KVii. 275 KViii. 132 KViv. 66 KVTransmission Substationsi. Numberii. Capacity (MVA)Performancea) System Minutesb) Number of Incidents of Trippingsc) Unsupplied Energy (MWh)
2002
-765136
-
173,251
3734
517
G.(1)(2)(3)(4)(5)(6)(7)
(8)
(9)
(10)(11)(12)
2005743
2,2103,9421047546
2,0420.51
1.92
0.27
2,400--
2006773
2,3194,0451,090547
2,0370.54
1.99
0.27
2,537--
2007834
2,5524,2721,216549
2,0540.59
2.08
0.27
2,639--
2008860
2,5554,4211,289546
2,1430.60
2.06
0.25
2,851--
Performance HighlightsMaximum Demand (MW)Total Units Generated (GWh)Total Units Sold (GWh)Sales of Electricity (RM million)Installed Generation Capacity (MW)Total Number of EmployeesRevenue Per Employee(RM/Employee)Units Sold Per Employee(GWh/Employee)Generation Capacity Per Employee(MW/Employee)Total Units Purchased (GWh)Total Units Exported (GWh)Total Units Imported (GWh)
F.(1)
(2)
(3)
2003
16,0723,757
6,2494,200
6,590
2004
16,7904,173
6,8934,668
4,244
2005
16,4704,426
7,5085,329
4,489
2006
17,0024,753
7,5885,295
7,409
2007
17,1265,040
7,9265,642
7,915
2008
18,5655,422
8,2906,217
8,124
Distribution System CapacityDistribution System Lines/Cables (km)i. Overhead Linesii. Underground CablesDistribution Substationsi. Numberii. Capacity (MVA)PerformanceNumber of Interruption of Supply
2002
15,2083,553
5,5543,933
4,167
2003643
2,4023,471927560
2,0280.46
1.71
0.28
1,657--
2004685
2,0603,678977545
2,0580.47
1.79
0.26
1,840--
2002604
2,2913,248864557
2,0250.43
1.60
0.28
1,506--

113
Performance and Statistical Information 2008
Senarai Penjana Kuasa Bebas
List of Independent Power Producers (IPPs)

114
Maklumat Prestasi dan Statistik 2008
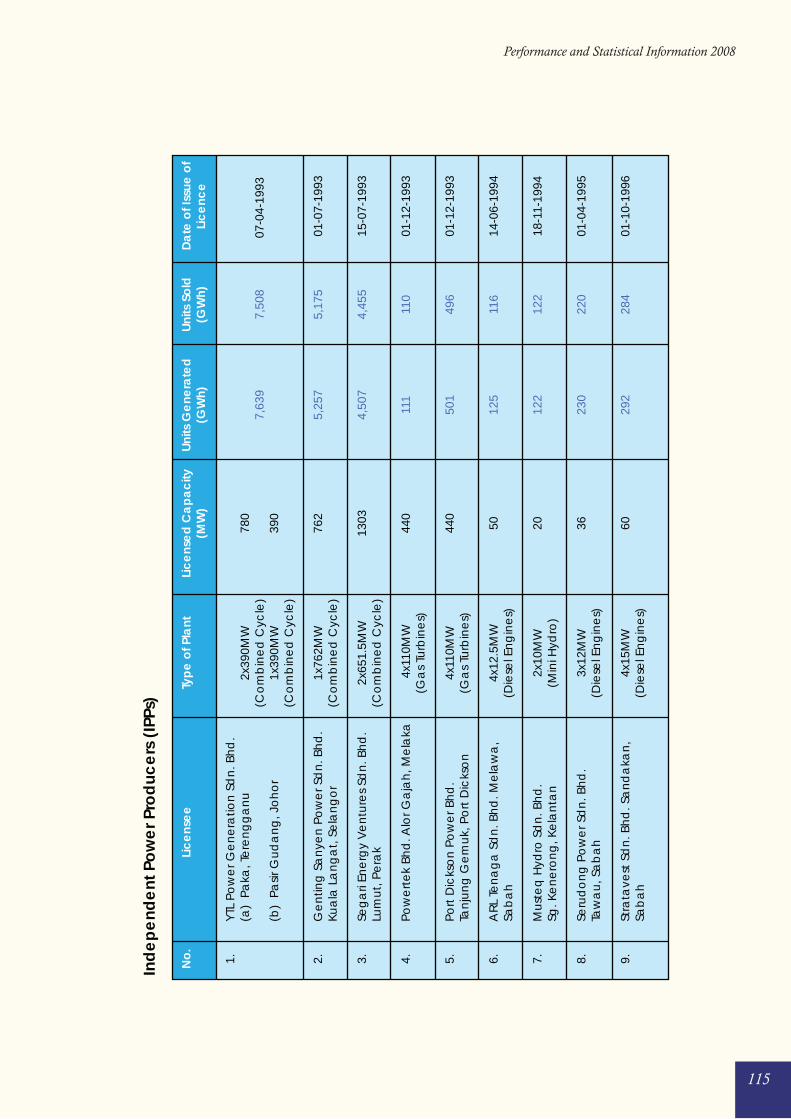
115
Performance and Statistical Information 2008
Ind
ep
end
ent
Po
we
r Pro
duc
ers
(IP
Ps)
No
.
1. 2. 3. 4. 5. 6. 7. 8. 9.
Lic
ens
ed
Ca
pa
city
(MW
)
780
390
762
1303
440
440
50 20 36 60
Uni
ts G
ene
rate
d(G
Wh)
7,63
9
5,25
7
4,50
7
111
501
125
122
230
292
Uni
ts S
old
(GW
h)
7,50
8
5,17
5
4,45
5
110
496
116
122
220
284
Da
te o
f Iss
ue o
fLi
ce
nce
07-0
4-19
93
01-0
7-19
93
15-0
7-19
93
01-1
2-19
93
01-1
2-19
93
14-0
6-19
94
18-1
1-19
94
01-0
4-19
95
01-1
0-19
96
Typ
e o
f Pla
nt
2x
390M
W(C
om
bin
ed
Cyc
le)
1x39
0MW
(Co
mb
ine
d C
ycle
)
1x76
2MW
(Co
mb
ine
d C
ycle
)
2x65
1.5M
W(C
om
bin
ed
Cyc
le)
4x1
10M
W(G
as
Turb
ine
s)
4x11
0MW
(Ga
s Tu
rbin
es)
4x12
.5M
W(D
iese
l En
gin
es)
2x10
MW
(Min
i Hyd
ro)
3x12
MW
(Die
sel E
ng
ine
s)
4x15
MW
(Die
sel E
ng
ine
s)
Li
ce
nse
e
YTL
Pow
er G
en
era
tion
Sd
n. B
hd
.(a
) P
aka
, Te
ren
gg
an
u
(b)
Pa
sir G
ud
an
g, J
oh
or
Ge
ntin
g S
an
yen
Po
we
r Sd
n. B
hd
.Ku
ala
La
ng
at,
Se
lan
go
r
Seg
ari
Ene
rgy
Ve
ntu
res
Sdn
. Bh
d.
Lum
ut,
Pe
rak
Pow
ert
ek
Bhd
. Alo
r Ga
jah
, Me
laka
Port
Dic
kso
n P
ow
er B
hd
.Ta
nju
ng
Ge
mu
k, P
ort
Dic
kso
n
AR
L Te
na
ga
Sd
n. B
hd
. Me
law
a,
Sab
ah
Mu
ste
q H
ydro
Sd
n. B
hd
.Sg
. Ke
ne
ron
g, K
ela
nta
n
Seru
do
ng
Po
we
r Sd
n. B
hd
.Ta
wa
u, S
ab
ah
Stra
tave
st S
dn
. Bh
d. S
an
da
kan
,Sa
ba
h
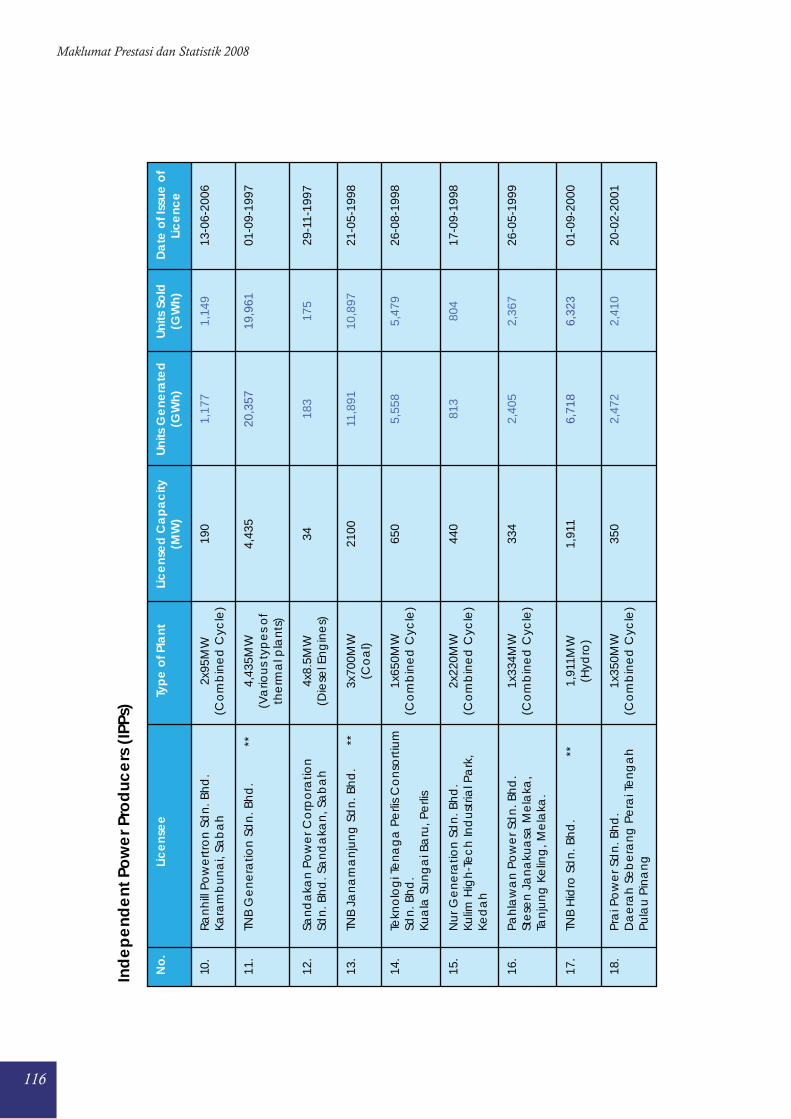
116
Maklumat Prestasi dan Statistik 2008
Ind
ep
end
ent
Po
we
r Pro
duc
ers
(IP
Ps)
No
.
10.
11.
12.
13.
14.
15.
16.
17.
18.
Lic
ens
ed
Ca
pa
city
(MW
)
190
4,43
5
34 2100
650
440
334
1,91
1
350
Uni
ts G
ene
rate
d(G
Wh)
1,17
7
20,3
57
183
11,8
91
5,55
8
813
2,40
5
6,71
8
2,47
2
Uni
ts S
old
(GW
h)
1,14
9
19,9
61
175
10,8
97
5,47
9
804
2,36
7
6,32
3
2,41
0
Da
te o
f Iss
ue o
fLi
ce
nce
13-0
6-20
06
01-0
9-19
97
29-1
1-19
97
21-0
5-19
98
26-0
8-19
98
17-0
9-19
98
26-0
5-19
99
01-0
9-20
00
20-0
2-20
01
Typ
e o
f Pla
nt
2x95
MW
(Co
mb
ine
d C
ycle
)
4,43
5MW
(Va
riou
s ty
pe
s o
fth
erm
al p
lan
ts)
4x8.
5MW
(Die
sel E
ng
ine
s)
3x70
0MW
(Co
al)
1x65
0MW
(Co
mb
ine
d C
ycle
)
2x22
0MW
(Co
mb
ine
d C
ycle
)
1x33
4MW
(Co
mb
ine
d C
ycle
)
1,91
1MW
(Hyd
ro)
1x35
0MW
(Co
mb
ine
d C
ycle
)
Li
ce
nse
e
Ra
nh
ill P
ow
ert
ron
Sd
n. B
hd
.Ka
ram
bu
na
i, Sa
ba
h
TNB
Ge
ne
ratio
n S
dn
. Bh
d.
**
San
da
kan
Po
we
r Co
rpo
ratio
nSd
n. B
hd
. Sa
nd
aka
n, S
ab
ah
TNB
Jan
am
an
jun
g S
dn
. Bh
d.
*
*
Tekn
olo
gi T
en
ag
a P
erli
s C
on
sort
ium
Sdn
. Bh
d.
Kua
la S
un
ga
i Ba
ru, P
erli
s
Nu
r Ge
ne
ratio
n S
dn
. Bh
d.
Kulim
Hig
h-T
ec
h In
du
stria
l Pa
rk,
Ked
ah
Pah
law
an
Po
we
r Sd
n. B
hd
.St
ese
n J
an
aku
asa
Me
laka
,Ta
nju
ng
Ke
ling
, Me
laka
.
TNB
Hid
ro S
dn
. Bh
d.
*
*
Pra
i Po
we
r Sd
n. B
hd
.D
ae
rah
Se
be
ran
g P
era
i Te
ng
ah
Pula
u P
ina
ng
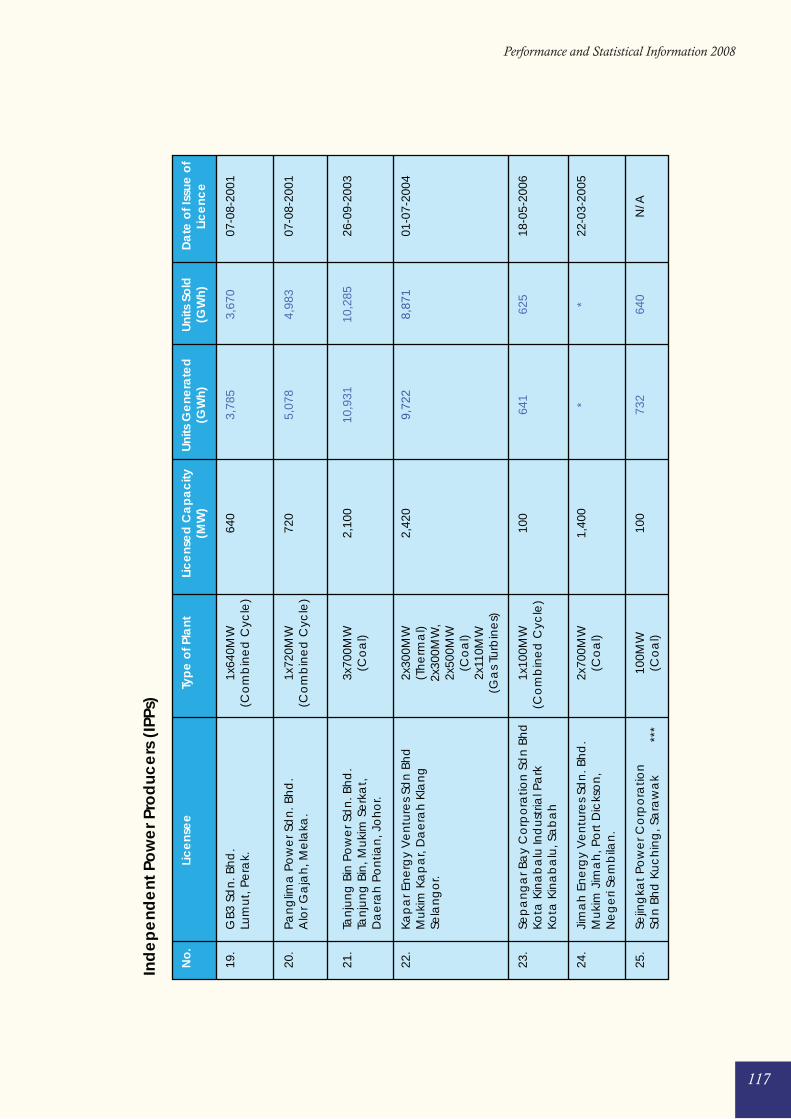
117
Performance and Statistical Information 2008
Ind
ep
end
ent
Po
we
r Pro
duc
ers
(IP
Ps)
No
.
19.
20.
21.
22.
23.
24.
25.
Lic
ens
ed
Ca
pa
city
(MW
)
640
720
2,10
0
2,42
0
100
1,40
0
100
Uni
ts G
ene
rate
d(G
Wh)
3,78
5
5,07
8
10,9
31
9,72
2
641 *
732
Uni
ts S
old
(GW
h)
3,67
0
4,98
3
10,2
85
8,87
1
625 *
640
Da
te o
f Iss
ue o
fLi
ce
nce
07-0
8-20
01
07-0
8-20
01
26-0
9-20
03
01-0
7-20
04
18-0
5-20
06
22-0
3-20
05
N/A
Typ
e o
f Pla
nt
1x64
0MW
(Co
mb
ine
d C
ycle
)
1x72
0MW
(Co
mb
ine
d C
ycle
)
3x70
0MW
(Co
al)
2x30
0MW
(Th
erm
al)
2x30
0MW
,2x
500M
W(C
oa
l)2x
110M
W(G
as
Turb
ine
s)
1x10
0MW
(Co
mb
ine
d C
ycle
)
2x70
0MW
(Co
al)
100M
W(C
oa
l)
Li
ce
nse
e
GB3
Sd
n. B
hd
.Lu
mu
t, P
era
k.
Pan
glim
a P
ow
er S
dn
. Bh
d.
Alo
r Ga
jah
, Me
laka
.
Tan
jun
g B
in P
ow
er S
dn
. Bh
d.
Tan
jun
g B
in, M
uki
m S
erk
at,
Da
era
h P
on
tian
, Jo
ho
r.
Kap
ar E
ne
rgy
Ve
ntu
res
Sdn
Bh
dM
uki
m K
ap
ar,
Da
era
h K
lan
gSe
lan
go
r.
Sep
an
ga
r Ba
y C
orp
ora
tion
Sd
n B
hd
Kota
Kin
ab
alu
Ind
ust
rial P
ark
Kota
Kin
ab
alu
, Sa
ba
h
Jim
ah
En
erg
y V
en
ture
s Sd
n. B
hd
.M
uki
m J
ima
h, P
ort
Dic
kso
n,
Ne
ge
ri Se
mb
ilan
.
Sejin
gka
t Po
we
r Co
rpo
ratio
nSd
n B
hd
Ku
ch
ing
, Sa
raw
ak
**
*
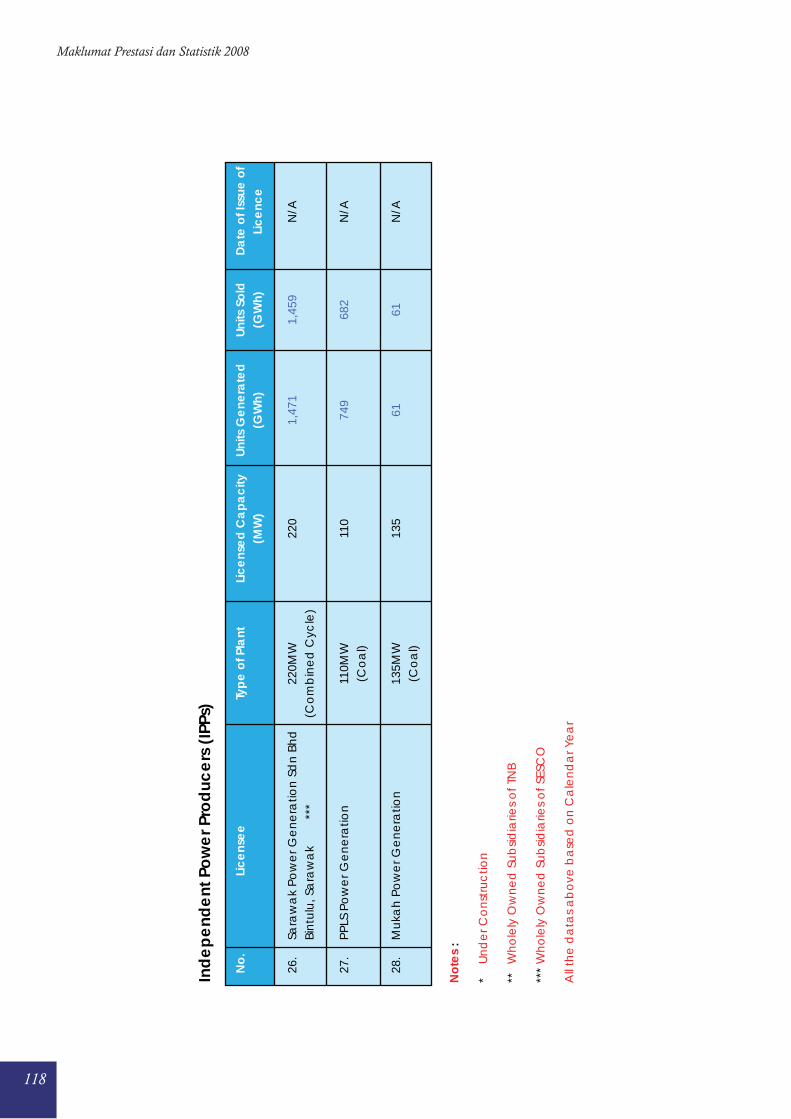
118
Maklumat Prestasi dan Statistik 2008
No
tes
:
* U
nd
er C
on
stru
ctio
n
**
Wh
ole
ly O
wn
ed
Su
bsid
iarie
s o
f TN
B
***
Wh
ole
ly O
wn
ed
Su
bsid
iarie
s o
f SES
CO
All
the
da
tas
ab
ove
ba
sed
on
Ca
len
da
r Ye
ar
Ind
ep
end
ent
Po
we
r Pro
duc
ers
(IP
Ps)
No
.
26.
27.
28.
Lic
ens
ed
Ca
pa
city
(MW
)
220
110
135
Uni
ts G
ene
rate
d(G
Wh)
1,47
1
749
61
Uni
ts S
old
(GW
h)
1,45
9
682
61
Da
te o
f Iss
ue o
fLi
ce
nce
N/A
N/A
N/A
Typ
e o
f Pla
nt
220M
W(C
om
bin
ed
Cyc
le)
110M
W(C
oa
l)
135M
W(C
oa
l)
Li
ce
nse
e
Sara
wa
k Po
we
r Ge
ne
ratio
n S
dn
Bh
dBi
ntu
lu, S
ara
wa
k
*
**
PPLS
Po
we
r Ge
ne
ratio
n
Mu
kah
Po
we
r Ge
ne
ratio
n
119
Performance and Statistical Information 2008
Senarai Penjana Kuasa Menggunakan Sumber TenagaYang Boleh Diperbaharui
List of Small Renewable Energy Power Producers (SREP)

120
Maklumat Prestasi dan Statistik 2008
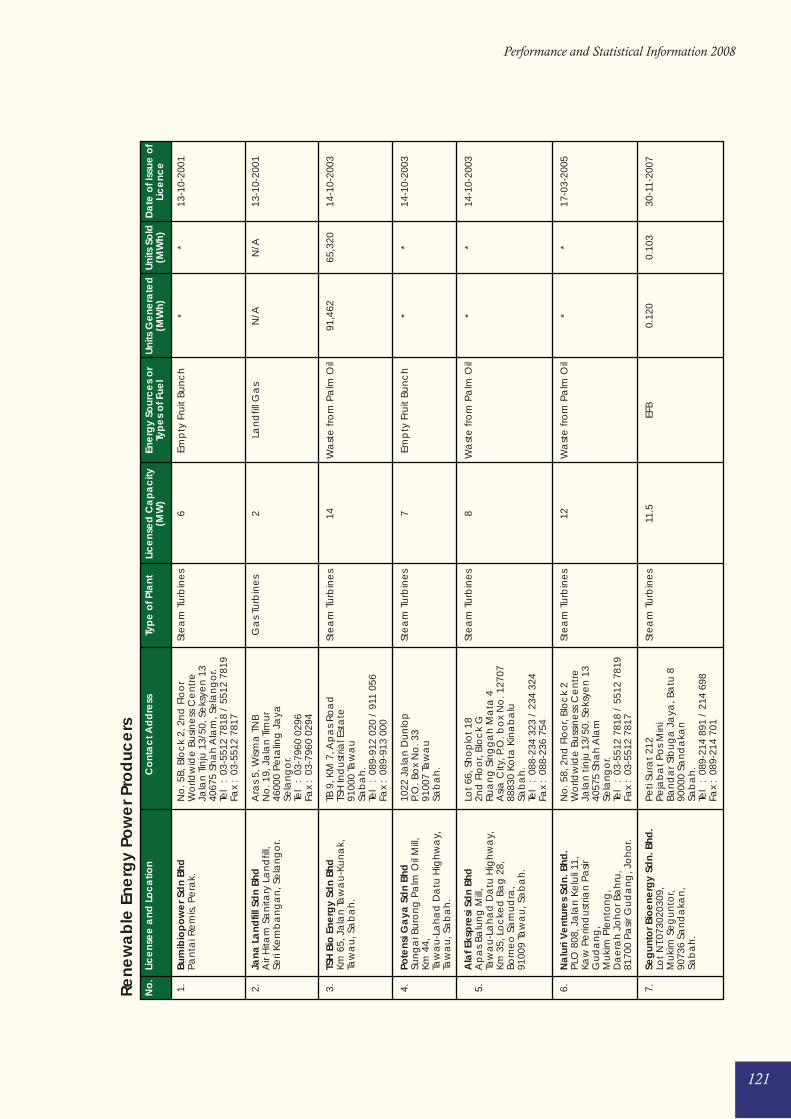
121
Performance and Statistical Information 2008
No
.
1. 2. 3. 4. 5. 6. 7.
Lic
ens
ee
and
Lo
ca
tion
Bum
ibio
po
we
r Sd
n Bh
dPa
nta
i Re
mis,
Pe
rak.
Jana
La
ndfil
l Sd
n Bh
dA
ir H
itam
Sa
nita
ry L
an
dfil
l,Se
ri Ke
mb
an
ga
n, S
ela
ng
or.
TSH
Bio
Ene
rgy
Sdn
Bhd
Km 6
5, J
ala
n Ta
wa
u-K
un
ak,
Taw
au
, Sa
ba
h.
Pote
nsi G
aya
Sd
n Bh
dSu
ng
ai B
uro
ng
Pa
lm O
il M
ill,
Km 4
4,Ta
wa
u-L
ah
ad
Da
tu H
igh
wa
y,Ta
wa
u, S
ab
ah
.
Ala
f Eks
pre
si S
dn
Bhd
Ap
as
Balu
ng
Mill
,Ta
wa
u-L
ah
ad
Da
tu H
igh
wa
y,Km
35,
Lo
cke
d B
ag
28,
Born
eo
Sa
mu
dra
,91
009
Taw
au
, Sa
ba
h.
Na
luri
Ve
ntur
es
Sdn.
Bhd
.PL
O 8
08, J
ala
n K
elu
li 11
,Ka
w P
erin
du
stria
n P
asir
Gu
da
ng
,M
uki
m P
len
ton
g,
Da
era
h J
oh
or B
ah
ru,
8170
0 Pa
sir G
ud
an
g, J
oh
or.
Seg
unto
r Bio
ene
rgy
Sdn.
Bhd
.Lo
t N
T.073
0203
09,
Mu
kim
Se
gu
nto
r,90
736
San
da
kan
,Sa
ba
h.
Co
nta
ct A
dd
ress
No
. 5B,
Blo
ck
2, 2
nd
Flo
or
Wo
rldw
ide
Bu
sine
ss C
en
tre
Jala
n T
inju
13/
50, S
eks
yen
13
4067
5 Sh
ah
Ala
m, S
ela
ng
or.
Tel
: 03
-551
2 78
18 /
551
2 78
19Fa
x :
03-5
512
7817
Ara
s 5,
Wism
a T
NB
No
. 19,
Ja
lan
Tim
ur
4600
0 Pe
talin
g J
aya
Sela
ng
or.
Tel
: 03
-796
0 02
96Fa
x :
03-7
960
0294
TB 9
, KM
7, A
pa
s R
oa
dTS
H In
du
stria
l Est
ate
9100
0 Ta
wa
uSa
ba
h.
Tel
: 08
9-91
2 02
0 /
911
056
Fax
: 08
9-91
3 00
0
1022
Ja
lan
Du
nlo
pP.
O. B
ox
No
. 33
9100
7 Ta
wa
uSa
ba
h.
Lot
66, S
ho
plo
t 18
2nd
Flo
or,
Blo
ck
GR
ua
ng
Sin
gg
ah
Ma
ta 4
Asia
City
, P.O
. bo
x N
o. 1
2707
8883
0 Ko
ta K
ina
ba
luSa
ba
h.
Tel
: 08
8-23
4 32
3 /
234
324
Fax
: 08
8-23
6 75
4
No
. 58,
2n
d F
loo
r, Bl
oc
k 2
Wo
rldw
ide
Bu
ssin
ess
Ce
ntr
eJa
lan
tin
ju 1
3/50
, Se
ksye
n 1
340
575
Sha
h A
lam
Sela
ng
or.
Tel
: 03
-551
2 78
18 /
551
2 78
19Fa
x :
03-5
512
7817
Peti
Sura
t 21
2Pe
jab
at
Pos
Min
iBa
nd
ar S
ibu
ga
Ja
ya, B
atu
890
000
San
da
kan
Sab
ah
.Te
l :
089-
214
891
/ 21
4 69
8Fa
x :
089-
214
701
Typ
e o
f Pla
nt
Ste
am
Tu
rbin
es
Ga
s Tu
rbin
es
Ste
am
Tu
rbin
es
Ste
am
Tu
rbin
es
Ste
am
Tu
rbin
es
Ste
am
Tu
rbin
es
Ste
am
Tu
rbin
es
Lic
ens
ed
Ca
pa
city
(MW
)
6 2 14 7 8 12 11.5
Ene
rgy
Sour
ce
s o
rTy
pe
s o
f Fue
l
Emp
ty F
ruit
Bun
ch
Lan
dfil
l Ga
s
Wa
ste
fro
m P
alm
Oil
Emp
ty F
ruit
Bun
ch
Wa
ste
fro
m P
alm
Oil
Wa
ste
fro
m P
alm
Oil
EFB
Uni
ts G
ene
rate
d(M
Wh)
*
N/A
91,4
62
* * *
0.12
0
Uni
ts S
old
(MW
h)
*
N/A
65,3
20
* * *
0.10
3
Da
te o
f Iss
ue o
fLi
ce
nce
13-1
0-20
01
13-1
0-20
01
14-1
0-20
03
14-1
0-20
03
14-1
0-20
03
17-0
3-20
05
30-1
1-20
07
Rene
wa
ble
Ene
rgy
Pow
er P
rod
uce
rs
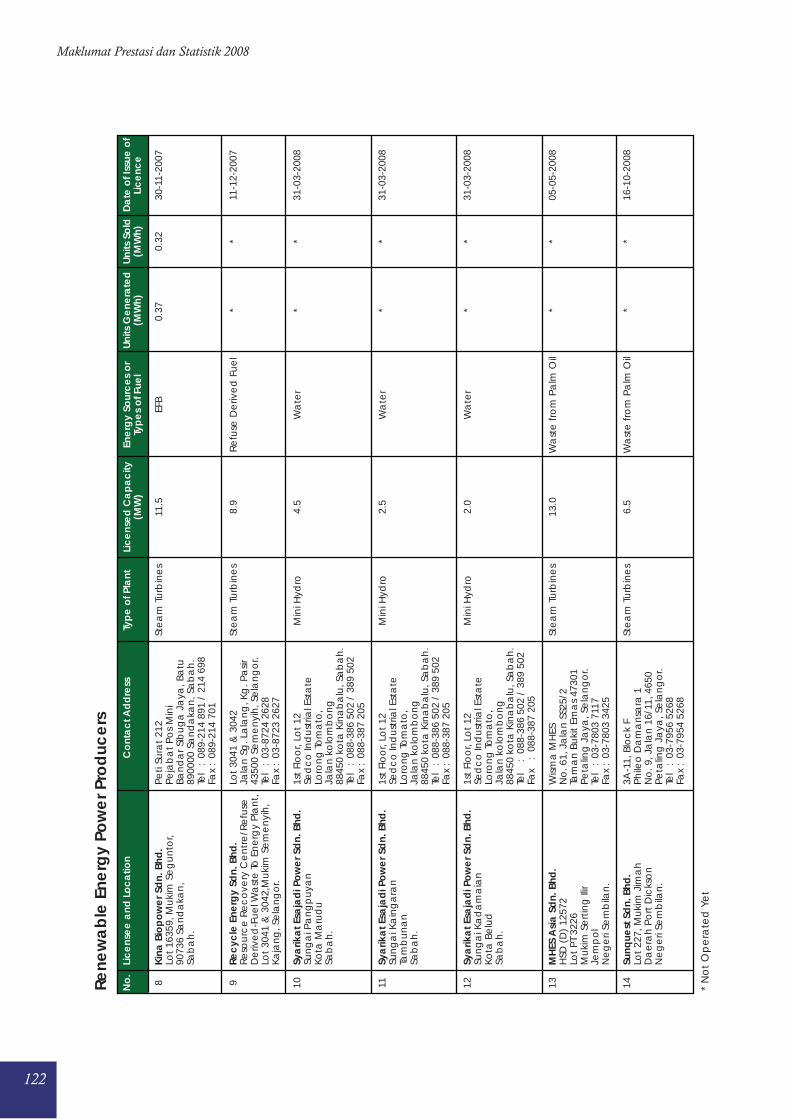
122
Maklumat Prestasi dan Statistik 2008
No
.
8 9 10 11 12 13 14
Lic
ens
ee
and
Lo
ca
tion
Kin
a B
iop
ow
er S
dn.
Bhd
.Lo
t 16
359,
Mu
kim
Se
gu
nto
r,90
736
San
da
kan
,Sa
ba
h.
Rec
ycle
Ene
rgy
Sdn.
Bhd
.R
eso
urc
e R
ec
ove
ry C
en
tre
/Re
fuse
De
rive
d-F
ue
l Wa
ste
To E
ne
rgy
Pla
nt,
Lot
3041
& 3
042,
Mu
kim
Se
me
nyi
h,
Kaja
ng
, Se
lan
go
r.
Sya
rika
t Esa
jad
i Po
we
r Sd
n. B
hd.
Sun
ga
i Pa
ng
pu
yan
Kota
Ma
rud
uSa
ba
h.
Sya
rika
t Esa
jad
i Po
we
r Sd
n. B
hd.
Sun
ga
i Ka
ing
ara
nTa
mb
un
an
Sab
ah
.
Sya
rika
t Esa
jad
i Po
we
r Sd
n. B
hd.
Sun
ga
i Ka
da
ma
ian
Kota
Be
lud
Sab
ah
.
MH
ES A
sia
Sd
n. B
hd.
HSD
(D
) 12
572
Lot
PT 3
226
Mu
kim
Se
rtin
g Il
irJe
mp
ol
Ne
ge
ri Se
mb
ilan
.
Sunq
uest
Sd
n. B
hd.
Lot
227,
Mu
kim
Jim
ah
Da
era
h P
ort
Dic
kso
nN
eg
eri
Sem
bila
n.
Co
nta
ct A
dd
ress
Peti
Sura
t 21
2Pe
jab
at
Pos
Min
iBa
nd
ar S
ibu
ga
Ja
ya, B
atu
8900
00 S
an
da
kan
, Sa
ba
h.
Tel
: 08
9-21
4 89
1 /
214
698
Fax
: 08
9-21
4 70
1
Lot
3041
& 3
042
Jala
n S
g. L
ala
ng
, Kg
. Pa
sir43
500
Sem
en
yih
, Se
lan
go
r.Te
l :
03-8
724
2628
Fax
: 03
-872
3 26
27
1st
Flo
or,
Lot
12Se
dc
o In
du
stria
l Est
ate
Loro
ng
Tom
ato
,Ja
lan
ko
lom
bo
ng
8845
0 ko
ta K
ina
ba
lu, S
ab
ah
.Te
l :
088-
386
502
/ 38
9 50
2Fa
x :
088-
387
205
1st
Flo
or,
Lot
12Se
dc
o In
du
stria
l Est
ate
Loro
ng
Tom
ato
,Ja
lan
ko
lom
bo
ng
8845
0 ko
ta K
ina
ba
lu, S
ab
ah
.Te
l :
088-
386
502
/ 38
9 50
2Fa
x :
088-
387
205
1st
Flo
or,
Lot
12Se
dc
o In
du
stria
l Est
ate
Loro
ng
Tom
ato
,Ja
lan
ko
lom
bo
ng
8845
0 ko
ta K
ina
ba
lu, S
ab
ah
.Te
l :
088
-386
502
/ 3
89 5
02Fa
x :
088
-387
205
Wism
a M
HES
No
. 61,
Ja
lan
SS2
5/2
Tam
an
Bu
kit
Ema
s 47
301
Peta
ling
Ja
ya, S
ela
ng
or.
Tel
: 03
-780
3 71
17Fa
x :
03-7
803
3425
3A-1
1, B
loc
k F
Phile
o D
am
an
sara
1N
o. 9
, Ja
lan
16/
11, 4
650
Peta
ling
Ja
ya, S
ela
ng
or.
Tel
: 03
-795
6 52
68Fa
x :
03-7
954
5268
Typ
e o
f Pla
nt
Ste
am
Tu
rbin
es
Ste
am
Tu
rbin
es
Min
i Hyd
ro
Min
i Hyd
ro
Min
i Hyd
ro
Ste
am
Tu
rbin
es
Ste
am
Tu
rbin
es
Lic
ens
ed
Ca
pa
city
(MW
)
11.5
8.9
4.5
2.5
2.0
13.0
6.5
Ene
rgy
Sour
ce
s o
rTy
pe
s o
f Fue
l
EFB
Re
fuse
De
rive
d F
ue
l
Wa
ter
Wa
ter
Wa
ter
Wa
ste
fro
m P
alm
Oil
Wa
ste
fro
m P
alm
Oil
Uni
ts G
ene
rate
d(M
Wh)
0.37
* * * * * *
Uni
ts S
old
(MW
h)
0.32 * * * * * *
Da
te o
f Iss
ue o
fLi
ce
nce
30-1
1-20
07
11-1
2-20
07
31-0
3-20
08
31-0
3-20
08
31-0
3-20
08
05-0
5-20
08
16-1
0-20
08
* N
ot
Op
era
ted
Ye
t
Rene
wa
ble
Ene
rgy
Pow
er P
rod
uce
rs

123
Performance and Statistical Information 2008
Senarai Pengagih Elektrik
List of Electricity Distributors

124
Maklumat Prestasi dan Statistik 2008
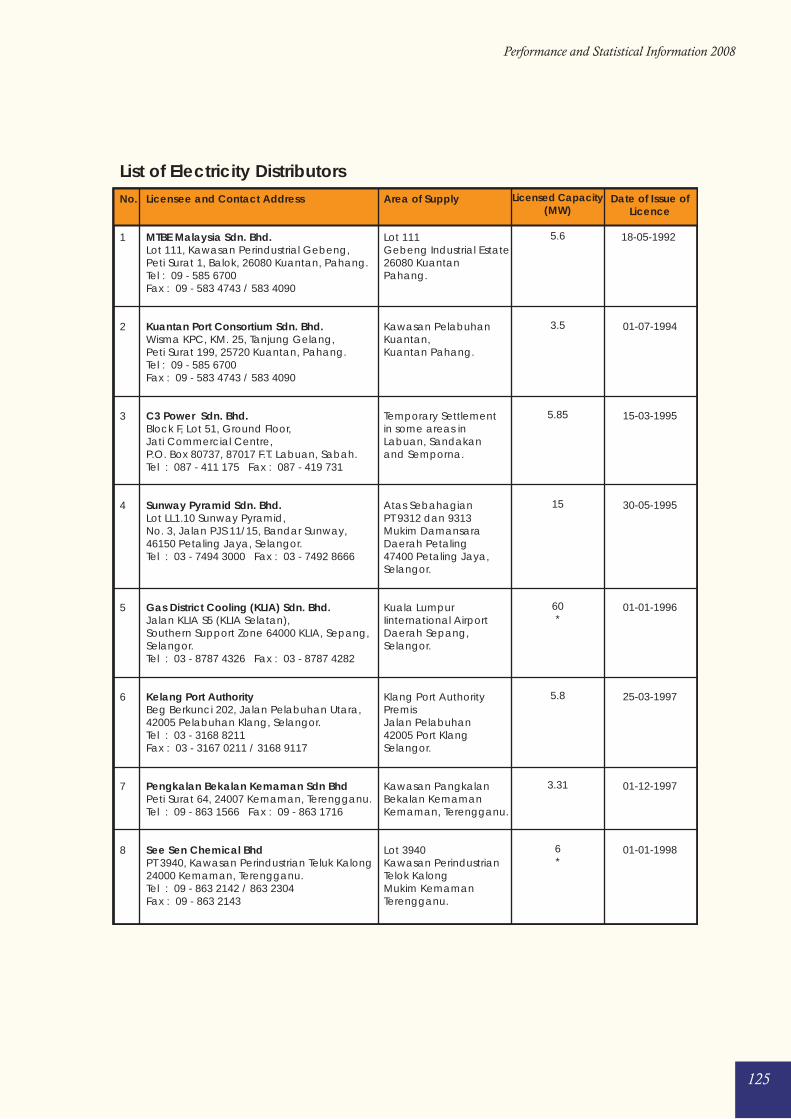
125
Performance and Statistical Information 2008
List of Electricity Distributors No. Licensee and Contact Address Area of Supply
1 MTBE Malaysia Sdn. Bhd. Lot 111 Lot 111, Kawasan Perindustrial Gebeng, Gebeng Industrial Estate Peti Surat 1, Balok, 26080 Kuantan, Pahang. 26080 Kuantan Tel : 09 - 585 6700 Pahang. Fax : 09 - 583 4743 / 583 4090
2 Kuantan Port Consortium Sdn. Bhd. Kawasan Pelabuhan Wisma KPC, KM. 25, Tanjung Gelang, Kuantan, Peti Surat 199, 25720 Kuantan, Pahang. Kuantan Pahang. Tel : 09 - 585 6700 Fax : 09 - 583 4743 / 583 4090
3 C3 Power Sdn. Bhd. Temporary Settlement Block F, Lot 51, Ground Floor, in some areas in Jati Commercial Centre, Labuan, Sandakan P.O. Box 80737, 87017 F.T. Labuan, Sabah. and Semporna. Tel : 087 - 411 175 Fax : 087 - 419 731
4 Sunway Pyramid Sdn. Bhd. Atas Sebahagian Lot LL1.10 Sunway Pyramid, PT 9312 dan 9313 No. 3, Jalan PJS 11/15, Bandar Sunway, Mukim Damansara 46150 Petaling Jaya, Selangor. Daerah Petaling Tel : 03 - 7494 3000 Fax : 03 - 7492 8666 47400 Petaling Jaya, Selangor.
5 Gas District Cooling (KLIA) Sdn. Bhd. Kuala Lumpur Jalan KLIA S5 (KLIA Selatan), Iinternational Airport Southern Support Zone 64000 KLIA, Sepang, Daerah Sepang, Selangor. Selangor. Tel : 03 - 8787 4326 Fax : 03 - 8787 4282
6 Kelang Port Authority Klang Port Authority Beg Berkunci 202, Jalan Pelabuhan Utara, Premis 42005 Pelabuhan Klang, Selangor. Jalan Pelabuhan Tel : 03 - 3168 8211 42005 Port Klang Fax : 03 - 3167 0211 / 3168 9117 Selangor.
7 Pengkalan Bekalan Kemaman Sdn Bhd Kawasan Pangkalan Peti Surat 64, 24007 Kemaman, Terengganu. Bekalan Kemaman Tel : 09 - 863 1566 Fax : 09 - 863 1716 Kemaman, Terengganu.
8 See Sen Chemical Bhd Lot 3940 PT 3940, Kawasan Perindustrian Teluk Kalong Kawasan Perindustrian 24000 Kemaman, Terengganu. Telok Kalong Tel : 09 - 863 2142 / 863 2304 Mukim Kemaman Fax : 09 - 863 2143 Terengganu.
Licensed Capacity(MW)
5.6
3.5
5.85
15
60*
5.8
3.31
6*
Date of Issue ofLicence
18-05-1992
01-07-1994
15-03-1995
30-05-1995
01-01-1996
25-03-1997
01-12-1997
01-01-1998
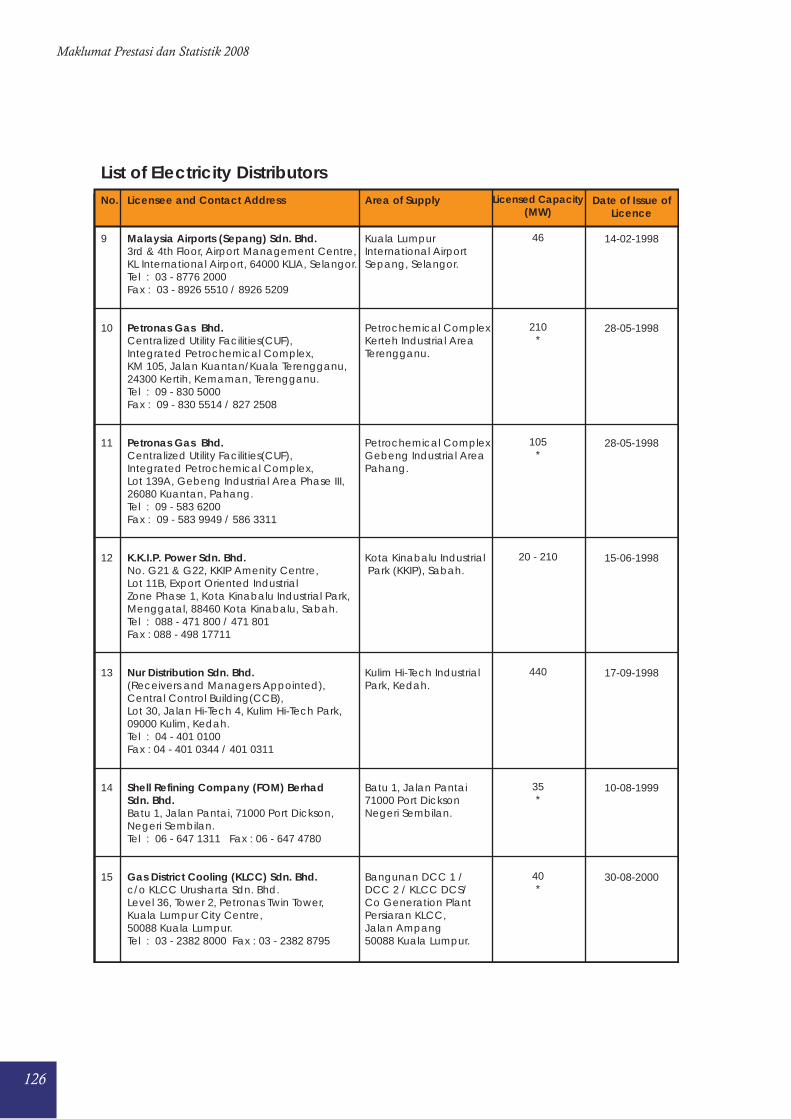
126
Maklumat Prestasi dan Statistik 2008
List of Electricity DistributorsNo. Licensee and Contact Address Area of Supply
9 Malaysia Airports (Sepang) Sdn. Bhd. Kuala Lumpur 3rd & 4th Floor, Airport Management Centre, International Airport KL International Airport, 64000 KLIA, Selangor. Sepang, Selangor. Tel : 03 - 8776 2000 Fax : 03 - 8926 5510 / 8926 5209
10 Petronas Gas Bhd. Petrochemical Complex Centralized Utility Facilities(CUF), Kerteh Industrial Area Integrated Petrochemical Complex, Terengganu. KM 105, Jalan Kuantan/Kuala Terengganu, 24300 Kertih, Kemaman, Terengganu. Tel : 09 - 830 5000 Fax : 09 - 830 5514 / 827 2508
11 Petronas Gas Bhd. Petrochemical Complex Centralized Utility Facilities(CUF), Gebeng Industrial Area Integrated Petrochemical Complex, Pahang. Lot 139A, Gebeng Industrial Area Phase III, 26080 Kuantan, Pahang. Tel : 09 - 583 6200 Fax : 09 - 583 9949 / 586 3311
12 K.K.I.P. Power Sdn. Bhd. Kota Kinabalu Industrial No. G21 & G22, KKIP Amenity Centre, Park (KKIP), Sabah. Lot 11B, Export Oriented Industrial Zone Phase 1, Kota Kinabalu Industrial Park, Menggatal, 88460 Kota Kinabalu, Sabah. Tel : 088 - 471 800 / 471 801 Fax : 088 - 498 17711
13 Nur Distribution Sdn. Bhd. Kulim Hi-Tech Industrial (Receivers and Managers Appointed), Park, Kedah. Central Control Building(CCB), Lot 30, Jalan Hi-Tech 4, Kulim Hi-Tech Park, 09000 Kulim, Kedah. Tel : 04 - 401 0100 Fax : 04 - 401 0344 / 401 0311
14 Shell Refining Company (FOM) Berhad Batu 1, Jalan Pantai Sdn. Bhd. 71000 Port Dickson Batu 1, Jalan Pantai, 71000 Port Dickson, Negeri Sembilan. Negeri Sembilan. Tel : 06 - 647 1311 Fax : 06 - 647 4780
15 Gas District Cooling (KLCC) Sdn. Bhd. Bangunan DCC 1 / c/o KLCC Urusharta Sdn. Bhd. DCC 2 / KLCC DCS/ Level 36, Tower 2, Petronas Twin Tower, Co Generation Plant Kuala Lumpur City Centre, Persiaran KLCC, 50088 Kuala Lumpur. Jalan Ampang Tel : 03 - 2382 8000 Fax : 03 - 2382 8795 50088 Kuala Lumpur.
Licensed Capacity(MW)
46
210*
105*
20 - 210
440
35*
40*
Date of Issue ofLicence
14-02-1998
28-05-1998
28-05-1998
15-06-1998
17-09-1998
10-08-1999
30-08-2000
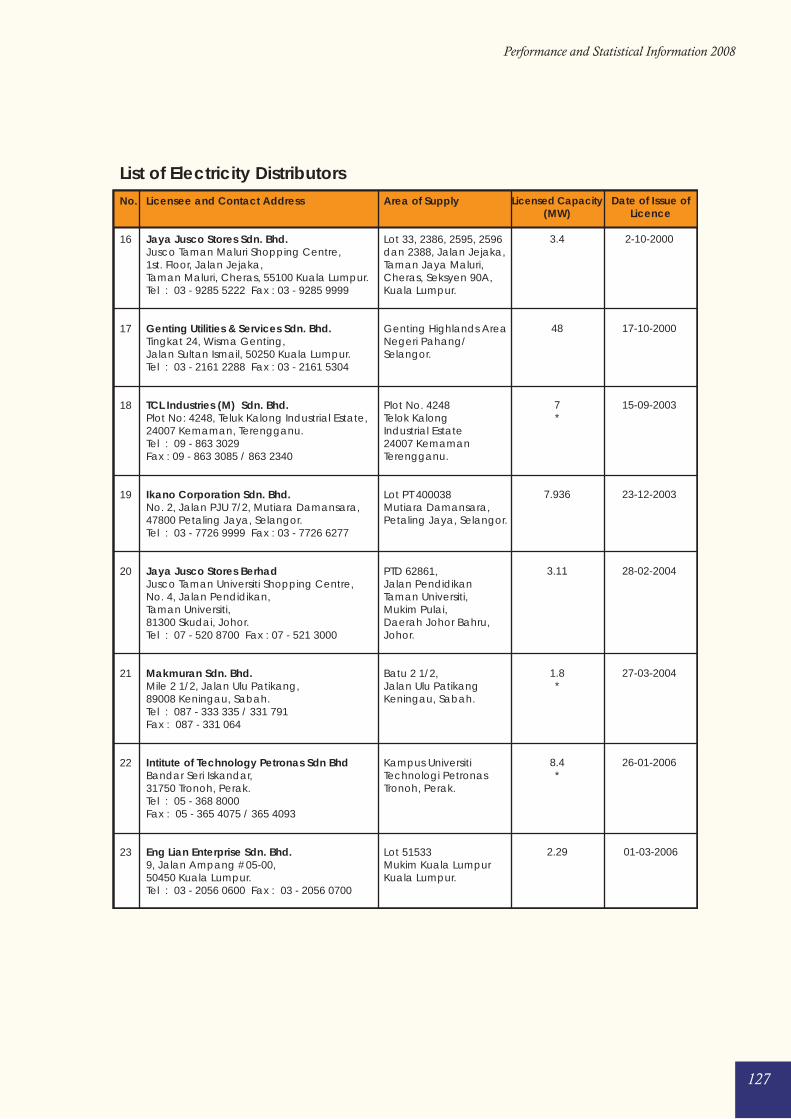
127
Performance and Statistical Information 2008
List of Electricity Distributors No. Licensee and Contact Address Area of Supply
16 Jaya Jusco Stores Sdn. Bhd. Lot 33, 2386, 2595, 2596 Jusco Taman Maluri Shopping Centre, dan 2388, Jalan Jejaka, 1st. Floor, Jalan Jejaka, Taman Jaya Maluri, Taman Maluri, Cheras, 55100 Kuala Lumpur. Cheras, Seksyen 90A, Tel : 03 - 9285 5222 Fax : 03 - 9285 9999 Kuala Lumpur.
17 Genting Utilities & Services Sdn. Bhd. Genting Highlands Area Tingkat 24, Wisma Genting, Negeri Pahang/ Jalan Sultan Ismail, 50250 Kuala Lumpur. Selangor. Tel : 03 - 2161 2288 Fax : 03 - 2161 5304
18 TCL Industries (M) Sdn. Bhd. Plot No. 4248 Plot No: 4248, Teluk Kalong Industrial Estate, Telok Kalong 24007 Kemaman, Terengganu. Industrial Estate Tel : 09 - 863 3029 24007 Kemaman Fax : 09 - 863 3085 / 863 2340 Terengganu.
19 Ikano Corporation Sdn. Bhd. Lot PT 400038 No. 2, Jalan PJU 7/2, Mutiara Damansara, Mutiara Damansara, 47800 Petaling Jaya, Selangor. Petaling Jaya, Selangor. Tel : 03 - 7726 9999 Fax : 03 - 7726 6277
20 Jaya Jusco Stores Berhad PTD 62861, Jusco Taman Universiti Shopping Centre, Jalan Pendidikan No. 4, Jalan Pendidikan, Taman Universiti, Taman Universiti, Mukim Pulai, 81300 Skudai, Johor. Daerah Johor Bahru, Tel : 07 - 520 8700 Fax : 07 - 521 3000 Johor.
21 Makmuran Sdn. Bhd. Batu 2 1/2, Mile 2 1/2, Jalan Ulu Patikang, Jalan Ulu Patikang 89008 Keningau, Sabah. Keningau, Sabah. Tel : 087 - 333 335 / 331 791 Fax : 087 - 331 064
22 Intitute of Technology Petronas Sdn Bhd Kampus Universiti Bandar Seri Iskandar, Technologi Petronas 31750 Tronoh, Perak. Tronoh, Perak. Tel : 05 - 368 8000 Fax : 05 - 365 4075 / 365 4093
23 Eng Lian Enterprise Sdn. Bhd. Lot 51533 9, Jalan Ampang #05-00, Mukim Kuala Lumpur 50450 Kuala Lumpur. Kuala Lumpur. Tel : 03 - 2056 0600 Fax : 03 - 2056 0700
Licensed Capacity(MW)
3.4
48
7*
7.936
3.11
1.8*
8.4*
2.29
Date of Issue ofLicence
2-10-2000
17-10-2000
15-09-2003
23-12-2003
28-02-2004
27-03-2004
26-01-2006
01-03-2006
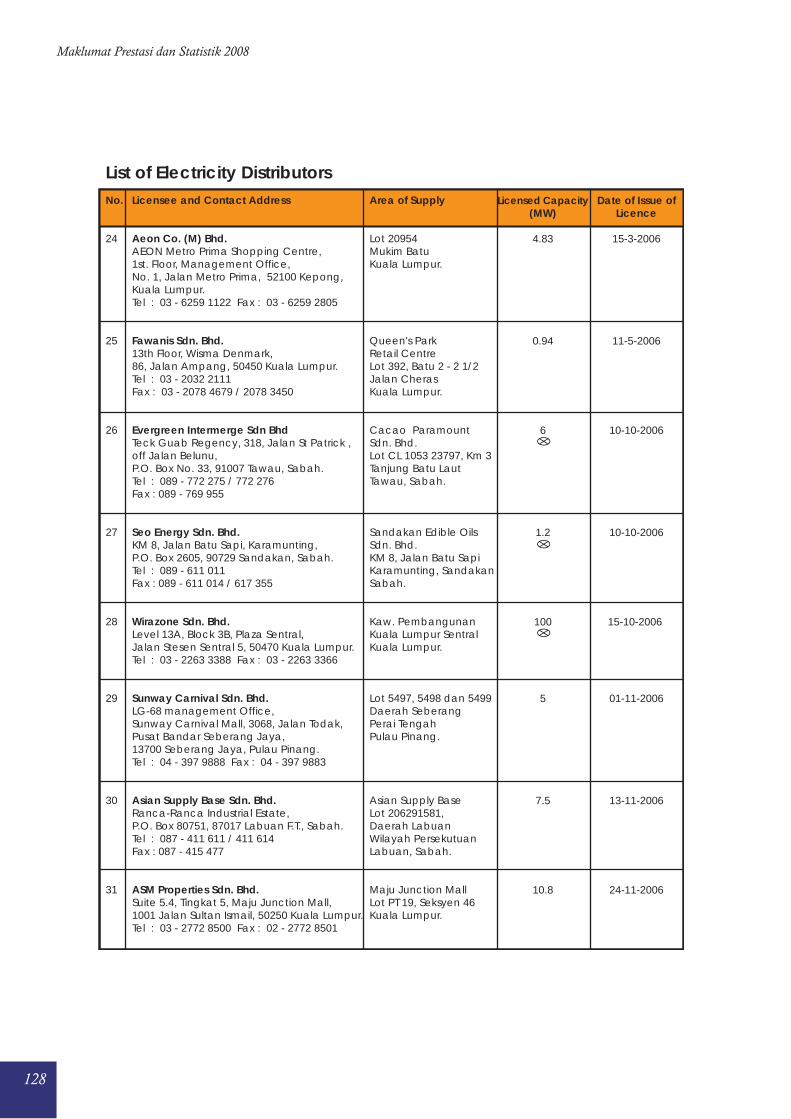
128
Maklumat Prestasi dan Statistik 2008
List of Electricity DistributorsNo. Licensee and Contact Address Area of Supply
24 Aeon Co. (M) Bhd. Lot 20954 AEON Metro Prima Shopping Centre, Mukim Batu 1st. Floor, Management Office, Kuala Lumpur. No. 1, Jalan Metro Prima, 52100 Kepong, Kuala Lumpur. Tel : 03 - 6259 1122 Fax : 03 - 6259 2805
25 Fawanis Sdn. Bhd. Queen's Park 13th Floor, Wisma Denmark, Retail Centre 86, Jalan Ampang, 50450 Kuala Lumpur. Lot 392, Batu 2 - 2 1/2 Tel : 03 - 2032 2111 Jalan Cheras Fax : 03 - 2078 4679 / 2078 3450 Kuala Lumpur.
26 Evergreen Intermerge Sdn Bhd Cacao Paramount Teck Guab Regency, 318, Jalan St Patrick , Sdn. Bhd. off Jalan Belunu, Lot CL 1053 23797, Km 3 P.O. Box No. 33, 91007 Tawau, Sabah. Tanjung Batu Laut Tel : 089 - 772 275 / 772 276 Tawau, Sabah. Fax : 089 - 769 955
27 Seo Energy Sdn. Bhd. Sandakan Edible Oils KM 8, Jalan Batu Sapi, Karamunting, Sdn. Bhd. P.O. Box 2605, 90729 Sandakan, Sabah. KM 8, Jalan Batu Sapi Tel : 089 - 611 011 Karamunting, Sandakan Fax : 089 - 611 014 / 617 355 Sabah.
28 Wirazone Sdn. Bhd. Kaw. Pembangunan Level 13A, Block 3B, Plaza Sentral, Kuala Lumpur Sentral Jalan Stesen Sentral 5, 50470 Kuala Lumpur. Kuala Lumpur. Tel : 03 - 2263 3388 Fax : 03 - 2263 3366
29 Sunway Carnival Sdn. Bhd. Lot 5497, 5498 dan 5499 LG-68 management Office, Daerah Seberang Sunway Carnival Mall, 3068, Jalan Todak, Perai Tengah Pusat Bandar Seberang Jaya, Pulau Pinang. 13700 Seberang Jaya, Pulau Pinang. Tel : 04 - 397 9888 Fax : 04 - 397 9883
30 Asian Supply Base Sdn. Bhd. Asian Supply Base Ranca-Ranca Industrial Estate, Lot 206291581, P.O. Box 80751, 87017 Labuan F.T., Sabah. Daerah Labuan Tel : 087 - 411 611 / 411 614 Wilayah Persekutuan Fax : 087 - 415 477 Labuan, Sabah.
31 ASM Properties Sdn. Bhd. Maju Junction Mall Suite 5.4, Tingkat 5, Maju Junction Mall, Lot PT 19, Seksyen 46 1001 Jalan Sultan Ismail, 50250 Kuala Lumpur. Kuala Lumpur. Tel : 03 - 2772 8500 Fax : 02 - 2772 8501
Licensed Capacity(MW)
4.83
0.94
6
1.2
100
5
7.5
10.8
Date of Issue ofLicence
15-3-2006
11-5-2006
10-10-2006
10-10-2006
15-10-2006
01-11-2006
13-11-2006
24-11-2006
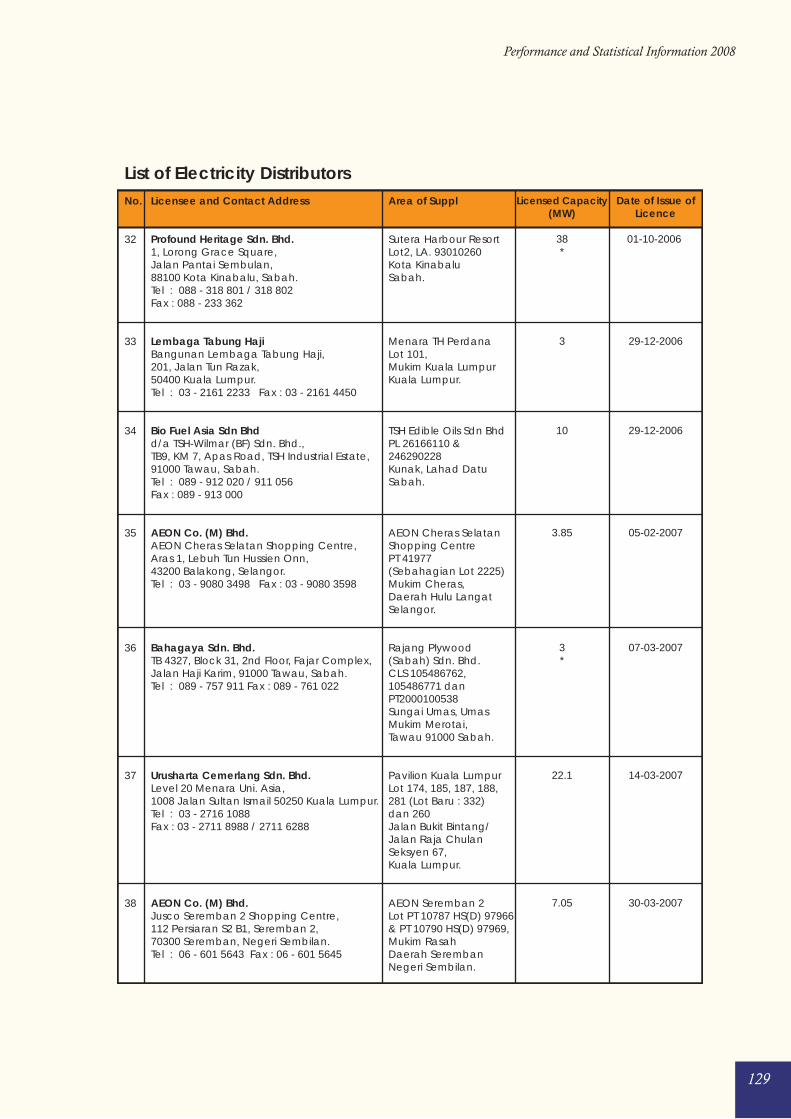
129
Performance and Statistical Information 2008
List of Electricity DistributorsNo. Licensee and Contact Address Area of Suppl
32 Profound Heritage Sdn. Bhd. Sutera Harbour Resort 1, Lorong Grace Square, Lot2, LA. 93010260 Jalan Pantai Sembulan, Kota Kinabalu 88100 Kota Kinabalu, Sabah. Sabah. Tel : 088 - 318 801 / 318 802 Fax : 088 - 233 362
33 Lembaga Tabung Haji Menara TH Perdana Bangunan Lembaga Tabung Haji, Lot 101, 201, Jalan Tun Razak, Mukim Kuala Lumpur 50400 Kuala Lumpur. Kuala Lumpur. Tel : 03 - 2161 2233 Fax : 03 - 2161 4450
34 Bio Fuel Asia Sdn Bhd TSH Edible Oils Sdn Bhd d/a TSH-Wilmar (BF) Sdn. Bhd., PL 26166110 & TB9, KM 7, Apas Road, TSH Industrial Estate, 246290228 91000 Tawau, Sabah. Kunak, Lahad Datu Tel : 089 - 912 020 / 911 056 Sabah. Fax : 089 - 913 000
35 AEON Co. (M) Bhd. AEON Cheras Selatan AEON Cheras Selatan Shopping Centre, Shopping Centre Aras 1, Lebuh Tun Hussien Onn, PT 41977 43200 Balakong, Selangor. (Sebahagian Lot 2225) Tel : 03 - 9080 3498 Fax : 03 - 9080 3598 Mukim Cheras, Daerah Hulu Langat Selangor.
36 Bahagaya Sdn. Bhd. Rajang Plywood TB 4327, Block 31, 2nd Floor, Fajar Complex, (Sabah) Sdn. Bhd. Jalan Haji Karim, 91000 Tawau, Sabah. CLS 105486762, Tel : 089 - 757 911 Fax : 089 - 761 022 105486771 dan PT2000100538 Sungai Umas, Umas Mukim Merotai, Tawau 91000 Sabah.
37 Urusharta Cemerlang Sdn. Bhd. Pavilion Kuala Lumpur Level 20 Menara Uni. Asia, Lot 174, 185, 187, 188, 1008 Jalan Sultan Ismail 50250 Kuala Lumpur. 281 (Lot Baru : 332) Tel : 03 - 2716 1088 dan 260 Fax : 03 - 2711 8988 / 2711 6288 Jalan Bukit Bintang/ Jalan Raja Chulan Seksyen 67, Kuala Lumpur.
38 AEON Co. (M) Bhd. AEON Seremban 2 Jusco Seremban 2 Shopping Centre, Lot PT 10787 HS(D) 97966 112 Persiaran S2 B1, Seremban 2, & PT 10790 HS(D) 97969, 70300 Seremban, Negeri Sembilan. Mukim Rasah Tel : 06 - 601 5643 Fax : 06 - 601 5645 Daerah Seremban Negeri Sembilan.
Licensed Capacity(MW)
38*
3
10
3.85
3*
22.1
7.05
Date of Issue ofLicence
01-10-2006
29-12-2006
29-12-2006
05-02-2007
07-03-2007
14-03-2007
30-03-2007
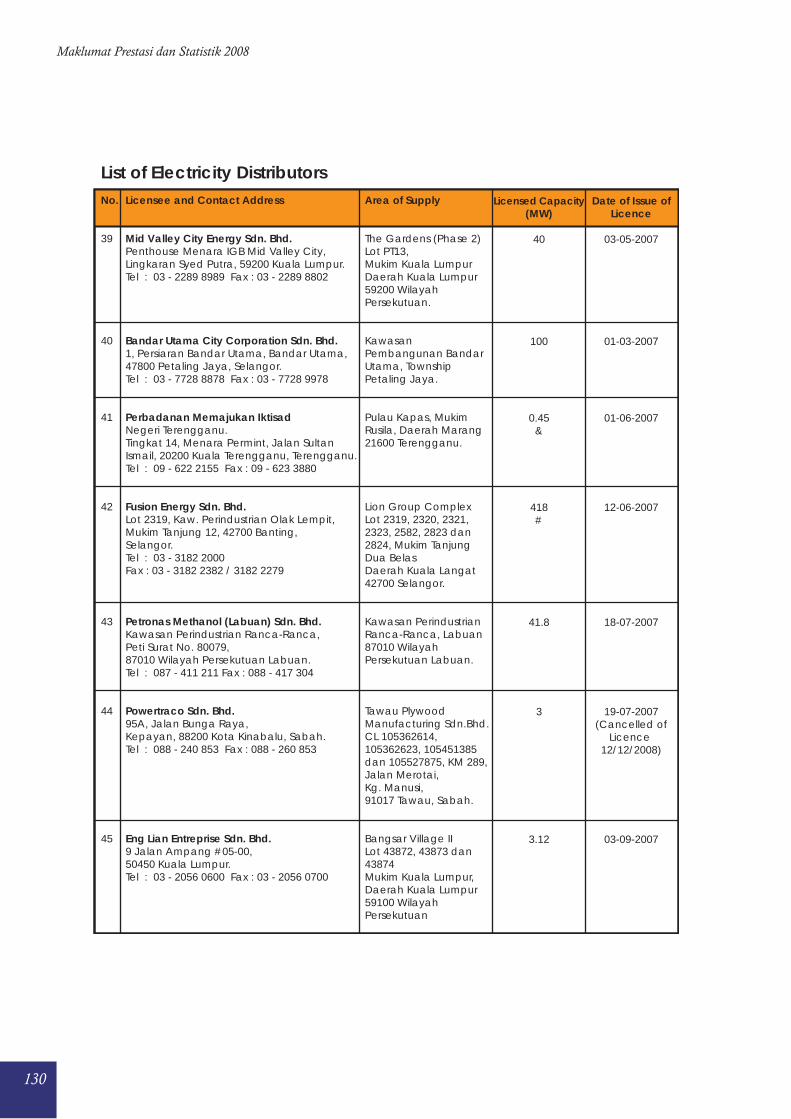
130
Maklumat Prestasi dan Statistik 2008
List of Electricity DistributorsNo. Licensee and Contact Address Area of Supply
39 Mid Valley City Energy Sdn. Bhd. The Gardens (Phase 2) Penthouse Menara IGB Mid Valley City, Lot PT13, Lingkaran Syed Putra, 59200 Kuala Lumpur. Mukim Kuala Lumpur Tel : 03 - 2289 8989 Fax : 03 - 2289 8802 Daerah Kuala Lumpur 59200 Wilayah Persekutuan.
40 Bandar Utama City Corporation Sdn. Bhd. Kawasan 1, Persiaran Bandar Utama, Bandar Utama, Pembangunan Bandar 47800 Petaling Jaya, Selangor. Utama, Township Tel : 03 - 7728 8878 Fax : 03 - 7728 9978 Petaling Jaya.
41 Perbadanan Memajukan Iktisad Pulau Kapas, Mukim Negeri Terengganu. Rusila, Daerah Marang Tingkat 14, Menara Permint, Jalan Sultan 21600 Terengganu. Ismail, 20200 Kuala Terengganu, Terengganu. Tel : 09 - 622 2155 Fax : 09 - 623 3880
42 Fusion Energy Sdn. Bhd. Lion Group Complex Lot 2319, Kaw. Perindustrian Olak Lempit, Lot 2319, 2320, 2321, Mukim Tanjung 12, 42700 Banting, 2323, 2582, 2823 dan Selangor. 2824, Mukim Tanjung Tel : 03 - 3182 2000 Dua Belas Fax : 03 - 3182 2382 / 3182 2279 Daerah Kuala Langat 42700 Selangor.
43 Petronas Methanol (Labuan) Sdn. Bhd. Kawasan Perindustrian Kawasan Perindustrian Ranca-Ranca, Ranca-Ranca, Labuan Peti Surat No. 80079, 87010 Wilayah 87010 Wilayah Persekutuan Labuan. Persekutuan Labuan. Tel : 087 - 411 211 Fax : 088 - 417 304
44 Powertraco Sdn. Bhd. Tawau Plywood 95A, Jalan Bunga Raya, Manufacturing Sdn.Bhd. Kepayan, 88200 Kota Kinabalu, Sabah. CL 105362614, Tel : 088 - 240 853 Fax : 088 - 260 853 105362623, 105451385 dan 105527875, KM 289, Jalan Merotai, Kg. Manusi, 91017 Tawau, Sabah.
45 Eng Lian Entreprise Sdn. Bhd. Bangsar Village II 9 Jalan Ampang #05-00, Lot 43872, 43873 dan 50450 Kuala Lumpur. 43874 Tel : 03 - 2056 0600 Fax : 03 - 2056 0700 Mukim Kuala Lumpur, Daerah Kuala Lumpur 59100 Wilayah Persekutuan
Licensed Capacity(MW)
40
100
0.45&
418#
41.8
3
3.12
Date of Issue ofLicence
03-05-2007
01-03-2007
01-06-2007
12-06-2007
18-07-2007
19-07-2007(Cancelled of
Licence 12/12/2008)
03-09-2007
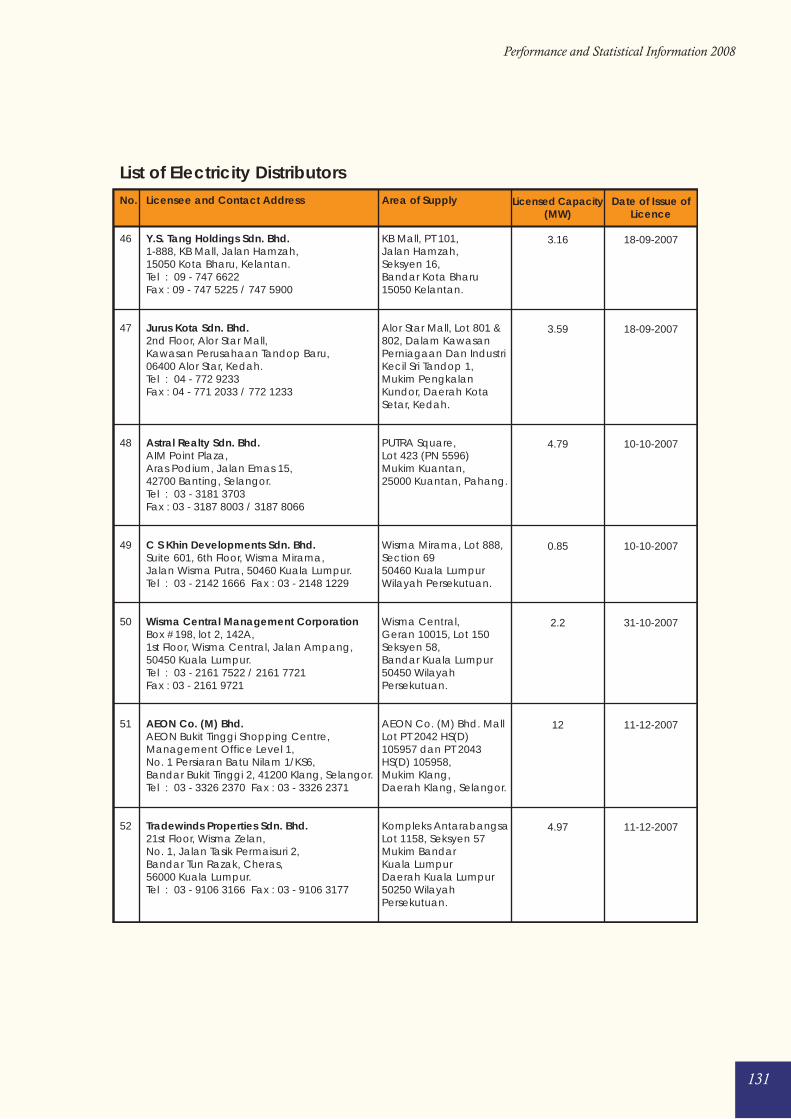
131
Performance and Statistical Information 2008
List of Electricity DistributorsNo. Licensee and Contact Address Area of Supply
46 Y.S. Tang Holdings Sdn. Bhd. KB Mall, PT 101, 1-888, KB Mall, Jalan Hamzah, Jalan Hamzah, 15050 Kota Bharu, Kelantan. Seksyen 16, Tel : 09 - 747 6622 Bandar Kota Bharu Fax : 09 - 747 5225 / 747 5900 15050 Kelantan.
47 Jurus Kota Sdn. Bhd. Alor Star Mall, Lot 801 & 2nd Floor, Alor Star Mall, 802, Dalam Kawasan Kawasan Perusahaan Tandop Baru, Perniagaan Dan Industri 06400 Alor Star, Kedah. Kecil Sri Tandop 1, Tel : 04 - 772 9233 Mukim Pengkalan Fax : 04 - 771 2033 / 772 1233 Kundor, Daerah Kota Setar, Kedah.
48 Astral Realty Sdn. Bhd. PUTRA Square, AIM Point Plaza, Lot 423 (PN 5596) Aras Podium, Jalan Emas 15, Mukim Kuantan, 42700 Banting, Selangor. 25000 Kuantan, Pahang. Tel : 03 - 3181 3703 Fax : 03 - 3187 8003 / 3187 8066
49 C S Khin Developments Sdn. Bhd. Wisma Mirama, Lot 888, Suite 601, 6th Floor, Wisma Mirama, Section 69 Jalan Wisma Putra, 50460 Kuala Lumpur. 50460 Kuala Lumpur Tel : 03 - 2142 1666 Fax : 03 - 2148 1229 Wilayah Persekutuan.
50 Wisma Central Management Corporation Wisma Central, Box #198, lot 2, 142A, Geran 10015, Lot 150 1st Floor, Wisma Central, Jalan Ampang, Seksyen 58, 50450 Kuala Lumpur. Bandar Kuala Lumpur Tel : 03 - 2161 7522 / 2161 7721 50450 Wilayah Fax : 03 - 2161 9721 Persekutuan.
51 AEON Co. (M) Bhd. AEON Co. (M) Bhd. Mall AEON Bukit Tinggi Shopping Centre, Lot PT 2042 HS(D) Management Office Level 1, 105957 dan PT 2043 No. 1 Persiaran Batu Nilam 1/KS6, HS(D) 105958, Bandar Bukit Tinggi 2, 41200 Klang, Selangor. Mukim Klang, Tel : 03 - 3326 2370 Fax : 03 - 3326 2371 Daerah Klang, Selangor.
52 Tradewinds Properties Sdn. Bhd. Kompleks Antarabangsa 21st Floor, Wisma Zelan, Lot 1158, Seksyen 57 No. 1, Jalan Tasik Permaisuri 2, Mukim Bandar Bandar Tun Razak, Cheras, Kuala Lumpur 56000 Kuala Lumpur. Daerah Kuala Lumpur Tel : 03 - 9106 3166 Fax : 03 - 9106 3177 50250 Wilayah Persekutuan.
Licensed Capacity(MW)
3.16
3.59
4.79
0.85
2.2
12
4.97
Date of Issue ofLicence
18-09-2007
18-09-2007
10-10-2007
10-10-2007
31-10-2007
11-12-2007
11-12-2007
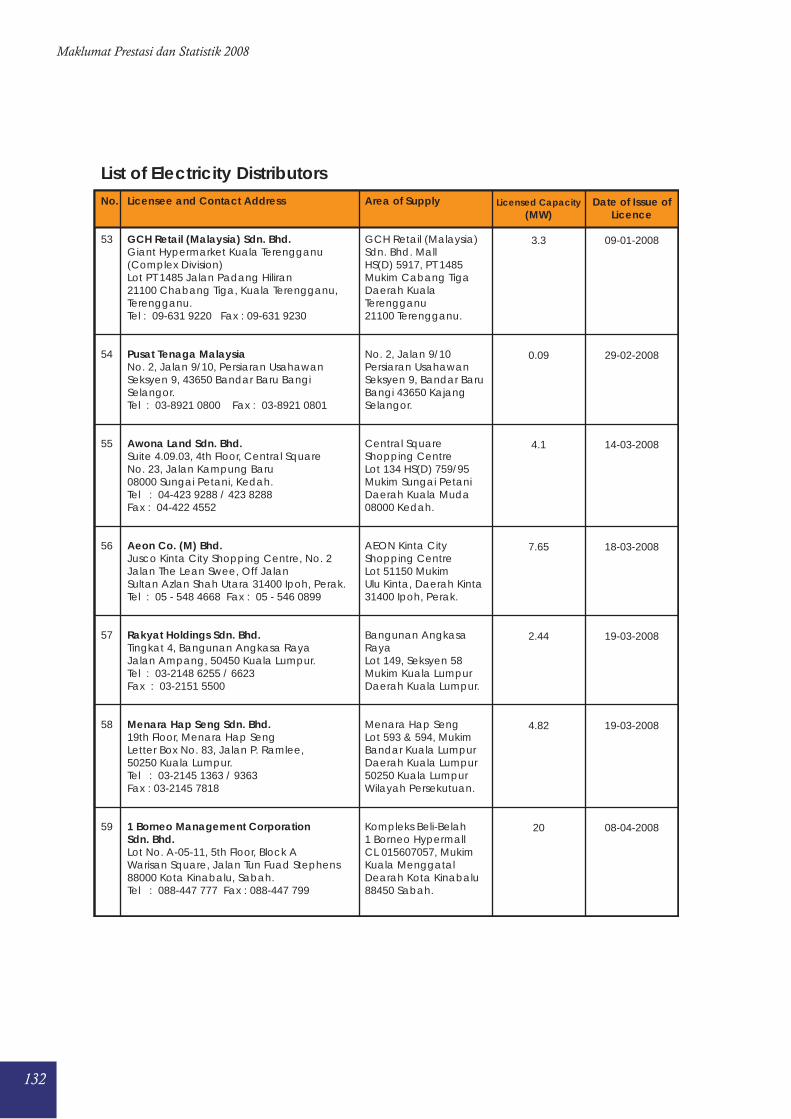
132
Maklumat Prestasi dan Statistik 2008
List of Electricity DistributorsNo. Licensee and Contact Address Area of Supply
53 GCH Retail (Malaysia) Sdn. Bhd. GCH Retail (Malaysia) Giant Hypermarket Kuala Terengganu Sdn. Bhd. Mall (Complex Division) HS(D) 5917, PT 1485 Lot PT 1485 Jalan Padang Hiliran Mukim Cabang Tiga 21100 Chabang Tiga, Kuala Terengganu, Daerah Kuala Terengganu. Terengganu Tel : 09-631 9220 Fax : 09-631 9230 21100 Terengganu.
54 Pusat Tenaga Malaysia No. 2, Jalan 9/10 No. 2, Jalan 9/10, Persiaran Usahawan Persiaran Usahawan Seksyen 9, 43650 Bandar Baru Bangi Seksyen 9, Bandar Baru Selangor. Bangi 43650 Kajang Tel : 03-8921 0800 Fax : 03-8921 0801 Selangor.
55 Awona Land Sdn. Bhd. Central Square Suite 4.09.03, 4th Floor, Central Square Shopping Centre No. 23, Jalan Kampung Baru Lot 134 HS(D) 759/95 08000 Sungai Petani, Kedah. Mukim Sungai Petani Tel : 04-423 9288 / 423 8288 Daerah Kuala Muda Fax : 04-422 4552 08000 Kedah.
56 Aeon Co. (M) Bhd. AEON Kinta City Jusco Kinta City Shopping Centre, No. 2 Shopping Centre Jalan The Lean Swee, Off Jalan Lot 51150 Mukim Sultan Azlan Shah Utara 31400 Ipoh, Perak. Ulu Kinta, Daerah Kinta Tel : 05 - 548 4668 Fax : 05 - 546 0899 31400 Ipoh, Perak.
57 Rakyat Holdings Sdn. Bhd. Bangunan Angkasa Tingkat 4, Bangunan Angkasa Raya Raya Jalan Ampang, 50450 Kuala Lumpur. Lot 149, Seksyen 58 Tel : 03-2148 6255 / 6623 Mukim Kuala Lumpur Fax : 03-2151 5500 Daerah Kuala Lumpur.
58 Menara Hap Seng Sdn. Bhd. Menara Hap Seng 19th Floor, Menara Hap Seng Lot 593 & 594, Mukim Letter Box No. 83, Jalan P. Ramlee, Bandar Kuala Lumpur 50250 Kuala Lumpur. Daerah Kuala Lumpur Tel : 03-2145 1363 / 9363 50250 Kuala Lumpur Fax : 03-2145 7818 Wilayah Persekutuan.
59 1 Borneo Management Corporation Kompleks Beli-Belah Sdn. Bhd. 1 Borneo Hypermall Lot No. A-05-11, 5th Floor, Block A CL 015607057, Mukim Warisan Square, Jalan Tun Fuad Stephens Kuala Menggatal 88000 Kota Kinabalu, Sabah. Dearah Kota Kinabalu Tel : 088-447 777 Fax : 088-447 799 88450 Sabah.
Licensed Capacity(MW)
3.3
0.09
4.1
7.65
2.44
4.82
20
Date of Issue ofLicence
09-01-2008
29-02-2008
14-03-2008
18-03-2008
19-03-2008
19-03-2008
08-04-2008
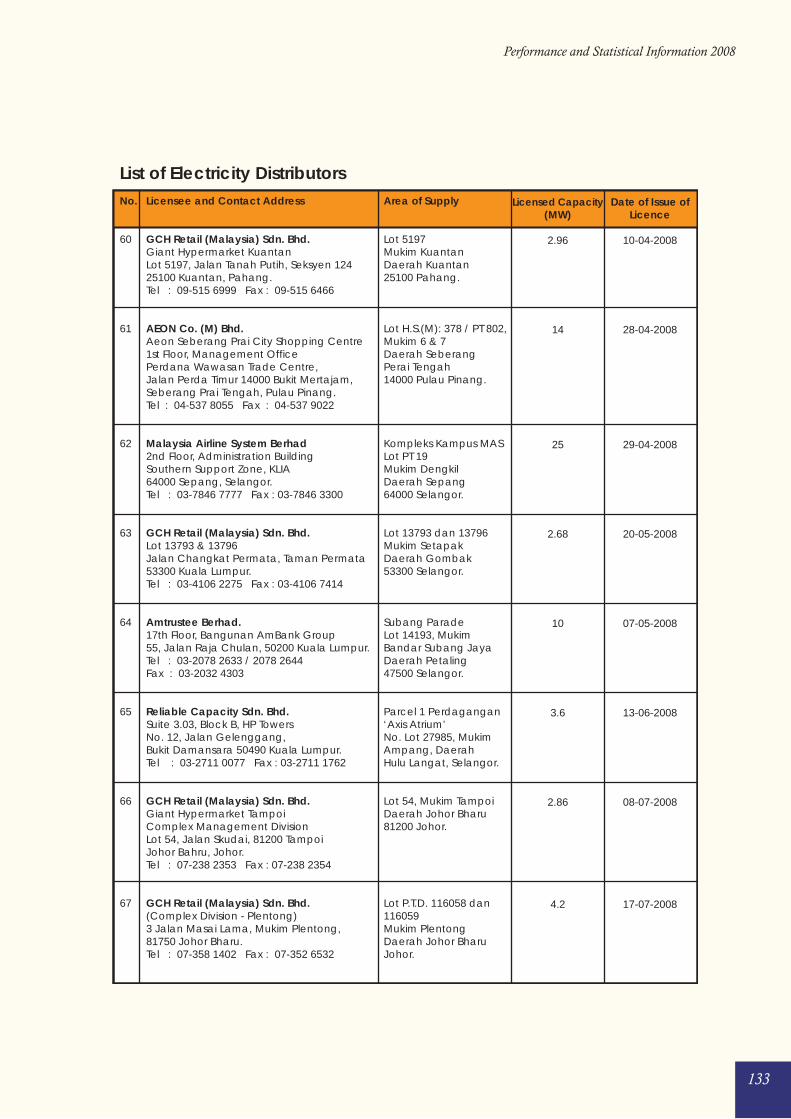
133
Performance and Statistical Information 2008
List of Electricity DistributorsNo. Licensee and Contact Address Area of Supply
60 GCH Retail (Malaysia) Sdn. Bhd. Lot 5197 Giant Hypermarket Kuantan Mukim Kuantan Lot 5197, Jalan Tanah Putih, Seksyen 124 Daerah Kuantan 25100 Kuantan, Pahang. 25100 Pahang. Tel : 09-515 6999 Fax : 09-515 6466
61 AEON Co. (M) Bhd. Lot H.S.(M): 378 / PT 802, Aeon Seberang Prai City Shopping Centre Mukim 6 & 7 1st Floor, Management Office Daerah Seberang Perdana Wawasan Trade Centre, Perai Tengah Jalan Perda Timur 14000 Bukit Mertajam, 14000 Pulau Pinang. Seberang Prai Tengah, Pulau Pinang. Tel : 04-537 8055 Fax : 04-537 9022
62 Malaysia Airline System Berhad Kompleks Kampus MAS 2nd Floor, Administration Building Lot PT 19 Southern Support Zone, KLIA Mukim Dengkil 64000 Sepang, Selangor. Daerah Sepang Tel : 03-7846 7777 Fax : 03-7846 3300 64000 Selangor.
63 GCH Retail (Malaysia) Sdn. Bhd. Lot 13793 dan 13796 Lot 13793 & 13796 Mukim Setapak Jalan Changkat Permata, Taman Permata Daerah Gombak 53300 Kuala Lumpur. 53300 Selangor. Tel : 03-4106 2275 Fax : 03-4106 7414
64 Amtrustee Berhad. Subang Parade 17th Floor, Bangunan AmBank Group Lot 14193, Mukim 55, Jalan Raja Chulan, 50200 Kuala Lumpur. Bandar Subang Jaya Tel : 03-2078 2633 / 2078 2644 Daerah Petaling Fax : 03-2032 4303 47500 Selangor.
65 Reliable Capacity Sdn. Bhd. Parcel 1 Perdagangan Suite 3.03, Block B, HP Towers ‘Axis Atrium’ No. 12, Jalan Gelenggang, No. Lot 27985, Mukim Bukit Damansara 50490 Kuala Lumpur. Ampang, Daerah Tel : 03-2711 0077 Fax : 03-2711 1762 Hulu Langat, Selangor.
66 GCH Retail (Malaysia) Sdn. Bhd. Lot 54, Mukim Tampoi Giant Hypermarket Tampoi Daerah Johor Bharu Complex Management Division 81200 Johor. Lot 54, Jalan Skudai, 81200 Tampoi Johor Bahru, Johor. Tel : 07-238 2353 Fax : 07-238 2354
67 GCH Retail (Malaysia) Sdn. Bhd. Lot P.T.D. 116058 dan (Complex Division - Plentong) 116059 3 Jalan Masai Lama, Mukim Plentong, Mukim Plentong 81750 Johor Bharu. Daerah Johor Bharu Tel : 07-358 1402 Fax : 07-352 6532 Johor.
Licensed Capacity(MW)
2.96
14
25
2.68
10
3.6
2.86
4.2
Date of Issue ofLicence
10-04-2008
28-04-2008
29-04-2008
20-05-2008
07-05-2008
13-06-2008
08-07-2008
17-07-2008

134
Maklumat Prestasi dan Statistik 2008
List of Electricity DistributorsNo. Licensee and Contact Address Area of Supply
68 GCH Retail (Malaysia) Sdn. Bhd. Lot 3066 & 3067 Giant Hypermarket Skudai Mukim Terbau Lot 3066 & 3067, Mukim Tebrau Daerah Johor Bharu 81200 Johor Bharu, Johor. 81200 Johor. Tel : 07-554 9130 Fax : 07-554 9130
69 Lianbang Ventures Sdn. Bhd. Dataran Pahlawan F4-40, Level 4, Melaka Megamall Dataran Pahlawan Melaka Megamall Lot 14, 141 dan 142 Jalan Merdeka, 75000 Bandar Hilir, Melaka. Mukim Kawasan Tel : 06-282 1828 Fax : 06-283 1827 Bandar XXVII, Daerah Melaka Tengah, Melaka.
70 Panglobal Insurance Berhad PanGlobal Building Level 12B, Menara PanGlobal, No. 8 Lot 53 Section 20 Lorong P. Ramlee, P.O. Box 12448, Bandar Petaling Jaya 50778 Kuala Lumpur. Daerah Petaling Tel : 03-2078 2090 Fax : 03-2072 5534 Selangor.
71 GCH Retail (Malaysia) Sdn. Bhd. Giant Mall Kelana Jaya Giant Mall Kelana Jaya Lot PT 67 Seksyen 40 Complex Management Office Mukim Bandar No. 33, Jalan SS 6/12, SS 6, Kelana Jaya Petaling Jaya 47301 Petaling Jaya, Selangor. Daerah Petaling Tel : 03-7880 3742 / 7880 4714 47301 Selangor. Fax : 03-7803 7858
72 GCH Retail (Malaysia) Sdn. Bhd. Lot 2, Seksyen 13 Giant Hypermarket Shah Alam Daerah Shah Alam Lot 2, Persiaran Sukan, Seksyen 13 Selangor. 40100 Shah Alam, Selangor. Tel : 03-5544 8888 Fax : 03-5511 9681
73 Dijaya Land Sdn. Bhd. Tropicana City Lot 301, 3rd Floor, Wisma Dijaya Lot 45821, Mukim No. 1A Jalan SS20/1, Damansara Utama Damansara Utama 47400 Petaling Jaya Daerah Petaling Jaya Fax : 03-7710 1025 Selangor.
74 GCH Retail (Malaysia) Sdn. Bhd. Lot CL075477584 Giant Superstore Sandakan Mukim Sandakan Lot 3, Jalan IJM, Bandar Utama, Batu 6 Daerah Sandakan Off Jalan Utara, 90000 Sandakan, Sabah. Negeri Sabah. Tel : 089-214 219 Fax : 089-214 207
75 BR Property Holdings Sdn. Bhd. Bangsar Shopping 31st Floor, Menara Multi-Purpose, Centre, Lot 41274 Capital Square Daerah Kuala Lumpur No. 8, Jalan Munshi Abdullah, Wilayah Persekutuan 50100 Kuala Lumpur. Kuala Lumpur. Tel : 03-2694 6622 Fax : 03-2694 1922
Licensed Capacity(MW)
3.7
5.52
1.7
6.11
4.2
11.03
1.7
8.51
Date of Issue ofLicence
12-08-2008
29-10-2008
24-10-2008
05-11-2008
05-11-2008
05-11-2008
17-11-2008
18-11-2008
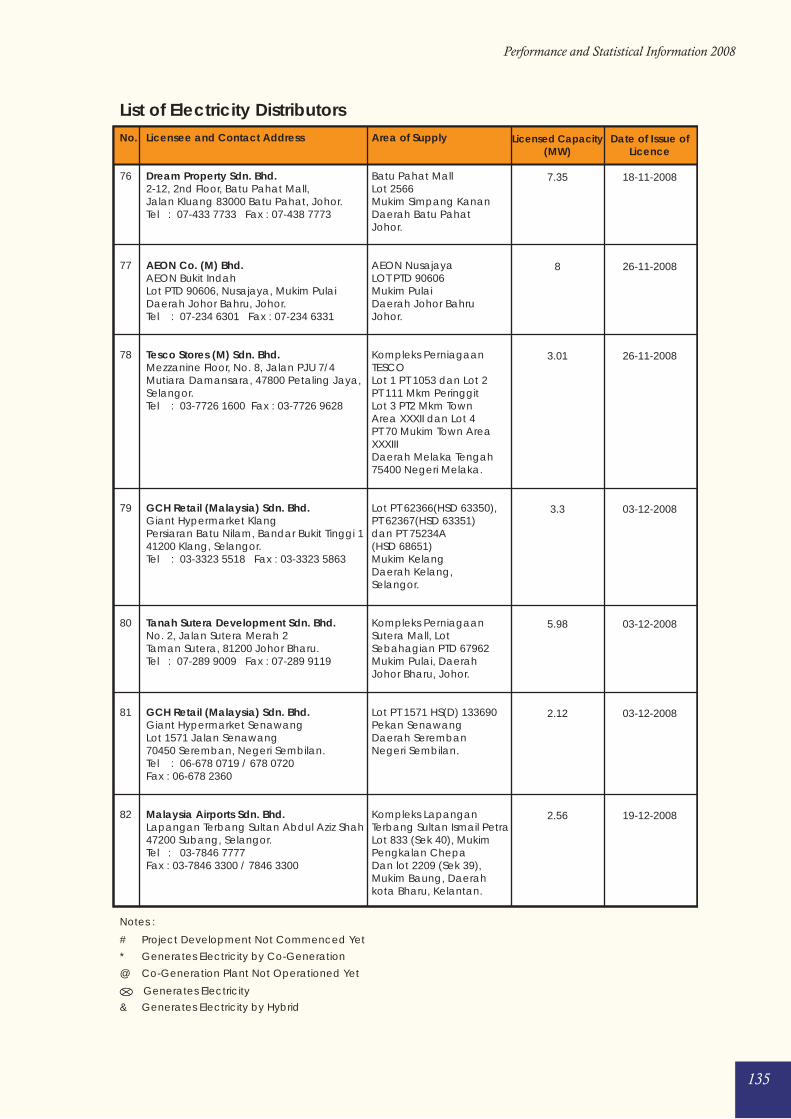
135
Performance and Statistical Information 2008
List of Electricity DistributorsNo. Licensee and Contact Address Area of Supply
76 Dream Property Sdn. Bhd. Batu Pahat Mall 2-12, 2nd Floor, Batu Pahat Mall, Lot 2566 Jalan Kluang 83000 Batu Pahat, Johor. Mukim Simpang Kanan Tel : 07-433 7733 Fax : 07-438 7773 Daerah Batu Pahat Johor.
77 AEON Co. (M) Bhd. AEON Nusajaya AEON Bukit Indah LOT PTD 90606 Lot PTD 90606, Nusajaya, Mukim Pulai Mukim Pulai Daerah Johor Bahru, Johor. Daerah Johor Bahru Tel : 07-234 6301 Fax : 07-234 6331 Johor.
78 Tesco Stores (M) Sdn. Bhd. Kompleks Perniagaan Mezzanine Floor, No. 8, Jalan PJU 7/4 TESCO Mutiara Damansara, 47800 Petaling Jaya, Lot 1 PT 1053 dan Lot 2 Selangor. PT 111 Mkm Peringgit Tel : 03-7726 1600 Fax : 03-7726 9628 Lot 3 PT2 Mkm Town Area XXXII dan Lot 4 PT 70 Mukim Town Area XXXIII Daerah Melaka Tengah 75400 Negeri Melaka.
79 GCH Retail (Malaysia) Sdn. Bhd. Lot PT 62366(HSD 63350), Giant Hypermarket Klang PT 62367(HSD 63351) Persiaran Batu Nilam, Bandar Bukit Tinggi 1 dan PT 75234A 41200 Klang, Selangor. (HSD 68651) Tel : 03-3323 5518 Fax : 03-3323 5863 Mukim Kelang Daerah Kelang, Selangor.
80 Tanah Sutera Development Sdn. Bhd. Kompleks Perniagaan No. 2, Jalan Sutera Merah 2 Sutera Mall, Lot Taman Sutera, 81200 Johor Bharu. Sebahagian PTD 67962 Tel : 07-289 9009 Fax : 07-289 9119 Mukim Pulai, Daerah Johor Bharu, Johor.
81 GCH Retail (Malaysia) Sdn. Bhd. Lot PT 1571 HS(D) 133690 Giant Hypermarket Senawang Pekan Senawang Lot 1571 Jalan Senawang Daerah Seremban 70450 Seremban, Negeri Sembilan. Negeri Sembilan. Tel : 06-678 0719 / 678 0720 Fax : 06-678 2360
82 Malaysia Airports Sdn. Bhd. Kompleks Lapangan Lapangan Terbang Sultan Abdul Aziz Shah Terbang Sultan Ismail Petra 47200 Subang, Selangor. Lot 833 (Sek 40), Mukim Tel : 03-7846 7777 Pengkalan Chepa Fax : 03-7846 3300 / 7846 3300 Dan lot 2209 (Sek 39), Mukim Baung, Daerah kota Bharu, Kelantan.
Licensed Capacity(MW)
7.35
8
3.01
3.3
5.98
2.12
2.56
Date of Issue ofLicence
18-11-2008
26-11-2008
26-11-2008
03-12-2008
03-12-2008
03-12-2008
19-12-2008
Notes :
# Project Development Not Commenced Yet
* Generates Electricity by Co-Generation
@ Co-Generation Plant Not Operationed Yet
Generates Electricity
& Generates Electricity by Hybrid

136
Maklumat Prestasi dan Statistik 2008

137
Performance and Statistical Information 2008
Senarai Co-Generators Utama
List of Major Co-Generators

138
Maklumat Prestasi dan Statistik 2008

139
Performance and Statistical Information 2008
List of Major Co-Generators No.
1
2
3
4
5
6
7
8
9
10
11
Licensee and Location
Perwaja Steel Sdn. Bhd.Loji Besi Penurunan Terus,Tanjung Berhala, Kemaman,Terengganu.
Bernas Production Sdn. Bhd.Kompleks Mengering danmengilang Padi LPN, Sekinchan,Selangor.
PadiBeras Nasional Bhd.Kompleks Bernas Sg. Ranggam(Ulu Dedap), Kg. Gajah, Perak.
Padiberas Nasional BhdKompleks Bernas Changkat Lada,Kg. Gajah,Perak.
Sime Plantations Sdn. Bhd.Tennamaran Palm Oil Mill,Batang Berjuntai, Selangor.
Sime Plantations Sdn. Bhd.Seri Intan Palm Oil Mill,Batu 5, Jalan Maharaja Lela,Teluk Intan, Perak.
Tractors Malaysia (1982) Sdn. Bhd.Lot 2, Section 2 dan SebahagianTanah lot 3410, Kampung Puchong,Mukim Daerah Petaling, Selangor.
Malaysian Mosaics BerhadLot 641, 642 & 643,Mukim Kluang, Batu 3,Jalan Batu Pahat,Kluang, Johor.
Malaysian Newsprint Industries Sdn. Bhd.Lot 3771,Jalan Lencongan Mentakab-Temerloh,Temerloh Industrial Park,Mentakab, Pahang.
Titan Petchem (M) Sdn. Bhd.PLO 257, 312, 425 dan 426,Jalan Tembaga 4,Pasir Gudang Industrial Estate,Pasir Gudang, Johor.
Titan Petrochemicals (M) Sdn. Bhd.PLO 8, Tanjung Langsat Industrial Park,Mukim Sg. Tiram, Johor Bharu,Johor.
Capacity(MW)
9.5
0.23
0.65
0.65
4.10
3.42
1.25
4.21
79.2
56
42.6
Type of Licence
Private
Private
Private
Private
Private
Private
Private
Private
Private
Private
Private
Fuels
Waste Heat FromIndustrial Process
AgricultureWaste
AgricultureWaste
AgricultureWaste
AgricultureWaste
AgricultureWaste
Natural Gas
Natural Gas
Oil
Natural Gas
Natural Gas
Generation(MWh)
31,674
*
650
37Up to Jan08
Cancelled ofLicence11/10/08
4,310
12,162
2,046
*
32,714
297,480
162,584
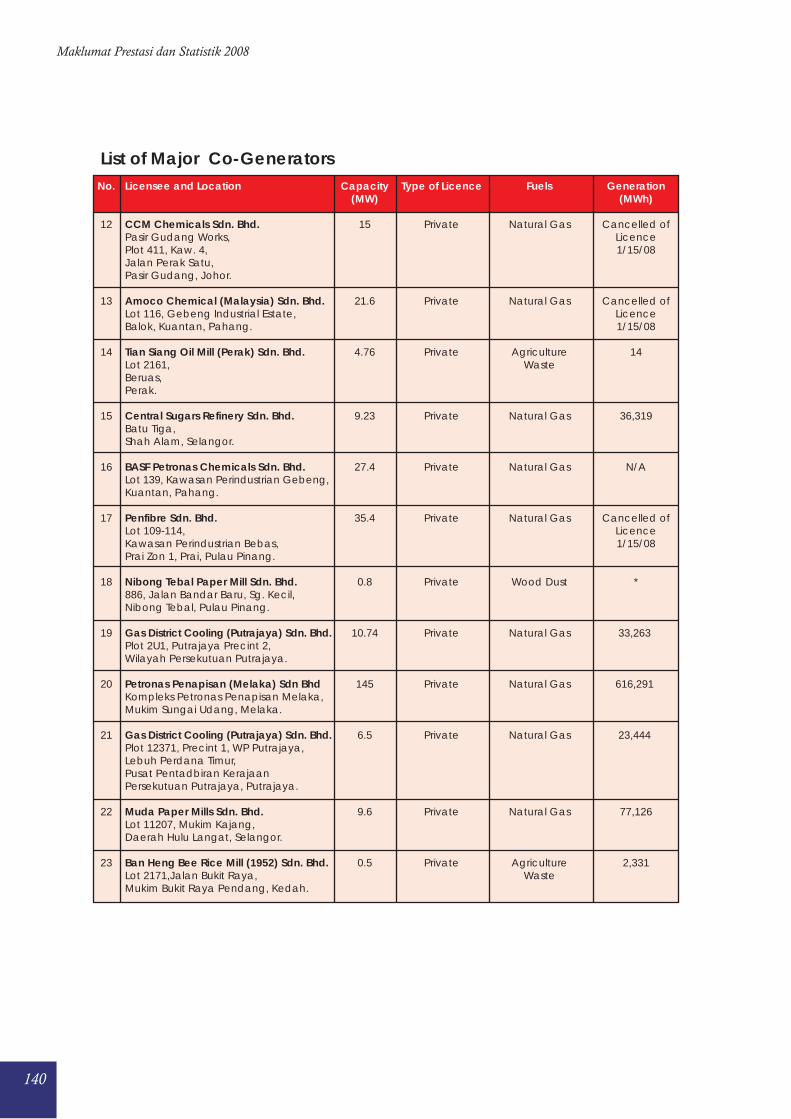
140
Maklumat Prestasi dan Statistik 2008
List of Major Co-GeneratorsNo.
12
13
14
15
16
17
18
19
20
21
22
23
Licensee and Location
CCM Chemicals Sdn. Bhd.Pasir Gudang Works,Plot 411, Kaw. 4,Jalan Perak Satu,Pasir Gudang, Johor.
Amoco Chemical (Malaysia) Sdn. Bhd.Lot 116, Gebeng Industrial Estate,Balok, Kuantan, Pahang.
Tian Siang Oil Mill (Perak) Sdn. Bhd.Lot 2161,Beruas,Perak.
Central Sugars Refinery Sdn. Bhd.Batu Tiga,Shah Alam, Selangor.
BASF Petronas Chemicals Sdn. Bhd.Lot 139, Kawasan Perindustrian Gebeng,Kuantan, Pahang.
Penfibre Sdn. Bhd.Lot 109-114,Kawasan Perindustrian Bebas,Prai Zon 1, Prai, Pulau Pinang.
Nibong Tebal Paper Mill Sdn. Bhd.886, Jalan Bandar Baru, Sg. Kecil,Nibong Tebal, Pulau Pinang.
Gas District Cooling (Putrajaya) Sdn. Bhd.Plot 2U1, Putrajaya Precint 2,Wilayah Persekutuan Putrajaya.
Petronas Penapisan (Melaka) Sdn BhdKompleks Petronas Penapisan Melaka,Mukim Sungai Udang, Melaka.
Gas District Cooling (Putrajaya) Sdn. Bhd.Plot 12371, Precint 1, WP Putrajaya,Lebuh Perdana Timur,Pusat Pentadbiran KerajaanPersekutuan Putrajaya, Putrajaya.
Muda Paper Mills Sdn. Bhd.Lot 11207, Mukim Kajang,Daerah Hulu Langat, Selangor.
Ban Heng Bee Rice Mill (1952) Sdn. Bhd.Lot 2171,Jalan Bukit Raya,Mukim Bukit Raya Pendang, Kedah.
Capacity(MW)
15
21.6
4.76
9.23
27.4
35.4
0.8
10.74
145
6.5
9.6
0.5
Type of Licence
Private
Private
Private
Private
Private
Private
Private
Private
Private
Private
Private
Private
Fuels
Natural Gas
Natural Gas
AgricultureWaste
Natural Gas
Natural Gas
Natural Gas
Wood Dust
Natural Gas
Natural Gas
Natural Gas
Natural Gas
AgricultureWaste
Generation(MWh)
Cancelled ofLicence1/15/08
Cancelled ofLicence1/15/08
14
36,319
N/A
Cancelled ofLicence1/15/08
*
33,263
616,291
23,444
77,126
2,331
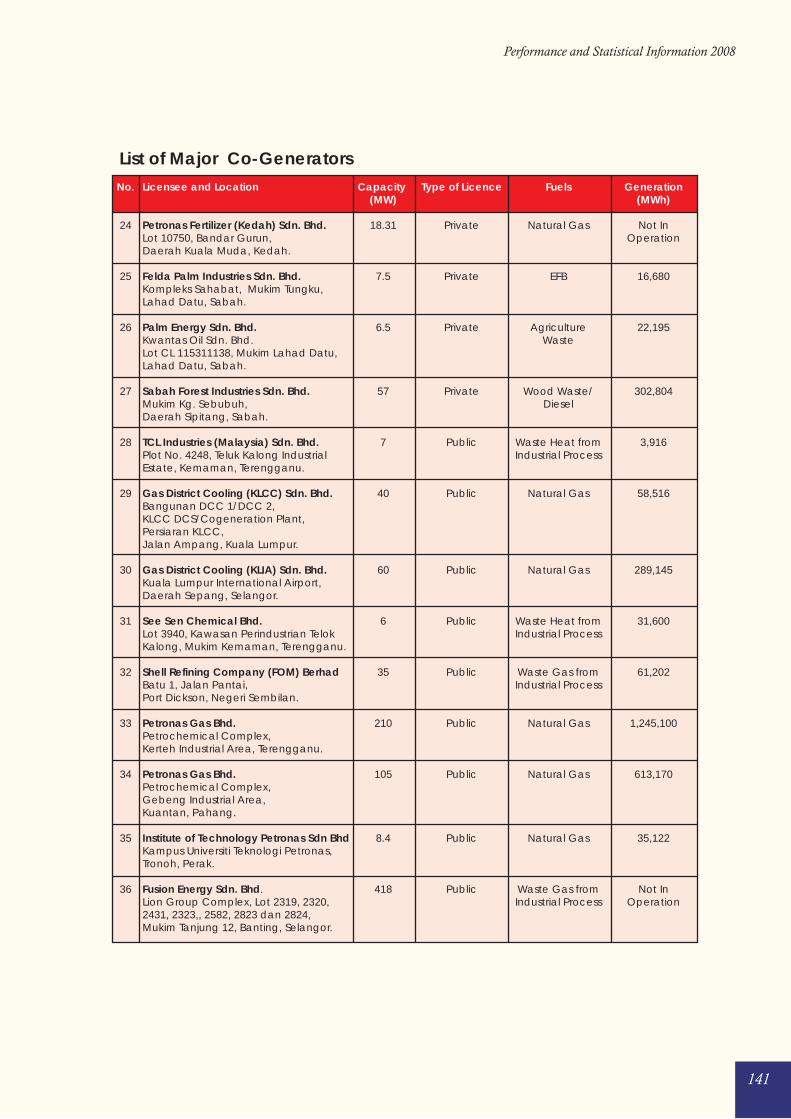
141
Performance and Statistical Information 2008
List of Major Co-GeneratorsNo.
24
25
26
27
28
29
30
31
32
33
34
35
36
Licensee and Location
Petronas Fertilizer (Kedah) Sdn. Bhd.Lot 10750, Bandar Gurun,Daerah Kuala Muda, Kedah.
Felda Palm Industries Sdn. Bhd.Kompleks Sahabat, Mukim Tungku,Lahad Datu, Sabah.
Palm Energy Sdn. Bhd.Kwantas Oil Sdn. Bhd.Lot CL 115311138, Mukim Lahad Datu,Lahad Datu, Sabah.
Sabah Forest Industries Sdn. Bhd.Mukim Kg. Sebubuh,Daerah Sipitang, Sabah.
TCL Industries (Malaysia) Sdn. Bhd.Plot No. 4248, Teluk Kalong IndustrialEstate, Kemaman, Terengganu.
Gas District Cooling (KLCC) Sdn. Bhd.Bangunan DCC 1/DCC 2,KLCC DCS/Cogeneration Plant,Persiaran KLCC,Jalan Ampang, Kuala Lumpur.
Gas District Cooling (KLIA) Sdn. Bhd.Kuala Lumpur International Airport,Daerah Sepang, Selangor.
See Sen Chemical Bhd.Lot 3940, Kawasan Perindustrian TelokKalong, Mukim Kemaman, Terengganu.
Shell Refining Company (FOM) BerhadBatu 1, Jalan Pantai,Port Dickson, Negeri Sembilan.
Petronas Gas Bhd.Petrochemical Complex,Kerteh Industrial Area, Terengganu.
Petronas Gas Bhd.Petrochemical Complex,Gebeng Industrial Area,Kuantan, Pahang.
Institute of Technology Petronas Sdn BhdKampus Universiti Teknologi Petronas,Tronoh, Perak.
Fusion Energy Sdn. Bhd.Lion Group Complex, Lot 2319, 2320,2431, 2323,, 2582, 2823 dan 2824,Mukim Tanjung 12, Banting, Selangor.
Capacity (MW)
18.31
7.5
6.5
57
7
40
60
6
35
210
105
8.4
418
Type of Licence
Private
Private
Private
Private
Public
Public
Public
Public
Public
Public
Public
Public
Public
Fuels
Natural Gas
EFB
AgricultureWaste
Wood Waste/Diesel
Waste Heat fromIndustrial Process
Natural Gas
Natural Gas
Waste Heat fromIndustrial Process
Waste Gas fromIndustrial Process
Natural Gas
Natural Gas
Natural Gas
Waste Gas fromIndustrial Process
Generation(MWh)
Not InOperation
16,680
22,195
302,804
3,916
58,516
289,145
31,600
61,202
1,245,100
613,170
35,122
Not InOperation
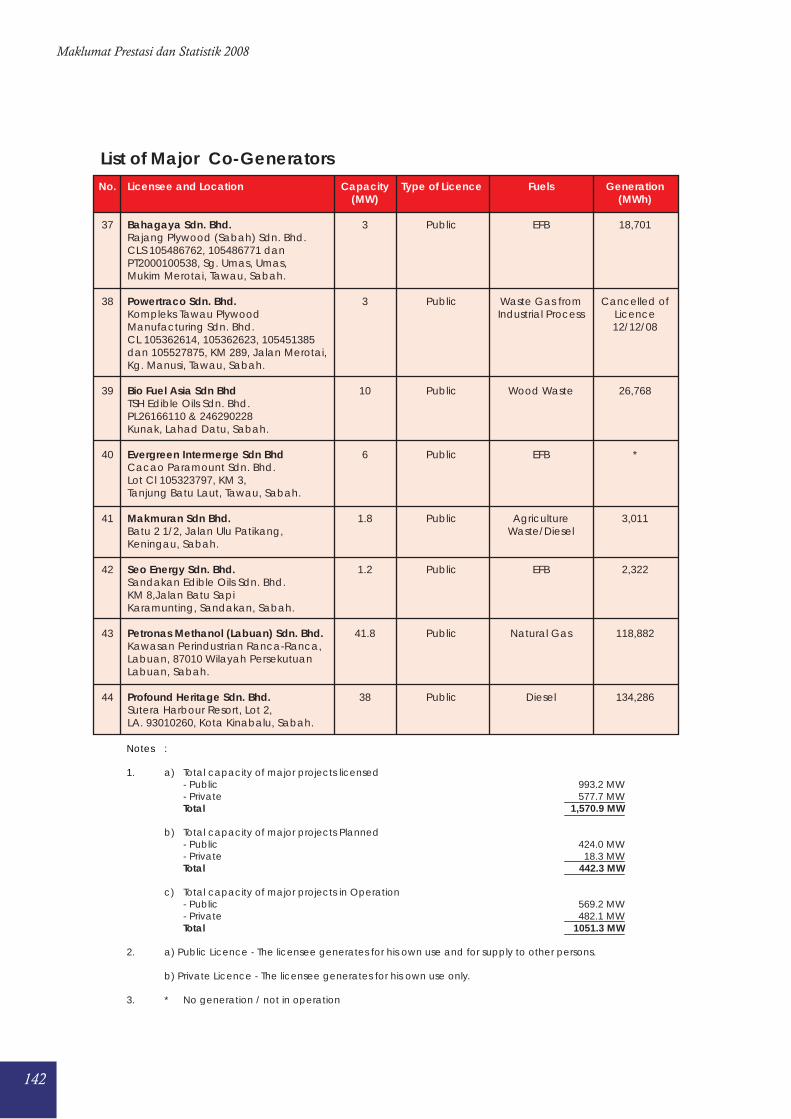
142
Maklumat Prestasi dan Statistik 2008
List of Major Co-GeneratorsNo.
37
38
39
40
41
42
43
44
Licensee and Location
Bahagaya Sdn. Bhd.Rajang Plywood (Sabah) Sdn. Bhd.CLS 105486762, 105486771 danPT2000100538, Sg. Umas, Umas,Mukim Merotai, Tawau, Sabah.
Powertraco Sdn. Bhd.Kompleks Tawau PlywoodManufacturing Sdn. Bhd.CL 105362614, 105362623, 105451385 dan 105527875, KM 289, Jalan Merotai,Kg. Manusi, Tawau, Sabah.
Bio Fuel Asia Sdn BhdTSH Edible Oils Sdn. Bhd.PL26166110 & 246290228Kunak, Lahad Datu, Sabah.
Evergreen Intermerge Sdn BhdCacao Paramount Sdn. Bhd.Lot Cl 105323797, KM 3,Tanjung Batu Laut, Tawau, Sabah.
Makmuran Sdn Bhd.Batu 2 1/2, Jalan Ulu Patikang,Keningau, Sabah.
Seo Energy Sdn. Bhd.Sandakan Edible Oils Sdn. Bhd.KM 8,Jalan Batu SapiKaramunting, Sandakan, Sabah.
Petronas Methanol (Labuan) Sdn. Bhd.Kawasan Perindustrian Ranca-Ranca,Labuan, 87010 Wilayah PersekutuanLabuan, Sabah.
Profound Heritage Sdn. Bhd.Sutera Harbour Resort, Lot 2,LA. 93010260, Kota Kinabalu, Sabah.
Capacity(MW)
3
3
10
6
1.8
1.2
41.8
38
Type of Licence
Public
Public
Public
Public
Public
Public
Public
Public
Fuels
EFB
Waste Gas fromIndustrial Process
Wood Waste
EFB
AgricultureWaste/Diesel
EFB
Natural Gas
Diesel
Generation(MWh)
18,701
Cancelled ofLicence12/12/08
26,768
*
3,011
2,322
118,882
134,286
Notes :
1. a) Total capacity of major projects licensed - Public - Private Total
b) Total capacity of major projects Planned - Public - Private Total
c) Total capacity of major projects in Operation - Public - Private Total
2. a) Public Licence - The licensee generates for his own use and for supply to other persons.
b) Private Licence - The licensee generates for his own use only.
3. * No generation / not in operation
993.2 MW577.7 MW
1,570.9 MW
424.0 MW18.3 MW
442.3 MW
569.2 MW482.1 MW
1051.3 MW

143
Performance and Statistical Information 2008
Statistik Penjanaan Persendirian
Statistics of Self-Generation

144
Maklumat Prestasi dan Statistik 2008
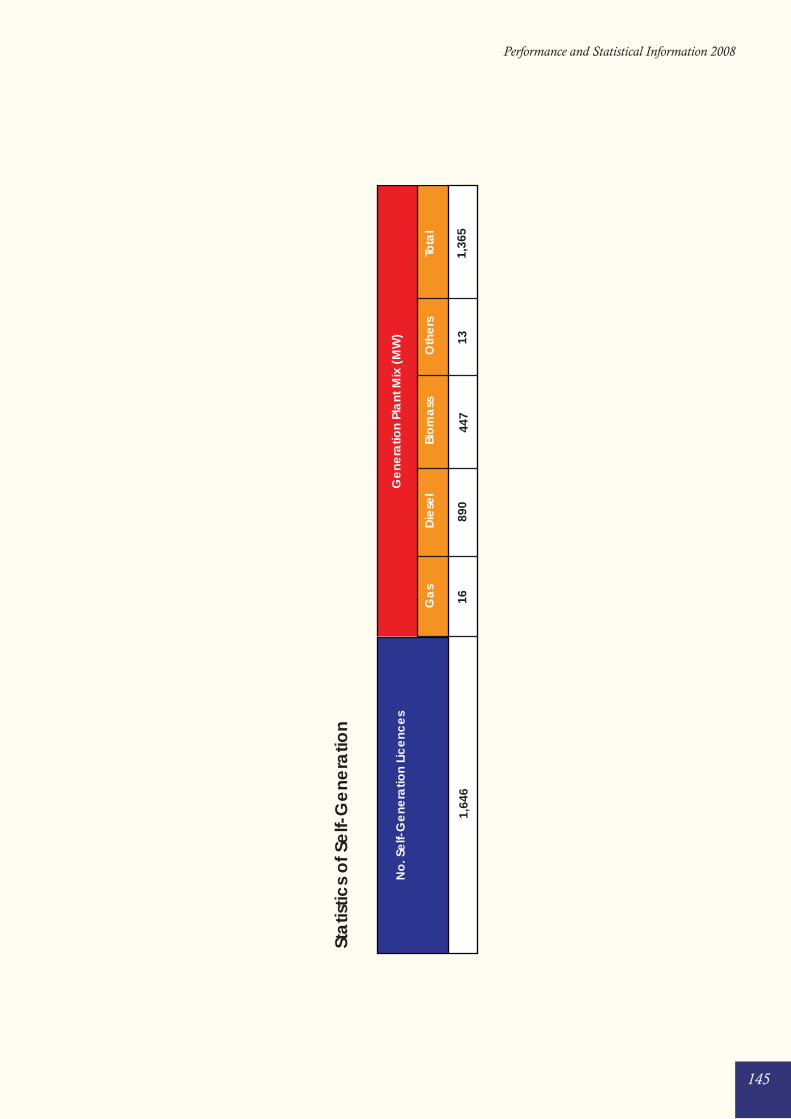
145
Performance and Statistical Information 2008
Ga
sD
iese
lO
the
rs
1689
013
Sta
tistic
s o
f Se
lf-G
ene
ratio
n
1,64
644
71,
365
Bio
ma
ssTo
tal
No
. Se
lf-G
ene
ratio
n Li
ce
nce
sG
ene
ratio
n Pl
ant
Mix
(M
W)

146
Maklumat Prestasi dan Statistik 2008
147
Performance and Statistical Information 2008
Statistik Dan Maklumat Lain Yang PentingUntuk Industri Bekalan Elektrik
Other Important Statistics and Informationof the Electricity Supply Industry

148
Maklumat Prestasi dan Statistik 2008
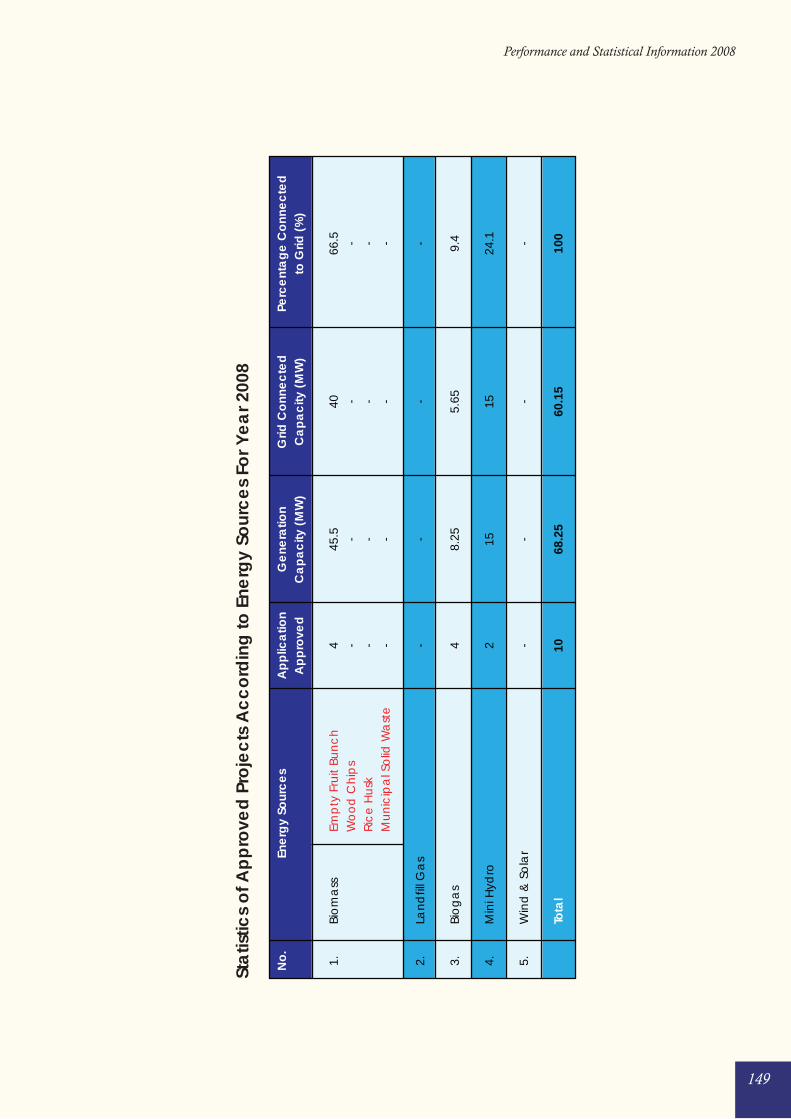
149
Performance and Statistical Information 2008
Sta
tistic
s o
f Ap
pro
ved
Pro
jec
ts A
cc
ord
ing
to E
nerg
y So
urc
es
For Y
ea
r 200
8
No
.
1. 2. 3. 4. 5.
Bio
ma
ss
Lan
dfil
l Ga
s
Bio
ga
s
Min
i Hyd
ro
Win
d &
So
lar
Tota
l
Ene
rgy
Sour
ce
s
Em
pty
Fru
it Bu
nc
h
Wo
od
Ch
ips
R
ice
Hu
sk
Mu
nic
ipa
l So
lid W
ast
e
Ap
plic
atio
nA
pp
rove
d
4 - - - - 4 2 - 10
Ge
nera
tion
Ca
pa
city
(M
W)
45.5 - - - -
8.25 15 -
68.2
5
Grid
Co
nne
cte
dC
ap
ac
ity (
MW
)
40 - - - -
5.65 15 -
60.1
5
Perc
ent
ag
e C
onn
ec
ted
to G
rid (
%)
66.5 - - - - 9.4
24.1 -
100
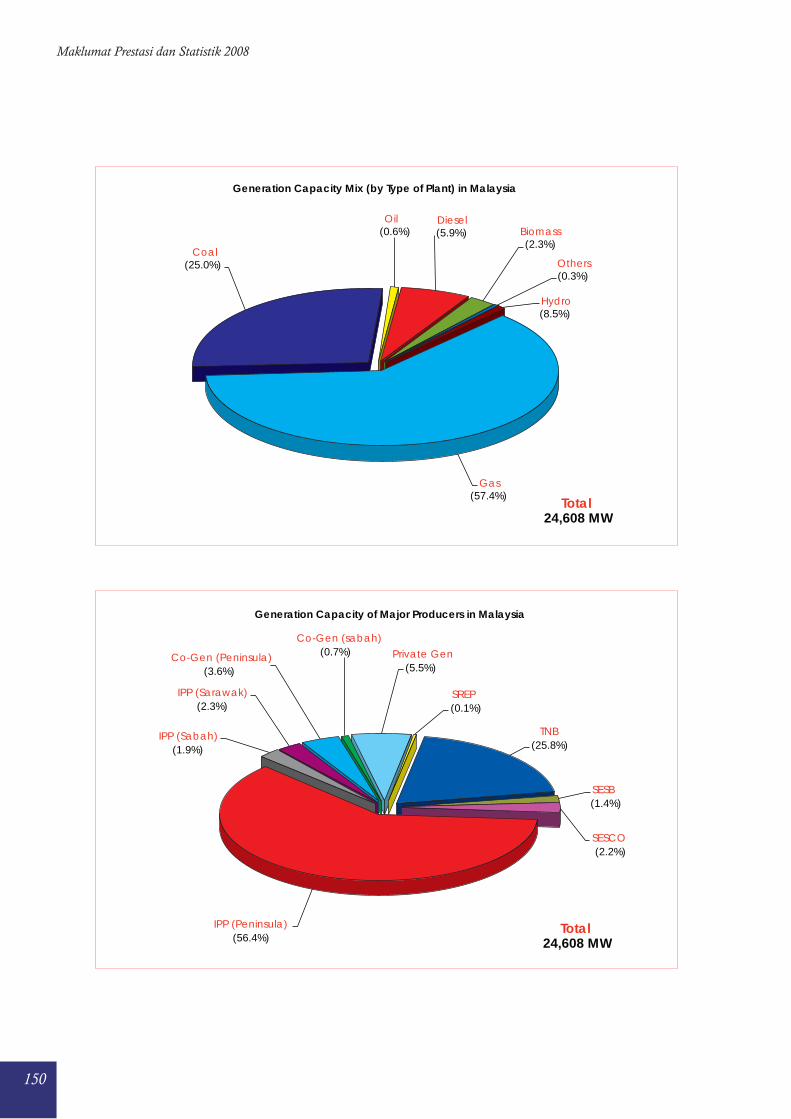
150
Maklumat Prestasi dan Statistik 2008
Hydro (8.5%)
Gas (57.4%)
Coal (25.0%)
Oil (0.6%)
Diesel (5.9%) Biomass
(2.3%)
Others (0.3%)
Generation Capacity Mix (by Type of Plant) in Malaysia
Total24,608 MW
TNB(25.8%)
SESB(1.4%)
SESCO(2.2%)
IPP (Peninsula) (56.4%)
IPP (Sabah) (1.9%)
IPP (Sarawak) (2.3%)
Co-Gen (Peninsula) (3.6%)
Co-Gen (sabah) (0.7%) Private Gen
(5.5%)
SREP (0.1%)
Generation Capacity of Major Producers in Malaysia
Total24,608 MW
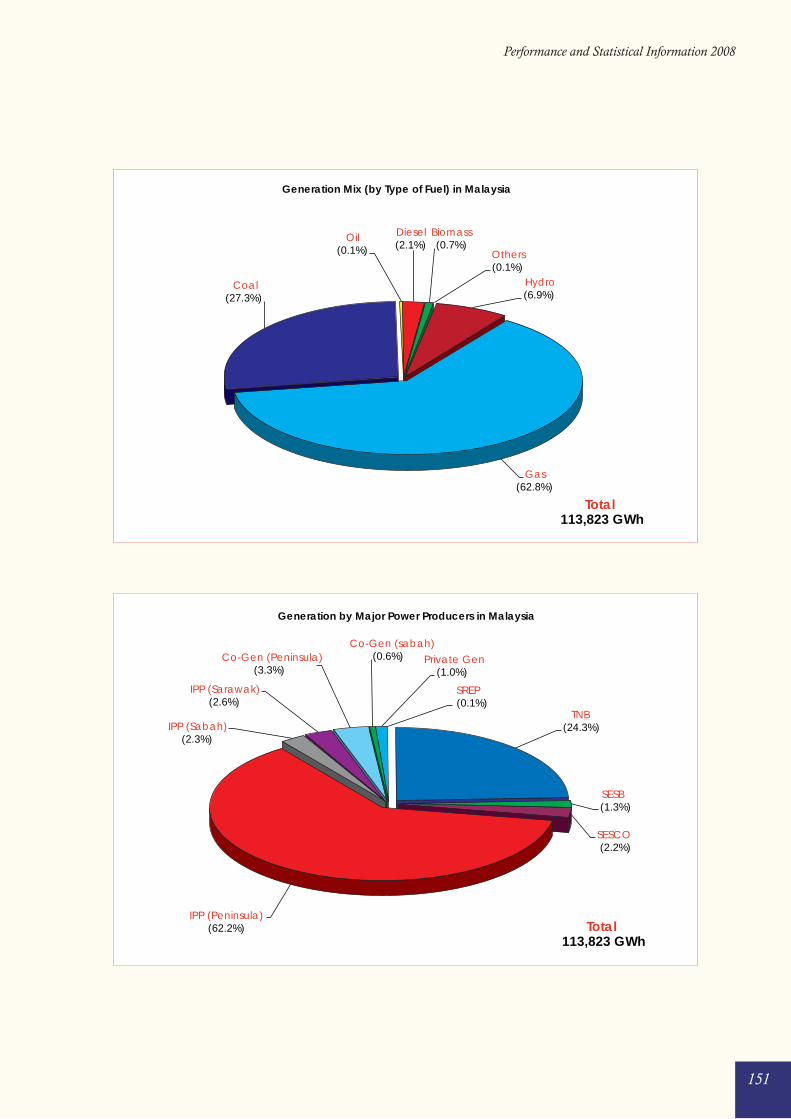
151
Performance and Statistical Information 2008
Hydro(6.9%)
Gas(62.8%)
Coal (27.3%)
Oil (0.1%)
Diesel (2.1%)
Biomass(0.7%)
Others(0.1%)
Generation Mix (by Type of Fuel) in Malaysia
Total113,823 GWh
TNB(24.3%)
SESB(1.3%)
SESCO(2.2%)
IPP (Peninsula) (62.2%)
IPP (Sabah) (2.3%)
IPP (Sarawak) (2.6%)
Co-Gen (Peninsula) (3.3%)
Co-Gen (sabah)(0.6%) Private Gen
(1.0%)
SREP (0.1%)
Generation by Major Power Producers in Malaysia
Total113,823 GWh
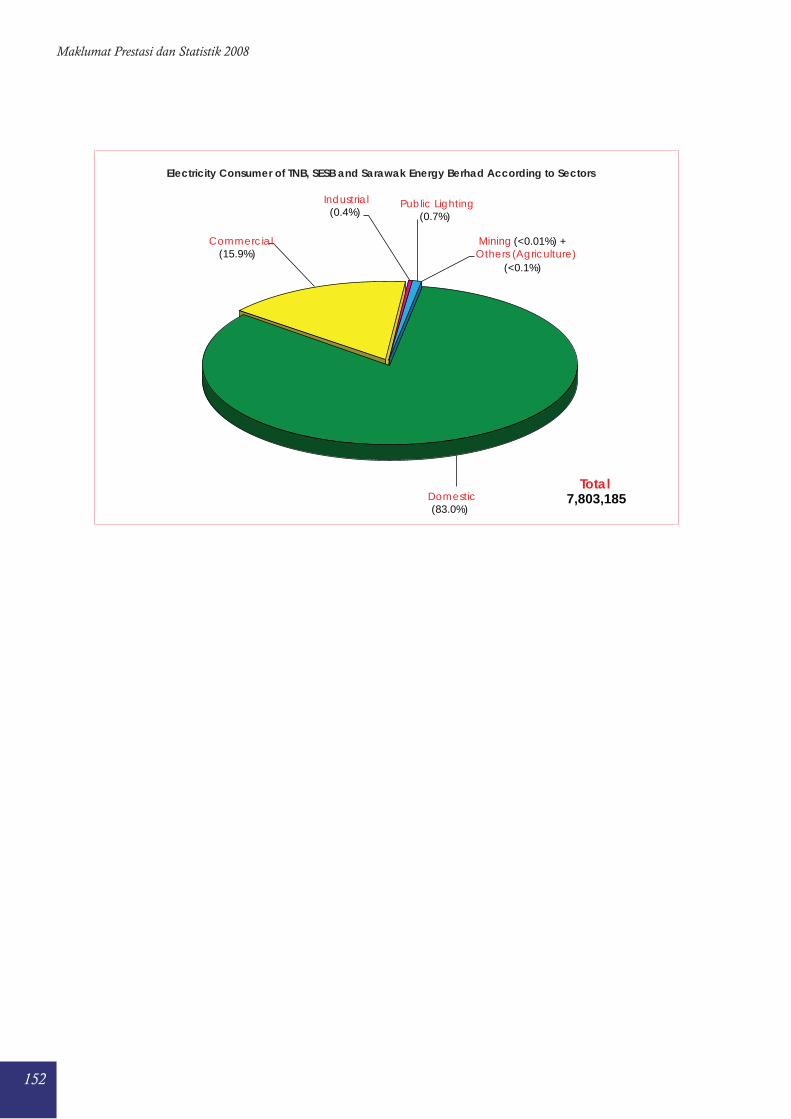
152
Maklumat Prestasi dan Statistik 2008
Electricity Consumer of TNB, SESB and Sarawak Energy Berhad According to Sectors
Domestic (83.0%)
Commercial (15.9%)
Industrial (0.4%)
Public Lighting (0.7%)
Mining (<0.01%) + Others (Agriculture)
(<0.1%)
Total 7,803,185
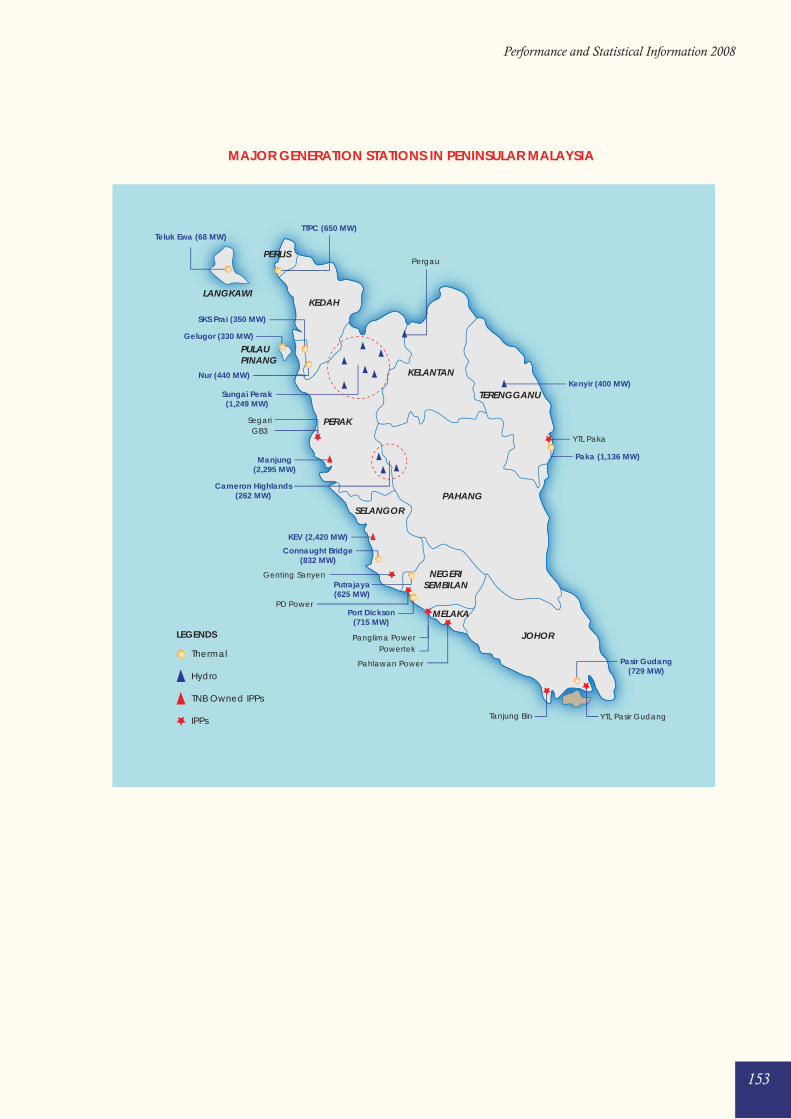
153
Performance and Statistical Information 2008
MAJOR GENERATION STATIONS IN PENINSULAR MALAYSIA
LANGKAWI
PULAUPINANG
PERAK
KEDAH
PERLIS
KELANTAN
TERENGGANU
PAHANG
JOHOR
MELAKA
NEGERISEMBILAN
SELANGOR
Thermal
Hydro
TNB Owned IPPs
IPPs
LEGENDS
Pasir Gudang(729 MW)
Paka (1,136 MW)
Port Dickson(715 MW)
Putrajaya(625 MW)
Connaught Bridge(832 MW)
KEV (2,420 MW)
Teluk Ewa (68 MW)
Gelugor (330 MW)
Manjung(2,295 MW)
Cameron Highlands(262 MW)
Sungai Perak(1,249 MW)
Nur (440 MW)Kenyir (400 MW)
SKS Prai (350 MW)
TTPC (650 MW)
YTL Pasir GudangTanjung Bin
Panglima Power
Pergau
Powertek
PD Power
Genting Sanyen
SegariGB3
Pahlawan Power
YTL Paka
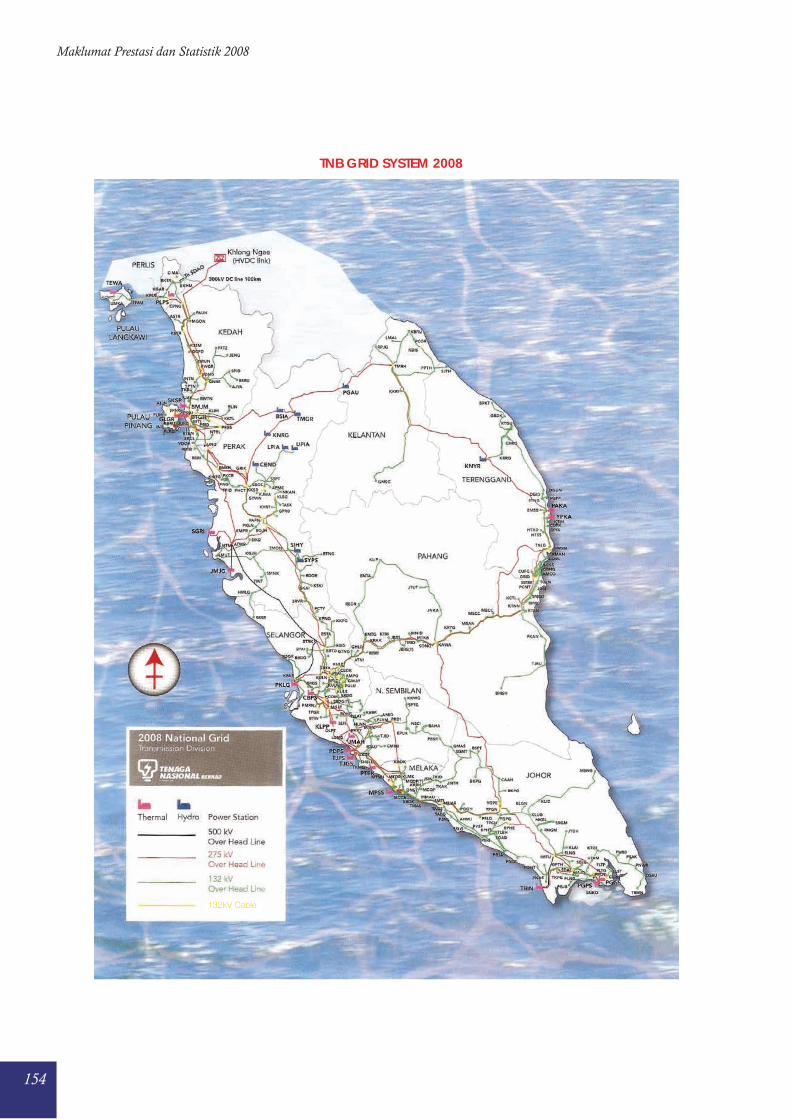
154
Maklumat Prestasi dan Statistik 2008
TNB GRID SYSTEM 2008
132kV Cable
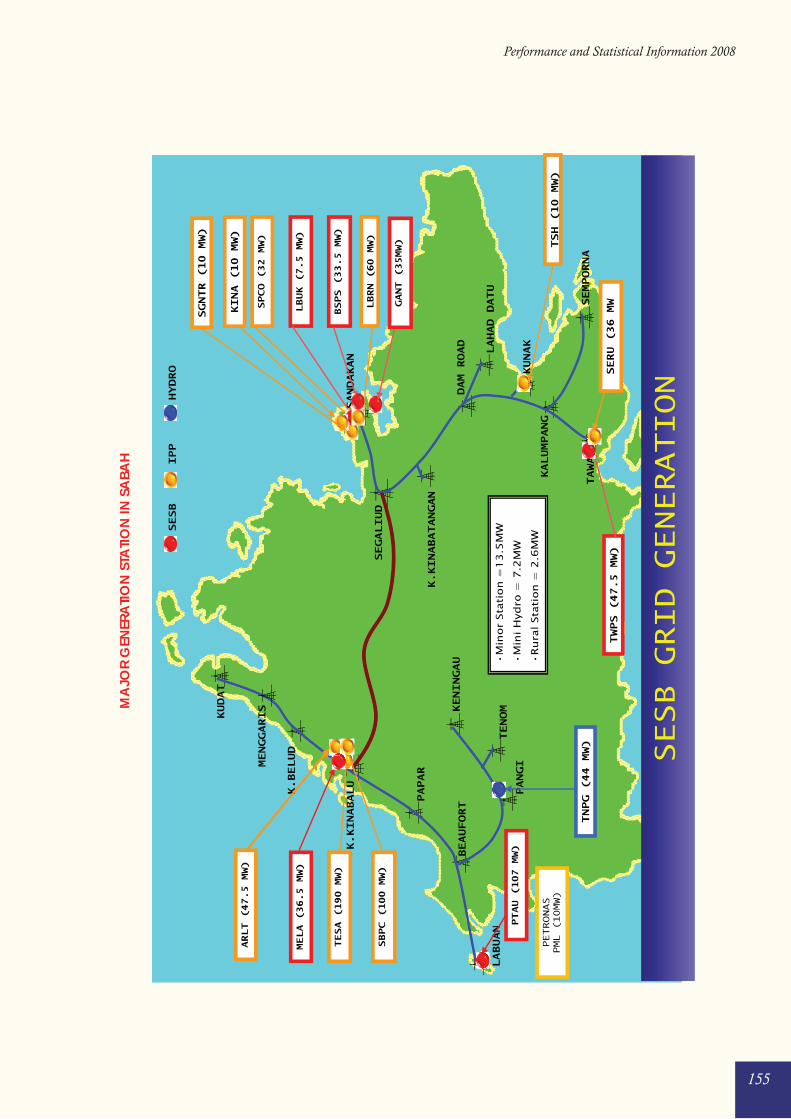
155
Performance and Statistical Information 2008
MA
JOR
GEN
ERA
TIO
N S
TATI
ON
IN S
ABA
H
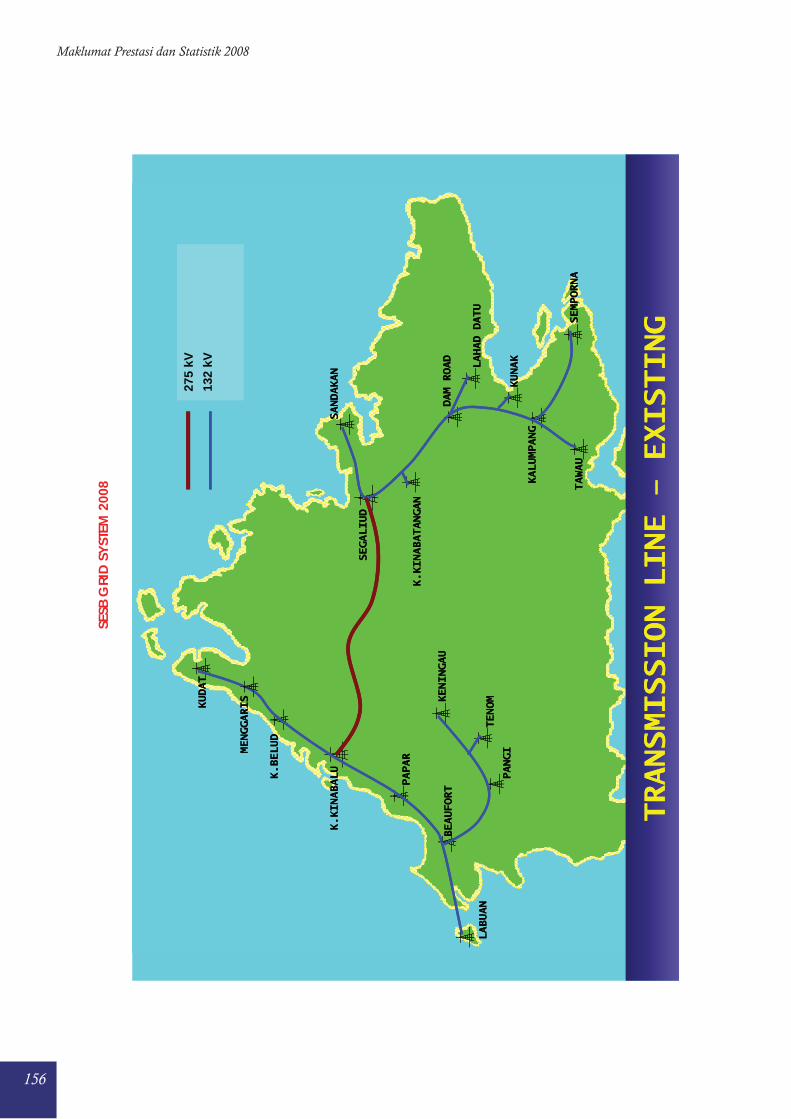
156
Maklumat Prestasi dan Statistik 2008
SESB
GRI
D S
YST
EM 2
008
275
kV
132
kV
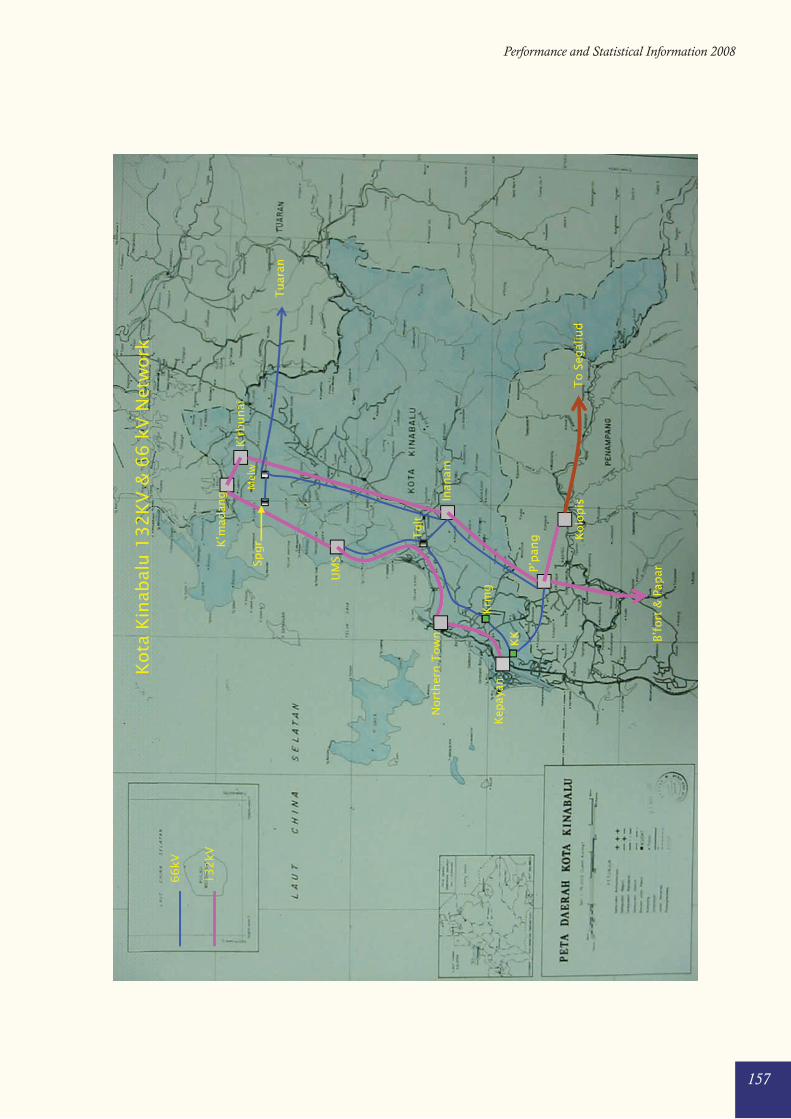
157
Performance and Statistical Information 2008
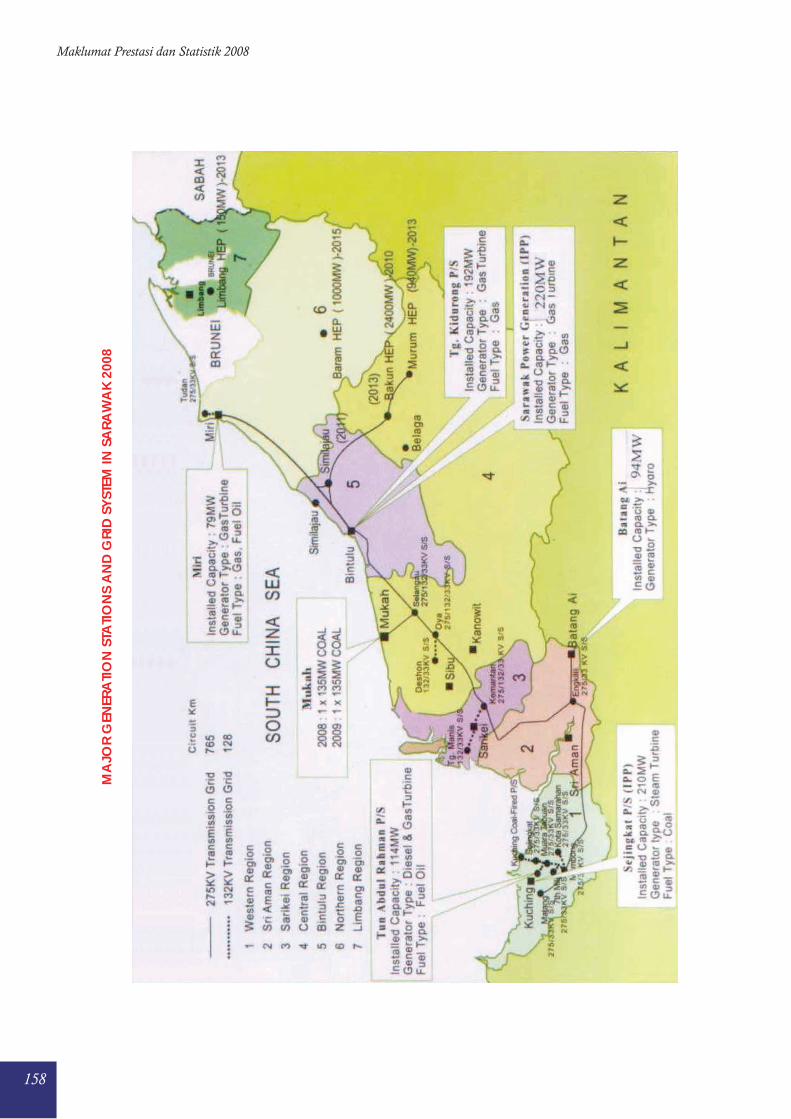
158
Maklumat Prestasi dan Statistik 2008
MA
JOR
GEN
ERA
TIO
N S
TATI
ON
S A
ND
GRI
D S
YST
EM IN
SA
RAW
AK
200
8
159
Performance and Statistical Information 2008
Alamat Perhubungan
Key Contacts

160
Maklumat Prestasi dan Statistik 2008
161
Performance and Statistical Information 2008
MINISTRY OF ENERGY, GREEN TECHNOLOGY
AND WATER
Block E4/5, Government Complex Parcel E
Federal Government Administrative Centre
62668 Putrajaya
Tel : 03-8883 6000 Fax : 03-8889 3712
MINISTRY OF INTERNATIONAL TRADE
AND INDUSTRY (MITI)
Block 10, Government Offices Complex
Jalan Duta, 50622 Kuala Lumpur
Tel : 03-6203 3022 Fax : 03-6201 2337
MINISTRY OF FINANCE
Ministry of Finance Complex
No. 5, Persiaran Perdana, Presint 2
Federal Government Administrative Centre
62592 Putrajaya
Tel : 03-8882 3000 Fax : 03-8882 3893 /
8882 3894
MINISTRY OF PLANTATION INDUSTRIES
AND COMMODITIES
No 15, Level 6-13, Persiaran Perdana, Presint 2
Federal Government Administrative Centre
62654 Putrajaya
Tel : 03-8880 3300 Fax : 03-8880 3482 /
8880 3483
MINISTRY OF RURAL AND REGIONAL
DEVELOPMENT
Blok D9, Kompleks D
Federal Government Administrative Centre
62606 Putrajaya
Tel : 03-8886 3500 Faks : 03-8889 2104
ENERGY COMMISSION
Level 13, Menara TH Perdana
Maju Junction, 1001, Jalan Sultan Ismail
50250 Kuala Lumpur
Tel : 03-2612 5400 Fax : 03-2691 4584
MALAYSIAN INDUSTRIAL DEVELOPMENT
AUTHORITY (MIDA)
Block 4, Plaza Sentral, Jalan Stesen Sentral 5
Kuala Lumpur Sentral
50470 Kuala Lumpur
Tel : 03-2267 3633 Fax : 03-2274 7970
ECONOMIC PLANNING UNIT
Prime Minister’s Department
Block B5 & B6
Federal Government Administrative Centre
62502 Putrajaya
Tel : 03-8888 3333 Fax : 03-8888 3755
STATISTICS DEPARTMENT
Block C6, Complex C
Federal Government Administrative Centre
62514 Putrajaya
Tel : 03-8885 7000 Fax : 03-8888 9248
MALAYSIA EXTERNAL TRADE DEVELOPMENT
CORPORATION (MATRADE)
Menara MATRADE
Jalan Khidmat Usaha,
Off Jalan Duta
50480 Kuala Lumpur
Tel : 03-6207 7077 Fax : 03-6203 7037 /
6203 7033
KEY CONTACTS
GOVERNMENT MINISTRIES AND DEPARTMENTS
162
Maklumat Prestasi dan Statistik 2008
TENAGA NASIONAL BERHAD
Ibu Pejabat
No. 129, Jalan Bangsar
Peti Surat 11003, 50732 Kuala Lumpur
Tel : 03-2282 5566/ Fax : 03-2282 6754
2296 2121
TNB GENERATION SDN. BHD.
d/a Naib Presiden (Penjanaan)
Tenaga Nasional Berhad
Ibu Pejabat
No. 129, Jalan Bangsar
Peti Surat 11003, 59732 Kuala Lumpur
Tel : 03-2284 0680/ Fax : 03-2282 1073 /
2284 0711 2282 6886
POWERTEK BERHAD
Level 43, Menara MAXIS
Kuala Lumpur City Centre,
50088 Kuala Lumpur
Tel : 03-2381 6666 Fax : 03-2381 6677
GENTING SANYEN POWER SDN. BHD.
22nd Floor, Wisma Genting
28, Jalan Sultan Ismail,
50250 Kuala Lumpur
Tel : 03-2333 2211 Fax : 03-2162 4032
ARL POWER SDN. BHD.
Taman Ekuestrian Putrajaya
Presint 5, 62200 Putrajaya
Wilayah Persekutuan Putrajaya.
Tel : 03-8888 6080 Fax: 03-8888 8699
SARAWAK ENERGY BERHAD
7th Floor, Wisma SESCO
Jalan Bako, Petra Jaya
93673 Kuching, Sarawak
Tel : 082-441 188 Fax : 082-444 433
SABAH ELECTRICITY SDN. BHD.
Wisma SESB
Jalan Tuanku Abdul Rahman
88673 Kota Kinabalu, Sabah
Tel : 088-282 699 Fax : 088-223 320
PORT DICKSON POWER BERHAD
Batu 2, Jalan Seremban
71000 Seremban, Negeri Sembilan
Tel : 06-651 4100 Fax : 06-651 4236
YTL POWER GENERATION SDN. BHD.
8th Floor, Menara ING
84, Jalan Raja Chulan,
50200 Kuala Lumpur
Tel : 03-2711 1581 Fax : 03-2732 0560
SEGARI ENERGY VENTURES SDN. BHD.
Level 12, Block 3B, Plaza Sentral
Jalan Stesen Sentral 5,
50470 Kuala Lumpur
Te : 03-2263 3388 Fax : 03-2263 3333
MUSTEQ HYDRO SDN. BHD.
1501, 15th Floor, Amcorp Tower
Amcorp Trade Centre
18, Jalan Persiaran Barat
46050 Petaling Jaya, Selangor
Tel : 03-7957 7781 Fax : 03-7957 4793
SERUDONG POWER SDN. BHD.
Lot 8-05, Level 8, Menara Milenium
8, Jalan Damanlela, Bukit Damansara
50490 Kuala Lumpur
Tel : 03-2093 8818 Fax : 03-2093 7818
RANHILL POWERTRON SDN. BHD.
32nd Floor, Empire Tower
No. 182, Jalan Tun Razak
50400 Kuala Lumpur
Tel : 03-2171 2020 / Fax : 03-2171 1149
2170 6000
STRATAVEST SDN. BHD.
15th Floor, Amcorp Tower
Amcorp Trade Centre
No. 18, Jalan Persiaran Barat
46050 Petaling Jaya, Selangor
Tel : 03-7957 7781 Fax : 03-7957 4793
TEKNOLOGI TENAGA PERLIS CONSORTIUM
SDN. BHD.
5th Floor, East Wing & Centrelink
Wisma Consplant 2
No. 7, Jalan SS 16/1
47500 Subang Jaya, Selangor
Tel : 03-5632 3633 Fax : 03-5631 3270 /
5631 0470 /
5632 6737
KEY CONTACTS
UTILITIES AND MAJOR POWER PRODUCERS
163
Performance and Statistical Information 2008
NUR GENERATION SDN. BHD.
Receiver And Managers Appointed
Central Control Building (CCB)
Lot 30, Jalan Hi-Tech 4, Kulim Hi-Tech Park
09000 Kulim, Kedah
Tel : 04-401 0100 Fax : 04-401 0150 /
401 0319
SANDAKAN POWER CORPORATION SDN. BHD.
Lot D20, 2nd Floor, Damai Plaza Phase III
Jalan Kayu Manis
88300 Kota Kinabalu, Sabah
Tel : 088-269 831 / Fax : 088-267 517
269 832
TNB JANAMANJUNG SDN. BHD.
Stesen Janakuasa Sultan Azlan Shah
Manjung, Jalan Semarak Api
Teluk Rubiah 32040 Seri Manjung, Perak
Tel : 05-689 8000 Fax : 05-688 4309
PAHLAWAN POWER SDN. BHD.
Stesen Janakuasa Elektrik Tanjung Kling
76400 Tanjong Kling, Melaka
Tel : 06-351 5942/ Fax : 06-351 7107
351 3048
TNB HIDRO SDN. BHD.
d/a Naib Presiden (Penjanaan)
Tenaga Nasional Berhad
Bahagian Penjanaan
4-8th Floor, Bangunan Penjanaan
129, Jalan Bangsar 59200 Kuala Lumpur
Tel : 03-2284 0680 / Fax : 03-2282 1073 /
2284 0711 2282 6886
PANGLIMA POWER SDN. BHD.
Stesen Janakuasa Elektrik Teluk Gong
78200 Kuala Sungai Baru, Melaka
Tel : 06-384 1782 Fax : 06-384 1890
KAPAR ENERGY VENTURES SDN. BHD.
Stesen Janaelektrik Sultan Salahuddin Abdul Aziz
Peti Surat 220, 42200 Kapar, Selangor
Tel : 03-3250 8801 Fax : 03-3250 7617
JIMAH ENERGY VENTURES SDN. BHD.
Suite 10-1, Level 10
Wisma UOA Damansara II
No. 6, Jalan Changkat Semantan
Damansara Heights
P.O. Box 38, 50490 Kuala Lumpur
Tel : 03-2095 3622 Fax: 03-2095 0822
PRAI POWER SDN. BHD.
Level 12, Block 3B
Plaza Sentral,
Jalan Stesen Sentral 5
50470 Kuala Lumpur
Tel : 03-2263 3388 Fax : 03-2263 3399
GB3 SDN. BHD.
Level 12, Block 3B
Plaza Sentral,
Jalan Stesen Sentral 5
50470 Kuala Lumpur
Tel : 03-2263 3388 Fax : 03-2263 3322
TANJUNG BIN POWER SDN. BHD.
Level 12, Block 3B
Plaza Sentral,
Jalan Stesen Sentral 5
50470 Kuala Lumpur
Tel : 03-2263 3388 Fax : 03-2263 3333
SEPANGAR BAY POWER CORPORATION SDN. BHD.
Suite 2A-12-1, Block 2A
Level 12, Plaza Sentral,
Jalan Stesen Sentral 5,
50470 Kuala Lumpur
Tel : 03-2780 6688 Fax : 03-2780 7788
KEY CONTACTS
UTILITIES AND MAJOR POWER PRODUCERS

164
Maklumat Prestasi dan Statistik 2008