hydrogen gas production from glycerol … et al: hydrogen gas production from glycerol via steam...
TRANSCRIPT
Malaysian Journal of Analytical Sciences, Vol 19 No 5 (2015): 1043 - 1055
1043
MALAYSIAN JOURNAL OF ANALYTICAL SCIENCES
Published by The Malaysian Analytical Sciences Society
HYDROGEN GAS PRODUCTION FROM GLYCEROL VIA STEAM
REFORMING USING NICKEL LOADED ZEOLITE CATALYST
(Penghasilan Gas Hidrogen daripada Gliserol melalui Kaedah Pembaharuan Stim
dengan menggunakan Pemangkin Nikel-Zeolite)
Fazureen Azaman1, Hafizan Juahir
1*, Mahadhir Mohamed
2, Azman Azid
1, Kamaruzzaman Yunus
3,
Anis Farhana Abdul Rahman2, Wan Nur Anis Amira Wan Ranizang
2, Fara Aiza Md Sanin
2,
Mohammad Azizi Amran1, Mohd Zaid Arqam Zainal Abidin
1, Norsyuhada Hairoma
1,
Nur Hishaam Sulaiman1, Ismail Zainal Abidin
1
1East Coast Environmental Research Institute (ESERI),
Universiti Sultan Zainal Abidin, Gong Badak Campus,21300 Kuala Terengganu, Terengganu, Malaysia 2Department of Chemical Engineering, Faculty of Chemical Engineering,
Universiti Teknologi Malaysia, 81310 UTM Skudai, Johor, Malaysia 3Kulliyyah of Science,
International Islamic University Malaysia, 25200 Kuantan, Pahang, Malaysia
*Corresponding author: [email protected]
Received: 14 April 2015; Accepted: 9 July 2015
Abstract
Glycerol is the main by-product of biodiesel production that produces from transesterification process. In this research, focused
was on hydrogen production via glycerol steam reforming using nickel loaded HZSM-5 catalyst. The catalysts were prepared by
using different loading amount of nickel (0.5, 1.0, 5.0, 10.0 and 15 wt %) on HZSM-5 catalyst through the wet impregnation
method at temperature 500 ºC and atmospheric pressure. The catalyst was characterized by using XRD, FTIR and SEM. Then,
only 15 wt % Ni loading has been chosen based on the parameter which is different range of catalyst weight (0.3-0.5g) at
different range of glycerol flow rate (0.2-0.4mL/min) at temperature 600 ºC and atmospheric pressure. The products were
analyzed by using gas-chromatography with thermal conductivity detector (GC-TCD) where it is used to identify the yield of
hydrogen. The data of the experiment were analyzed by using Response Surface Methodology (RSM) in order to study the
relationship of catalyst weight and glycerol flow rate. The results showed that the optimum condition to produce a maximum
hydrogen yield with 15wt% Ni/HZSM-5 catalyst was 78.10004% at glycerol flow rate of 0.356484 mL/min and catalyst weight
of 0.429267 g.
Keywords: glycerol, transesterification, biodiesel, HZSM-5, hydrogen
Abstrak
Gliserol adalah produk sampingan utama penghasilan biodiesel yang terhasil daripada proses transesterifikasi. Dalam kajian ini,
fokus utama adalah kepada penukaran gliserol terhadap gas hidrogen telah menggunakan HZSM-5 yang diubahsuai dengan
nikel. Kajian ini dijalankan dengan menggunakan pemangkin 0.5, 1.0, 5.0, 10.0 and 15% nikel/ ZSM-5 pada tekanan atmosfera
dan suhu 500 ºC untuk penyediaan pemangkin. XRD, FTIR dan SEM digunakan untuk menganalisis struktur pemangkin.
Kemudian, hanya 15 % nikel/ZSM-5 yang digunakan untuk menjalankan eksperimen seterusnya pada perbezaan berat
pemangkin (0.3-0.5 g) dan kadar aliran gliserol (0.2-0.4 mL/min) pada tekanan atmosfera dan suhu 600 ºC. Produk ini akan
dianalisis dengan menggunakan kromatografi gas (GC-TCD) untuk mengkaji peratus hydrogen terhasil. Keputusan eksperimen
menunjukkan 78.10004% penghasilan optimum gas hidrogen oleh 15% Ni/HZSM-5 pada keadaan optimum iaitu pada kadar
aliran gliserol = 0.356484 mL/min and berat pemangkin = 0.429267 g.
ISSN
1394 - 2506
Fazureen et al: HYDROGEN GAS PRODUCTION FROM GLYCEROL VIA STEAM REFORMING USING
NICKEL LOADED ZEOLITE CATALYST
1044
Kata Kunci: gliserol, transesterifikasi, biodiesel, HZSM-5, hidrogen
Introduction
Glycerol is a by-product during manufacturing several chemicals such as petroleum, soap and biodiesel. Biodiesel is
an alternative fuel for diesel engines that is produced from vegetable oil or animal fat with a simple monohydric
alcohol such as methanol. The reaction requires a catalyst, usually a strong base, such as sodium hydroxide, and
produces new chemical compounds called methyl esters. It is these esters that have come to be known as biodiesel.
“The mono alkyl esters of long fatty acids derived from renewable lipid feedstock such as animal fats or vegetable
oil, for use in compression ignition diesel engines” [1]. In simple terms, biodiesel is a renewable fuel manufactured
from vegetable oil, methanol, animal fats, and also recycled cooking fats [2].
In general, biodiesel is produced through a process known as transesterification which involves altering the
chemical properties of the oil by using methanol. Transesterification of plant oils with methanol is a simple process
that gives high conversions of yields with only glycerol as a by-product. Glycerol production increased as the
production of biodiesel increased due to the crude glycerol as a by-product of biodiesel production. The generation
of crude glycerol gives a yield at about 10% (wt/wt) of biodiesel during the process of biodiesel production. In that
case, by through the several of the analysis, the global biodiesel market is estimated to reach 37 billion gallons by
2016 with an average annual growth of 42%, that means about 4 billion gallons of crude glycerol will be produced
[3].
Therefore, it is imperative to find alternative uses for glycerol. Glycerol has many uses in different industries, such
as food, paint, pharmaceutical, cosmetic, soap, toothpaste and others. Besides, glycerol also can produce value-
added chemicals by conversion of glycerol such as citric acid, lactic acid, hydrogen, ethanol and others [3]. The
simplest and most abundant element is hydrogen, which is growing from time to time due to the technological
advancements in fuel cell industry. Nowadays, almost 95% of hydrogen is produced from fossil fuel. Fossil fuels
are not renewable resources. So, renewable resources based technologies for production of hydrogen are attractive
options for the future due to the carbon neutral nature of these technologies with minor effects to the environment.
We also have seen over the last few years, a great interest in utilizing glycerol for the production of hydrogen [4].
Hydrogen can be produced from glycerol by undergoing some processes such as steam reforming, autothermal
reforming, aqueous-phase reforming and supercritical water reforming by Adhikari et al. [4] and they found that the
best conditions for steam reforming to produce hydrogen is temperature above 627 ºC, 9:1 of the molar ratio of
water/glycerol and at atmospheric pressure. While, Adhikari et al. [5] Ni/CeO2 was the best performing catalyst
compared to the Ni/MgO and Ni/TiO2 in terms of H2 selectivity and glycerol conversion under the experimental
conditions investigated. Ni/CeO2 gave 74.7 % of H2 selectivity which is maximum H2 selectivity compared to the
Ni/MgO (38.6%) and Ni/TiO2 (28.3%) at a water/glycerol molar ratio (WGMR) of 12:1, 600 ºC and 0.5 mL/min of
feed flow rate.
Besides, Iriondo et al. [6] studied that the noble metals are active and stable for steam reforming, but the cost is
quite high. For that reason, the non-noble metals such as nickel (Ni) and copper (Cu) are decided to be used as metal
catalysts in this study due to the lower cost and more available than noble metals [7]. In addition, Nichele et al. [7]
study has investigated that the best result for hydrogen production via glycerol steam reforming is achieved with
Ni/ZrO2 at 650 ºC where hydrogen yield is 65% and glycerol conversion is 72%. Other study, Buhari [8] reported
that 15wt% Ni-ZSM-5 has shown the best performance on hydrogen composition in product which 58.37% at
temperature 600 ºC. In this research, the objectives is to determine the relationship of catalyst weight (range = 0.3-
0.5g) and glycerol flow rate (range = 0.2-0.4mL/min) at temperature 600 ºC on 15wt% of the nickel loading by
using the Response Surface Methodology (RSM) and to find the optimum condition for production of hydrogen gas.
Malaysian Journal of Analytical Sciences, Vol 19 No 5 (2015): 1043 - 1055
1045
Materials and Methods
Catalyst Preparation
HZSM-5 and nickel (II) nitrate hexahydrate was dissolved in 100 ml of distilled water. The mixed solution was
stirred continuously overnight and dried in an oven overnight at 105 ºC. Finally, the calcination process occurs
where calcined in the furnace for 5 hours at 500 ºC. The HZSM-5 zeolite catalyst was impregnated with nickel
metals in different percentages as shown in Table 1.
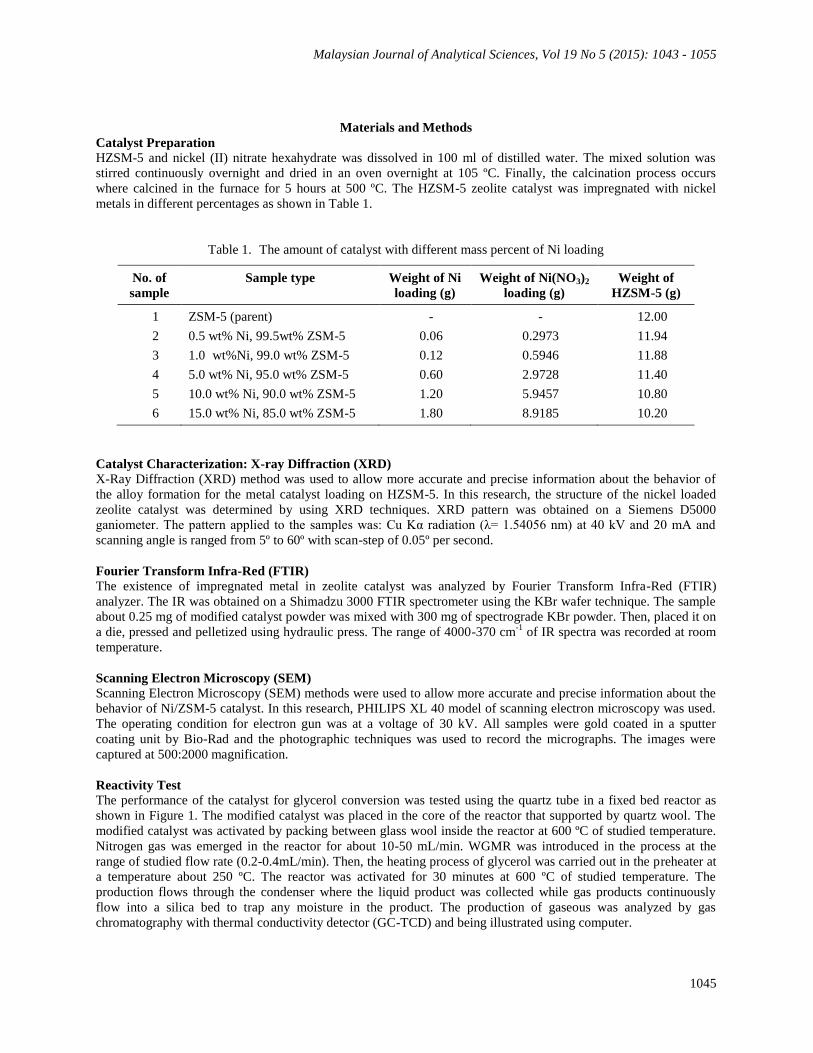
Table 1. The amount of catalyst with different mass percent of Ni loading
No. of
sample
Sample type Weight of Ni
loading (g)
Weight of Ni(NO3)2
loading (g)
Weight of
HZSM-5 (g)
1 ZSM-5 (parent) - - 12.00
2 0.5 wt% Ni, 99.5wt% ZSM-5 0.06 0.2973 11.94
3 1.0 wt%Ni, 99.0 wt% ZSM-5 0.12 0.5946 11.88
4 5.0 wt% Ni, 95.0 wt% ZSM-5 0.60 2.9728 11.40
5 10.0 wt% Ni, 90.0 wt% ZSM-5 1.20 5.9457 10.80
6 15.0 wt% Ni, 85.0 wt% ZSM-5 1.80 8.9185 10.20
Catalyst Characterization: X-ray Diffraction (XRD)
X-Ray Diffraction (XRD) method was used to allow more accurate and precise information about the behavior of
the alloy formation for the metal catalyst loading on HZSM-5. In this research, the structure of the nickel loaded
zeolite catalyst was determined by using XRD techniques. XRD pattern was obtained on a Siemens D5000
ganiometer. The pattern applied to the samples was: Cu Kα radiation (λ= 1.54056 nm) at 40 kV and 20 mA and
scanning angle is ranged from 5º to 60º with scan-step of 0.05º per second.
Fourier Transform Infra-Red (FTIR)
The existence of impregnated metal in zeolite catalyst was analyzed by Fourier Transform Infra-Red (FTIR)
analyzer. The IR was obtained on a Shimadzu 3000 FTIR spectrometer using the KBr wafer technique. The sample
about 0.25 mg of modified catalyst powder was mixed with 300 mg of spectrograde KBr powder. Then, placed it on
a die, pressed and pelletized using hydraulic press. The range of 4000-370 cm-1
of IR spectra was recorded at room
temperature.
Scanning Electron Microscopy (SEM)
Scanning Electron Microscopy (SEM) methods were used to allow more accurate and precise information about the
behavior of Ni/ZSM-5 catalyst. In this research, PHILIPS XL 40 model of scanning electron microscopy was used.
The operating condition for electron gun was at a voltage of 30 kV. All samples were gold coated in a sputter
coating unit by Bio-Rad and the photographic techniques was used to record the micrographs. The images were
captured at 500:2000 magnification.
Reactivity Test
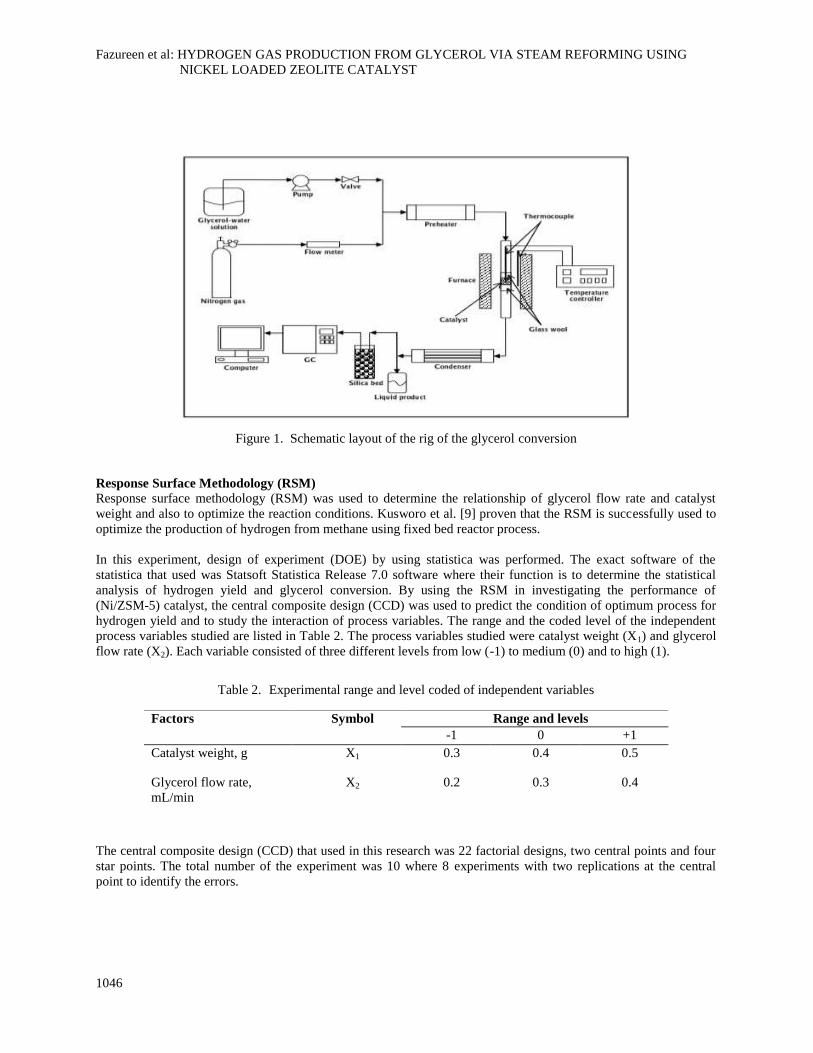
The performance of the catalyst for glycerol conversion was tested using the quartz tube in a fixed bed reactor as
shown in Figure 1. The modified catalyst was placed in the core of the reactor that supported by quartz wool. The
modified catalyst was activated by packing between glass wool inside the reactor at 600 ºC of studied temperature.
Nitrogen gas was emerged in the reactor for about 10-50 mL/min. WGMR was introduced in the process at the
range of studied flow rate (0.2-0.4mL/min). Then, the heating process of glycerol was carried out in the preheater at
a temperature about 250 ºC. The reactor was activated for 30 minutes at 600 ºC of studied temperature. The
production flows through the condenser where the liquid product was collected while gas products continuously
flow into a silica bed to trap any moisture in the product. The production of gaseous was analyzed by gas
chromatography with thermal conductivity detector (GC-TCD) and being illustrated using computer.
Fazureen et al: HYDROGEN GAS PRODUCTION FROM GLYCEROL VIA STEAM REFORMING USING
NICKEL LOADED ZEOLITE CATALYST
1046
Figure 1. Schematic layout of the rig of the glycerol conversion
Response Surface Methodology (RSM)
Response surface methodology (RSM) was used to determine the relationship of glycerol flow rate and catalyst
weight and also to optimize the reaction conditions. Kusworo et al. [9] proven that the RSM is successfully used to
optimize the production of hydrogen from methane using fixed bed reactor process.
In this experiment, design of experiment (DOE) by using statistica was performed. The exact software of the
statistica that used was Statsoft Statistica Release 7.0 software where their function is to determine the statistical
analysis of hydrogen yield and glycerol conversion. By using the RSM in investigating the performance of
(Ni/ZSM-5) catalyst, the central composite design (CCD) was used to predict the condition of optimum process for
hydrogen yield and to study the interaction of process variables. The range and the coded level of the independent
process variables studied are listed in Table 2. The process variables studied were catalyst weight (X1) and glycerol
flow rate (X2). Each variable consisted of three different levels from low (-1) to medium (0) and to high (1).
Table 2. Experimental range and level coded of independent variables
The central composite design (CCD) that used in this research was 22 factorial designs, two central points and four
star points. The total number of the experiment was 10 where 8 experiments with two replications at the central
point to identify the errors.
Factors Symbol Range and levels
-1 0 +1
Catalyst weight, g X1 0.3 0.4 0.5
Glycerol flow rate,
mL/min
X2 0.2 0.3 0.4
Malaysian Journal of Analytical Sciences, Vol 19 No 5 (2015): 1043 - 1055
1047
Results and Discussion
Catalyst Characterization: X-ray Diffraction (XRD) Analysis
In this research, X-Ray Diffraction (XRD) was used to determine the structure of the nickel loaded zeolite catalyst
and the present of crystalline phase. The analyses made with an angular range of 5º and 60º with scale 2θ. The
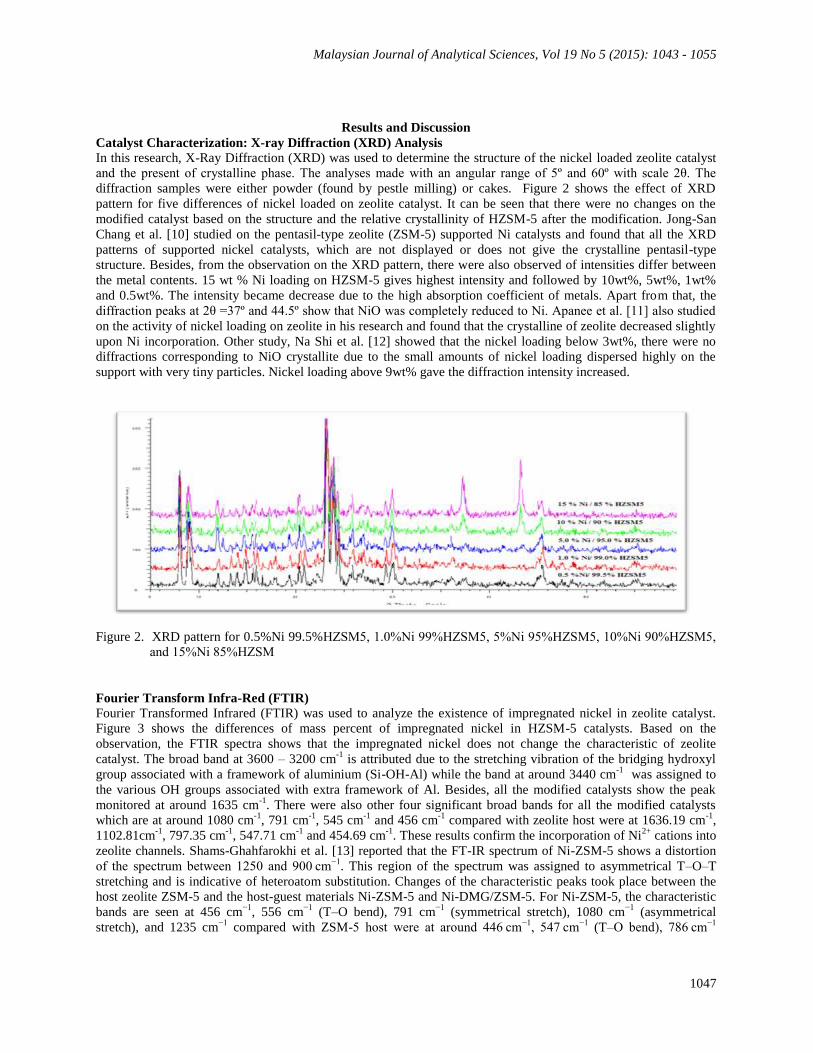
diffraction samples were either powder (found by pestle milling) or cakes. Figure 2 shows the effect of XRD
pattern for five differences of nickel loaded on zeolite catalyst. It can be seen that there were no changes on the
modified catalyst based on the structure and the relative crystallinity of HZSM-5 after the modification. Jong-San
Chang et al. [10] studied on the pentasil-type zeolite (ZSM-5) supported Ni catalysts and found that all the XRD
patterns of supported nickel catalysts, which are not displayed or does not give the crystalline pentasil-type
structure. Besides, from the observation on the XRD pattern, there were also observed of intensities differ between
the metal contents. 15 wt % Ni loading on HZSM-5 gives highest intensity and followed by 10wt%, 5wt%, 1wt%
and 0.5wt%. The intensity became decrease due to the high absorption coefficient of metals. Apart from that, the
diffraction peaks at 2θ =37º and 44.5º show that NiO was completely reduced to Ni. Apanee et al. [11] also studied
on the activity of nickel loading on zeolite in his research and found that the crystalline of zeolite decreased slightly
upon Ni incorporation. Other study, Na Shi et al. [12] showed that the nickel loading below 3wt%, there were no
diffractions corresponding to NiO crystallite due to the small amounts of nickel loading dispersed highly on the
support with very tiny particles. Nickel loading above 9wt% gave the diffraction intensity increased.
Figure 2. XRD pattern for 0.5%Ni 99.5%HZSM5, 1.0%Ni 99%HZSM5, 5%Ni 95%HZSM5, 10%Ni 90%HZSM5,
and 15%Ni 85%HZSM
Fourier Transform Infra-Red (FTIR)
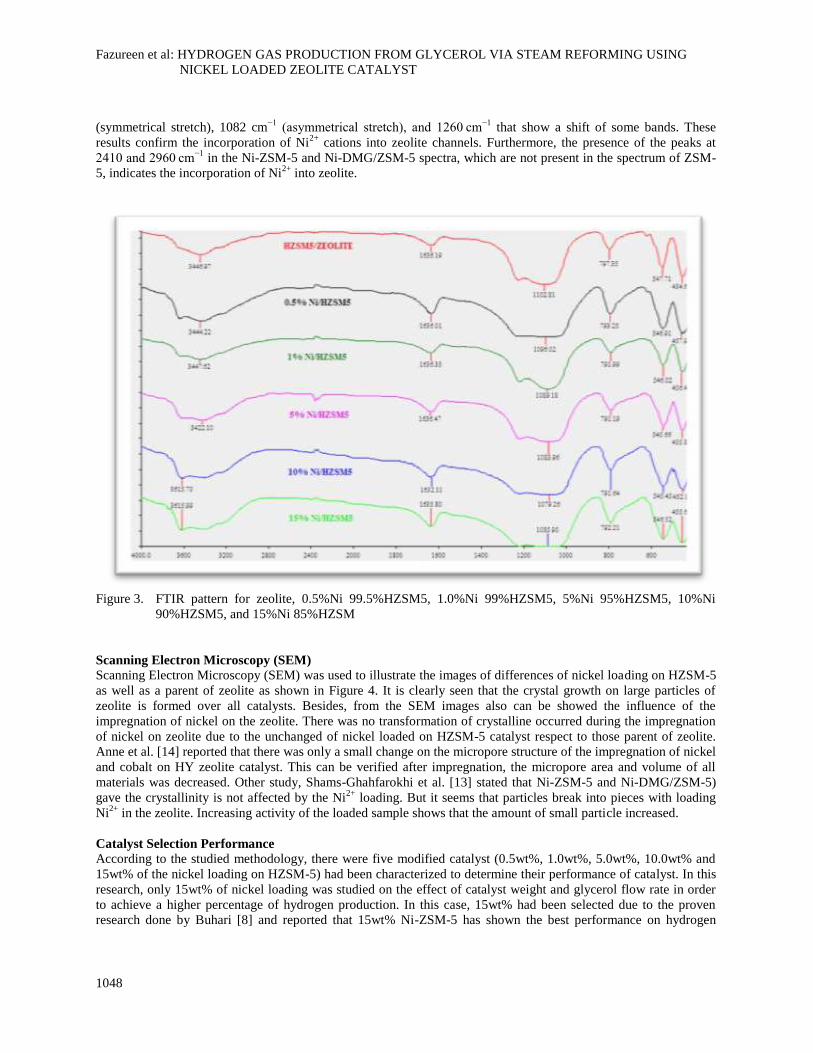
Fourier Transformed Infrared (FTIR) was used to analyze the existence of impregnated nickel in zeolite catalyst.
Figure 3 shows the differences of mass percent of impregnated nickel in HZSM-5 catalysts. Based on the
observation, the FTIR spectra shows that the impregnated nickel does not change the characteristic of zeolite
catalyst. The broad band at 3600 – 3200 cm-1
is attributed due to the stretching vibration of the bridging hydroxyl
group associated with a framework of aluminium (Si-OH-Al) while the band at around 3440 cm-1
was assigned to
the various OH groups associated with extra framework of Al. Besides, all the modified catalysts show the peak
monitored at around 1635 cm-1
. There were also other four significant broad bands for all the modified catalysts
which are at around 1080 cm-1
, 791 cm-1
, 545 cm-1
and 456 cm-1
compared with zeolite host were at 1636.19 cm-1
,
1102.81cm-1
, 797.35 cm-1
, 547.71 cm-1
and 454.69 cm-1
. These results confirm the incorporation of Ni2+
cations into
zeolite channels. Shams-Ghahfarokhi et al. [13] reported that the FT-IR spectrum of Ni-ZSM-5 shows a distortion
of the spectrum between 1250 and 900 cm−1
. This region of the spectrum was assigned to asymmetrical T–O–T
stretching and is indicative of heteroatom substitution. Changes of the characteristic peaks took place between the
host zeolite ZSM-5 and the host-guest materials Ni-ZSM-5 and Ni-DMG/ZSM-5. For Ni-ZSM-5, the characteristic
bands are seen at 456 cm−1
, 556 cm−1
(T–O bend), 791 cm−1
(symmetrical stretch), 1080 cm−1
(asymmetrical
stretch), and 1235 cm−1
compared with ZSM-5 host were at around 446 cm−1
, 547 cm−1
(T–O bend), 786 cm−1
Fazureen et al: HYDROGEN GAS PRODUCTION FROM GLYCEROL VIA STEAM REFORMING USING
NICKEL LOADED ZEOLITE CATALYST
1048
(symmetrical stretch), 1082 cm−1
(asymmetrical stretch), and 1260 cm−1
that show a shift of some bands. These
results confirm the incorporation of Ni2+
cations into zeolite channels. Furthermore, the presence of the peaks at
2410 and 2960 cm−1
in the Ni-ZSM-5 and Ni-DMG/ZSM-5 spectra, which are not present in the spectrum of ZSM-
5, indicates the incorporation of Ni2+
into zeolite.
Figure 3. FTIR pattern for zeolite, 0.5%Ni 99.5%HZSM5, 1.0%Ni 99%HZSM5, 5%Ni 95%HZSM5, 10%Ni
90%HZSM5, and 15%Ni 85%HZSM
Scanning Electron Microscopy (SEM)
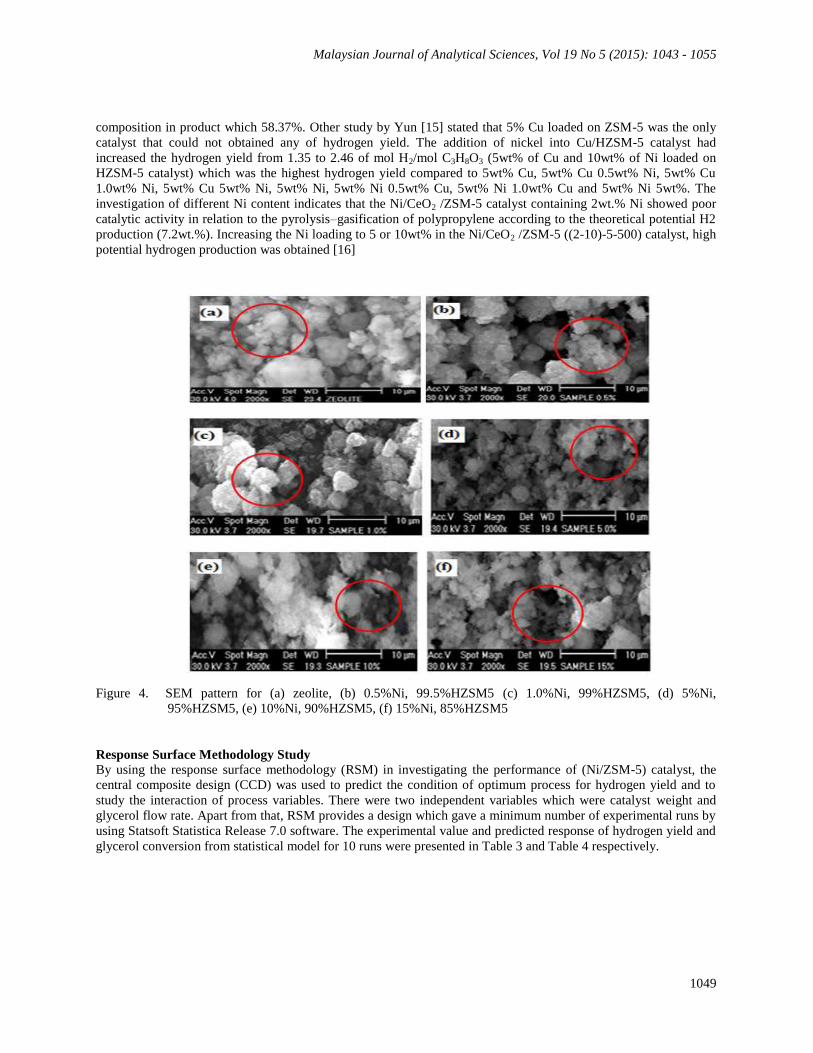
Scanning Electron Microscopy (SEM) was used to illustrate the images of differences of nickel loading on HZSM-5
as well as a parent of zeolite as shown in Figure 4. It is clearly seen that the crystal growth on large particles of
zeolite is formed over all catalysts. Besides, from the SEM images also can be showed the influence of the
impregnation of nickel on the zeolite. There was no transformation of crystalline occurred during the impregnation
of nickel on zeolite due to the unchanged of nickel loaded on HZSM-5 catalyst respect to those parent of zeolite.
Anne et al. [14] reported that there was only a small change on the micropore structure of the impregnation of nickel
and cobalt on HY zeolite catalyst. This can be verified after impregnation, the micropore area and volume of all
materials was decreased. Other study, Shams-Ghahfarokhi et al. [13] stated that Ni-ZSM-5 and Ni-DMG/ZSM-5)
gave the crystallinity is not affected by the Ni2+
loading. But it seems that particles break into pieces with loading
Ni2+
in the zeolite. Increasing activity of the loaded sample shows that the amount of small particle increased.
Catalyst Selection Performance
According to the studied methodology, there were five modified catalyst (0.5wt%, 1.0wt%, 5.0wt%, 10.0wt% and
15wt% of the nickel loading on HZSM-5) had been characterized to determine their performance of catalyst. In this
research, only 15wt% of nickel loading was studied on the effect of catalyst weight and glycerol flow rate in order
to achieve a higher percentage of hydrogen production. In this case, 15wt% had been selected due to the proven
research done by Buhari [8] and reported that 15wt% Ni-ZSM-5 has shown the best performance on hydrogen
Malaysian Journal of Analytical Sciences, Vol 19 No 5 (2015): 1043 - 1055
1049
composition in product which 58.37%. Other study by Yun [15] stated that 5% Cu loaded on ZSM-5 was the only
catalyst that could not obtained any of hydrogen yield. The addition of nickel into Cu/HZSM-5 catalyst had
increased the hydrogen yield from 1.35 to 2.46 of mol H2/mol C3H8O3 (5wt% of Cu and 10wt% of Ni loaded on
HZSM-5 catalyst) which was the highest hydrogen yield compared to 5wt% Cu, 5wt% Cu 0.5wt% Ni, 5wt% Cu
1.0wt% Ni, 5wt% Cu 5wt% Ni, 5wt% Ni, 5wt% Ni 0.5wt% Cu, 5wt% Ni 1.0wt% Cu and 5wt% Ni 5wt%. The
investigation of different Ni content indicates that the Ni/CeO2 /ZSM-5 catalyst containing 2wt.% Ni showed poor
catalytic activity in relation to the pyrolysis–gasification of polypropylene according to the theoretical potential H2
production (7.2wt.%). Increasing the Ni loading to 5 or 10wt% in the Ni/CeO2 /ZSM-5 ((2-10)-5-500) catalyst, high
potential hydrogen production was obtained [16]
Figure 4. SEM pattern for (a) zeolite, (b) 0.5%Ni, 99.5%HZSM5 (c) 1.0%Ni, 99%HZSM5, (d) 5%Ni,
95%HZSM5, (e) 10%Ni, 90%HZSM5, (f) 15%Ni, 85%HZSM5
Response Surface Methodology Study
By using the response surface methodology (RSM) in investigating the performance of (Ni/ZSM-5) catalyst, the
central composite design (CCD) was used to predict the condition of optimum process for hydrogen yield and to
study the interaction of process variables. There were two independent variables which were catalyst weight and
glycerol flow rate. Apart from that, RSM provides a design which gave a minimum number of experimental runs by
using Statsoft Statistica Release 7.0 software. The experimental value and predicted response of hydrogen yield and
glycerol conversion from statistical model for 10 runs were presented in Table 3 and Table 4 respectively.
Fazureen et al: HYDROGEN GAS PRODUCTION FROM GLYCEROL VIA STEAM REFORMING USING
NICKEL LOADED ZEOLITE CATALYST
1050
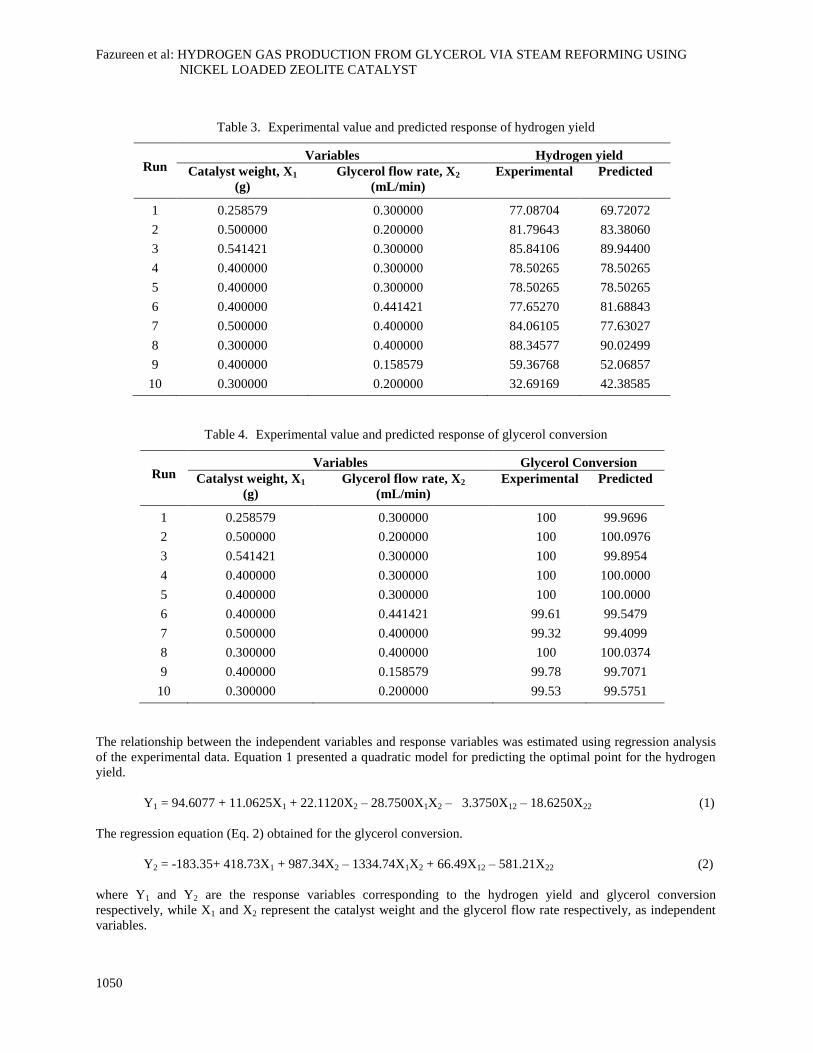
Table 3. Experimental value and predicted response of hydrogen yield
Run Variables Hydrogen yield
Catalyst weight, X1
(g)
Glycerol flow rate, X2
(mL/min)
Experimental Predicted
1 0.258579 0.300000 77.08704 69.72072
2 0.500000 0.200000 81.79643 83.38060
3 0.541421 0.300000 85.84106 89.94400
4 0.400000 0.300000 78.50265 78.50265
5 0.400000 0.300000 78.50265 78.50265
6 0.400000 0.441421 77.65270 81.68843
7 0.500000 0.400000 84.06105 77.63027
8 0.300000 0.400000 88.34577 90.02499
9 0.400000 0.158579 59.36768 52.06857
10 0.300000 0.200000 32.69169 42.38585
Table 4. Experimental value and predicted response of glycerol conversion
Run Variables Glycerol Conversion
Catalyst weight, X1
(g)
Glycerol flow rate, X2
(mL/min)
Experimental Predicted
1 0.258579 0.300000 100 99.9696
2 0.500000 0.200000 100 100.0976
3 0.541421 0.300000 100 99.8954
4 0.400000 0.300000 100 100.0000
5 0.400000 0.300000 100 100.0000
6 0.400000 0.441421 99.61 99.5479
7 0.500000 0.400000 99.32 99.4099
8 0.300000 0.400000 100 100.0374
9 0.400000 0.158579 99.78 99.7071
10 0.300000 0.200000 99.53 99.5751
The relationship between the independent variables and response variables was estimated using regression analysis
of the experimental data. Equation 1 presented a quadratic model for predicting the optimal point for the hydrogen
yield.
Y1 = 94.6077 + 11.0625X1 + 22.1120X2 – 28.7500X1X2 – 3.3750X12 – 18.6250X22 (1)
The regression equation (Eq. 2) obtained for the glycerol conversion.
Y2 = -183.35+ 418.73X1 + 987.34X2 – 1334.74X1X2 + 66.49X12 – 581.21X22 (2)
where Y1 and Y2 are the response variables corresponding to the hydrogen yield and glycerol conversion
respectively, while X1 and X2 represent the catalyst weight and the glycerol flow rate respectively, as independent
variables.
Malaysian Journal of Analytical Sciences, Vol 19 No 5 (2015): 1043 - 1055
1051
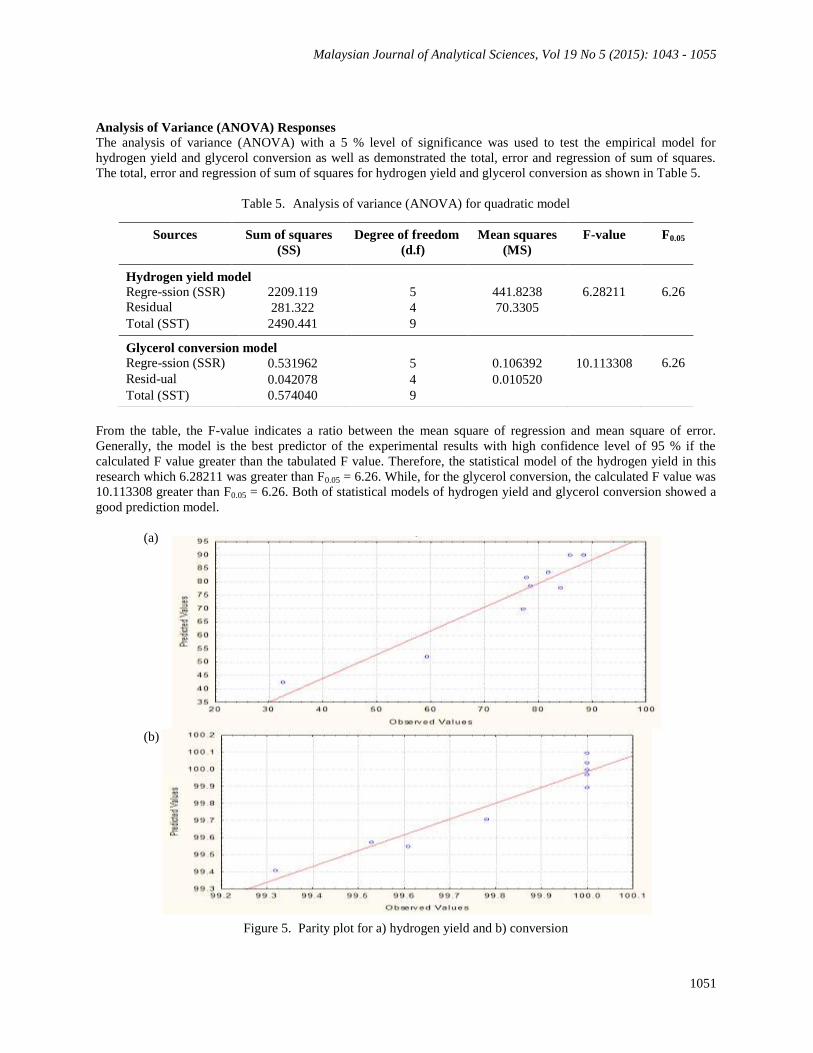
Analysis of Variance (ANOVA) Responses
The analysis of variance (ANOVA) with a 5 % level of significance was used to test the empirical model for
hydrogen yield and glycerol conversion as well as demonstrated the total, error and regression of sum of squares.
The total, error and regression of sum of squares for hydrogen yield and glycerol conversion as shown in Table 5.
Table 5. Analysis of variance (ANOVA) for quadratic model
From the table, the F-value indicates a ratio between the mean square of regression and mean square of error.
Generally, the model is the best predictor of the experimental results with high confidence level of 95 % if the
calculated F value greater than the tabulated F value. Therefore, the statistical model of the hydrogen yield in this
research which 6.28211 was greater than F0.05 = 6.26. While, for the glycerol conversion, the calculated F value was
10.113308 greater than F0.05 = 6.26. Both of statistical models of hydrogen yield and glycerol conversion showed a
good prediction model.
(a)
(b)
Figure 5. Parity plot for a) hydrogen yield and b) conversion
Sources Sum of squares
(SS)
Degree of freedom
(d.f)
Mean squares
(MS)
F-value F0.05
Hydrogen yield model
Regre-ssion (SSR) 2209.119 5 441.8238 6.28211 6.26
Residual 281.322 4 70.3305
Total (SST) 2490.441 9
Glycerol conversion model
Regre-ssion (SSR) 0.531962 5 0.106392 10.113308 6.26
Resid-ual 0.042078 4 0.010520
Total (SST) 0.574040 9
Fazureen et al: HYDROGEN GAS PRODUCTION FROM GLYCEROL VIA STEAM REFORMING USING
NICKEL LOADED ZEOLITE CATALYST
1052
Besides, the comparison between the observed value and predicted value of hydrogen yield and glycerol conversion
were shown in the Figure 5. The result indicates that the coefficient of determination (R2) value for hydrogen yield
is 0.88704 means 88.704 % of the variation of data can be explained by the model. Meanwhile, the R2 value of the
glycerol conversion is 0.92670 which 92.67 % indicating of the variation of data can be accounted to the model. The
empirical model should be at least 0.75 to adequately explain most of the variability in the assay reading [17].
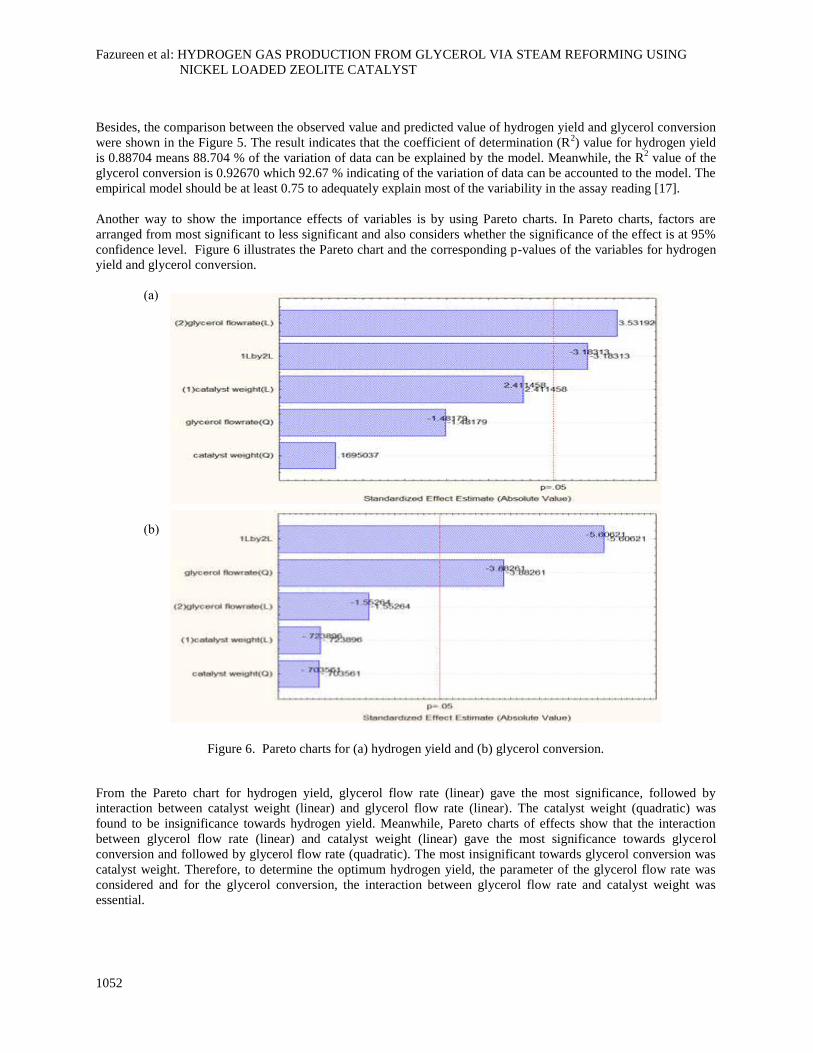
Another way to show the importance effects of variables is by using Pareto charts. In Pareto charts, factors are
arranged from most significant to less significant and also considers whether the significance of the effect is at 95%
confidence level. Figure 6 illustrates the Pareto chart and the corresponding p-values of the variables for hydrogen
yield and glycerol conversion.
(a)
(b)
Figure 6. Pareto charts for (a) hydrogen yield and (b) glycerol conversion.
From the Pareto chart for hydrogen yield, glycerol flow rate (linear) gave the most significance, followed by
interaction between catalyst weight (linear) and glycerol flow rate (linear). The catalyst weight (quadratic) was
found to be insignificance towards hydrogen yield. Meanwhile, Pareto charts of effects show that the interaction
between glycerol flow rate (linear) and catalyst weight (linear) gave the most significance towards glycerol
conversion and followed by glycerol flow rate (quadratic). The most insignificant towards glycerol conversion was
catalyst weight. Therefore, to determine the optimum hydrogen yield, the parameter of the glycerol flow rate was
considered and for the glycerol conversion, the interaction between glycerol flow rate and catalyst weight was
essential.
Malaysian Journal of Analytical Sciences, Vol 19 No 5 (2015): 1043 - 1055
1053
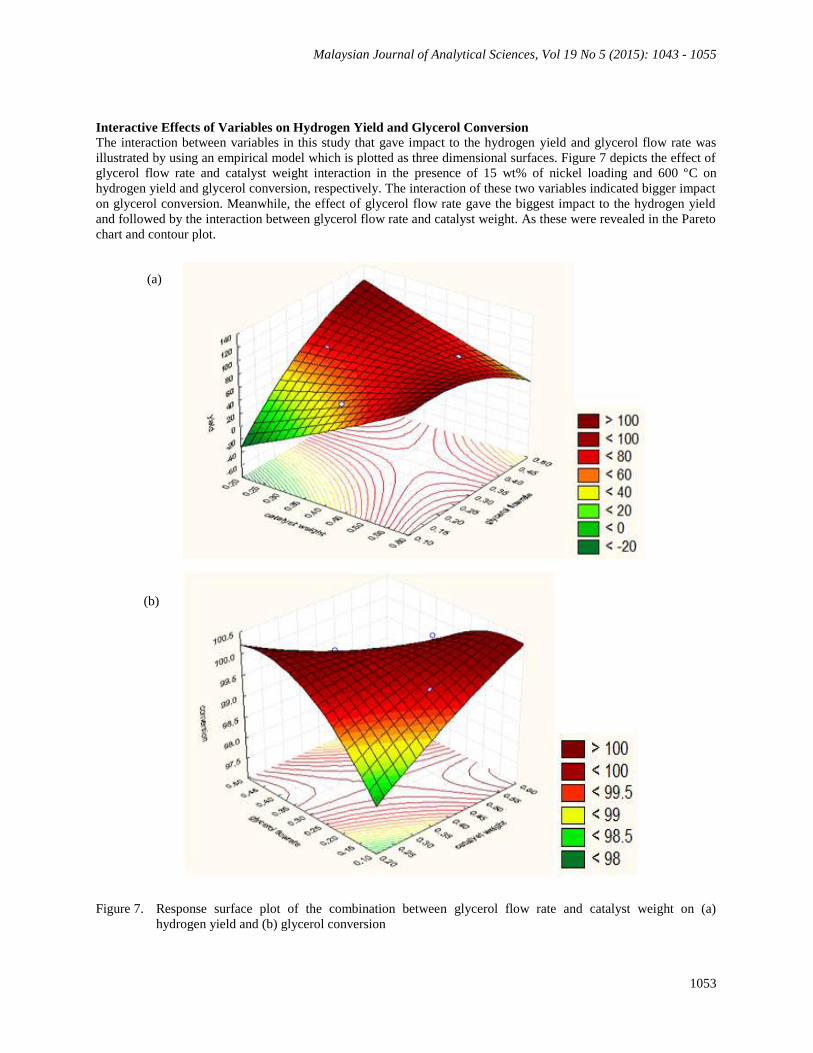
Interactive Effects of Variables on Hydrogen Yield and Glycerol Conversion
The interaction between variables in this study that gave impact to the hydrogen yield and glycerol flow rate was
illustrated by using an empirical model which is plotted as three dimensional surfaces. Figure 7 depicts the effect of
glycerol flow rate and catalyst weight interaction in the presence of 15 wt% of nickel loading and 600 ºC on
hydrogen yield and glycerol conversion, respectively. The interaction of these two variables indicated bigger impact
on glycerol conversion. Meanwhile, the effect of glycerol flow rate gave the biggest impact to the hydrogen yield
and followed by the interaction between glycerol flow rate and catalyst weight. As these were revealed in the Pareto
chart and contour plot.
(a)
(b)
Figure 7. Response surface plot of the combination between glycerol flow rate and catalyst weight on (a)
hydrogen yield and (b) glycerol conversion
Fazureen et al: HYDROGEN GAS PRODUCTION FROM GLYCEROL VIA STEAM REFORMING USING
NICKEL LOADED ZEOLITE CATALYST
1054
Optimization of Hydrogen Yield
In this study, the optimum condition for hydrogen yield was obtained from the response surface methodology
(RSM) by using Statsoft Statistica Release 7.0 Software. The response surface analysis indicated that the predicted
optimum hydrogen yield of glycerol steam reforming.
Table 6. Optimum condition for predicted analysis of hydrogen yield
Factor Observed minimum Critical values Observed maximum
Glycerol flow rate (mL/min) 0.158579 0.356484 0.441421
Catalyst weight (g) 0.258579 0.429267 0.541421
Hence, further experiment was performed to validate the optimization result obtained by the responses surface
analysis at glycerol flow rate = 0.356484 mL/min and catalyst weight = 0.429267 as tabulated in Table 6.
Table 7. Comparison of optimum condition obtained from RSM between
predicted and experimental of hydrogen yield
Responses Observed value Predicted value Error (%)
Hydrogen yield (%) 78.10004 82.50653 5.07
Based on Table 7, the observed and predicted values for hydrogen yields are reported as 78.10004% and
82.50653%, respectively, where only 5.07% errors occurred. 5.07 % error occurs was considered small as the
observed values are within 5 % level of significance. Hence, the result indicated that the statistical model is valid to
use due to the small percentages of error. Therefore, the optimum condition for hydrogen yield were at glycerol
flow rate = 0.356484 mL/min and catalyst weight = 0.429267 g.
Conclusion
The study showed that the optimum conditions to produce a maximum hydrogen yield (78.10004 %) of 15wt% of
Ni/HZSM-5 in glycerol steam reforming were at glycerol flow rate of 0.356484 mL/min and catalyst weight of
0.429267 g. In addition, the interaction between glycerol flow rate and catalyst weight gave the largest effect on
hydrogen yield and glycerol conversion.
Acknowledgement
The author would like to acknowledge to the East Coast Environmental Research Institute, Universiti Sultan Zainal
Abidin and Faculty of Chemical Engineering, Universiti Teknologi Malaysia for the facilities.
References
1. Gerpen., J. V. (2005). Biodiesel Processing and Production. Fuel Processing Technology 86: 1097– 1107.
2. Shawn P. and Conley, B. T. (2006). What is Biodiesel? BioEnergy, ID337.
3. Xiaohu Fan, Burton, R. and Zhou, Y. (2010). Glycerol (Byproduct of Biodiesel Production) as a Source of
Fuels and Chemicals-Mini Review. The Open Fuels and Energy Science Journal 3: 17-22.
4. Adhikari, S., Fernando, S. D. and Haryanto, A. (2009). Hydrogen Production from Glycerol: An update. Energy
Conversion and Management 50: 2600-2604.
5. Adhikari S, Fernando S, To, F., Bricka R. M, Steele P. H. and Haryanto A. (2008). Conversion of Glycerol to
Hydrogen via a Steam Reforming Process over Nickel Catalysts. Energy Fuel 22(2): 1220–1226.
Malaysian Journal of Analytical Sciences, Vol 19 No 5 (2015): 1043 - 1055
1055
6. Iriondo, A., Barrio, V. L., Cambra, J. F., Arias, P. L., Guemez, M. B., Navarro, R. M., Sanchez-Sanchez, M. C.
and Fierro, J. L. G. (2009). Influence of La2O3 Modified Support and Ni and Pt Active Phases on Glycerol
Steam Reforming to Produce Hydrogen. Catalysis Communications 10: 1275-1278.
7. Nichele, V., Signoretto, M., Menegazzo, F., Gallo, A., Santo, V. D., Cruciani, G. and Cerrato, G. (2012).
Glycerol Steam Reforming for Hydrogen Production: Design of Ni Supported Catalysts. Applied Catalysis B:
Environment 111: 225-232.
8. Buhari, J. (2013). Hydrogen Production from Glycerol using Nickel Loaded Zeolite Catalyst. Degree Thesis.
Universiti Teknologi Malaysia.
9. Kusworo, T. D., Songip, A. R. and Amin, N. A. S. (2010). Optimization of Partial Oxidation of Methane for
Hydrogen Production on NiO-CoO/MgO Catalyst using Design of Experiment. IJET-IJENS. 10(1): 1-8.
10. Jong-San Chang, S.-E. P., Kyu-Wan Lee, and Myoung Jae Choi (1994). Catalytic Reforming of Methane with
Carbon Dioxide over Pentasil Zeolite-Supported Nickel Catalyst. Studies in Surface Science and Catalysis, 84:
1587-1594 .
11. Apanee, L. and Kaengsilalai, A. (2008). Activity of Different Zeolite-Supported Ni Catalyst for Methane
Reforming with Carbon Dixode. Chemical Engineering Journal 144: 96-102.
12. Na Shi, Q. L., Ting Jiang, T. W., Long, M., Qi Z. and Zhang, X., H. (2012). Hydrodeoxygenation of Vegetable
Oils to Liquid Alkane Fuels over Ni/HZSM-5 Catalysts: Methyl Hexadecanoate as the Model Compound.
Catalysis Communications 20: 80–84.
13. Nezamzadeh-Ejhieh, A. and Shams-Ghahfarokhi, Z. (2013). Photodegradation of Methyl Green by Nickel-
Dimethylglyoxime/ZSM-5 Zeolite as a Heterogeneous Catalyst. Journal of Chemistry: 1-11.
14. Anne, M. G. P., Marcelo, J. B. S., Dulce, M. A. M. and Antonio. S. A. (2006). Cobalt and Nickel Supported on
HY Zeolite: Synthesis, Characterization and Catalytic Properties. Materials Research Bulletin 41: 1105–1111.
15. Yun, H. B. A. H. (2013). Hydrogen Production from Glycerol Using Copper and Nickel Loaded Zeolite Based
Catalyst. Master Thesis. Universiti Teknologi Malaysia.
16. Williams, C. W. P. T. (2009). Ni/CeO2/ZSM-5 Catalysts for the Production of Hydrogen from the Pyrolysis–
Gasification of Polypropylene. International Journal of Hydrogen Energy 15: 6242-6252.
17. Haaland, P. D. (1989). Experimental Design in Biotechnology. New York: Marcel Dekker Inc.
18. Slinn, M., Kendall, K., Mallon, C. and Andrews, J. (2008). Steam Reforming of Biodiesel By-Product to make
Renewable Hydrogen. Bioresource Technology 99: 5851-5858.