global economic limbo by ms hew sue ling
TRANSCRIPT
Global Economic Limbo:
The Emerging Markets
Slowdown and The Malaysian
Bond Market
©Copyright BOND PRICING AGENCY MALAYSIA SDN.BHD - All rights reserved.
Presented by Hew Sue Ling
Head of Pricing, BPAM
©Copyright BOND PRICING AGENCY MALAYSIA SDN.BHD (FORMERLY BONDWEB MALAYSIA SDN BHD). - All rights reserved. ©Copyright BOND PRICING AGENCY MALAYSIA SDN.BHD PAGE 2
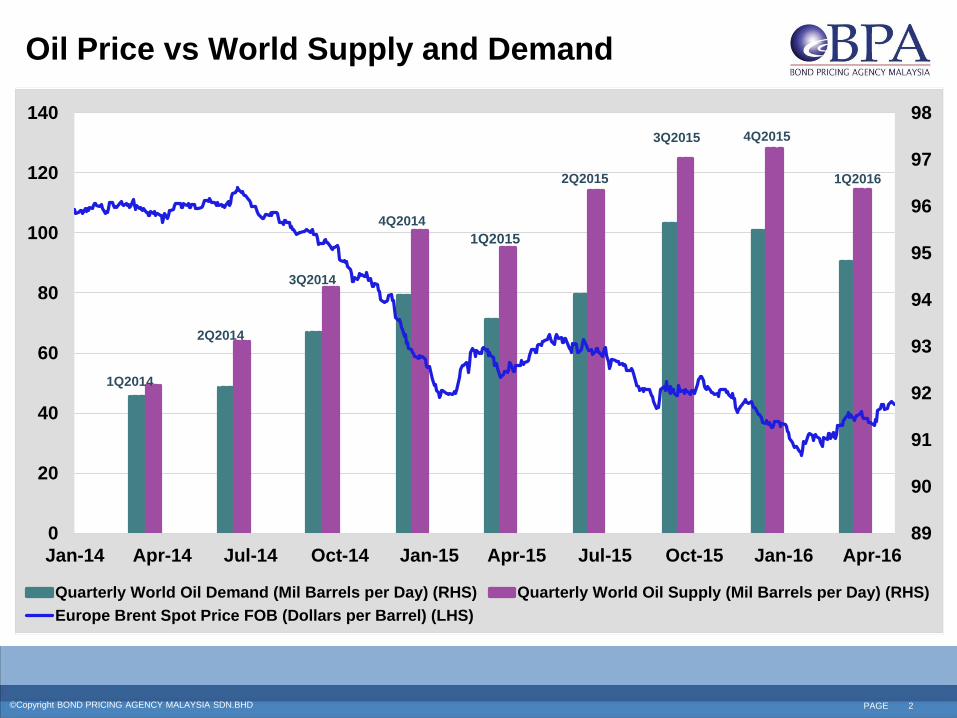
Oil Price vs World Supply and Demand
89
90
91
92
93
94
95
96
97
98
0
20
40
60
80
100
120
140
Jan-14 Apr-14 Jul-14 Oct-14 Jan-15 Apr-15 Jul-15 Oct-15 Jan-16 Apr-16
Quarterly World Oil Demand (Mil Barrels per Day) (RHS) Quarterly World Oil Supply (Mil Barrels per Day) (RHS)
Europe Brent Spot Price FOB (Dollars per Barrel) (LHS)
1Q2014
2Q2014
3Q2014
4Q2014
1Q2015
2Q2015
3Q2015 4Q2015
1Q2016
©Copyright BOND PRICING AGENCY MALAYSIA SDN.BHD (FORMERLY BONDWEB MALAYSIA SDN BHD). - All rights reserved. ©Copyright BOND PRICING AGENCY MALAYSIA SDN.BHD PAGE 3
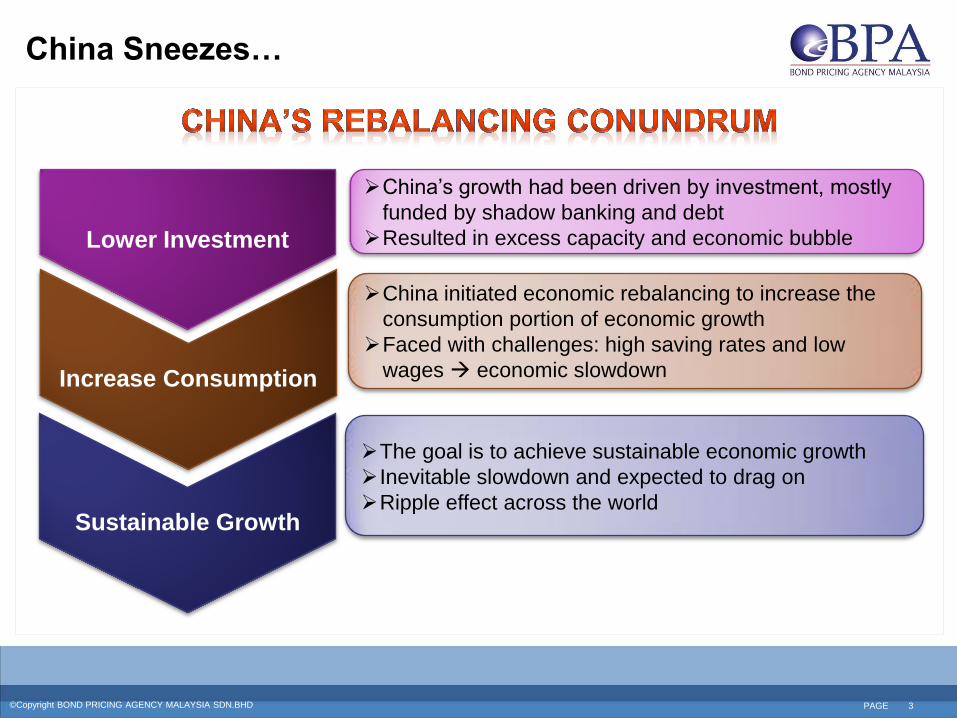
The goal is to achieve sustainable economic growth
Inevitable slowdown and expected to drag on
Ripple effect across the world
China initiated economic rebalancing to increase the
consumption portion of economic growth
Faced with challenges: high saving rates and low
wages economic slowdown
China’s growth had been driven by investment, mostly
funded by shadow banking and debt
Resulted in excess capacity and economic bubble
China Sneezes…
Lower Investment
Increase Consumption
Sustainable Growth
©Copyright BOND PRICING AGENCY MALAYSIA SDN.BHD (FORMERLY BONDWEB MALAYSIA SDN BHD). - All rights reserved. ©Copyright BOND PRICING AGENCY MALAYSIA SDN.BHD PAGE 4
…Global Economy Catches a Cold
General downtrend in global economic growth
Central banks grappling with deflationary pressures and slowdown
2.9
-1.0
1.3
2.6
-2.0
-2.8
7.5
7.0
2.7
0.7
1.6
2.4
-3.0
-4.5
7.6
7.0
2.1
1.7
1.6
2.2
-4.5
-3.7
7.7
6.9
2.0
0.7
1.6
2.1
-5.9
-3.8
7.3
6.8
US JAPAN EUROZONE UK BRAZIL RUSSIA INDIA CHINA
GD
P G
RO
WT
H %
1Q2015 2Q2015 3Q2015 4Q2015
ADVANCED ECONOMIES EMERGING MARKETS
B R A Z I L R U S S I A
©Copyright BOND PRICING AGENCY MALAYSIA SDN.BHD (FORMERLY BONDWEB MALAYSIA SDN BHD). - All rights reserved. ©Copyright BOND PRICING AGENCY MALAYSIA SDN.BHD PAGE 5
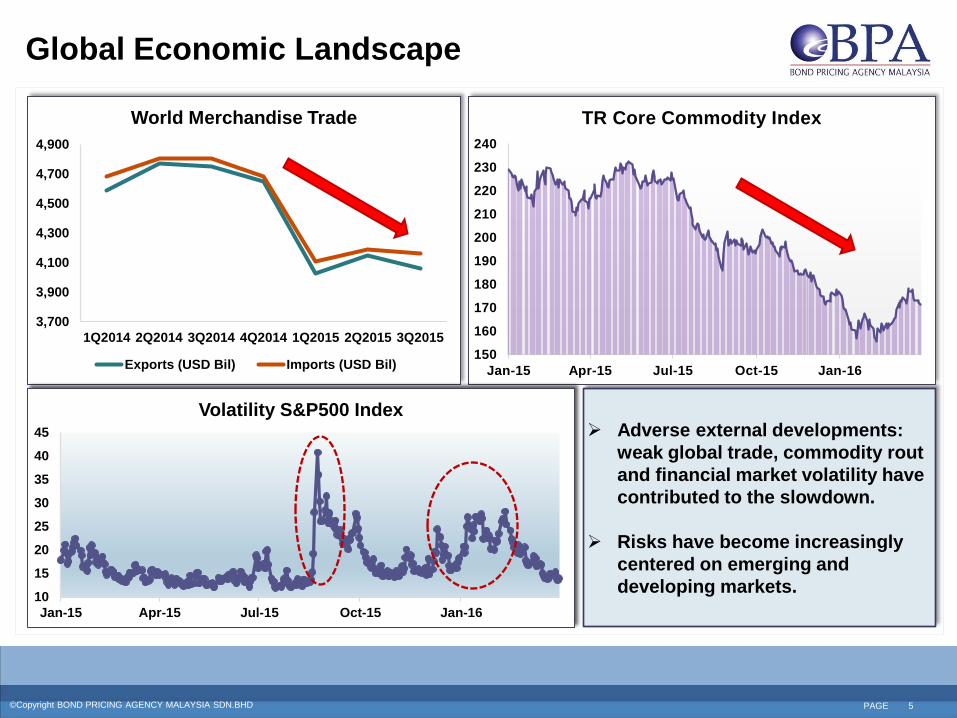
Global Economic Landscape
3,700
3,900
4,100
4,300
4,500
4,700
4,900
1Q2014 2Q2014 3Q2014 4Q2014 1Q2015 2Q2015 3Q2015
World Merchandise Trade
Exports (USD Bil) Imports (USD Bil)
Adverse external developments:
weak global trade, commodity rout
and financial market volatility have
contributed to the slowdown.
Risks have become increasingly
centered on emerging and
developing markets.
150
160
170
180
190
200
210
220
230
240
Jan-15 Apr-15 Jul-15 Oct-15 Jan-16
TR Core Commodity Index
10
15
20
25
30
35
40
45
Jan-15 Apr-15 Jul-15 Oct-15 Jan-16
Volatility S&P500 Index
©Copyright BOND PRICING AGENCY MALAYSIA SDN.BHD (FORMERLY BONDWEB MALAYSIA SDN BHD). - All rights reserved. ©Copyright BOND PRICING AGENCY MALAYSIA SDN.BHD PAGE 6
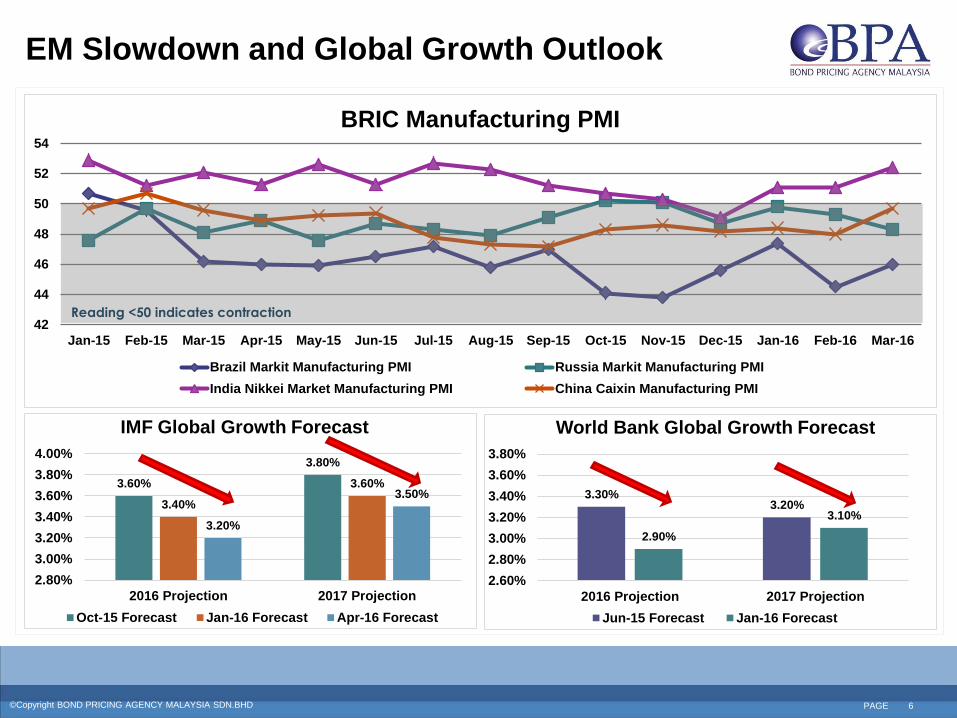
EM Slowdown and Global Growth Outlook
42
44
46
48
50
52
54
Jan-15 Feb-15 Mar-15 Apr-15 May-15 Jun-15 Jul-15 Aug-15 Sep-15 Oct-15 Nov-15 Dec-15 Jan-16 Feb-16 Mar-16
BRIC Manufacturing PMI
Brazil Markit Manufacturing PMI Russia Markit Manufacturing PMI
India Nikkei Market Manufacturing PMI China Caixin Manufacturing PMI
Reading <50 indicates contraction
3.30% 3.20%
2.90%
3.10%
2.60%
2.80%
3.00%
3.20%
3.40%
3.60%
3.80%
2016 Projection 2017 Projection
World Bank Global Growth Forecast
Jun-15 Forecast Jan-16 Forecast
3.60%
3.80%
3.40%
3.60%
3.20%
3.50%
2.80%
3.00%
3.20%
3.40%
3.60%
3.80%
4.00%
2016 Projection 2017 Projection
IMF Global Growth Forecast
Oct-15 Forecast Jan-16 Forecast Apr-16 Forecast
©Copyright BOND PRICING AGENCY MALAYSIA SDN.BHD (FORMERLY BONDWEB MALAYSIA SDN BHD). - All rights reserved. ©Copyright BOND PRICING AGENCY MALAYSIA SDN.BHD PAGE 7
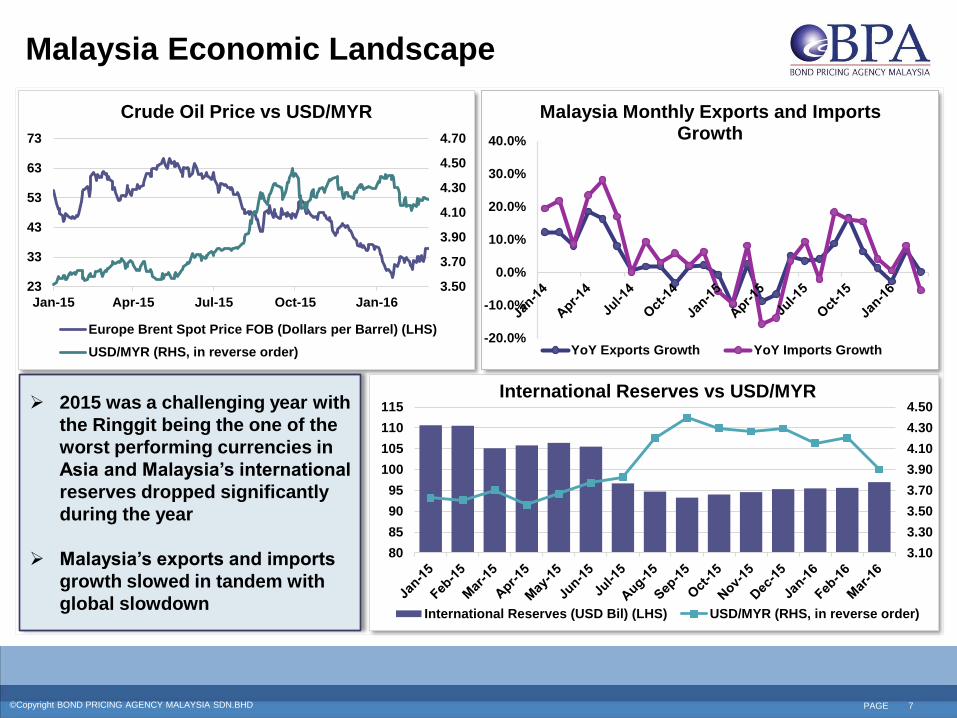
Malaysia Economic Landscape
2015 was a challenging year with
the Ringgit being the one of the
worst performing currencies in
Asia and Malaysia’s international
reserves dropped significantly
during the year
Malaysia’s exports and imports
growth slowed in tandem with
global slowdown
3.50
3.70
3.90
4.10
4.30
4.50
4.70
23
33
43
53
63
73
Jan-15 Apr-15 Jul-15 Oct-15 Jan-16
Crude Oil Price vs USD/MYR
Europe Brent Spot Price FOB (Dollars per Barrel) (LHS)
USD/MYR (RHS, in reverse order)
3.10
3.30
3.50
3.70
3.90
4.10
4.30
4.50
80
85
90
95
100
105
110
115International Reserves vs USD/MYR
International Reserves (USD Bil) (LHS) USD/MYR (RHS, in reverse order)
-20.0%
-10.0%
0.0%
10.0%
20.0%
30.0%
40.0%
Malaysia Monthly Exports and Imports Growth
YoY Exports Growth YoY Imports Growth
©Copyright BOND PRICING AGENCY MALAYSIA SDN.BHD (FORMERLY BONDWEB MALAYSIA SDN BHD). - All rights reserved. ©Copyright BOND PRICING AGENCY MALAYSIA SDN.BHD PAGE 8
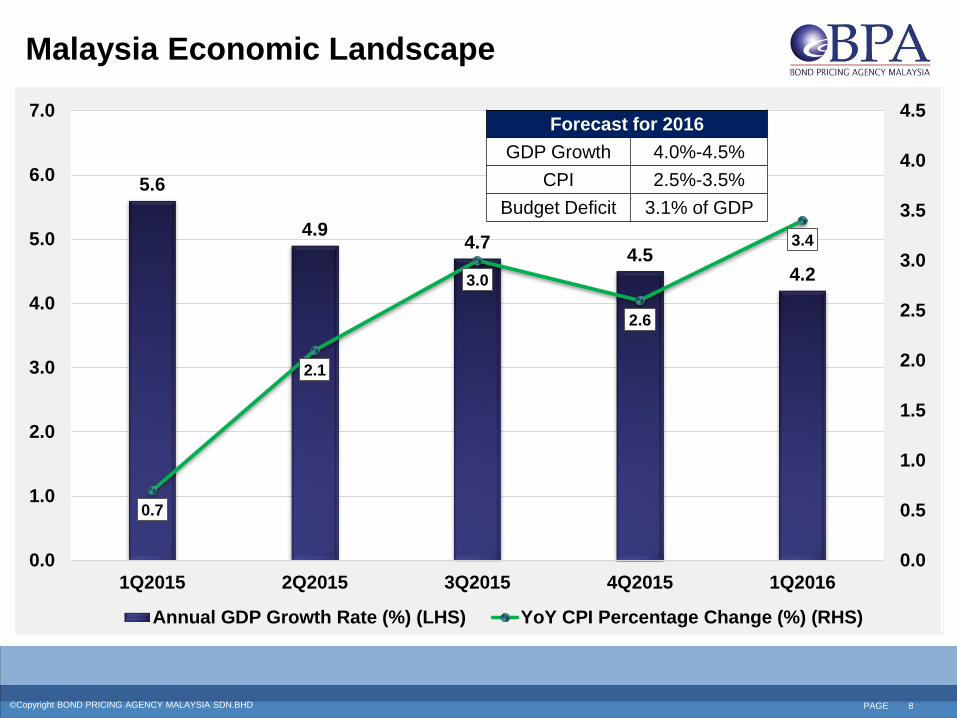
Malaysia Economic Landscape
5.6
4.9 4.7
4.5 4.2
0.7
2.1
3.0
2.6
3.4
0.0
0.5
1.0
1.5
2.0
2.5
3.0
3.5
4.0
4.5
0.0
1.0
2.0
3.0
4.0
5.0
6.0
7.0
1Q2015 2Q2015 3Q2015 4Q2015 1Q2016
Annual GDP Growth Rate (%) (LHS) YoY CPI Percentage Change (%) (RHS)
Forecast for 2016
GDP Growth 4.0%-4.5%
CPI 2.5%-3.5%
Budget Deficit 3.1% of GDP
©Copyright BOND PRICING AGENCY MALAYSIA SDN.BHD (FORMERLY BONDWEB MALAYSIA SDN BHD). - All rights reserved. ©Copyright BOND PRICING AGENCY MALAYSIA SDN.BHD PAGE 9
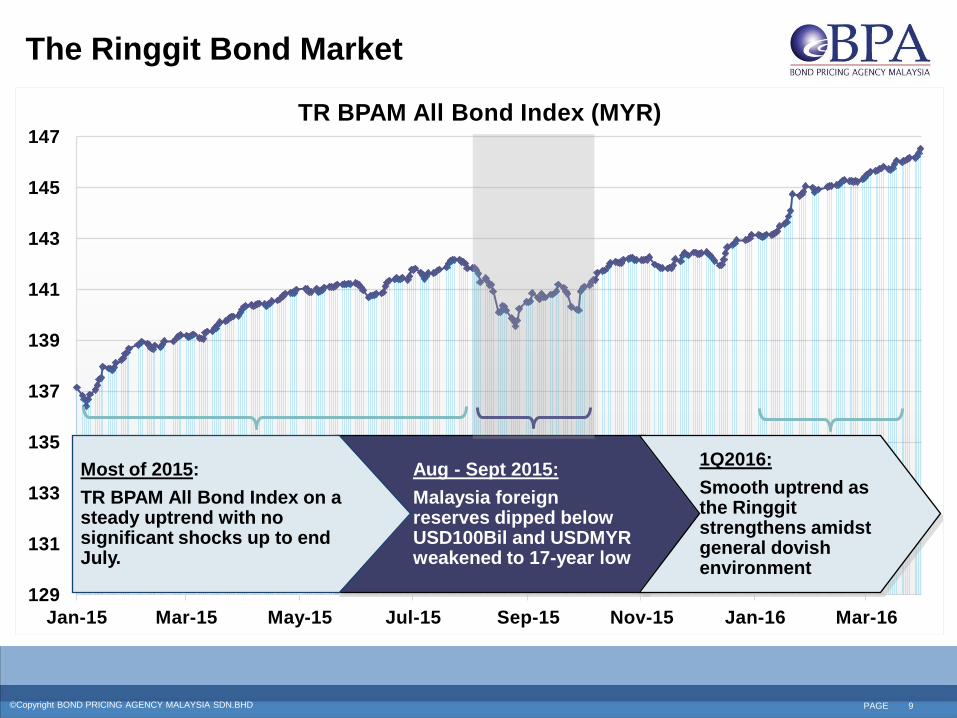
129
131
133
135
137
139
141
143
145
147
Jan-15 Mar-15 May-15 Jul-15 Sep-15 Nov-15 Jan-16 Mar-16
TR BPAM All Bond Index (MYR)
Aug - Sept 2015:
Malaysia foreign reserves dipped below USD100Bil and USDMYR weakened to 17-year low
1Q2016:
Smooth uptrend as the Ringgit strengthens amidst general dovish environment
Most of 2015:
TR BPAM All Bond Index on a steady uptrend with no significant shocks up to end July.
The Ringgit Bond Market
©Copyright BOND PRICING AGENCY MALAYSIA SDN.BHD (FORMERLY BONDWEB MALAYSIA SDN BHD). - All rights reserved. ©Copyright BOND PRICING AGENCY MALAYSIA SDN.BHD PAGE 10
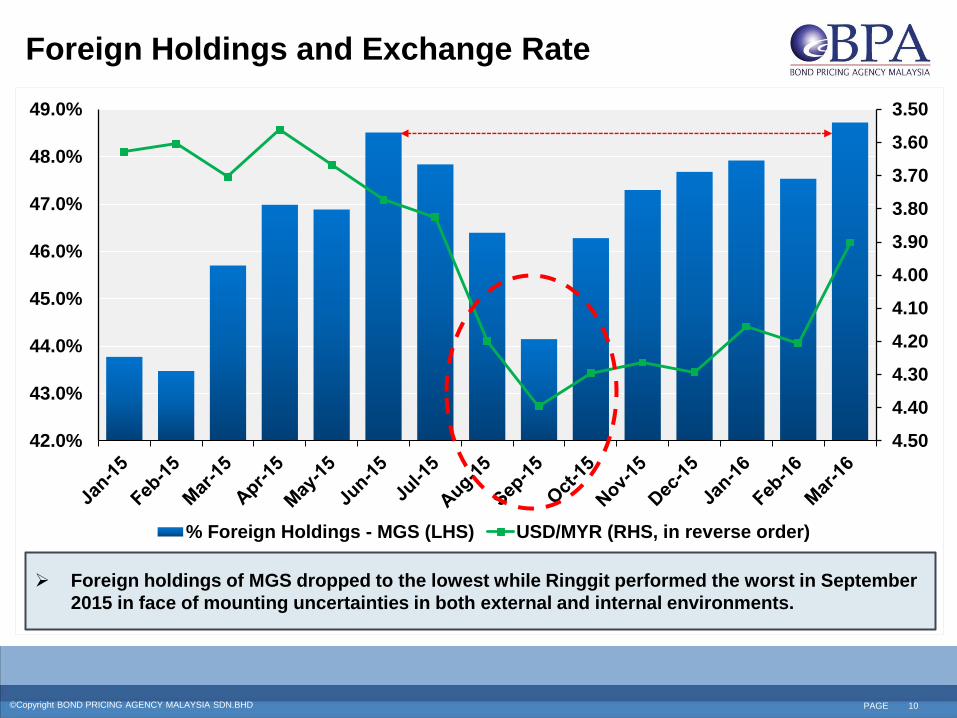
Foreign Holdings and Exchange Rate
Foreign holdings of MGS dropped to the lowest while Ringgit performed the worst in September
2015 in face of mounting uncertainties in both external and internal environments.
3.50
3.60
3.70
3.80
3.90
4.00
4.10
4.20
4.30
4.40
4.5042.0%
43.0%
44.0%
45.0%
46.0%
47.0%
48.0%
49.0%
% Foreign Holdings - MGS (LHS) USD/MYR (RHS, in reverse order)
©Copyright BOND PRICING AGENCY MALAYSIA SDN.BHD (FORMERLY BONDWEB MALAYSIA SDN BHD). - All rights reserved. ©Copyright BOND PRICING AGENCY MALAYSIA SDN.BHD PAGE 11
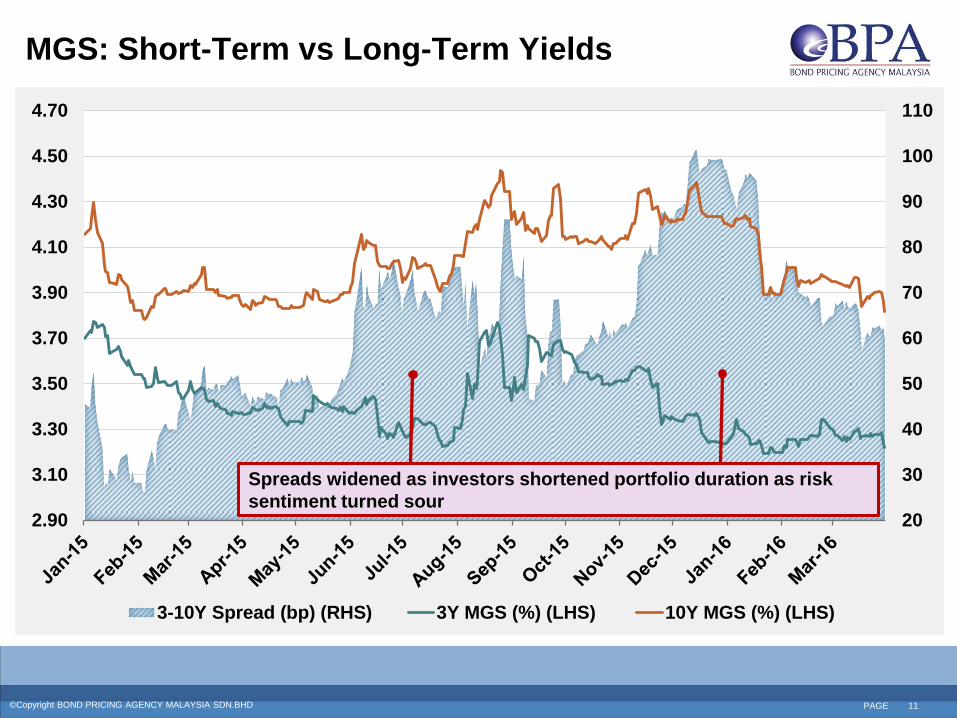
MGS: Short-Term vs Long-Term Yields
20
30
40
50
60
70
80
90
100
110
2.90
3.10
3.30
3.50
3.70
3.90
4.10
4.30
4.50
4.70
3-10Y Spread (bp) (RHS) 3Y MGS (%) (LHS) 10Y MGS (%) (LHS)
Spreads widened as investors shortened portfolio duration as risk
sentiment turned sour
©Copyright BOND PRICING AGENCY MALAYSIA SDN.BHD (FORMERLY BONDWEB MALAYSIA SDN BHD). - All rights reserved. ©Copyright BOND PRICING AGENCY MALAYSIA SDN.BHD PAGE 12
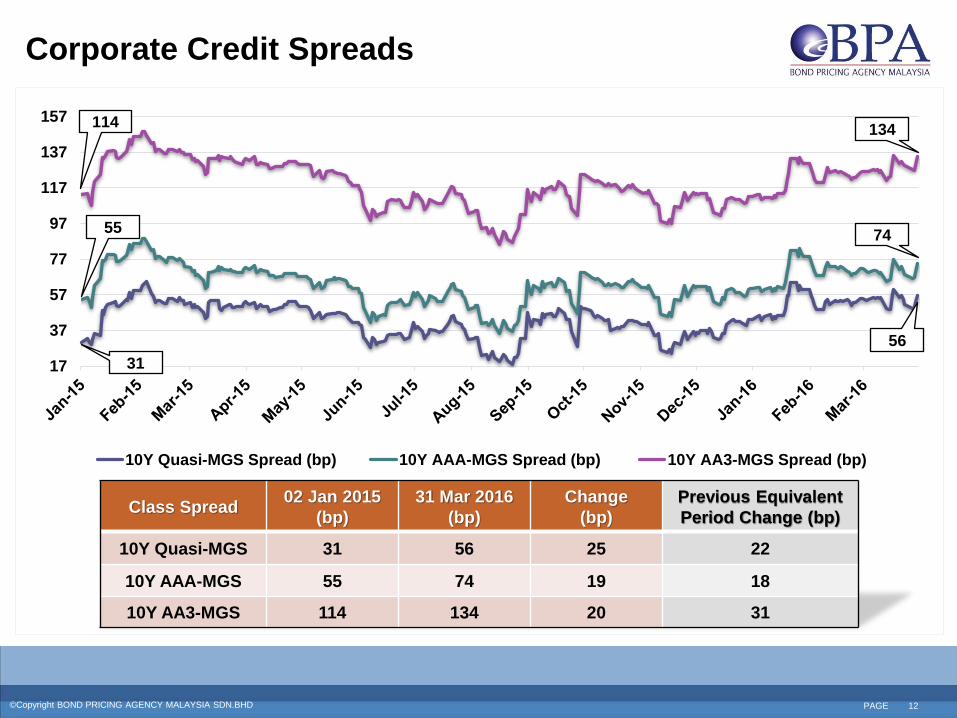
Corporate Credit Spreads
17
37
57
77
97
117
137
157
10Y Quasi-MGS Spread (bp) 10Y AAA-MGS Spread (bp) 10Y AA3-MGS Spread (bp)
114
55
31
134
74
56
Class Spread 02 Jan 2015
(bp)
31 Mar 2016
(bp)
Change
(bp)
Previous Equivalent
Period Change (bp)
10Y Quasi-MGS 31 56 25 22
10Y AAA-MGS 55 74 19 18
10Y AA3-MGS 114 134 20 31
©Copyright BOND PRICING AGENCY MALAYSIA SDN.BHD (FORMERLY BONDWEB MALAYSIA SDN BHD). - All rights reserved. ©Copyright BOND PRICING AGENCY MALAYSIA SDN.BHD PAGE 13
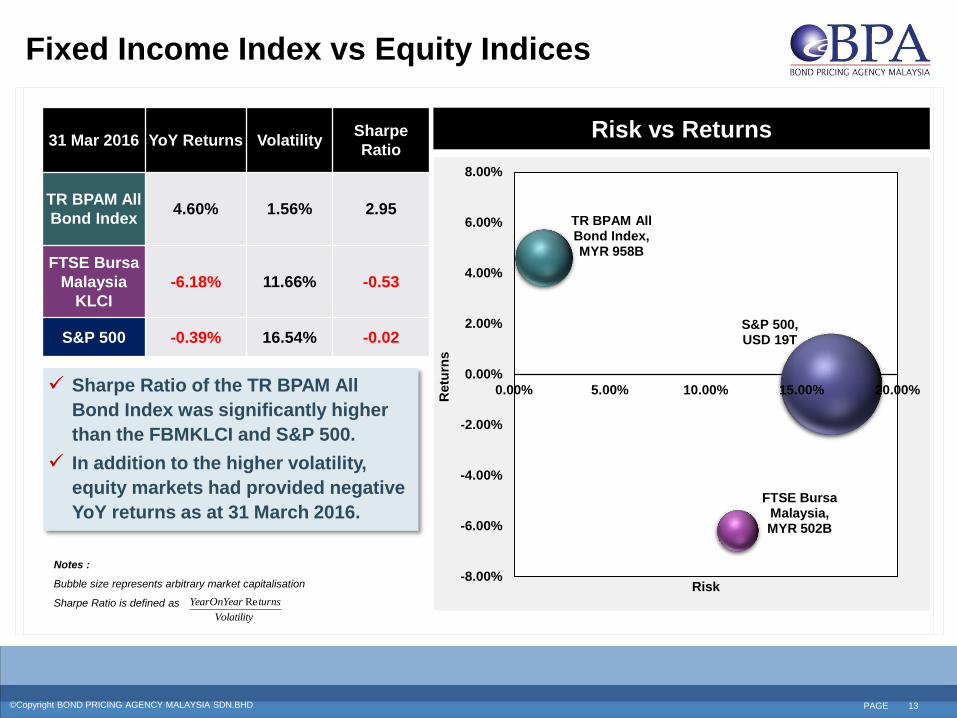
Fixed Income Index vs Equity Indices
Risk vs Returns 31 Mar 2016 YoY Returns Volatility
Sharpe
Ratio
TR BPAM All
Bond Index 4.60% 1.56% 2.95
FTSE Bursa
Malaysia
KLCI
-6.18% 11.66% -0.53
S&P 500 -0.39% 16.54% -0.02
Sharpe Ratio of the TR BPAM All
Bond Index was significantly higher
than the FBMKLCI and S&P 500.
In addition to the higher volatility,
equity markets had provided negative
YoY returns as at 31 March 2016.
Notes :
Bubble size represents arbitrary market capitalisation
Sharpe Ratio is defined as
FTSE Bursa Malaysia, MYR 502B
S&P 500, USD 19T
TR BPAM All Bond Index, MYR 958B
-8.00%
-6.00%
-4.00%
-2.00%
0.00%
2.00%
4.00%
6.00%
8.00%
0.00% 5.00% 10.00% 15.00% 20.00%
Retu
rns
Risk
Volatility
turnsYearOnYear Re
©Copyright BOND PRICING AGENCY MALAYSIA SDN.BHD (FORMERLY BONDWEB MALAYSIA SDN BHD). - All rights reserved. ©Copyright BOND PRICING AGENCY MALAYSIA SDN.BHD PAGE 14
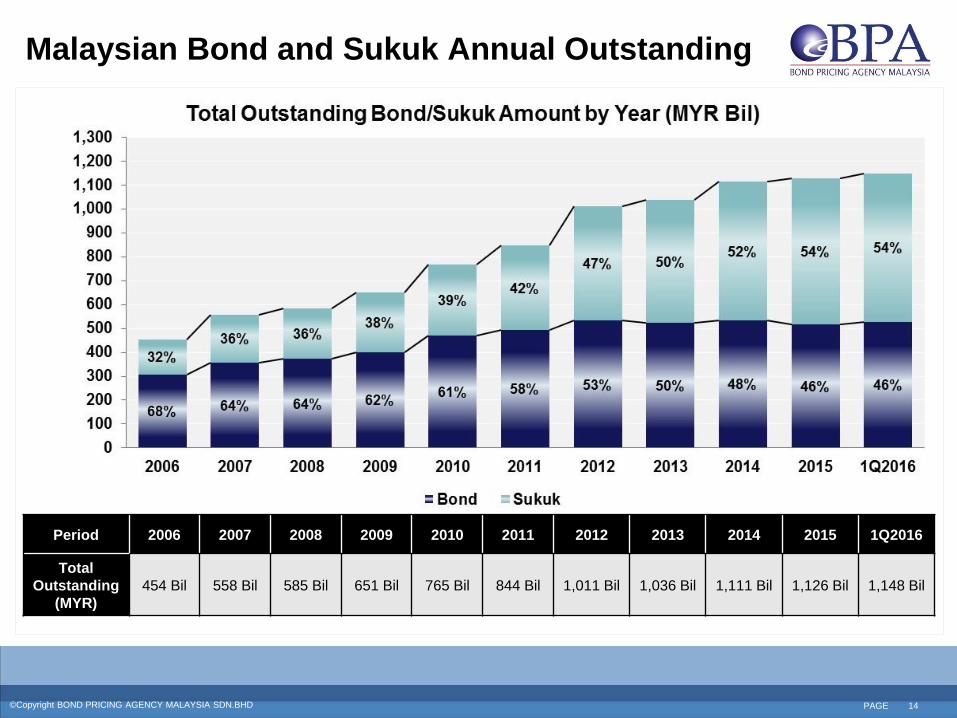
Malaysian Bond and Sukuk Annual Outstanding
Period 2006 2007 2008 2009 2010 2011 2012 2013 2014 2015 1Q2016
Total
Outstanding
(MYR)
454 Bil 558 Bil 585 Bil 651 Bil 765 Bil 844 Bil 1,011 Bil 1,036 Bil 1,111 Bil 1,126 Bil 1,148 Bil
©Copyright BOND PRICING AGENCY MALAYSIA SDN.BHD (FORMERLY BONDWEB MALAYSIA SDN BHD). - All rights reserved. ©Copyright BOND PRICING AGENCY MALAYSIA SDN.BHD PAGE 15
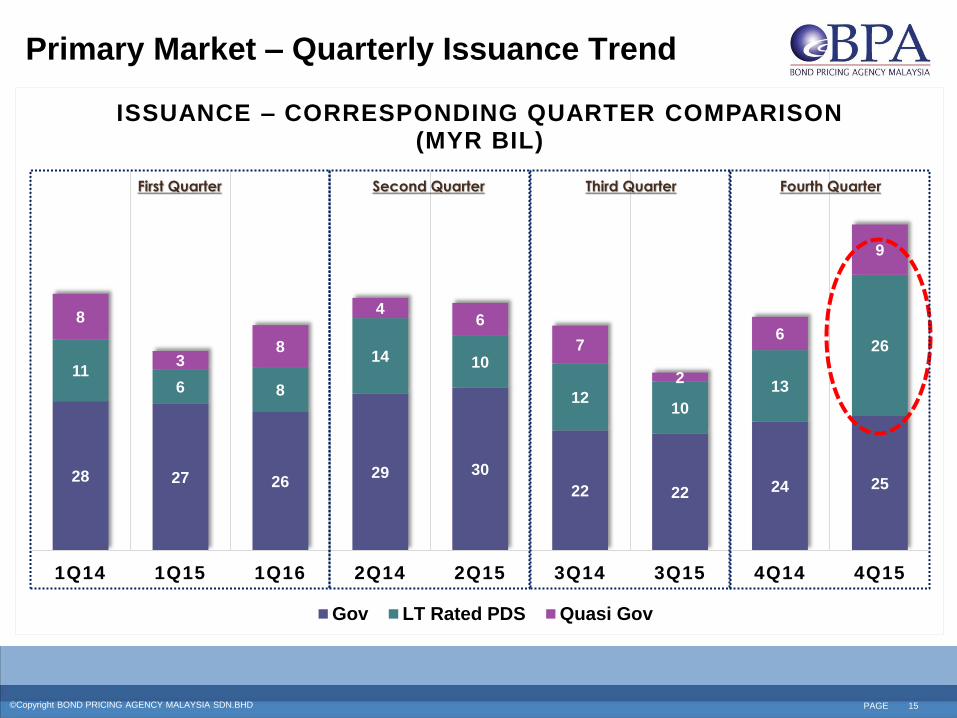
Primary Market – Quarterly Issuance Trend
28 27 26 29 30
22 22 24 25
11 6 8
14 10
12 10
13
26
8
3 8
4 6
7
2
6
9
1Q14 1Q15 1Q16 2Q14 2Q15 3Q14 3Q15 4Q14 4Q15
ISSUANCE – CORRESPONDING QUARTER COMPARISON (MYR BIL)
Gov LT Rated PDS Quasi Gov
First Quarter Second Quarter Third Quarter Fourth Quarter
©Copyright BOND PRICING AGENCY MALAYSIA SDN.BHD (FORMERLY BONDWEB MALAYSIA SDN BHD). - All rights reserved. ©Copyright BOND PRICING AGENCY MALAYSIA SDN.BHD PAGE 16
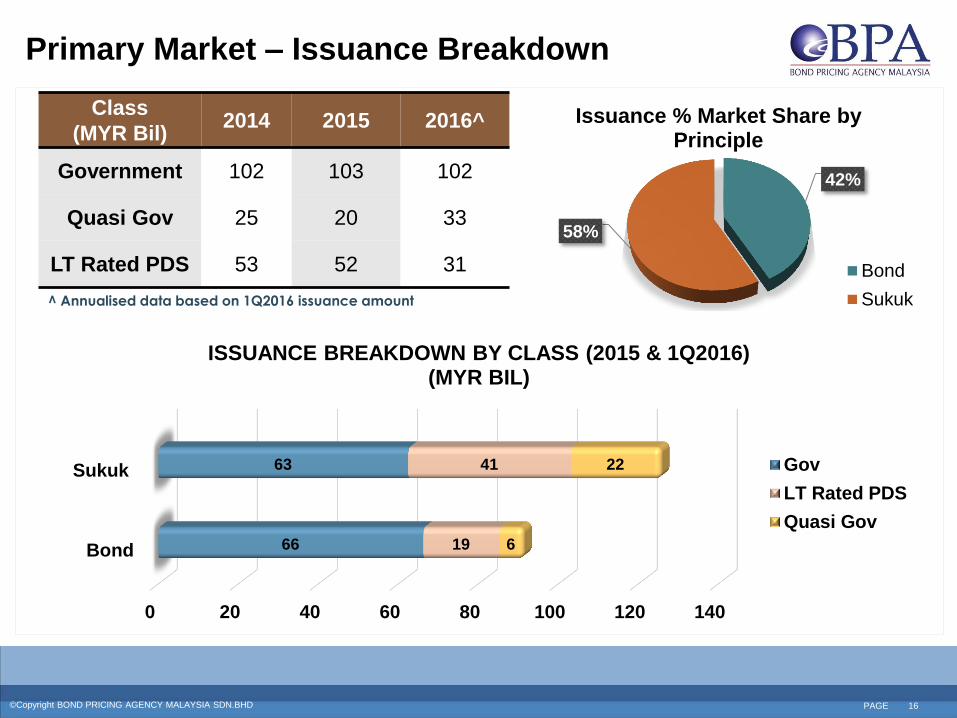
Primary Market – Issuance Breakdown
^ Annualised data based on 1Q2016 issuance amount
42%
58%
Issuance % Market Share by Principle
Bond
Sukuk
Class
(MYR Bil) 2014 2015 2016^
Government 102 103 102
Quasi Gov 25 20 33
LT Rated PDS 53 52 31
0 20 40 60 80 100 120 140
Bond
Sukuk
66
63
19
41
6
22
ISSUANCE BREAKDOWN BY CLASS (2015 & 1Q2016) (MYR BIL)
Gov
LT Rated PDS
Quasi Gov
©Copyright BOND PRICING AGENCY MALAYSIA SDN.BHD (FORMERLY BONDWEB MALAYSIA SDN BHD). - All rights reserved. ©Copyright BOND PRICING AGENCY MALAYSIA SDN.BHD PAGE 17
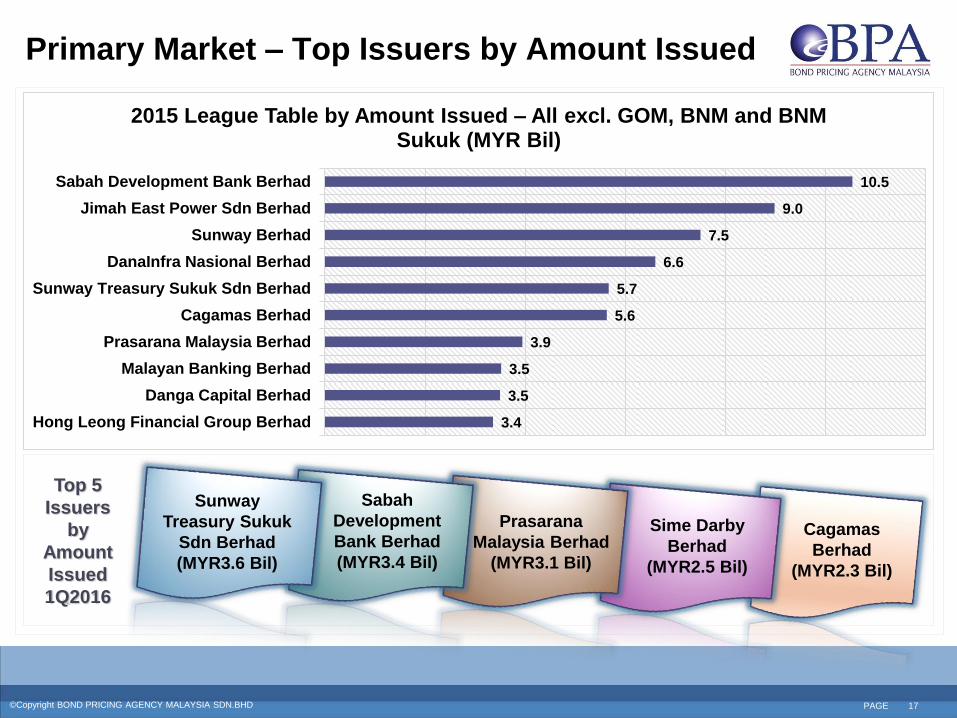
Primary Market – Top Issuers by Amount Issued
Top 5
Issuers
by
Amount
Issued
1Q2016
Sunway
Treasury Sukuk
Sdn Berhad
(MYR3.6 Bil)
Sabah
Development
Bank Berhad
(MYR3.4 Bil)
Prasarana
Malaysia Berhad
(MYR3.1 Bil)
Sime Darby
Berhad
(MYR2.5 Bil)
Cagamas
Berhad
(MYR2.3 Bil)
3.4
3.5
3.5
3.9
5.6
5.7
6.6
7.5
9.0
10.5
Hong Leong Financial Group Berhad
Danga Capital Berhad
Malayan Banking Berhad
Prasarana Malaysia Berhad
Cagamas Berhad
Sunway Treasury Sukuk Sdn Berhad
DanaInfra Nasional Berhad
Sunway Berhad
Jimah East Power Sdn Berhad
Sabah Development Bank Berhad
2015 League Table by Amount Issued – All excl. GOM, BNM and BNM Sukuk (MYR Bil)

©Copyright BOND PRICING AGENCY MALAYSIA SDN.BHD (FORMERLY BONDWEB MALAYSIA SDN BHD). - All rights reserved. ©Copyright BOND PRICING AGENCY MALAYSIA SDN.BHD PAGE 18
Secondary Market – Quarterly Trading Trend
Since 2013, trading activities dwindled as investors
shied away from local bond market amid global
liquidity tightening initiated by the US Fed.
In 2015, total trade dipped below MYR1 billion.
In 1Q2016, trade volume picked up as the Ringgit
strengthened and general dovish tone among major
central banks gave domestic bond market a boost.
269 280
316 326 305
229 252
188
291
1Q2014 2Q2014 3Q2014 4Q2014 1Q2015 2Q2015 3Q2015 4Q2015 1Q2016
Quarterly Trade Volume (MYR Bil)
-17%
-18%
©Copyright BOND PRICING AGENCY MALAYSIA SDN.BHD (FORMERLY BONDWEB MALAYSIA SDN BHD). - All rights reserved. ©Copyright BOND PRICING AGENCY MALAYSIA SDN.BHD PAGE 19
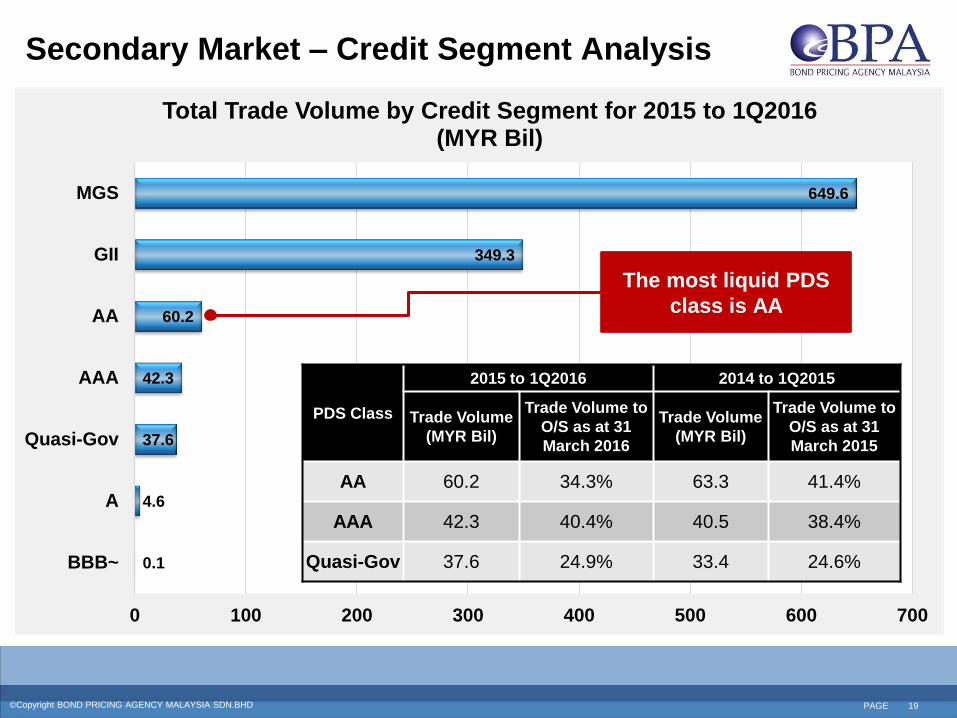
Secondary Market – Credit Segment Analysis
0.1
4.6
37.6
42.3
60.2
349.3
649.6
0 100 200 300 400 500 600 700
BBB~
A
Quasi-Gov
AAA
AA
GII
MGS
Total Trade Volume by Credit Segment for 2015 to 1Q2016 (MYR Bil)
The most liquid PDS
class is AA
PDS Class
2015 to 1Q2016 2014 to 1Q2015
Trade Volume
(MYR Bil)
Trade Volume to
O/S as at 31
March 2016
Trade Volume
(MYR Bil)
Trade Volume to
O/S as at 31
March 2015
AA 60.2 34.3% 63.3 41.4%
AAA 42.3 40.4% 40.5 38.4%
Quasi-Gov 37.6 24.9% 33.4 24.6%
©Copyright BOND PRICING AGENCY MALAYSIA SDN.BHD (FORMERLY BONDWEB MALAYSIA SDN BHD). - All rights reserved. ©Copyright BOND PRICING AGENCY MALAYSIA SDN.BHD PAGE 20
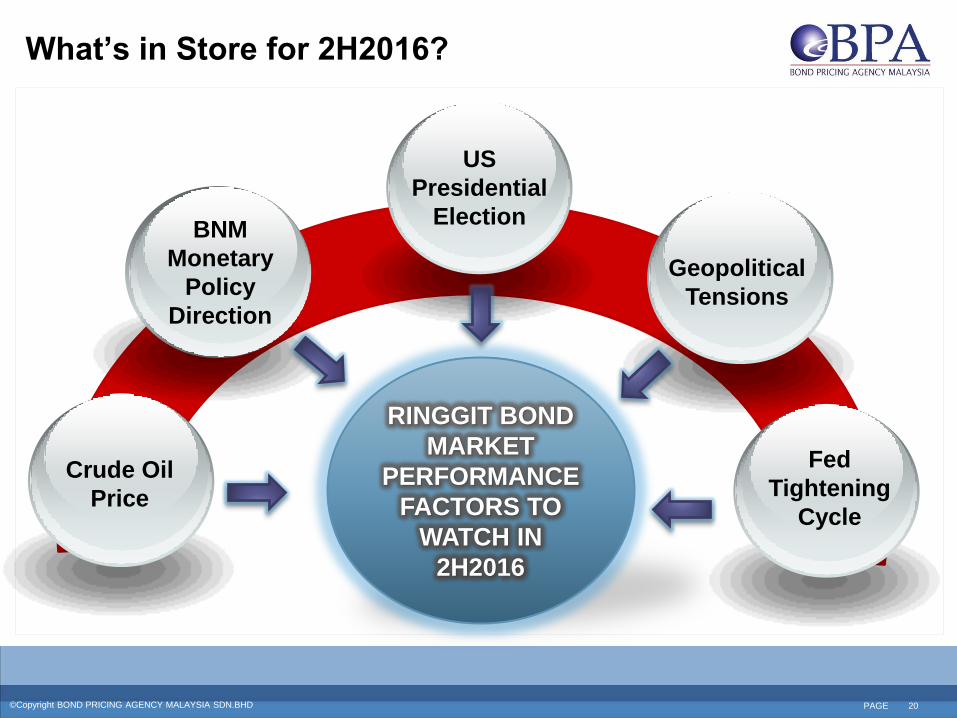
RINGGIT BOND
MARKET
PERFORMANCE
FACTORS TO
WATCH IN
2H2016
What’s in Store for 2H2016?
Fed
Tightening
Cycle
Crude Oil
Price
BNM
Monetary
Policy
Direction
US
Presidential
Election
Geopolitical
Tensions
©Copyright BOND PRICING AGENCY MALAYSIA SDN.BHD (FORMERLY BONDWEB MALAYSIA SDN BHD). - All rights reserved. ©Copyright BOND PRICING AGENCY MALAYSIA SDN.BHD PAGE 21
Track and Time the Market
©Copyright BOND PRICING AGENCY MALAYSIA SDN.BHD (FORMERLY BONDWEB MALAYSIA SDN BHD). - All rights reserved. ©Copyright BOND PRICING AGENCY MALAYSIA SDN.BHD PAGE 22
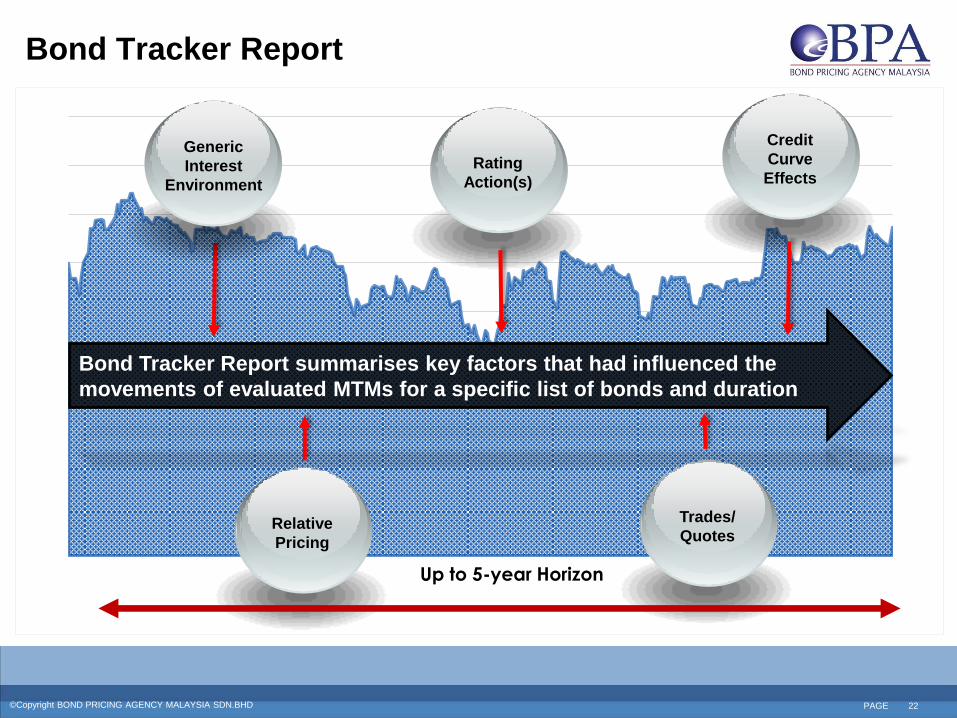
Bond Tracker Report
Bond Tracker Report summarises key factors that had influenced the
movements of evaluated MTMs for a specific list of bonds and duration
Generic
Interest
Environment
Rating
Action(s)
Credit
Curve
Effects
Relative
Pricing
Trades/
Quotes
Up to 5-year Horizon
©Copyright BOND PRICING AGENCY MALAYSIA SDN.BHD (FORMERLY BONDWEB MALAYSIA SDN BHD). - All rights reserved. ©Copyright BOND PRICING AGENCY MALAYSIA SDN.BHD PAGE 23
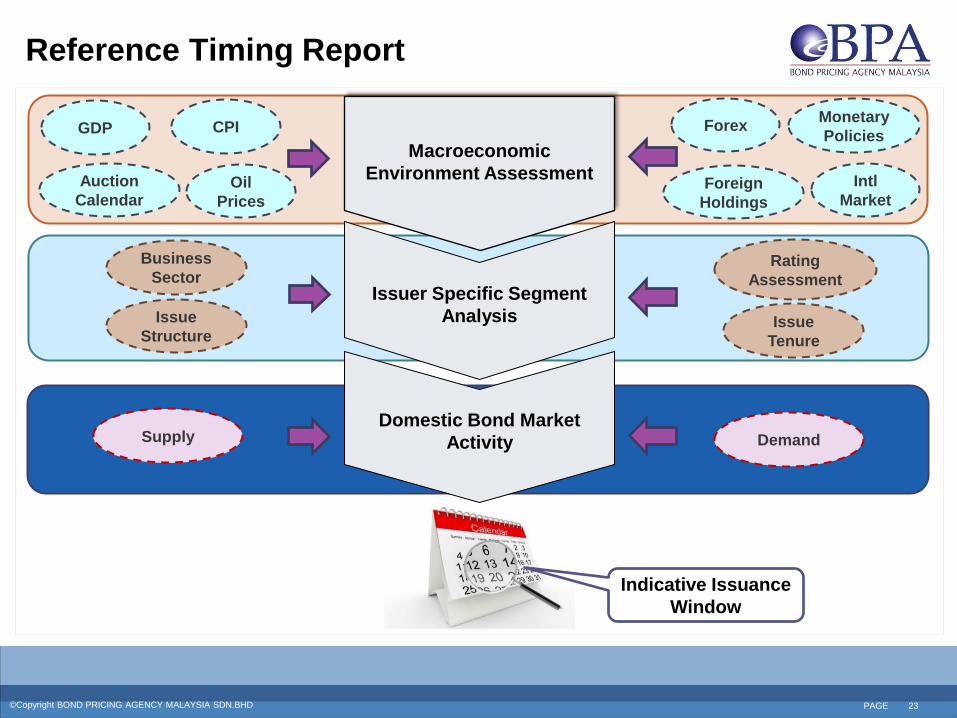
Reference Timing Report
Macroeconomic
Environment Assessment
Domestic Bond Market
Activity
GDP
Oil
Prices
CPI
Foreign
Holdings
Forex Monetary
Policies
Auction
Calendar
Business
Sector Rating
Assessment
Issue
Structure
Supply Demand
Issuer Specific Segment
Analysis
Domestic Bond Market
Activity
Intl
Market
Issue
Tenure
Indicative Issuance
Window
THANK YOU
No 17-8 & 19-8 , The Boulevard, Mid Valley City, Lingkaran Syed Putra, 59200 Kuala Lumpur, Malaysia
Tel: +603 2772 0889 Fax: +603 2772 0808 Email : [email protected]
©Copyright BOND PRICING AGENCY MALAYSIA SDN.BHD - All rights reserved.