environmental influences on fish assemblages of the upper ...journalarticle.ukm.my/10293/1/09 mat...
TRANSCRIPT
Sains Malaysiana 45(10)(2016): 1487–1495
Environmental Influences on Fish Assemblages of the Upper Sungai Pelus, Kuala Kangsar, Perak, Malaysia
(Pengaruh Alam Sekitar ke atas Kumpulan Ikan dari Hulu Sungai Pelus, Kuala Kangsar, Perak, Malaysia)
MAT ESA MOHD IKHWANUDDIN, MOHAMMAD NOOR AZMAI AMAL*, SHAMARINA SHOHAIMIHASRUL HAZMAN HASAN & NOR ROHAIZAH JAMIL
ABSTRACT
This study evaluates the current environmental influences on fish assemblages of the upper Sungai Pelus, Kuala Kangsar, Perak. Fish samplings and habitat characterizations were conducted at three significant different months, which were on dry (June 2014), wet (August 2014) and moderately wet seasons (April 2015). A total of 510 individual fish were collected from the study, which consist of four orders, nine families, 20 genus and 21 species of fishes. Cyprinidae was the biggest family, followed by Bagridae, Balitoridae and Sisoridae. Neolissochilus hexagonolepis was the only species documented under the nearly threatened list, even their individual number and occurrences were the highest recorded. The readings of environmental variables, such as water temperature, pH, conductivity, dissolved oxygen, total dissolved solids, biological oxygen demand and total suspended solids were regarded as normal for upper river area. However, the water turbidity and chemical oxygen demand (COD) were quite high, which we believed was due to seasonal variation and current anthropogenic activities of the nearby river area. Canonical correspondence analysis showed that the water conductivity, river width, COD and water velocity were the main factors in influencing the fish assemblages of this upper Sungai Pelus. The findings can be utilized as a guideline to manage, protect and conserve this upper river area in the near future.
Keywords: Environmental influences; fish assemblage; fish diversity; Perak; upper river
ABSTRAK
Kajian ini menilai pengaruh alam sekitar semasa terhadap kumpulan ikan di hulu Sungai Pelus, Kuala Kangsar, Perak. Pensampelan ikan dan pencirian habitat telah dijalankan pada tiga bulan berbeza; musim kering (Jun 2014), basah (Ogos 2014) dan sederhana basah (April 2015). Sebanyak 510 ikan telah diambil daripada kajian ini, yang terdiri daripada empat order, sembilan keluarga, 20 genus dan 21 spesies ikan. Cyprinidae adalah keluarga terbesar, diikuti oleh Bagridae, Balitoridae dan Sisoridae. Neolissochilus hexagonolepis adalah satu-satunya spesies yang direkodkan di bawah senarai hampir terancam, malah bilangan individu dan kejadian mereka adalah tertinggi direkodkan. Bacaan pemboleh ubah persekitaran seperti suhu air, pH, kekonduksian, oksigen terlarut, jumlah pepejal terlarut, permintaan oksigen biologi dan jumlah pepejal terampai adalah normal bagi kawasan hulu sungai. Walau bagaimanapun, kekeruhan air dan keperluan oksigen kimia (COD) adalah agak tinggi dan kami percaya ia disebabkan oleh perubahan bermusim dan aktiviti antropogen semasa di kawasan sungai berdekatan. Analisis penghubungan berkanun menunjukkan bahawa pengaliran air, kelebaran lebar, COD dan halaju air adalah faktor utama yang mempengaruhi kumpulan ikan di hulu Sungai Pelus ini. Keputusan kajian boleh digunakan sebagai satu garis panduan untuk mengurus, melindungi dan memulihara kawasan hulu sungai ini pada masa hadapan.
Kata kunci: Hulu sungai; kepelbagaian ikan; kumpulan ikan; pengaruh alam sekitar; Perak
INTRODUCTION
Bioindicators are defined as biotic organisms that are used to monitor the health of, or changes in, their surroundings or ecosystems (Li et al. 2010). In response to the changes in their surroundings, the organism may change its morphology, physiology, behavior, or it could even die due to their sensitivity to the changes (Phillips & Rainbow 1993; Sucman et al. 2006). There are several alternatives as indicators for biomonitoring in streams and rivers, however, benthic macroinvertebrates, periphytons and fishes that are the most frequently utilized for this purpose (Li et al. 2010).
As highly visible and valuable components of the freshwater ecosystems, fishes have been widely used as biological indicator (de Andrade et al. 2004) and as a tool in assessing aquatic ecosystem health (Hilty & Merenlender 2000). Some advantages of studying fishes in assessing ecosystem conditions include association of fish with the sediments and water, association of each life stage with the environmental media and their integrative physiology with several biological response mechanisms (Jenkins 2004). Due to their relatively long life cycle and mobility, there can be good indicators of long-term effects and broad
1488
habitat conditions (Barbour et al. 1999). Moreover, there are also a crucial part of the food web (Jenkins 2004). In addition, with a wide range of trophic level, including the highest level occupied by top predators, community structure of fish assemblage is reflective of an integrated aquatic environment health (Harris 1995). Environmental factors play important roles in characterizing the fish community structures (Sara et al. 2012). Physico-chemical water quality, such as water conductivity, dissolved oxygen, temperature, alkalinity, turbidity, total dissolved solids and habitat appearances, such as river bed substrates, width, depth, vegetation, macrophytes and water flow have been identified as main factors in fish assemblages (Beamish et al. 2006; Dubey et al. 2012; Fischer & Paukert 2008; Tejerina-Garro et al. 2005). Furthermore, other factors such as dam (Chang et al. 1999), mining activity (Schorr & Backer 2006), forest harvesting and fire (Tonn et al. 2003), invasive exotic fishes (Wilson 2005), watershed urbanization (Seilheimer et al. 2007) and seasonal variation (Offem et al. 2011) are also responsible in describing the fish assemblages in an aquatic ecosystem. Moreover, fish communities also respond significantly and predictably to almost all kinds of anthropogenic disturbances, including eutrophication, acidifition and chemical pollutions (Li et al. 2010). Streams and rivers are amongst the most endangered ecosystems worldwide (Malmqvist & Rundle 2002). In Malaysia, inland water bodies and wetlands, including rivers, lakes, peat swamps, swamps, reservoirs, former mining pools, irrigation canals and paddy fields occupy a total surface area of 45459 km2 (Yusoff & Gopinath 1995). However, freshwater habitats encompass the highest percentage of threatened fish species. A study reported that there were 32 species of highly threatened fishes in this country, where 50% of them were from the freshwater environment. The degradation of the habitat and human disturbance has been identified as the main causes of threat to Malaysian freshwater fishes (Chong et al. 2010). The Sungai Pelus catchment is a sub catchment of the upper tropical Perak River. This river flows from its source near the Thai border, southwards through Perak. The total catchment size for Sungai Pelus is estimated to be 170 km2, with the stream’s length being approximately 17 km. The average annual rainfall depth in this catchment area is ~2025 mm. The rivers of this catchment are relatively short courses; while the gradients in the upper courses are correspondingly steep (Toriman 2010). Forest represents the main land-use type in this area. It covers an extensive area and envelops entire settlements and agricultural land-use. The palm oil and rubber plantations are cultivated at the downstream area, while sundry cultivation hugs the settlement from downstream upwards (Toriman et al. 2008). However, recent extensive logging for plantation activity has been observed along the upper area of the river, which might threaten the pristine water quality, fish population and the natural beauty of this isolated area. In this study, we determined the current environmental
influences on fish assemblages in the upper Sungai Pelus, Kuala Kangsar, Perak, Malaysia.
MATERIALS AND METHODS
STUDY AREA
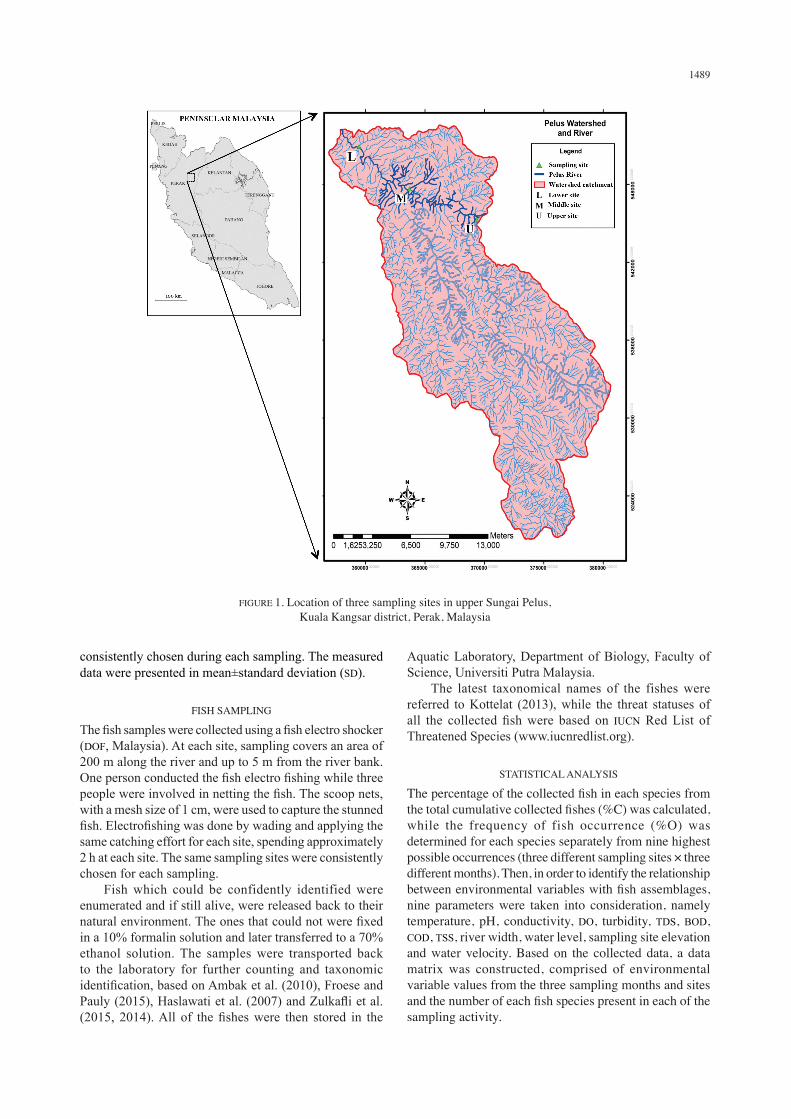
The study area is located in a remote location, specifically in the tropical upper Sungai Pelus, Kuala Kangsar, Perak, Malaysia. There are six aboriginal villages located along this upper river area, namely Kampung Temur, Kampung Temakah, Kampung Cheut, Kampung Legap, Kampung Penekeh and Kampung Keeb. This river is the main supply of the water and fishes for daily consumption for the aboriginal people who live along the river. Three sampling sites were chosen for fish sampling along the upper river area (Lower site: 4°57’22.6”N 101°15’06.1”E; Middle site: 4°56’16.5”N 101°17’25.4”E; Upper site: 4°56’25.9”N 101°18’02.1”E) (Figure 1). All of the sampling sites were accessible via logging road. Fish samplings were conducted at three significant different months, which were on dry (June 2014), wet (August 2014) and moderately wet seasons (April 2015). The lower site was characterized by low gradient bank slope, the lack of macrophyte vegetation, small rocks and sand substratum, shallow water level, slightly turbid water and slow water flow. The middle and upper sites were characterized by high gradient slope, the lack of macrophyte vegetation, from small to big rock and sand substratum, from shallow to depth water level and from turbid to clear water. However, the water velocity in the upper site was more rapid compared to the middle site. The sampling areas were mostly covered by jungle canopy, especially up to 3 m from the river’s bank.
HABITAT CHARACTERIZATION
The environmental variables were measured at the same site where the fish were sampled. Environmental variables were measured in situ using a handheld YSI meter (YSI, Yellow Springs, OH, USA), which included water temperature (°C), pH (1-14), conductivity (μS cm-1), dissolved oxygen (DO) (mg l-1) and total dissolved solid (TDS) (mg l-1). Water samples were also collected into 200 mL polyethylene bottles, then the water turbidity (NTU), biochemical oxygen demand (BOD) (mg l-1), chemical oxygen demand (COD) (mg l-1) and total suspended solids (TSS) (mg l-1) were measured using a spectrophotometer (HACH Company, Loveland, CO, USA). The river width (m), water level (m), elevation above sea level (m) and water velocity (cm s-1) were determined using a measuring tape, 5 m Staff Gauges (Stevens Water Monitoring Systems, Inc., OR, USA), GPS Montana 650 (Garmin, Malaysia) and water current meter (Global Water, Gold River, CA, USA), respectively. The environmental variables data were taken at three different points of the sampling sites (triplicate) and
1489
consistently chosen during each sampling. The measured data were presented in mean±standard deviation (SD).
FISH SAMPLING
The fish samples were collected using a fish electro shocker (DOF, Malaysia). At each site, sampling covers an area of 200 m along the river and up to 5 m from the river bank. One person conducted the fish electro fishing while three people were involved in netting the fish. The scoop nets, with a mesh size of 1 cm, were used to capture the stunned fish. Electrofishing was done by wading and applying the same catching effort for each site, spending approximately 2 h at each site. The same sampling sites were consistently chosen for each sampling. Fish which could be confidently identified were enumerated and if still alive, were released back to their natural environment. The ones that could not were fixed in a 10% formalin solution and later transferred to a 70% ethanol solution. The samples were transported back to the laboratory for further counting and taxonomic identification, based on Ambak et al. (2010), Froese and Pauly (2015), Haslawati et al. (2007) and Zulkafli et al. (2015, 2014). All of the fishes were then stored in the
Aquatic Laboratory, Department of Biology, Faculty of Science, Universiti Putra Malaysia. The latest taxonomical names of the fishes were referred to Kottelat (2013), while the threat statuses of all the collected fish were based on IUCN Red List of Threatened Species (www.iucnredlist.org).
STATISTICAL ANALYSIS
The percentage of the collected fish in each species from the total cumulative collected fishes (%C) was calculated, while the frequency of fish occurrence (%O) was determined for each species separately from nine highest possible occurrences (three different sampling sites × three different months). Then, in order to identify the relationship between environmental variables with fish assemblages, nine parameters were taken into consideration, namely temperature, pH, conductivity, DO, turbidity, TDS, BOD, COD, TSS, river width, water level, sampling site elevation and water velocity. Based on the collected data, a data matrix was constructed, comprised of environmental variable values from the three sampling months and sites and the number of each fish species present in each of the sampling activity.
FIGURE 1. Location of three sampling sites in upper Sungai Pelus, Kuala Kangsar district, Perak, Malaysia
1490
Dataset comprised of numerous variables was likely quite redundant if two or more variables have a high correlation to each other. Principal components analysis (PCA) using SPSS (IBM SPSS Statistics Version 22) was performed to reduce the number of variables in a dataset while retaining the variability in the data. By using PCA, the variables that were correlated with one another were combined into factors. The relationship between environmental variables with fish assemblages were then analyzed using canonical correspondence analysis (CCA). The CCA was examined using XLSTAT add-in for Microsoft Excel (Microsoft Corporation). For this analysis, only parameters that showed variation in their values along the river were used. The significance of each variable was tested using CCA in XLSTAT-ADA with 5000 permutations at a significance level of 5%. The results were presented using canonical biplots and other descriptive statistics.
RESULTS
HABITAT CHARACTERIZATION
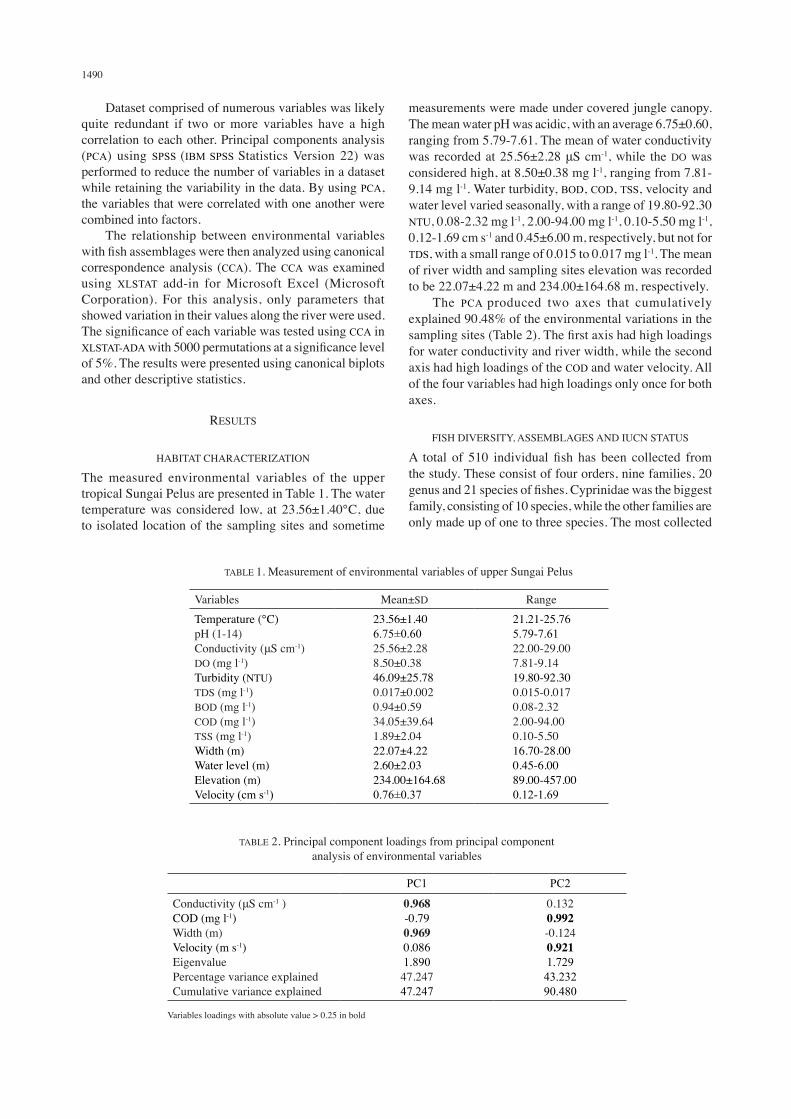
The measured environmental variables of the upper tropical Sungai Pelus are presented in Table 1. The water temperature was considered low, at 23.56±1.40°C, due to isolated location of the sampling sites and sometime
measurements were made under covered jungle canopy. The mean water pH was acidic, with an average 6.75±0.60, ranging from 5.79-7.61. The mean of water conductivity was recorded at 25.56±2.28 μS cm-1, while the DO was considered high, at 8.50±0.38 mg l-1, ranging from 7.81-9.14 mg l-1. Water turbidity, BOD, COD, TSS, velocity and water level varied seasonally, with a range of 19.80-92.30 NTU, 0.08-2.32 mg l-1, 2.00-94.00 mg l-1, 0.10-5.50 mg l-1, 0.12-1.69 cm s-1 and 0.45±6.00 m, respectively, but not for TDS, with a small range of 0.015 to 0.017 mg l-1. The mean of river width and sampling sites elevation was recorded to be 22.07±4.22 m and 234.00±164.68 m, respectively. The PCA produced two axes that cumulatively explained 90.48% of the environmental variations in the sampling sites (Table 2). The first axis had high loadings for water conductivity and river width, while the second axis had high loadings of the COD and water velocity. All of the four variables had high loadings only once for both axes.
FISH DIVERSITY, ASSEMBLAGES AND IUCN STATUS
A total of 510 individual fish has been collected from the study. These consist of four orders, nine families, 20 genus and 21 species of fishes. Cyprinidae was the biggest family, consisting of 10 species, while the other families are only made up of one to three species. The most collected
TABLE 1. Measurement of environmental variables of upper Sungai Pelus
Variables Mean±SD RangeTemperature (°C)pH (1-14)Conductivity (μS cm-1)DO (mg l-1)Turbidity (NTU)TDS (mg l-1)BOD (mg l-1)COD (mg l-1)TSS (mg l-1)Width (m)Water level (m)Elevation (m)Velocity (cm s-1)
23.56±1.406.75±0.6025.56±2.288.50±0.3846.09±25.780.017±0.0020.94±0.5934.05±39.641.89±2.0422.07±4.222.60±2.03234.00±164.680.76±0.37
21.21-25.765.79-7.6122.00-29.007.81-9.1419.80-92.300.015-0.0170.08-2.322.00-94.000.10-5.5016.70-28.000.45-6.0089.00-457.000.12-1.69
TABLE 2. Principal component loadings from principal component analysis of environmental variables
PC1 PC2
Conductivity (μS cm-1 )COD (mg l-1)Width (m)Velocity (m s-1)Eigenvalue Percentage variance explainedCumulative variance explained
0.968-0.790.9690.0861.89047.24747.247
0.1320.992-0.1240.9211.72943.23290.480
Variables loadings with absolute value > 0.25 in bold
1491
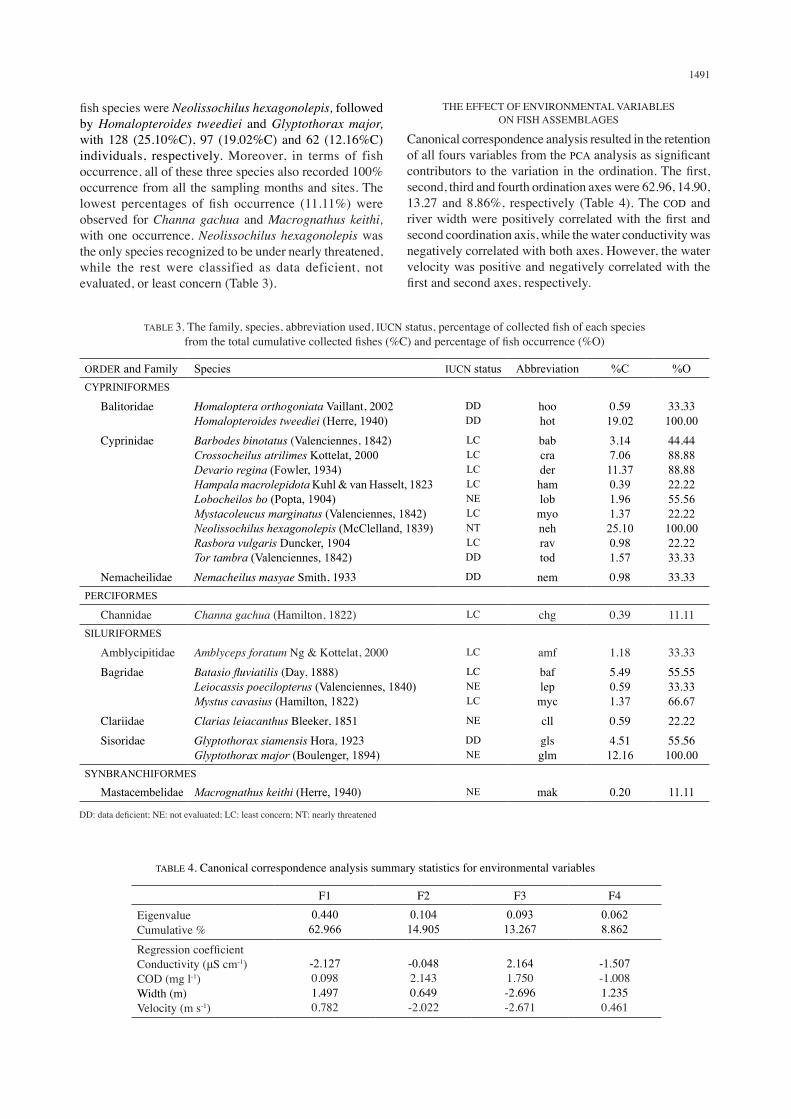
fish species were Neolissochilus hexagonolepis, followed by Homalopteroides tweediei and Glyptothorax major, with 128 (25.10%C), 97 (19.02%C) and 62 (12.16%C) individuals, respectively. Moreover, in terms of fish occurrence, all of these three species also recorded 100% occurrence from all the sampling months and sites. The lowest percentages of fish occurrence (11.11%) were observed for Channa gachua and Macrognathus keithi, with one occurrence. Neolissochilus hexagonolepis was the only species recognized to be under nearly threatened, while the rest were classified as data deficient, not evaluated, or least concern (Table 3).
THE EFFECT OF ENVIRONMENTAL VARIABLES ON FISH ASSEMBLAGES
Canonical correspondence analysis resulted in the retention of all fours variables from the PCA analysis as significant contributors to the variation in the ordination. The first, second, third and fourth ordination axes were 62.96, 14.90, 13.27 and 8.86%, respectively (Table 4). The COD and river width were positively correlated with the first and second coordination axis, while the water conductivity was negatively correlated with both axes. However, the water velocity was positive and negatively correlated with the first and second axes, respectively.
TABLE 3. The family, species, abbreviation used, IUCN status, percentage of collected fish of each species from the total cumulative collected fishes (%C) and percentage of fish occurrence (%O)
ORDER and Family Species IUCN status Abbreviation %C %OCYPRINIFORMES
Balitoridae Homaloptera orthogoniata Vaillant, 2002Homalopteroides tweediei (Herre, 1940)
DDDD
hoohot
0.5919.02
33.33100.00
Cyprinidae Barbodes binotatus (Valenciennes, 1842)Crossocheilus atrilimes Kottelat, 2000Devario regina (Fowler, 1934)Hampala macrolepidota Kuhl & van Hasselt, 1823Lobocheilos bo (Popta, 1904)Mystacoleucus marginatus (Valenciennes, 1842)Neolissochilus hexagonolepis (McClelland, 1839) Rasbora vulgaris Duncker, 1904Tor tambra (Valenciennes, 1842)
LCLCLCLCNELCNTLCDD
babcraderhamlobmyonehravtod
3.147.0611.370.391.961.3725.100.981.57
44.4488.8888.8822.2255.5622.22100.0022.2233.33
Nemacheilidae Nemacheilus masyae Smith, 1933 DD nem 0.98 33.33PERCIFORMES
Channidae Channa gachua (Hamilton, 1822) LC chg 0.39 11.11SILURIFORMES
Amblycipitidae Amblyceps foratum Ng & Kottelat, 2000 LC amf 1.18 33.33 Bagridae Batasio fluviatilis (Day, 1888)
Leiocassis poecilopterus (Valenciennes, 1840)Mystus cavasius (Hamilton, 1822)
LCNELC
baflepmyc
5.490.591.37
55.5533.3366.67
Clariidae Clarias leiacanthus Bleeker, 1851 NE cll 0.59 22.22 Sisoridae Glyptothorax siamensis Hora, 1923
Glyptothorax major (Boulenger, 1894)DDNE
glsglm
4.5112.16
55.56100.00
SYNBRANCHIFORMES
Mastacembelidae Macrognathus keithi (Herre, 1940) NE mak 0.20 11.11
DD: data deficient; NE: not evaluated; LC: least concern; NT: nearly threatened
TABLE 4. Canonical correspondence analysis summary statistics for environmental variables
F1 F2 F3 F4EigenvalueCumulative %
0.44062.966
0.10414.905
0.09313.267
0.0628.862
Regression coefficientConductivity (μS cm-1)COD (mg l-1)Width (m)Velocity (m s-1)
-2.1270.0981.4970.782
-0.0482.1430.649-2.022
2.1641.750-2.696-2.671
-1.507-1.0081.2350.461
1492
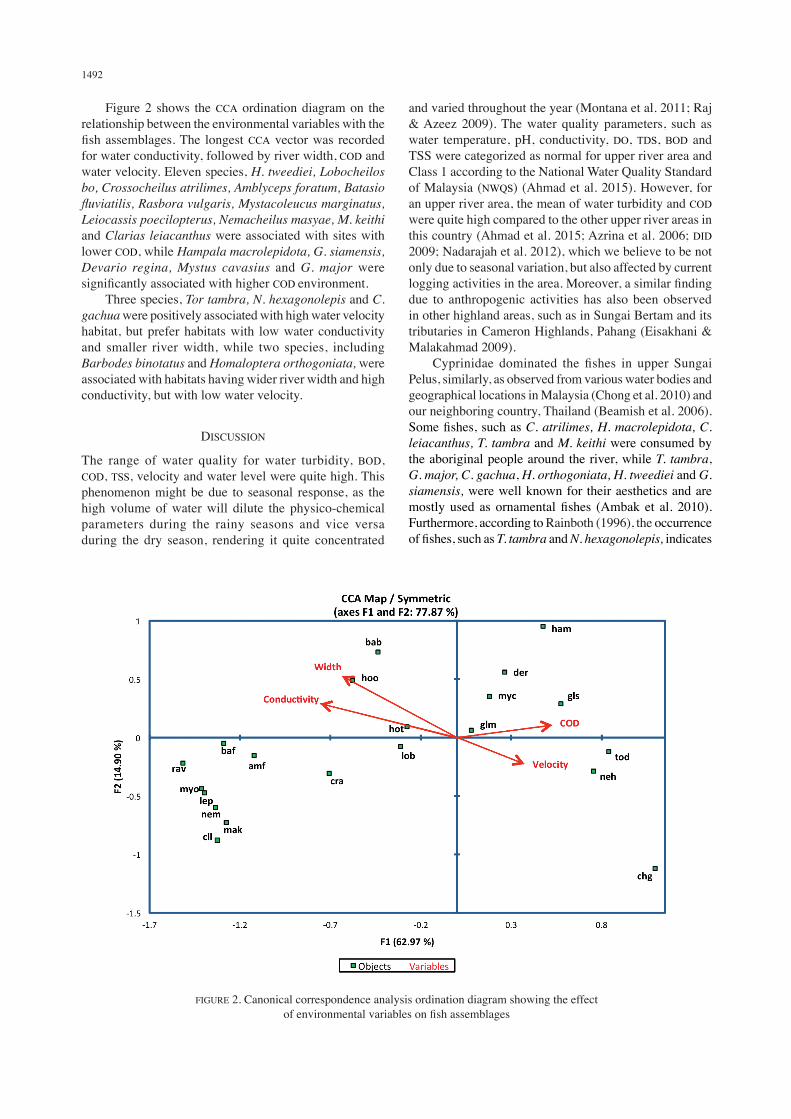
Figure 2 shows the CCA ordination diagram on the relationship between the environmental variables with the fish assemblages. The longest CCA vector was recorded for water conductivity, followed by river width, COD and water velocity. Eleven species, H. tweediei, Lobocheilos bo, Crossocheilus atrilimes, Amblyceps foratum, Batasio fluviatilis, Rasbora vulgaris, Mystacoleucus marginatus, Leiocassis poecilopterus, Nemacheilus masyae, M. keithi and Clarias leiacanthus were associated with sites with lower COD, while Hampala macrolepidota, G. siamensis, Devario regina, Mystus cavasius and G. major were significantly associated with higher COD environment. Three species, Tor tambra, N. hexagonolepis and C. gachua were positively associated with high water velocity habitat, but prefer habitats with low water conductivity and smaller river width, while two species, including Barbodes binotatus and Homaloptera orthogoniata, were associated with habitats having wider river width and high conductivity, but with low water velocity.
DISCUSSION
The range of water quality for water turbidity, BOD, COD, TSS, velocity and water level were quite high. This phenomenon might be due to seasonal response, as the high volume of water will dilute the physico-chemical parameters during the rainy seasons and vice versa during the dry season, rendering it quite concentrated
and varied throughout the year (Montana et al. 2011; Raj & Azeez 2009). The water quality parameters, such as water temperature, pH, conductivity, DO, TDS, BOD and TSS were categorized as normal for upper river area and Class 1 according to the National Water Quality Standard of Malaysia (NWQS) (Ahmad et al. 2015). However, for an upper river area, the mean of water turbidity and COD were quite high compared to the other upper river areas in this country (Ahmad et al. 2015; Azrina et al. 2006; DID 2009; Nadarajah et al. 2012), which we believe to be not only due to seasonal variation, but also affected by current logging activities in the area. Moreover, a similar finding due to anthropogenic activities has also been observed in other highland areas, such as in Sungai Bertam and its tributaries in Cameron Highlands, Pahang (Eisakhani & Malakahmad 2009). Cyprinidae dominated the fishes in upper Sungai Pelus, similarly, as observed from various water bodies and geographical locations in Malaysia (Chong et al. 2010) and our neighboring country, Thailand (Beamish et al. 2006). Some fishes, such as C. atrilimes, H. macrolepidota, C. leiacanthus, T. tambra and M. keithi were consumed by the aboriginal people around the river, while T. tambra, G. major, C. gachua, H. orthogoniata, H. tweediei and G. siamensis, were well known for their aesthetics and are mostly used as ornamental fishes (Ambak et al. 2010). Furthermore, according to Rainboth (1996), the occurrence of fishes, such as T. tambra and N. hexagonolepis, indicates
FIGURE 2. Canonical correspondence analysis ordination diagram showing the effect of environmental variables on fish assemblages
1493
the good water quality of an area. However, even though N. hexagonolepis has been classified as a nearly threatened species by the IUCN Red List of Threatened Species, this fish recorded as the highest collected species and occurrence, which indicate that they are still abundant in this isolated upper river area. Most of the collected fish in this study were also commonly found in the higher streams and upper rivers area in this country (Ahmad et al. 2011; Azmir & Samat 2010; Shah et al. 2012), while non-occurrence of invasive fish species was considered good news in terms of ecosystem in this river. Water conductivity has been reported as one of the main factor in characterizing fish assemblages at local spatial scales across a broad region (Dubey et al. 2012; Fisher & Paukert 2008; Tongnunui & Beamish 2009). Indeed, based on the arrow length of the CCA vector in our ordination diagram, the water conductivity was recorded as the main variable in influencing fish assemblages (ter Braak & Smilauer 2002). According to Stumm and Morgan (1981), water conductivity was positively related to alkalinity, the latter being positively associated with productivity and has been related to inhibition of ammonia excretion in some fishes (Wilkie & Wood 1991). The importance of water conductivity to the fishes in this study was not really understood, however, this parameter has been previously reported to play significant role in structuring fish assemblages in various tropical rivers (Dubey et al. 2012; Sarkar & Bain 2007; Tongnunui & Beamish 2009; Wu et al. 2011), but never in this country. Thus, our finding suggested that water conductivity also play an important factor for the assemblage of particular fish species in this upper Sungai Pelus area. Chemical oxygen demand influenced majority of the fish species in this upper river area. Hampala macrolepidota, G. siamensis, D. regina, M. cavasius and G. major were positively associated with increase in COD, while H. tweediei, L. bo, C. atrilimes, A. foratum, B. fluviatilis, R. vulgaris, M. marginatus, L. poecilopterus, N. masyae, M. keithi and C. leiacanthus were negatively associated with increased COD. In Malaysia, the COD was proven to influence benthic macroinvertebrate community in the upper stream ecosystem (Ahmad et al. 2015), but its influence on fish assemblages has never been investigated. Our study showed that COD influenced most of the collected fishes, whether positively or negatively correlated. This explained the importance of COD in characterizing fish assemblages in this upper river habitat. However, the mechanism and effect of COD variation on fish physiology were less understood (Ibarra et al. 2005). Water velocity plays an important role in characterizing the fish community structure (Marchetti & Moyle 2001). Fish has also been well adapted to high-gradient, rapid flowing habitats and exhibit a number of morphological modifications in their lips, body shape and other associated structures and color patterns (Hu et al. 2009; Li et al. 2012). From our study, the assemblages of N. hexagonolepis, T. tambra and C. gachua were positively associated with high water current; similar to what has been reported by
Ambak et al. (2010). Moreover, our findings also showed that fishes possessing specialized body morphology that adapts to fast water current, such as Glyptothorax sp. (thoracic adhesive apparatus) and H. tweediei (flattened head, body and depressed belly), can easily survive and inhabit high water velocity habitats, as similarly observed from collected fishes in various studies in upper streams region (Ahmad et al. 2011; Azmir & Samat 2010; Ismail et al. 2013; Neely et al. 2007; Shah et al. 2012). The stream width and water depth may be important for fish resting and hiding (Li et al. 2012). The influence of rivers width on fish assemblages has been discussed elsewhere (Askeyev et al. 2015; Fischer & Paukert 2008). A study showed that the richness of fish species might increase and later decline, with the increase of river size (Oberdorff et al. 1993), while another study reported a continuous increase in fish species richness with increasing stream size (Naiman et al. 1987). However, Grenouillet et al. (2004) documented that the changes were not linear at all. Our results were consistent with previous findings, concluding that the size of the river is one of the important factors in characterizing fish assemblages. Our findings showed that fishes such as B. binotatus and H. orthogoniata prefer habitats with wider river width, as opposed to other species like N. hexagonolepis, T. tambra, and C. gachua. We also found that most of the fishes, including B. binotatus and H. orthogoniata, congregated at the lower site of the river, which was wider and has slower in water velocity compared to the middle and upper sites. We believe that this area promote significant protection area and food abundance to the fishes. Moreover, most of the fish species observed in lower area did not exhibit the special morphological adaptation to survive in fast flowing waters.
CONCLUSION
We identified that water conductivity, river width, COD and water velocity as the main factors in influencing fish assemblages in the upper Sungai Pelus, Kuala Kangsar district Perak. Furthermore, the results suggested the importance of local environment influences on the valuable native fish species. The findings can also be utilized as a guideline to manage, protect and conserve this upper river area in the near future.
ACKNOWLEDGEMENTS
This study was financially supported by the Ministry of Science, Technology and Innovation, Malaysia (Science Fund Project No.: 04-01-04-SF1784).
REFERENCES
Ahmad, A.K., Siti-Hafizah, A. & Shuhaimi-Othman, M. 2015. Potential use of benthic macroinvertebrate as biological indicators in Sungai Ikan, Hulu Terengganu, Terengganu. Sains Malaysiana 44(5): 663-670.
1494
Ahmad, A.K., Mohd-Sham, O., Shukor, M.N., Aweng, E.R. & Shuhaimi-Othman, O. 2011. Ecological factors affecting fish diversity and density in Sungkai Wildlife Reserve, Perak, Malaysia. The Zoologist 9: 78-84.
Ambak, M.A., Isa, M.M., Zakaria, M.Z. & Ghaffar, M.A. 2010. Fishes of Malaysia. Terengganu: Penerbit Universiti Malaysia Terengganu.
Askeyev, O., Askeyev, I., Askeyev, A., Monakhov, S. & Yanybaev, N. 2015. River fish assemblages in relation to environmental factors in the eastern extremity of Europe (Tatarstan Republic, Russia). Environmental Biology of Fishes 98: 1277-1293.
Azmir, I.A. & Samat, A. 2010. Diversity and distribution of stream fishes of Pulau Langkawi, Malaysia. Sains Malaysiana 39(6): 869-875.
Azrina, M.Z., Yap, C.K., Rahim, A.I., Ismail, A. & Tan, S.G. 2006. Anthropogenic impacts on the distribution and biodiversity of benthic macroinvertebrates and water quality of the Langat River, Peninsular Malaysia. Ecotoxicology and Environmental Safety 64: 337-347.
Barbour, M.T., Gerritsen, J., Snyder, B.D. & Stribling, J.B. 1999. Rapid Bioassessment Protocols for Use in Streams and Wadeable Rivers: Periphyton, Benthic Macroinvertebrates and Fish. 2nd ed. EPA 841-B-99-002. U.S. Environmental Protection Agency: Office of Water; Washington, D.C.
Beamish, F.W.H., Sa-ardrit, P. & Tongnunui, S. 2006. Habitat characteristics of the cyprinidae in small rivers in Central Thailand. Environmental Biology of Fishes 76: 237-253.
Chang, M.H., Lin, Y.S. & Chaung, L.C. 1999. Effect of dams on fish assemblages of the Tachia River, Taiwan. Acta Zoologica Taiwanica 10: 77-90.
Chong, V.C., Lee, P.K.Y. & Lau, C.M. 2010. Diversity, extinction risk and conservation of Malaysian fishes. Journal of Fish Biology 76: 2009-2066.
de Andrade, V.M., da Silva, J., da Silva, F.R., Heuser, V.D., Dias, J.F., Yoneama, M.L. & de Freitas, T.R.O. 2004. Fish as bioindicators to assess the effects of pollution in two southern Brazilian rivers using the Comet assay and micronucleus test. Environmental and Molecular Mutagenesis 44: 459-468.
Department of Irrigation and Drainage (DID). 2009. Study on the River Water Quality Trends and Indexes in Peninsular Malaysia. Water Resources Management and Hydrology Division, Department of Irrigation and Drainage, Ministry of Natural Resources and Environment, Malaysia. Water Resources Publication No. 21. p. 112.
Dubey, V.K., Sarkar, U.K., Pandey, A., Sani, R. & Lakra, W.S. 2012. The influence of habitat on the spatial variation in fish assemblage composition in an unimpacted tropical River of Ganga basin, India. Aquatic Ecology 46: 165-174.
Eisakhani, M. & Malakahmad, A. 2009. Water quality assessment of Bertam River and its tributaries in Cameron Highlands, Malaysia. World Applied Sciences Journal 7: 769-776.
Fischer, J.R. & Paukert, C.P. 2008. Habitat relationships with fish assemblages in minimally disturbed Great Plains regions. Ecology of Freshwater Fish 17: 597-609.
Froese, R. & Pauly, D. 2015. FishBase. http://www.fishbase.org. Grenouillet, G., Pont, D. & Hérissé, C. 2004. Within-basin fish
assemblage structure: The relative influence of habitat versus stream spatial position on local species richness. Canadian Journal of Fisheries and Aquatic Sciences 61: 93-102.
Harris, J.H. 1995. The use of fish in ecological assessments. Australian Journal of Ecology 20: 65-80.
Haslawati, B., Chew, P.C. & Rosly, H. 2007. Checklist of Native Freshwater Fishes of Peninsular Malaysia. Malaysia: Department of Fisheries Malaysia.
Hilty, J. & Merenlender, A. 2000. Faunal indicator taxa selection for monitoring ecosystem health. Biological Conservation 92: 185-197.
Hu, M.L., Wu, Z.Q. & Liu, Y.L. 2009. The fish fauna of mountain streams in the Guanshan National Nature Reserve, Jiangxi, China. Environmental Biology of Fishes 86: 23-27.
Ibarra, A.A., Dauba, F. & Lim, P. 2005. Influence of non-point source pollution on riverine fish assemblages in south west France. Ecotoxicology 14: 573-588.
Ismail, A., Amal, M.N.A., Muskhazli, M., Azwady, N.A.A., Hisham, M.N.M.N. & Rahman, F. 2013. A survey on fish diversity in Sungai Enam, Temenggor Lake, Perak. Malayan Nature Journal 65: 30-37.
Jenkins, J.A. 2004. Fish bioindicators of ecosystem condition at the Calcasieu Estuary, Louisiana: USGS Open-File Report 2004-1323, p. 47.
Kottelat, M. 2013. The fishes of the inland waters of Southeast Asia: A catalogue and core bibliography of the fishes known to occur in freshwaters, mangroves and estuaries. Raffles Bulletin of Zoology Supplement No. 27. Singapore: National University of Singapore.
Li, J., Huang, L., Zou, L., Kano, Y., Sato, T. & Yahara, T. 2012. Spatial and temporal variation of fish assemblages and their associations to habitat variables in a mountain stream of north Tiaoxi River, China. Environmental Biology of Fishes 93: 403-417.
Li, L., Zheng, B. & Liu, L. 2010. Biomonitoring and bioindicators used for river ecosystems: definitions, approaches and trends. Procedia Environmental Sciences 2: 1510-1524.
Malmqvist, B. & Rundle, S. 2002. Threats to the running water ecosystems of the world. Environmental Conservation 29: 134-153.
Marchetti, P.M. & Moyle, P.B. 2001. Effects of flow regime on fish assemblages in a regulated California stream. Ecological Applications 11: 530-539.
Montana, C.G., Choudhary, S.K., Dey, S. & Winemiller, K.O. 2011. Compositional trends of fisheries in the River Ganges, India. Fisheries Management and Ecology 18: 282-296.
Nadarajah, K., Rashid, N. & Farina, Y. 2012. The Relau River water quality at the National Forest Reserve, Merapoh, Pahang. Journal of Applied Sciences 12: 1801-1808.
Naiman, R.J., Melillo, J.M., Lock, M.A., Ford, T.E. & Reice, S.E. 1987. Longitudinal patterns of ecosystem processes and community structure in a subarctic river continuum. Ecology 68: 1139-1156.
Neely, D.A., Conway, K.W. & Mayden, R.L. 2007. Erromyzon yangi, a new hillstream loach (Teleostei: Balitoridae) from the Pearl River drainage of Guangxi Province, China. Ichthyological Exploration of Freshwaters 18: 97-102.
Oberdorff, T., Guilbert, E. & Lucchetta, C. 1993. Patterns of fish species richness in the Seine River basin, France. Hydrobiologia 259: 157-167.
Offem, B.O., Ayotunde, E.O., Ikpi, G.U., Ochang, S.N. & Ada, F.B. 2011. Influence of seasons on water quality, abundance of fish and plankton species of Ikwori Lake, South-Eastern Nigeria. Fisheries and Aquaculture Journal 1: 1-13.
Phillips, D.J.H. & Rainbow, P.S. 1993. Biomonitoring of Trace Aquatic Contaminants. New York: Elsevier Applied Science. p. 325.
Rainboth, J. 1996. Fishes of Cambodian Mekong. Rome: Food and Agriculture Organizations of the United Nations.
Raj, N. & Azeez, P.A. 2009. Spatial and temporal variation in surface water chemistry of a tropical river, the River Bharathapuzha, India. Current Science 96: 245-251.
1495
Sara, J.R., Ngoni, A.G.M., Willem, J.S., Gavin. G. & Johan, T. 2012. An ichthyological and bio-monitoring survey of fish assemblages in the Vunduzi River from it source on Gorongosa Mountain to its lower reaches in the Gorongosa National Park, Moçambique. Aquaculture Research Unit, Faculty of Science and Agriculture, University of Limpopo (Turfloop Campus), Sovenga, 0727, South Africa.
Sarkar, U.K. & Bain, M.B. 2007. Priority habitats for the conservation of large river fishes in the Ganges River basin. Aquatic Conservation: Marine and Freshwater Ecosystems 17: 349-359.
Schorr, M.S. & Backer, J.C. 2006. Localized effects of coal mine drainage on fish assemblages in a Cumberland Plateau stream in Tennessee. Journal of Freshwater Ecology 21: 17-24.
Seilheimer, T.S., Wei, A., Chow-Fraser, P. & Eyles, N. 2007. Impact of urbanization on the water quality, fish habitat, and fish community of a Lake Ontario marsh, Frenchman’s Bay. Urban Ecosystems 10: 299-319.
Shah, A.R.M.S., Samat, A., Putih, K. & Mansor, K.N.A. 2012. Notes on the freshwater fishes at selected headwater streams of the Ulu Muda Forest Reserve, Kedah Darul Aman. Malayan Nature Journal 64: 147-152.
Stumm, W. & Morgan, J.J. 1981. Aquatic Chemistry: An Introduction Emphasizing Chemical Equilibria in Natural Waters. New York: Wiley. p. 780.
Sucman, E., Milada, V., Helena, G.Z. & Miroslava, M. 2006. Fish-useful bio-indicators for evaluation of contamination in water ecosystems. Proceedings of the Annual International Conference on Soils, Sediments, Water and Energy 11(3): 17-26.
Tejerina-Garro, F.L., Maldonado, M., Ibañez, C., Pont, D., Roset, N. & Oberdorff, T. 2005. Effects of natural and anthropogenic environmental changes on riverine fish assemblages: A framework for ecological assessment of rivers. Brazilian Archives of Biology and Technology 48: 91-108.
ter Braak, C.J.F. & Smilauer, P. 2002. CANOCO reference manual and CanoDraw for Windows user’s guide: Software for canonical community ordination, version 4.5. Microcomputer Power, Ithaca.
Tongnunui, S. & Beamish, F.W.H. 2009. Habitat and relative abundance of fishes in small rivers in eastern Thailand. Environmental Biology of Fishes 85: 209-220.
Tonn, W.M., Cynthia, A.P., Garry, J.S., Peter, K.M.A., Marc, L., Ellie, E.P. & Kim, W. 2003. Effects of forest harvesting and fire on fish assemblages in Boreal Plains Lakes: A reference condition approach. Transactions of the American Fisheries Society 132: 514-523.
Toriman, M.E., Jaafar, M. & Abdullah, S.M.S. 2008. Environmental flow modelling as a tool for water resources management: A study of detailed environmental impact assessment (DEIA) in Sungai Pelus River catchment, Malaysia. Journal of Social Sciences and Humanities 3(1): 1-10.
Toriman, M.E. 2010. Assessing environmental flow modeling for water resources management: A case of Sg. (River) Pelus, Malaysia. Nature and Science 8: 69-76.
Wilkie, M.P. & Wood, C. 1991. Nitrogenous waste excretion, acid base regulation and ionoregulation in rainbow trout (Oncorhynchus mykiss) exposed to extremely alkaline water. Physiological Zoology 64: 1069-1086.
Wilson, G.G. 2005. Impact of invasive exotic fishes on wetland ecosystems in the Murray - Darling Basin. Native fish and wetlands in the Murray - Darling Basin - Canberra Workshop, 7-8 June.
Wu, J., Wang, J., He, Y. & Cao, W. 2011. Fish assemblage structure in the Chishui River, a protected tributary of the Yangtze River. Knowledge and Management of Aquatic Ecosystems 400: 11.
Yusoff, F.M. & Gopinath, N. 1995. The status of inland fisheries in Malaysia. Indo-Pacific Fishery Commission. FAO Fisheries Report No. 512.
Zulkafli, A.R., Amal, M.N.A., Shohaimi, S., Mustafa, A., Ghani, A.H., Hashim, S., Anuar, M.I. & Hasfairi, M.P. 2015. Length-weight relationships of 20 fish species from Pahang River, Maran district, Pahang, Malaysia. Journal of Applied Ichthyology 31: 409-410.
Zulkafli, A.R., Asmuni, M., Hassan, A.G. & Haslawati, B. 2014. Ikan-ikan Air Tawar Sungai Pahang. Putrajaya: Jabatan Perikanan Malaysia.
Mat Esa Mohd Ikhwanuddin, Mohammad Noor Azmai Amal*& Shamarina ShohaimiDepartment of Biology, Faculty of Science Universiti Putra Malaysia 43400 UPM Serdang, Selangor Darul Ehsan Malaysia
Hasrul Hazman Hasan & Nor Rohaizah JamilDepartment of Environmental SciencesFaculty of Environmental Studies Universiti Putra Malaysia 43400 UPM Serdang, Selangor Darul Ehsan Malaysia
*Corresponding author; email: [email protected]
Received: 12 September 2015Accepted: 11 March 2016