Sains Malaysiana 47(2)(2018): 403-408http://dx.doi.org/10.17576/jsm-2018-4702-23
The Role of Electrolyte Fluidity on The Power Generation Characteristics of Thermally Driven Electrochemical Cells
(Peranan Kebendaliran Elektrolit pada Ciri-ciri Penjanaan Kuasa bagi Sel Elektrokimia Terpacu Haba)
Syed Waqar HaSan, SuHana MoHd Said*, aHMad SHuHaiMi Bin aBu Bakar, HaSan aBBaS Jaffery & MoHd. faizul MoHd. SaBri
aBStract
Thermally driven electrochemical cells (thermocells) are able to convert thermal gradient applied across redox electrolyte into electricity. The performance of the thermocells heavily depends on the magnitude and integrity of the applied thermal gradient. Herein, we study the iodide/triiodide (I–/I3
–) based 1-Ethyl-3-methyl-imidazolium Ethylsulfate ([EMIM][EtSO4]) solutions in a thermocell. In order to comprehend the role of fluidity of the electrolyte, we prepared set of solutions by diluting [EMIM][EtSO4] with 0.002, 0.004, and 0.010 mol of Acetonitrile (ACN). We realized a significant improvement in ionic conductivity (σ) and electrochemical Seebeck (Se) of diluted electrolytes as compared to base [EMIM][EtSO4] owing to the solvent organization. However, the infra-red thermography indicated faster heat flow in ACN-diluted-[EMIM][EtSO4] as compared to the base [EMIM][EtSO4]. Therefore, the maximum power density of base [EMIM][EtSO4] (i.e. 118.5 µW.m-2) is 3 times higher than the ACN-diluted-[EMIM][EtSO4] (i.e. 36.1 µW.m-2) because of the lower thermal conductivity. Hence this paper illustrates the compromise between the fast mass/flow transfer due to fluidity (of diluted samples) and the low thermal conductivity (of the pure [EMIM][EtSO4]).
Keywords: Electrochemical cells; energy harvesting; ionic liquids; redox couple; thermoelectrics
aBStrak
Sel elektrokimia yang dipacu secara haba (termosel) dapat menukar kecerunan terma yang digunakan merentasi elektrolit redoks ke dalam elektrik. Prestasi termosel sangat bergantung pada magnitud dan integriti kecerunan terma yang digunakan. Di sini, kami mengkaji larutan iodide/triiodide (I–/I3
–) berasaskan 1-Ethyl-3-methyl-imidazolium Ethylsulfate ([EMIM][EtSO4]) dalam termosel. Bagi memahami peranan ketidakstabilan elektrolit, kami menyediakan satu set larutan dengan mencairkan [EMIM][EtSO4] dengan 0.002, 0.004, dan 0.010 mol Acetonitrile (ACN). Didapati bahawa peningkatan yang ketara dalam kekonduksian ion (σ) dan elektrokimia Seebeck (Se) daripada elektrolit yang dicairkan berbanding dengan asas [EMIM][EtSO4] disebabkan oleh organisasi pelarut. Namun, termografi infra-merah menunjukkan bahawa aliran haba yang lebih cepat di dalam ACN-dicairkan-[EMIM][EtSO4] berbanding dengan asas [EMIM][EtSO4]. Oleh itu, ketumpatan kuasa maksimum asas [EMIM][EtSO4] (iaitu 118.5 µW.m-2) adalah 3 kali lebih tinggi daripada ACN-dicairkan-[EMIM][EtSO4] (iaitu 36.1 µW.m-2) akibat daripada kekonduksian terma yang lebih rendah. Dengan ini, kajian ini menggambarkan kompromi antara pemindahan jisim/aliran cepat disebabkan oleh kecairan (sampel yang dicairkan) dan kekonduksian haba yang rendah (bagi [EMIM][EtSO4] tulen).
Kata kunci: Cecair ionik; pasangan redox; penuaian tenaga; sel elektrokimia; termoelektrik
introduction
T‘Clean energy harvesting’ is amongst the key priorities of current global research. Thermally driven electrochemical cells (thermocells) are capable of harvesting thermal energy into electricity. Thermocells convert the applied thermal gradient into potential gradient by the virtue of thermoelectric effect of a redox couple based electrolyte. The thermal gradient (i.e. heat input for thermocells) can be attained from industrial engines, automobiles, solar radiations or even human bodies. The thermoelectric effect in solid-state materials (Bi2Te3 and Sb2Te3) can also transform thermal energy into electricity, however,
toxic nature of the materials, high fabrication cost and low figure of merit (ZT) gives superiority to thermocells. Comparatively, thermocells have exhibited far much improved results than the solid-state materials owing to higher electrochemical Seebeck coefficients of redox couples (Bonetti et al. 2011; Hu et al. 2010). Moreover, the redox couples in various mediums including water (Mua & Quickenden 1996; Quickenden & Mua 1995), organic solvents (Kim et al. 2017) and ionic liquids (ILs) (Abraham et al. 2013) can be prepared easily and economically. The advantages of ILs over other solvents are their wider electrochemical window and higher thermal stability. A range of ILs with various redox couples have been identified
404
for thermocell performance with Se values ranging from 0.26 mV/K to 1.88 mV/K (Abraham et al. 2013a, 2013b, 2011). As the general rule, the ideal electrolyte for thermocell application should have high ionic conductivity, diffusion coefficient, wider electrochemical window, and thermal stability. Nonetheless, thermal conductivity is a crucial thermo-physical property of the electrolyte which has a significant share in the overall performance of the thermocell. Higher thermal conductivity refers to convenient heat transport within the electrolyte (from hot to cold electrode) which implicates an unstable and reduced temperature gradient across the electrodes. We, in our previous report (Hasan et al. 2016), have shown the direct impact of thermal gradient on the maximum power density of the membrane-embedded thermocells. The power density for a thermocell with a lower ∆T of 2.7 K was 54 nW.cm-2 which was raised up to 245 nW.cm-2 by improving the ∆T to 8.8 K by placing a porous poly-vinylidene fluoride (PVDF) membrane between the electrodes. Therefore, an electrolyte with intrinsically lower thermal conductivity favors the thermocell applications as the heat flow across the electrodes is minimized; enabling improved ∆T. A recent development in thermocell research is to include additives such as MWCNTs (Salazar et al. 2014) or PEDOT:PSS (Kazim & Cola 2016) in the electrolyte. It was reported that MWCNT dispersed in the electrolyte reduces the mass transfer resistance which has the effect of increasing the power density of the composite electrolyte. It is noteworthy that the addition of the MWCNT (from 0 to 0.3 wt. %) has not affected the thermal conductivity of the electrolyte; thus permitting the improvement in the overall performance (Salazar et al. 2014). Alternatively, composite solutions have also been explored in which ILs are mixed with various organic solvents such as methanol, polycarbonate (PC), dimethyl sulfoxide (DMSO), 3-methoxypropionitrile (MPN) or acetonitrile (ACN). There have been many publications appreciating the composite electrolytes for thermocell performance. For an instance, Zinovyeva showed that the electrochemical Seebeck and the open-circuit voltage for the mixture of acetonitrile and 1-ethyl-3-methylimidazolim tetrafluoroborate is higher than the acetonitrile alone (Zinovyeva et al. 2014). Similar trend was observed by Lazar et al. (2016) upon mixing MPN and DMSO in the IL i.e. the performance of the mixture was found better than the solvent or IL alone (Lazar et al. 2016). He et al. (2016) also noticed that the mixing ILs with polycarbonate (PC), improves the power outputs of the mixture as compared to the pure ILs, however, the highest power density was achieved for the pure PC. As a general understanding, the organic solvents like PC, DMSO, or MPN reduces the viscosity and increases the diffusion coefficient in the electrolytes resulting in higher power density. In all of the above discussed composite electrolytes the thermocell performance is improved as compared to the pure IL, however, (1) the impact of the organic solvent on the thermal conductivity of the IL and (2) the overall role of thermal conductivity of the mixture on the thermocell performance has not been elaborated. Herein, we highlight the important aspect of enhanced thermal conductivity of
the composite electrolytes which has adverse impact on the power density of our samples.
MaterialS and MetHodS
1-Ethyl-3-Methylimidazolium Ethylsulfate ([EMIM][EtSO4]) was purchased from MERCK. Iodide/triiodide (I‾/I3‾) redox solution was prepared by Iodine (≥ 99.8%) and Potassium Iodide (≥ 99.5%) in 1:2 compositions. Iodide/triiodide redox couple was added in ([EMIM][EtSO4]) and heated upto 100°C under magnetic stirring for 1 h. Anhydrous Acetonitrile (≥ 99.8%), purchased from Sigma Aldrich, was used as a solvent at various compositions (0.002, 0.004, and 0.010 mol) in prepared [EMIM][EtSO4] solution. The mixture was heated upto 120°C for 24 h to ensure homogeneity. The IR spectrum of the electrolytes was recorded in the range of 450 to 4000 cm–1.
Since the electrochemical Seebeck is the materials’ property the standard approach to determine the Se is a two-beaker experiment. Electrochemical Seebeck coefficient (Se) was evaluated by the slope of linear curves between Voc – ΔT. The power characteristics of the thermocell containing [EMIM][EtSO4] and ACN-diluted-[EMIM][EtSO4] was studied in 13 mm diameter while the length of the cell (i.e. electrode-to-electrode separation) was varied to 10, 20 and 30 mm. Once the desired ΔT was achieved the electrodes were connected to a variable resistor box Elenco RS-500 to apply external loads (R; Ω). The cell potential (V) across the electrodes was measured by Agilent 34461A 61/2 digital multimeter and power (P=V2/R) was calculated by ohm’s law as described in literature. The infrared thermal imaging was carried out by R300SR-HB (Nippon Avionics Co. Ltd.). The graphite and Pt rods were used as electrode materials in thermocell and 2-beaker experiments, respectively.
reSultS and diScuSSion
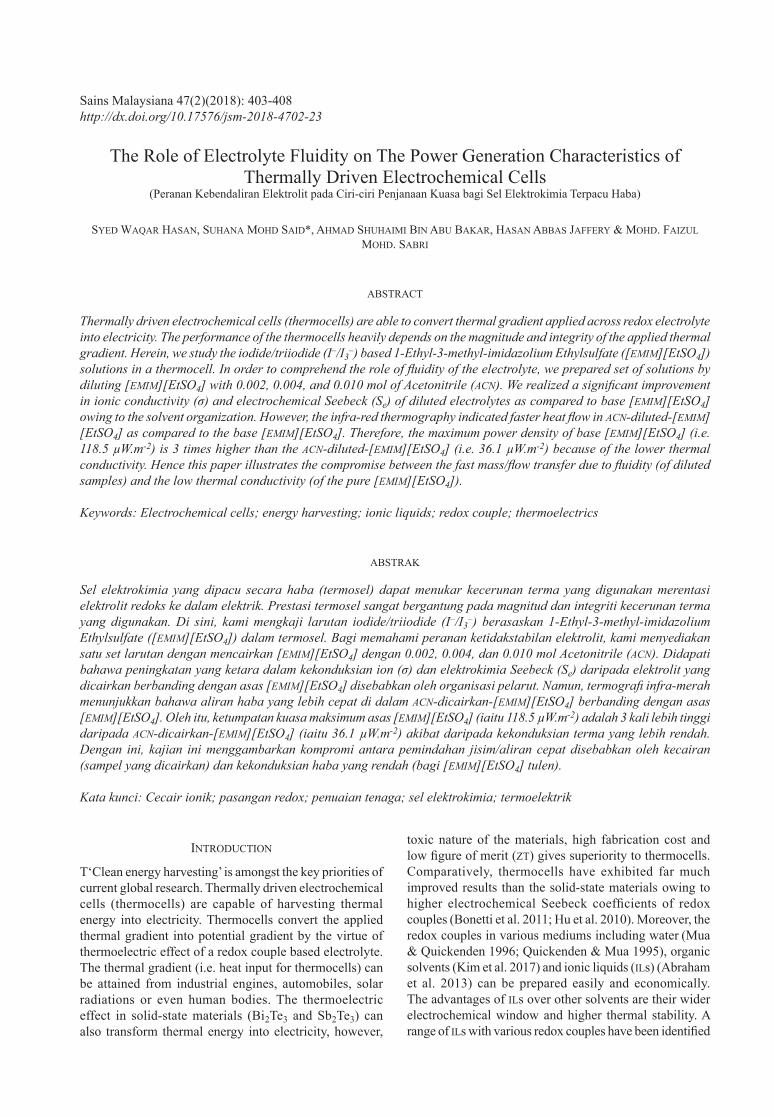
The IR spectrum of the pure [EMIM][EtSO4] as shown in Figure 1(a) and 1(b) matches well with the literature (Dhumal et al. 2011). Generally, the IR spectrum of any molecule is segregated into low and high frequency regions as shown in Figure 1(a) and Figure 1(b), respectively. The stronger bond vibrations like C−H stretching are observed from 3150 to 2900 cm–1. These stretching modes are associated with the aromatic imidazolium ring of the cation of [EMIM][EtSO4]. The band observed at 3102.51 cm-1 is the characteristic of the [EMIM]+ cation representing vibrational stretching mode between C−H. The IR traces of N-C-H rocking appear in the lower frequency region at 1572.28 and 1337.15 cm–1. For the anion i.e. [EtSO4]ˉ, the characteristic peak is at 912.67 cm–1 representing the O-S-O symmetrical stretching. Another band to be noted for the anion is at 757.13 cm–1 which is attributed to the wagging of C-C-H. It is notable that the IR spectrum does not show any significant alteration by the addition of ACN. However, there is a minute shift for the peaks at 3103.27 and 757.13 cm–1 to 3104.80 and 759.97 cm–1, respectively,
405
by the effect of ACN. The organic solvent added in the base electrolyte generally amends the inter-atomic interactions within the molecular structure of the electrolyte and the phenomenon is referred as ‘solvent reorganization’. Kim et al. (2017) studied the performance of methanol-added aqueous electrolyte in thermocells. They observed the FTIR peak (C≡N of Fe(CN)6
4– at 2044 cm–1) broadening in the methanol-water electrolyte and related it with the rearrangement of the solvated molecules around Fe(CN)6
4- (Kim et al. 2017). This solvated rearrangement increases the overall entropy change and improves the electrochemical Seebeck (He et al. 2016; Kim et al. 2017; Lazar et al. 2016). Therefore, these peak shifts (i.e. from 3103.27 to 3104.80 cm–1 and 757.13 to 759.97 cm-1) indicate weakening of these bonds reducing the electrolyte viscosity.
This improvement in solvent rearrangement can also be observed in electron transfer mechanism at electrode/electrolyte interface. The cyclic voltammetry of the electrolytes shown in Figure 1(c) explicitly indicates higher anodic/cathodic peak currents with diluted [EMIM][EtSO4]. For the viscous electrolytes a thick boundary layer is produced at the surface of the electrode hindering the electron transfer from the electrolyte to electrode or vice versa, thus we observe the similar phenomenon with pure [EMIM][EtSO4] as it is intrinsically very viscous. Once ACN is added in the electrolyte, its fluidity is increased removing the boundary layer at the electrode surface; hence improving the electron transfer. Diluting the ionic liquids with organic solvents also has a direct impact on the diffusion coefficient (D, m2s–1) (He et al. 2016, Lazar et al. 2016). The diffusion coefficient for [EMIM][EtSO4] and
FIGURE 1. Performance of [EMIM][EtSO4] and ACN-diluted-[EMIM][EtSO4]. (a,b) FT-IR spectrum and (c) Cyclic voltammetry of [EMIM][EtSO4] and ACN-diluted-[EMIM][EtSO4]. (d) The electrochemical Seebeck evaluation of the I‾/I3‾ redox couple in [EMIM][EtSO4] with various ACN concentration. The inset shows the two-beaker experimental setup. The electrolyte is taken in two separate beakers maintained at different temperatures. The two beakers are physically connected with a salt bridge. The open circuit voltage (Voc) generated at the respective electrodes of each beaker corresponding to the applied temperature gradient is recorded through Agilent 34461A 61/2 digital multimeter. (e) Temperature dependent ionic conductivity of [EMIM][EtSO4] and ACN-diluted-[EMIM]
[EtSO4] and (f) Temperature dependent thermal conductivity of the electrolytes, respectively
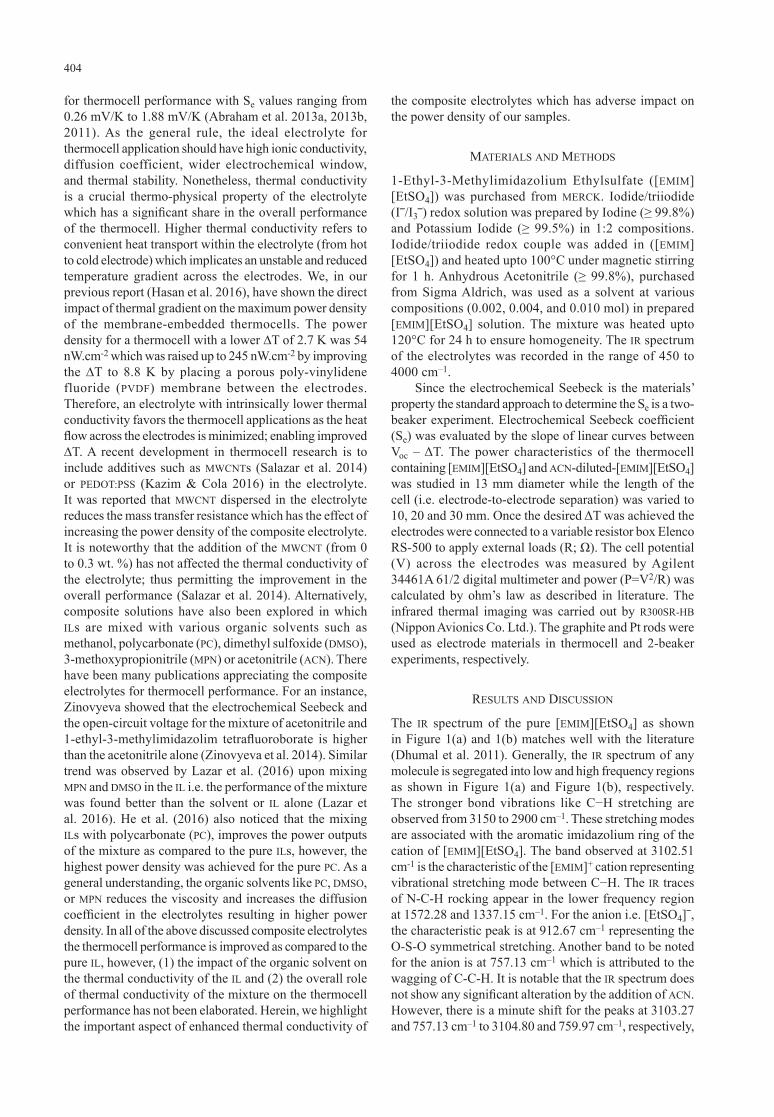
TABLE 1. The interplay between thermophysical properties of the electrolytes
Fluidity σ(mS.cm–1)
D × (10–10)(m2.s–1)
Kth(W.m–1K–1)
Max. power density(μW.m–2)
[EMIM][EtSO4]
Increases with ACN addition
3.5 0.3 0.18 118.5
[EMIM][EtSO4]+ACN
7.5 0.6 0.24 36.1
406
ACN-diluted-[EMIM][EtSO4] was calculated from Randles Sevick equation using the peak current from the cyclic voltammetry and represented in the Table 1. As expected, the diffusion coeffi cient has increased upon adding the ACN. As expected, the electrochemical Seebeck (Se) has an increasing trend with respect to the addition of ACN. The impact of ACN on the electrochemical Seebeck (Se) can be observed in Figure 1(d). As the electrochemical Seebeck (Se) defi nes the capability of the electrolyte to transform the applied thermal gradient into potential difference across the electrodes, Figure 1(d) shows that the Se of the [EMIM][EtSO4] raised from 207.2 to 416.4 µV/K upon the dilution with ACN. However, no signifi cant difference was observed by changing the composition of ACN between 0.002 to 0.004 mol. Once the composition was increased to 0.01 mol, we realized a non-linear relationship between the Voc and ΔT.
In addition to an improved electron transfer between the electrolyte and electrode another improvement incorporated by the dilution is observed in the ionic conductivity as shown in Figure 1(e). The ionic conductivity of the base [EMIM][EtSO4] from 3.5 µS/cm is increased to 7.5 µS/cm at room temperature as the effect of dilution. The linear increment in the ionic conductivity of the electrolytes is also beneficial for thermocell characterization. In solid-state thermoelectrics, increment in electrical conductivity of the material is coupled with an increase in the thermal conductivity. Likewise, thermal
conductivity of our samples has increased from 0.18 to 0.22 W.m–1K–1 at room temperature. As the temperature is increased the thermal conductivity of both samples increases, nevertheless, it is higher for ACN-diluted-[EMIM][EtSO4] samples as compared to the base [EMIM][EtSO4] as shown in Figure 1(f). This indicates that the diluted electrolytes allow fast heat propagation without maintaining the desired thermal gradient. Since the diluted [EMIM][EtSO4] has higher thermal conductivity it is less viscous; escalating the convective fl ow within the cell. This not only reduces the thermal gradient but also reduces the power density.
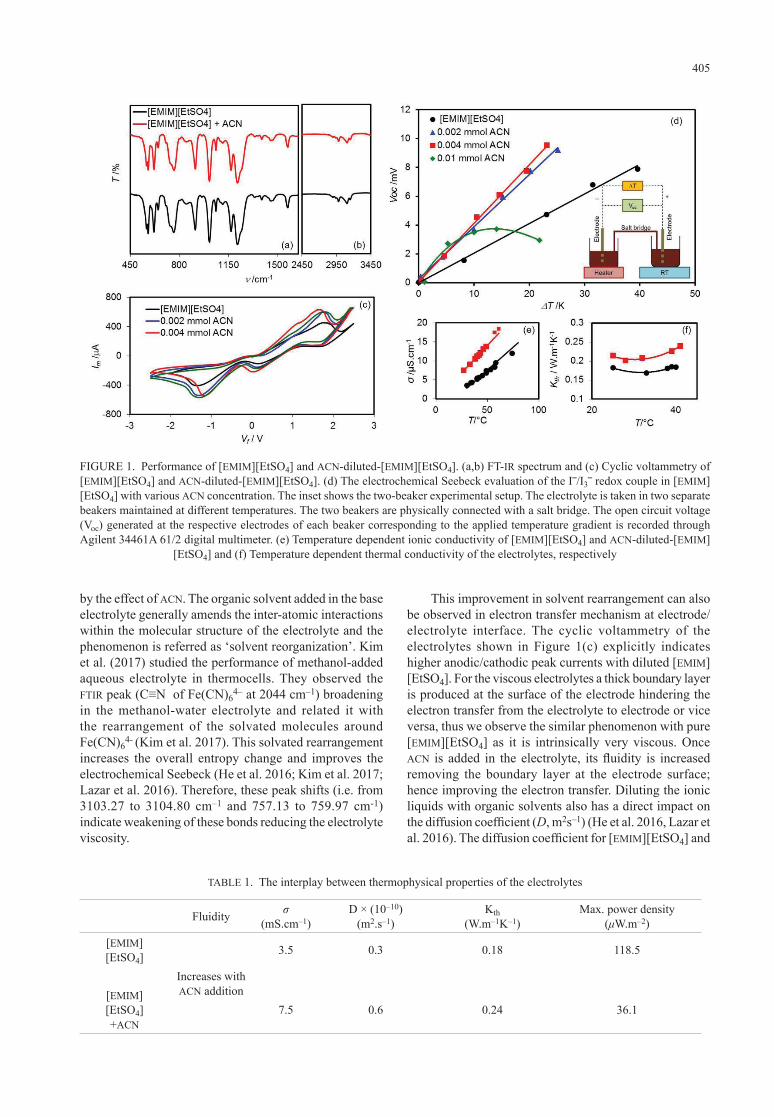
The [EMIM][EtSO4] and ACN-diluted-[EMIM][EtSO4] electrolyte was taken in the thermocells with variable electrode-to-electrode (e-to-e) separation as shown in Figure 2(a)-2(c). Figure 2(d) shows the output power density of the thermocells with [EMIM][EtSO4] electrolyte with e-to-e separation of 10, 20 and 30 mm. The maximum power density of ca. 6 nW.cm–2 is observed when the e-to-e separation is 10 mm which increases to ca. 12 nW.cm–2 upon increasing the e-to-e separation to 20 mm. Additionally, the maximum cell potential is also increased from 5.4 to 8.2 mV. The increasing e-to-e separation from 10 to 20 mm has two immediate impacts (a) the volume of the redox electrolyte is increased from 1.2 to 2.4 mL as shown in Figure 2(a)-2(c), therefore, the redox reactions taking place at the electrode surface has increased and (b) the thermal gradient maintained between the two
FIGURE 2. Schematic illustration of the thermocells with variable e-to-e separation and power generation characteristics of thermocells (a-c) Thermocells with e-to-e separation of 10 mm, 20 mm and 30 mm, (d) Output power density measurement of [EMIM][EtSO4], (e) Electrochemical impedance spectroscopy (EIS) of the thermocells (f) Output power density measurement of ACN-diluted-[EMIM][EtSO4]
FIGURE 2. Schematic illustration of the thermocells with variable e-to-e separation and
power generation characteristics of thermocells (a-c) Thermocells with e-to-e separation of
10 mm, 20 mm and 30 mm, (d) Output power density measurement of [EMIM][EtSO4], (e)
Electrochemical impedance spectroscopy (EIS) of the thermocells (f) Output power density
measurement of ACN-diluted-[EMIM][EtSO4]
407
vertical electrodes is improved (from 17 to 28K). Both of these factors result in the enhancement of the power density. However, upon any further increment in the e-to-e separation the power density is reduced to 1.1 nW.cm–2 owing to the increased ohmic resistance of the electrolyte with the excessive volume of 3.6 mL. In order to diagnose the increasing ohmic resistance of the cell with respect to the e-to-e separation electrochemical impedance spectroscopy (EIS) is a useful characterization tool. The EIS data of the cells with variable e-to-e separations is represented as the Nyquist plot, shown in Figure 2(e). The real part of the impedance (Z’) is plotted on x-axis and imaginary part (Z’’) along y-axis. The starting point of every curve at Z’’=0 represents the ohmic resistance of the cell. The cell has the combination of resistive-capacitive behaviour expressing the kinetic and diffusion processes undergoing the thermocells during electron transfer. The cell with e-to-e separation of 10 mm has the ohmic resistance of 40.15 Ω which is increased to 116.43 Ω in case of 30 mm e-to-e separation. Likewise, the charge transfer resistance is also maximum with the highest e-to-e separation. Thus, the increased ohmic resistance limits any further improvement in power density of the cell. Similar experiments with the ACN-diluted-[EMIM][EtSO4] electrolyte were carried out and the results are shown in Figure 2(f). It is noteworthy that in all of the cases of e-to-e separation the power density with ACN-diluted-[EMIM][EtSO4] electrolyte is significantly smaller as compared
to the base [EMIM][EtSO4] electrolyte. This reduction is the indication of the increased thermal conductivity of the diluted electrolytes as discussed with respect to Figure 3.
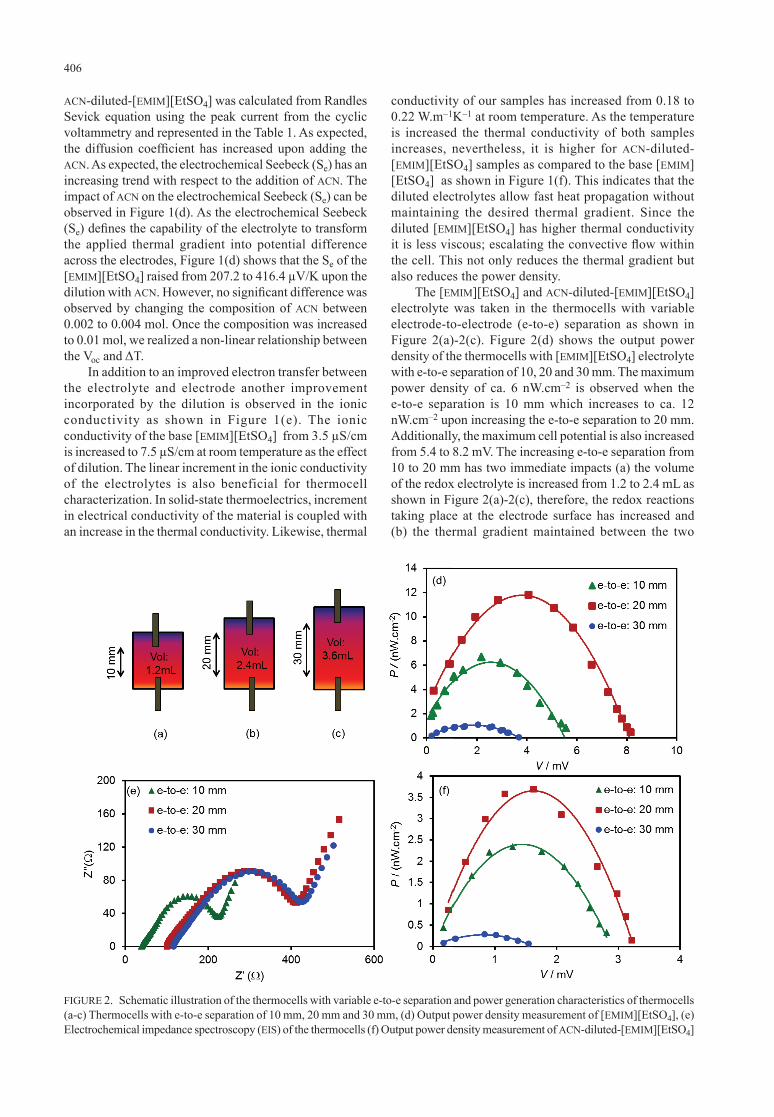
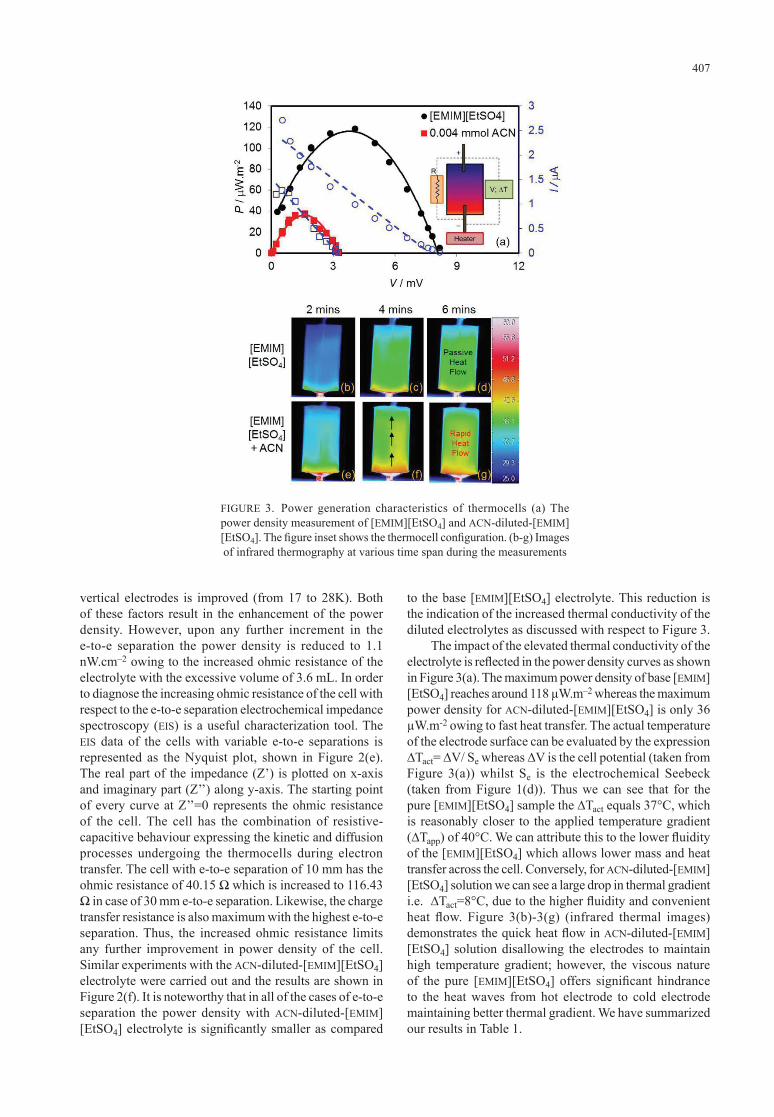
The impact of the elevated thermal conductivity of the electrolyte is reflected in the power density curves as shown in Figure 3(a). The maximum power density of base [EMIM][EtSO4] reaches around 118 µW.m–2 whereas the maximum power density for ACN-diluted-[EMIM][EtSO4] is only 36 µW.m-2 owing to fast heat transfer. The actual temperature of the electrode surface can be evaluated by the expression ∆Tact= ∆V/ Se whereas ∆V is the cell potential (taken from Figure 3(a)) whilst Se is the electrochemical Seebeck (taken from Figure 1(d)). Thus we can see that for the pure [EMIM][EtSO4] sample the ∆Tact equals 37°C, which is reasonably closer to the applied temperature gradient (∆Tapp) of 40°C. We can attribute this to the lower fluidity of the [EMIM][EtSO4] which allows lower mass and heat transfer across the cell. Conversely, for ACN-diluted-[EMIM][EtSO4] solution we can see a large drop in thermal gradient i.e. ∆Tact=8°C, due to the higher fluidity and convenient heat flow. Figure 3(b)-3(g) (infrared thermal images) demonstrates the quick heat flow in ACN-diluted-[EMIM][EtSO4] solution disallowing the electrodes to maintain high temperature gradient; however, the viscous nature of the pure [EMIM][EtSO4] offers significant hindrance to the heat waves from hot electrode to cold electrode maintaining better thermal gradient. We have summarized our results in Table 1.
FIGURE 3. Power generation characteristics of thermocells (a) The power density measurement of [EMIM][EtSO4] and ACN-diluted-[EMIM][EtSO4]. The figure inset shows the thermocell configuration. (b-g) Images of infrared thermography at various time span during the measurements
408
concluSion
The ACN when mixed with [EMIM][EtSO4], brings positive outcomes for the electrochemical Seebeck, diffusion coefficient and ionic conductivity of the ionic liquid but simultaneously increases the thermal conductivity. Thus, the increased thermal conductivity negates the effect of the improved properties; diminishing the overall power density. Therefore, it is necessary to ensure that the thermal conductivity of the electrolyte (thermocell) is either maintained at the base value or decreased by the action of organic solvent. Hence the solvent-IL bilateral interaction is significant in composite electrolytes. Alternative approaches to achieve higher thermal resistive thermocells can be selection of appropriate solvent/ionic liquid pair, embedding membrane between the electrodes or gelation of the electrolyte (Jin et al. 2016; Wu et al. 2016; Yang et al. 2016).
ACKNOWLEDGEMENTS
This research is supported by the Fundamental Research Grant Scheme (FRGS) under the project FP064-2016A and University of Malaya Postgraduate Research Grant (PPP) under the project PG341-2016A.
REFERENCES
Abraham, T.J., MacFarlane, D.R., Baughman, R.H., Jin, L., Li, N. & Pringle, J.M. 2013a. Towards ionic liquid-based thermoelectrochemical cells for the harvesting of thermal energy. Electrochimica Acta 113: 87-93.
Abraham, T.J., Douglas, R.M. & Jennifer, M.P. 2013b. High Seebeck coefficient redox ionic liquid electrolytes for thermal energy harvesting. Energy & Environmental Science 6(9): 2639-2645.
Abraham, T.J., Douglas, R.M. & Jennifer, M.P. 2011. Seebeck coefficients in ionic liquids -prospects for thermo-electrochemical cells. Chemical Communications 47(22): 6260-6262.
Bonetti, M., Nakamae, S., Roger, M. & Guenoun, P. 2011. Huge Seebeck coefficients in nonaqueous electrolytes. The Journal of Chemical Physics 134(11): 114513.
Dhumal, N.R., Hyung, J.K. & Johannes, K. 2011. Electronic structure and normal vibrations of the 1-ethyl-3-methylimidazolium ethyl sulfate ion pair. The Journal of Physical Chemistry A 115(15): 3551-3558.
Hasan, S.W., Suhana, M.S., Mohd Faizul, M.S., Ahmad Shuhaimi, A.B., Nur Awanis, H., Megat Muhammad, I.M.H., Jennifer, M.P. & Douglas, R.M. 2016. High thermal gradient in thermo-electrochemical cells by insertion of a poly (vinylidene fluoride) membrane. Scientific Reports p. 6.
He, J., Danah, A.M., Douglas, R. & Jennifer, M.P. 2016. Temperature dependence of the electrode potential of a cobalt-based redox couple in ionic liquid electrolytes for thermal energy harvesting. Faraday Discussions.
Hu, R., Baratunde, A.C., Nanda, H., Joseph, N.B., Sergey, L., Stephanie, S., Gordon, W., Chee, T., Michael, T. & Adrian, G. 2010. Harvesting waste thermal energy using a carbon-nanotube-based thermo-electrochemical cell. Nano Letters 10(3): 838-846.
Jin, L., George, W.G., Douglas, R.M. & Jennifer, M.P. 2016. Redox-active quasi-solid-state electrolytes for thermal energy harvesting. ACS Energy Letters 1(4): 654-658.
Kazim, A.H. & Baratunde, A.C. 2016. Electrochemical characterization of carbon nanotube and poly (3, 4-ethylenedioxythiophene) - poly (styrenesulfonate) composite aqueous electrolyte for thermo-electrochemical cells. Journal of the Electrochemical Society 163(8): F867-F871.
Kim, T., Jeong, S.L., Geonhui, L., Hongsik, Y., Jeyong, Y., Tae, J.K. & Yong, H.K. 2017. High thermopower of ferri/ferrocyanide redox couple in organic-water solutions. Nano Energy 31: 160-167.
Lazar, M.A., Danah, A.M., Douglas, R.M. & Jennifer, M.P. 2016. Enhanced thermal energy harvesting performance of a cobalt redox couple in ionic liquid–solvent mixtures. Physical Chemistry Chemical Physics 18(3): 1404-1410.
Mua, Y. & Quickenden, T.I. 1996. Power conversion efficiency, electrode separation, and overpotential in the ferricyanide/ferrocyanide thermogalvanic cell. Journal of the Electrochemical Society 143(8): 2558-2564.
Quickenden, T.I. & Mua, Y. 1995. The power conversion efficiencies of a thermogalvanic cell operated in three different orientations. Journal of the Electrochemical Society 142(11): 3652-3659.
Salazar, P.F., Sai, T.S., Ali, H.K., Jennifer, M.P. & Baratunde, A.C. 2014. Enhanced thermo-electrochemical power using carbon nanotube additives in ionic liquid redox electrolytes. Journal of Materials Chemistry A 2(48): 20676-20682.
Wu, J., Jeffrey, J.B. & Leigh, A. 2016. Thermoelectrochemistry using conventional and novel gelled electrolytes in heat-to-current thermocells. Electrochimica Acta 225: 482-492.
Yang, P., Kang, L., Qian, C., Xiaobao, M., Yishu, Z., Song, L., Guang, F. & Jun, Z. 2016. Wearable thermocells based on gel electrolytes for the utilization of body heat. Angewandte Chemie 128(39): 12229-12232.
Zinovyeva, V., Sawako, N., Marco, B. & Michel, R. 2014. Enhanced thermoelectric power in ionic liquids. ChemElectroChem 1(2): 426-430.
Syed Waqar Hasan & Suhana Mohd Said*Department of Electrical Engineering University of Malaya 50603 Kuala Lumpur, Federal TerritoryMalaysia
Ahmad Shuhaimi Bin Abu BakarLow Dimensional Materials Research Centre Department of Physics 50603 Kuala Lumpur, Federal TerritoryMalaysia
Hasan Abbas Jaffery & Mohd. Faizul Mohd. SabriDepartment of Mechanical Engineering University of Malaya 50603 Kuala Lumpur, Federal TerritoryMalaysia
*Corresponding author; email: [email protected]
Received: 7 April 2017Accepted: 8 August 2017


