1MITI Tower, No. 7, Jalan Sultan Haji Ahmad Shah, 50480 Kuala Lumpur, Malaysia Tel: +603 - 8000 8000 Fax: +603 - 6202 9446
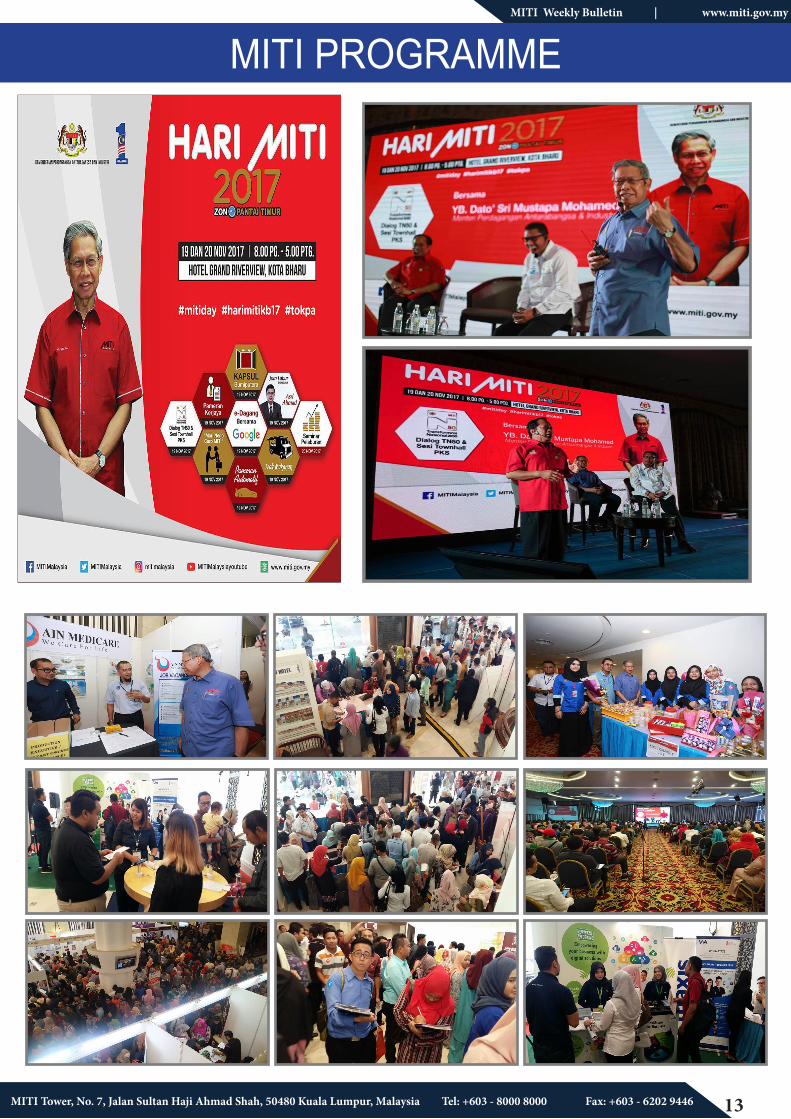
Kementerian Perdagangan Antarabangsa dan Industri (MITI) bersama-sama agensi-agensi di bawahnya (MIDA, MATRADE, SME CORP, MPC, MIDF, SME BANK, HDC, MAI & MSI) mengadakan Program “Hari MITI 2017” (Zon Pantai Timur) pada 19 November 2017 (Ahad) bermula jam 8.30 pagi hingga 5.30 petang bertempat di Hotel Grand Riverview, Kota Bharu, Kelantan.
Program ini telah dirasmikan oleh YB Dato’ Sri Mustapa Mohamed, Menteri MITI. Lebih 5,000 pengunjung telah menghadiri program tersebut terdiri dari kalangan PKS, kedutaan asing, pelajar university yang bakal menamatkan pengajian mereka, graduan baharu, ahli-ahli persatuan/Dewan-dewan perniagaan , pelabur Bumiputera dan rakyat tempatan.
Kali pertama Hari MITI telah diadakan pada 17 Oktober 2016 di Menara MITI Kuala Lumpur manakala tahun ini program yang sama peringkat Zon Utara telah diadakan pada 6 Mei 2017 di Meru, Ipoh, Perak.
Tujuan Hari MITI 2017 (Zon Pantai Timur) diadakan adalah untuk mengeratkan lagi hubungan di antara MITI serta agensi dengan orang ramai dan mempamerkan fungsi MITI dan agensi yang meliputi segenap aspek kehidupan seharian. Antara peranan MITI serta agensi adalah :
i) Merancang, menggubal serta melaksanakan dasar- dasar pembangunan industri, perdagangan antarabangsa serta pelaburan;ii) Menggalakkan pelaburan luar dan dalam negara; daniii) Meningkatkan produktiviti serta kompetensi negara di dalam sektor pembuatan
Program MITI Day 2017 (Zon Pantai Timur) adalah berkonsepkan rakyat, dimana program kali ini dibahagikan kepada empat (4) konsep utama iaitu Seranta (Outreach), Keusahawanan, Peluang Pekerjaan dan Pelaburan. Antara pengisian program adalah seperti berikut:
i. MITI & Agencies Showcase;ii. Dialog TN50 & Sesi Town Hall PKS bersama YB Dato’ Sri Mustapa Mohamed.iii. Pameran Automotif – demonstrasi kereta model baharu oleh MAI;iv.Pameran Kerjaya & Sesi Temuduga Terbuka oleh MIDA yang menawarkan lebih 2,000 peluang pekerjaan di seluruh Negara. Antara 27 syarikat yang telah mengambil bahagian termasuk Silterra, Inari Amertron, Ain Medicare, Malaysia
HARI MITI 2017 (ZON PANTAI TIMUR) SIARAN MEDIA
Rail Link, Gardenia, Yakult, Coca-Cola, D&Y Textile, Rubberflex Sdn. Bhd., Admal Aviation College, UPC Chemicals, JTK Negeri Kelantan, ASJ Components, Tok Balik Supply Base, Kilang Makanan MAMEE, Rohm-Wako Electronics, QSR Brands, V.S Industry, Konsortium E-Mutiara, Nationwide Express dan Lulu Group Retail.
v. Kaprul Bumiputera yamg mempamerkan pencapaian usahawan-usahawan Kelantan yang dibantu dan dibimbing MITU/agensi.
vi. Program Mari Nego Caro MITI, Pakat Mari Tanyo MITI dan Infodesk/Help Booth anjuran MITI (ASEAN), MATRADE, HDC & JAKIM;
vii. Program e-Dagang Go-Global with Google bertujuan mambantu PKS tempatan untuk mengaplikasi teknologi digital bagi tujuan menerokai pasaran global;
viii. Program ‘Jom Labur’ bersama Tuan Haji Asri Ahmad, Ikon Bursa Malaysia yang berkongsi tips serta kemahiran mengenai pelaburan saham dalam misi memperkasakan pemilikan ekuiti di kalangan Bumiputer ; dan
ix. Seminar Peluang Pelaburan dan Pembangunan PKS Kelantan oleh MIDA pada 20 November 2017
Menariknya pada kali ini ialah buat julung kalinya diadakan DIALOG TN50 & SESI TOWN HALL PKS BERSAMA YB DATO’ SRI MUSTAPA MOHAMED, bertujuan untuk memberi peluang kepada rakyat berdialog secara langsung bersama YB Menteri dan seterusnya mengumpul pandangan serta aspirasi peserta dan usahawan Perusahaan Kecil dan Sederhana (PKS) mengenai agenda pembangunan perdagangan dan perindustrian Malaysia termasuk Industri 4.0, e-Dagang dan Zon Perdagangan Bebas Digital (DFTZ), serta inisiatif Kerajaan dalam pembangunan PKS di Malaysia.
Penganjuran Hari MITI 2017 (Zon Pantai Timur) diharapkan
mampu memupuk kefahaman yang lebih baik kepada pelanggan dan masyarakat tentang fungsi serta peranan MITI dan agensi seterusnya mengurangkan jurang di antara agensi kerajaan serta rakyat, selaras dengan pendekatan kerajaan yang berteraskan perkhidmatan kepada rakyat.
Kementerian Perdagangan Antarabangsa dan Industri19 November 2017
2MITI Tower, No. 7, Jalan Sultan Haji Ahmad Shah, 50480 Kuala Lumpur, Malaysia Tel: +603 - 8000 8000 Fax: +603 - 6202 9446
MITI Weekly Bulletin | www.miti.gov.my
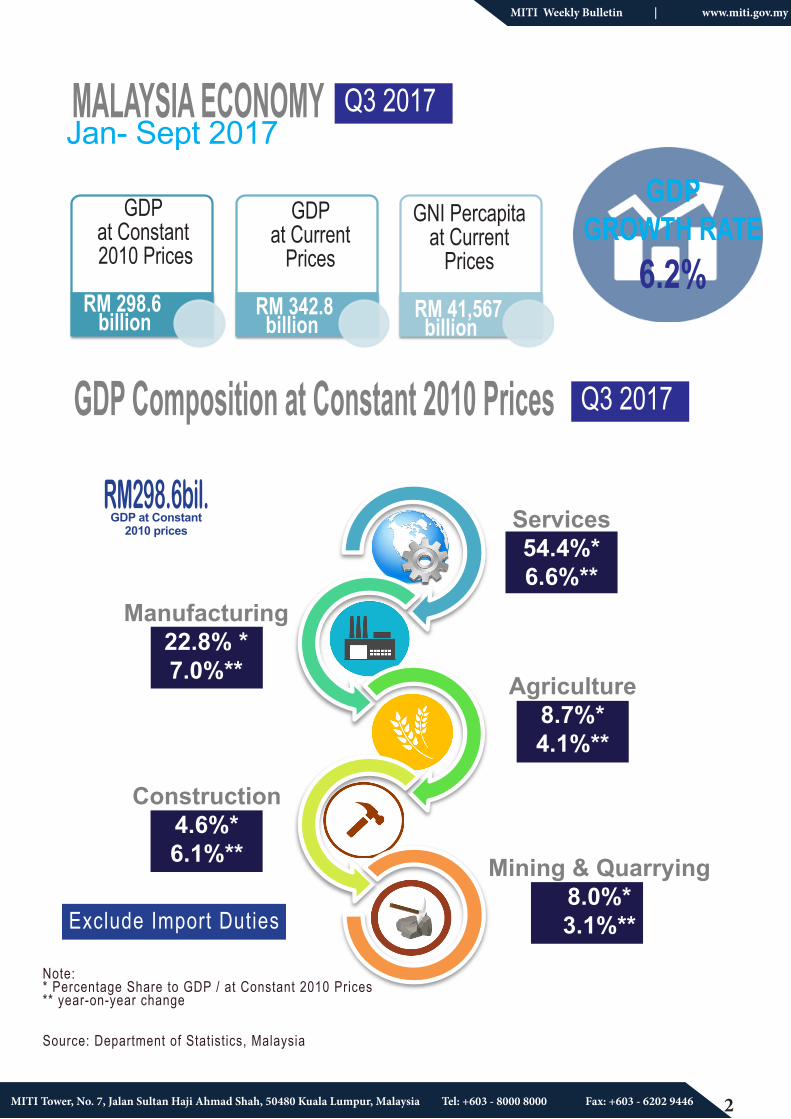
Jan- Sept 2017
Services54.4%*6.6%**
Source: Department of Statistics, Malaysia
MALAYSIA ECONOMY Q3 2017
GDP at Constant 2010 Prices
RM 298.6 billion
GDP GROWTH RATE
6.2%GDP
at Current Prices
RM 342.8 billion
GNI Percapitaat Current
Prices
RM 41,567 billion
Note: * Percentage Share to GDP / at Constant 2010 Prices** year-on-year change
Manufacturing22.8% *7.0%** Agriculture
8.7%*4.1%**
Construction4.6%*6.1%** Mining & Quarrying
8.0%*3.1%**
GDP Composition at Constant 2010 Prices Q3 2017
Exclude Import Duties
RM298.6bil.GDP at Constant
2010 prices
3MITI Tower, No. 7, Jalan Sultan Haji Ahmad Shah, 50480 Kuala Lumpur, Malaysia Tel: +603 - 8000 8000 Fax: +603 - 6202 9446
MITI Weekly Bulletin | www.miti.gov.my
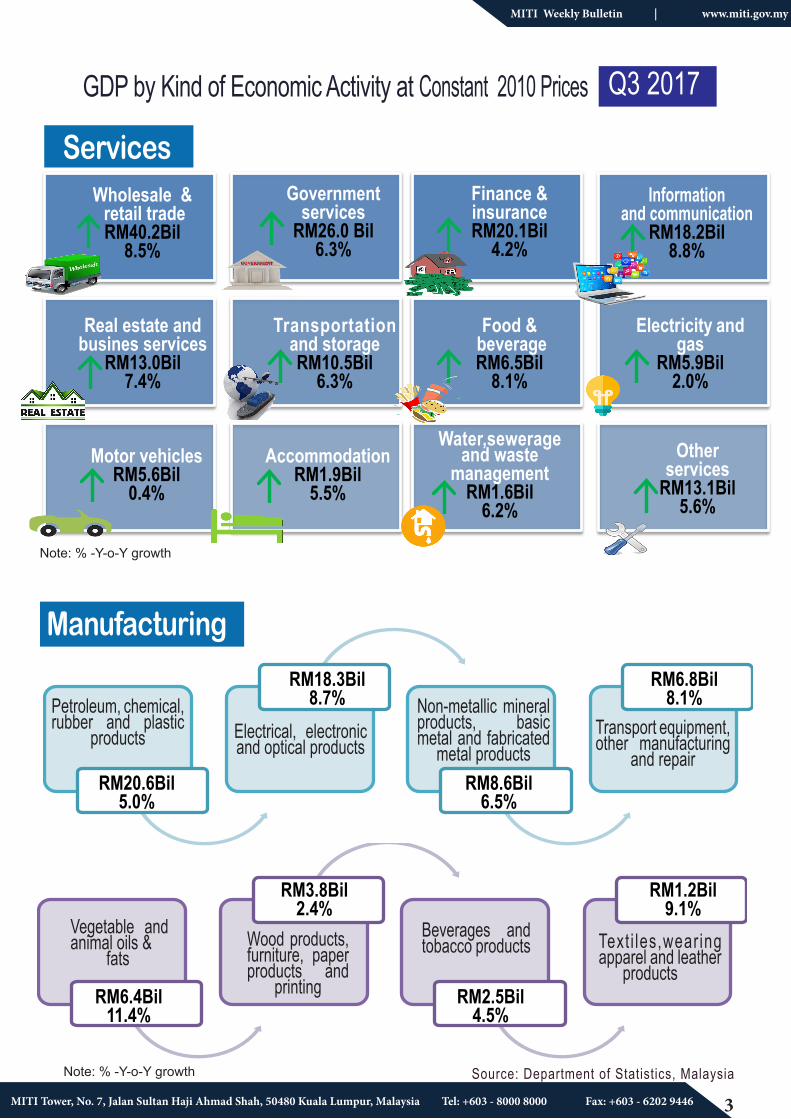
Services
GDP by Kind of Economic Activity at Constant 2010 Prices Q3 2017
Government services
RM26.0 Bil6.3%
Wholesale & retail tradeRM40.2Bil
8.5%
Information and communication
RM18.2Bil8.8%
Finance &insuranceRM20.1Bil
4.2%
Other services
RM13.1Bil5.6%
Real estate andbusines services
RM13.0Bil7.4%
Transportation and storageRM10.5Bil
6.3%
Food & beverage RM6.5Bil
8.1%
Electricity and gas
RM5.9Bil2.0%
Motor vehiclesRM5.6Bil
0.4%
Water,sewerage and waste
management RM1.6Bil
6.2%
AccommodationRM1.9Bil
5.5%
Note: % -Y-o-Y growth
Manufacturing
Petroleum, chemical, rubber and plastic
products Electrical, electronic and optical products
Non-metallic mineral products, basic metal and fabricated
metal productsTransport equipment, other manufacturing
and repair
Vegetable and animal oils & fats
Wood products, furniture, paper products and
printing
Beverages and tobacco products Text i les,wearing
apparel and leather products
RM20.6Bil5.0%
RM18.3Bil8.7%
RM8.6Bil6.5%
RM6.8Bil8.1%
RM3.8Bil2.4%
RM1.2Bil9.1%
RM2.5Bil4.5%
RM6.4Bil11.4%
Note: % -Y-o-Y growth Source: Department of Statistics, Malaysia
4MITI Tower, No. 7, Jalan Sultan Haji Ahmad Shah, 50480 Kuala Lumpur, Malaysia Tel: +603 - 8000 8000 Fax: +603 - 6202 9446
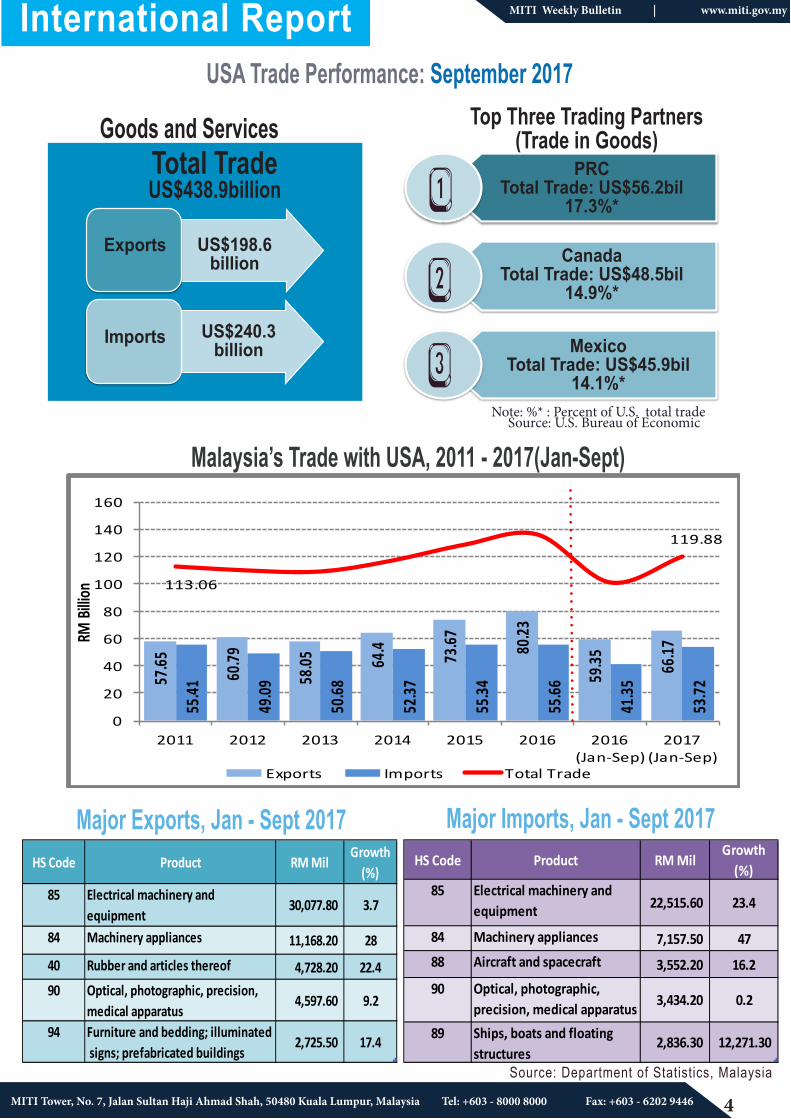
International Report
Source: Department of Statistics, Malaysia
USA Trade Performance: September 2017
Source: U.S. Bureau of Economic Note: %* : Percent of U.S. total trade
Exports US$195.3 billion
Total Trade US$438.9billion
US$198.6 billion
Malaysia’s Trade with USA, 2011 - 2017(Jan-Sept)
Major Exports, Jan - Sept 2017 Major Imports, Jan - Sept 2017HS Code Product RM Mil
Growth(%)
85 Electrical machinery andequipment
30,077.80 3.7
84 Machinery appliances 11,168.20 28
40 Rubber and articles thereof 4,728.20 22.490 Optical, photographic, precision,
medical apparatus4,597.60 9.2
94 Furniture and bedding; illuminated signs; prefabricated buildings
2,725.50 17.4
57.65 60.79
58.05 64
.4 73.67 80
.23
59.35 66
.17
55.41
49.09
50.68
52.37
55.34
55.66
41.35
53.72
113.06
119.88
0
20
40
60
80
100
120
140
160
2011 2012 2013 2014 2015 2016 2016(Jan-Sep)
2017(Jan-Sep)
RM B
illion
Exports Imports Total Trade
US$240.3billion
Imports
Exports
Top Three Trading Partners (Trade in Goods)
1
2
3
PRCTotal Trade: US$56.2bil
17.3%*
CanadaTotal Trade: US$48.5bil
14.9%*
MexicoTotal Trade: US$45.9bil
14.1%*
Goods and Services
HS Code Product RM MilGrowth
(%)85 Electrical machinery and
equipment 22,515.60 23.4
84 Machinery appliances 7,157.50 4788 Aircraft and spacecraft 3,552.20 16.290 Optical, photographic,
precision, medical apparatus 3,434.20 0.2
89 Ships, boats and floating structures
2,836.30 12,271.30
MITI Weekly Bulletin | www.miti.gov.my
5MITI Tower, No. 7, Jalan Sultan Haji Ahmad Shah, 50480 Kuala Lumpur, Malaysia Tel: +603 - 8000 8000 Fax: +603 - 6202 9446
MITI Weekly Bulletin | www.miti.gov.my
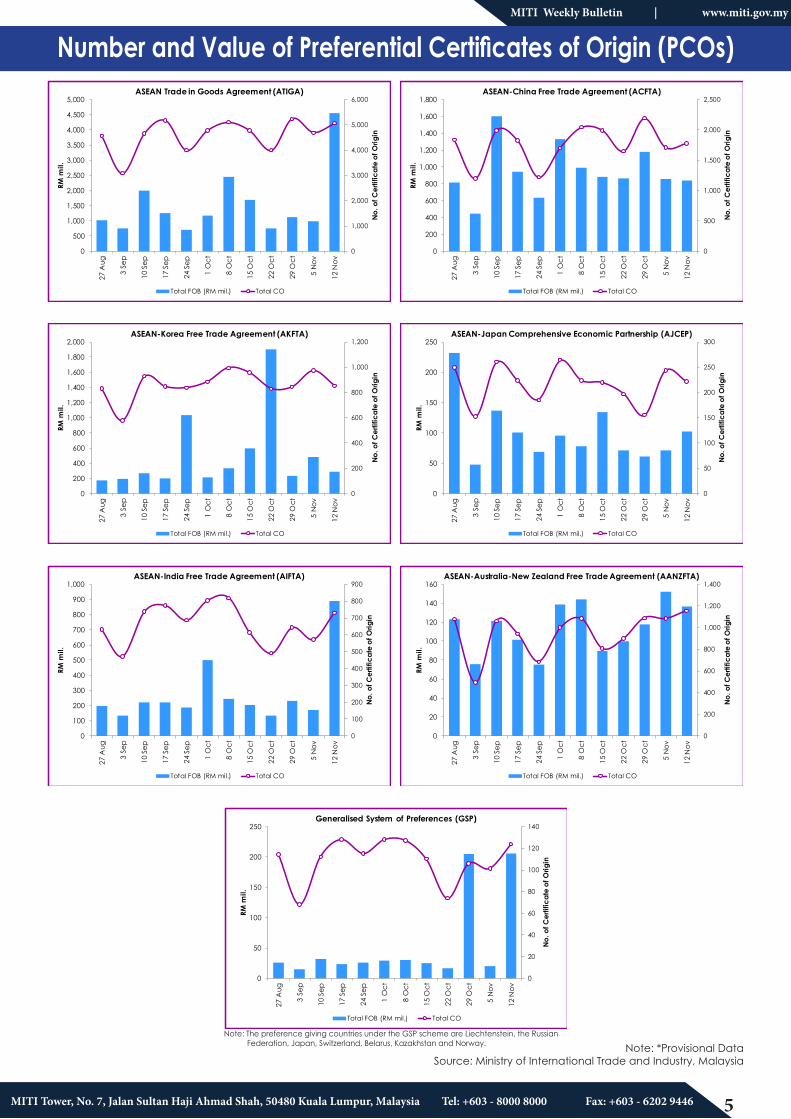
Note: *Provisional Data Source: Ministry of International Trade and Industry, Malaysia
0
20
40
60
80
100
120
140
0
50
100
150
200
250
27 A
ug
3 Se
p
10 S
ep
17 S
ep
24 S
ep
1 O
ct
8 O
ct
15 O
ct
22 O
ct
29 O
ct
5 N
ov
12 N
ov
No.
of C
ertif
icat
e of
Orig
in
RM m
il.
Generalised System of Preferences (GSP)
Total FOB (RM mil.) Total CO
Note: The preference giving countries under the GSP scheme are Liechtenstein, the Russian Federation, Japan, Switzerland, Belarus, Kazakhstan and Norway.
Number and Value of Preferential Certificates of Origin (PCOs)
0
1,000
2,000
3,000
4,000
5,000
6,000
0
500
1,000
1,500
2,000
2,500
3,000
3,500
4,000
4,500
5,00027
Aug
3 Se
p
10 S
ep
17 S
ep
24 S
ep
1 O
ct
8 O
ct
15 O
ct
22 O
ct
29 O
ct
5 N
ov
12 N
ov
No.
of C
ertif
icat
e of
Orig
in
RM m
il.
ASEAN Trade in Goods Agreement (ATIGA)
Total FOB (RM mil.) Total CO
0
500
1,000
1,500
2,000
2,500
0
200
400
600
800
1,000
1,200
1,400
1,600
1,800
27 A
ug
3 Se
p
10 S
ep
17 S
ep
24 S
ep
1 O
ct
8 O
ct
15 O
ct
22 O
ct
29 O
ct
5 N
ov
12 N
ov
No.
of C
ertif
icat
e of
Orig
in
RM m
il.
ASEAN-China Free Trade Agreement (ACFTA)
Total FOB (RM mil.) Total CO
0
200
400
600
800
1,000
1,200
0
200
400
600
800
1,000
1,200
1,400
1,600
1,800
2,000
27 A
ug
3 Se
p
10 S
ep
17 S
ep
24 S
ep
1 O
ct
8 O
ct
15 O
ct
22 O
ct
29 O
ct
5 N
ov
12 N
ov
No.
of C
ertif
icat
e of
Orig
in
RM m
il.
ASEAN-Korea Free Trade Agreement (AKFTA)
Total FOB (RM mil.) Total CO
0
50
100
150
200
250
300
0
50
100
150
200
250
27 A
ug
3 Se
p
10 S
ep
17 S
ep
24 S
ep
1 O
ct
8 O
ct
15 O
ct
22 O
ct
29 O
ct
5 N
ov
12 N
ov
No.
of C
ertif
icat
e of
Orig
in
RM m
il.
ASEAN-Japan Comprehensive Economic Partnership (AJCEP)
Total FOB (RM mil.) Total CO
0
100
200
300
400
500
600
700
800
900
0
100
200
300
400
500
600
700
800
900
1,000
27 A
ug
3 Se
p
10 S
ep
17 S
ep
24 S
ep
1 O
ct
8 O
ct
15 O
ct
22 O
ct
29 O
ct
5 N
ov
12 N
ov
No.
of C
ertif
icat
e of
Orig
in
RM m
il.
ASEAN-India Free Trade Agreement (AIFTA)
Total FOB (RM mil.) Total CO
0
200
400
600
800
1,000
1,200
1,400
0
20
40
60
80
100
120
140
160
27 A
ug
3 Se
p
10 S
ep
17 S
ep
24 S
ep
1 O
ct
8 O
ct
15 O
ct
22 O
ct
29 O
ct
5 N
ov
12 N
ov
No.
of C
ertif
icat
e of
Orig
in
RM m
il.
ASEAN-Australia-New Zealand Free Trade Agreement (AANZFTA)
Total FOB (RM mil.) Total CO
6MITI Tower, No. 7, Jalan Sultan Haji Ahmad Shah, 50480 Kuala Lumpur, Malaysia Tel: +603 - 8000 8000 Fax: +603 - 6202 9446
MITI Weekly Bulletin | www.miti.gov.myMITI Weekly Bulletin | www.miti.gov.my
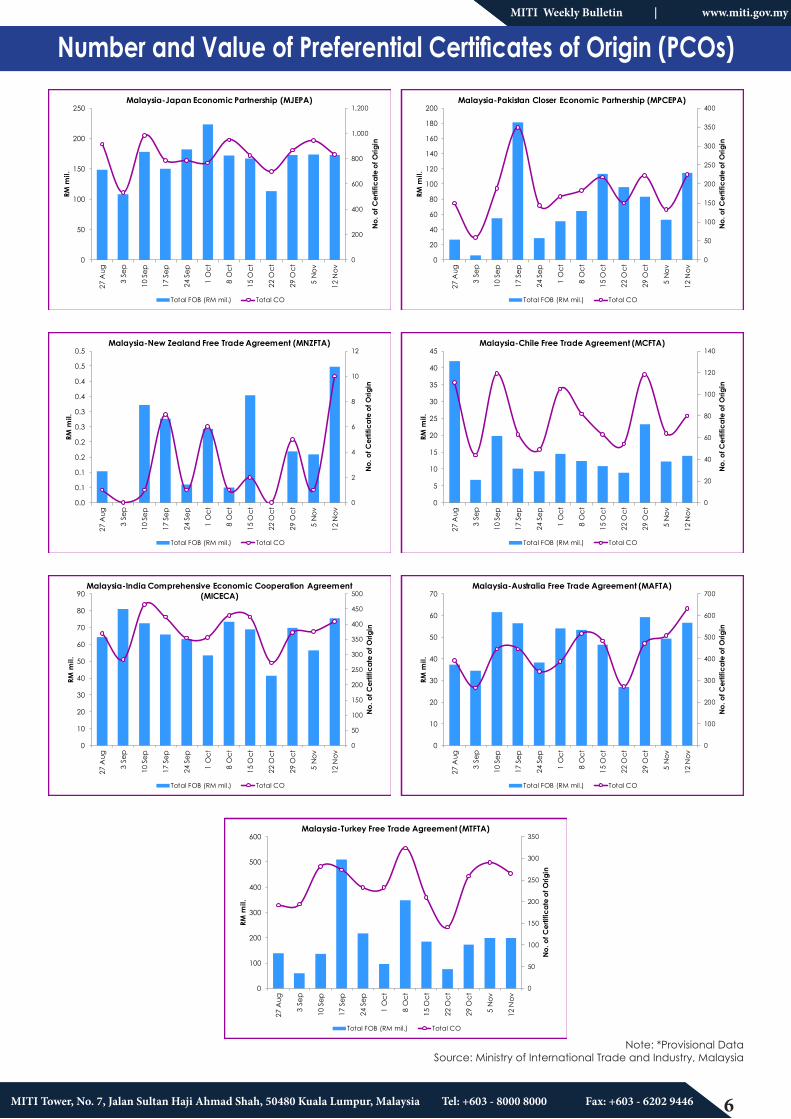
Number and Value of Preferential Certificates of Origin (PCOs)
0
200
400
600
800
1,000
1,200
0
50
100
150
200
25027
Aug
3 Se
p
10 S
ep
17 S
ep
24 S
ep
1 O
ct
8 O
ct
15 O
ct
22 O
ct
29 O
ct
5 N
ov
12 N
ov
No.
of C
ertif
icat
e of
Orig
in
RM m
il.
Malaysia-Japan Economic Partnership (MJEPA)
Total FOB (RM mil.) Total CO
0
50
100
150
200
250
300
350
400
0
20
40
60
80
100
120
140
160
180
200
27 A
ug
3 Se
p
10 S
ep
17 S
ep
24 S
ep
1 O
ct
8 O
ct
15 O
ct
22 O
ct
29 O
ct
5 N
ov
12 N
ov
No.
of C
ertif
icat
e of
Orig
in
RM m
il.
Malaysia-Pakistan Closer Economic Partnership (MPCEPA)
Total FOB (RM mil.) Total CO
0
2
4
6
8
10
12
0.0
0.1
0.1
0.2
0.2
0.3
0.3
0.4
0.4
0.5
0.5
27 A
ug
3 Se
p
10 S
ep
17 S
ep
24 S
ep
1 O
ct
8 O
ct
15 O
ct
22 O
ct
29 O
ct
5 N
ov
12 N
ov
No.
of C
ertif
icat
e of
Orig
in
RM m
il.
Malaysia-New Zealand Free Trade Agreement (MNZFTA)
Total FOB (RM mil.) Total CO
0
20
40
60
80
100
120
140
0
5
10
15
20
25
30
35
40
45
27 A
ug
3 Se
p
10 S
ep
17 S
ep
24 S
ep
1 O
ct
8 O
ct
15 O
ct
22 O
ct
29 O
ct
5 N
ov
12 N
ov
No.
of C
ertif
icat
e of
Orig
in
RM m
il.
Malaysia-Chile Free Trade Agreement (MCFTA)
Total FOB (RM mil.) Total CO
0
50
100
150
200
250
300
350
400
450
500
0
10
20
30
40
50
60
70
80
90
27 A
ug
3 Se
p
10 S
ep
17 S
ep
24 S
ep
1 O
ct
8 O
ct
15 O
ct
22 O
ct
29 O
ct
5 N
ov
12 N
ov
No.
of C
ertif
icat
e of
Orig
in
RM m
il.
Malaysia-India Comprehensive Economic Cooperation Agreement (MICECA)
Total FOB (RM mil.) Total CO
0
100
200
300
400
500
600
700
0
10
20
30
40
50
60
70
27 A
ug
3 Se
p
10 S
ep
17 S
ep
24 S
ep
1 O
ct
8 O
ct
15 O
ct
22 O
ct
29 O
ct
5 N
ov
12 N
ov
No.
of C
ertif
icat
e of
Orig
in
RM m
il.
Malaysia-Australia Free Trade Agreement (MAFTA)
Total FOB (RM mil.) Total CO
0
50
100
150
200
250
300
350
0
100
200
300
400
500
600
27 A
ug
3 Se
p
10 S
ep
17 S
ep
24 S
ep
1 O
ct
8 O
ct
15 O
ct
22 O
ct
29 O
ct
5 N
ov
12 N
ov
No.
of C
ertif
icat
e of
Orig
in
RM m
il.
Malaysia-Turkey Free Trade Agreement (MTFTA)
Total FOB (RM mil.) Total CO
Note: *Provisional Data Source: Ministry of International Trade and Industry, Malaysia
7MITI Tower, No. 7, Jalan Sultan Haji Ahmad Shah, 50480 Kuala Lumpur, Malaysia Tel: +603 - 8000 8000 Fax: +603 - 6202 9446
MITI Weekly Bulletin | www.miti.gov.myMITI Weekly Bulletin | www.miti.gov.my
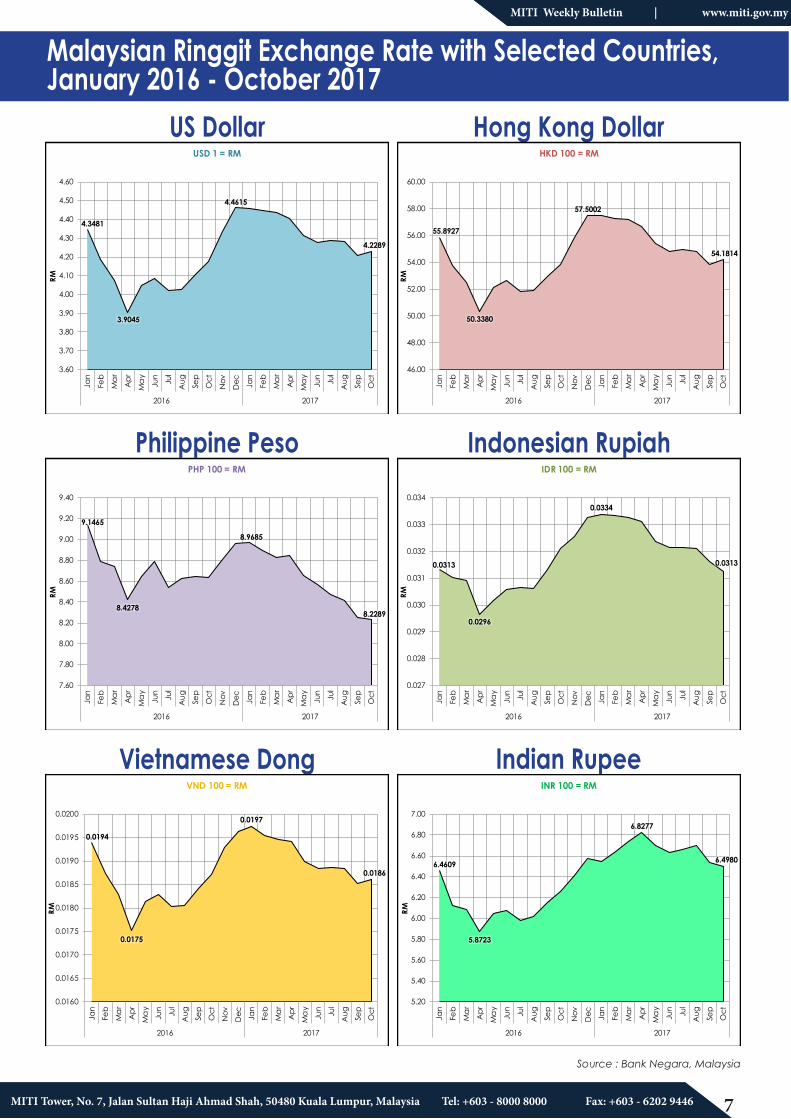
Source : Bank Negara, Malaysia
Malaysian Ringgit Exchange Rate with Selected Countries,January 2016 - October 2017
US Dollar
Philippine Peso
Vietnamese Dong
Hong Kong Dollar
Indonesian Rupiah
Indian Rupee
4.3481
3.9045
4.4615
4.2289
3.60
3.70
3.80
3.90
4.00
4.10
4.20
4.30
4.40
4.50
4.60
Jan
Feb
Ma
r
Apr
Ma
y
Jun Jul
Aug Se
p
Oct
Nov
Dec Ja
n
Feb
Ma
r
Apr
Ma
y
Jun Jul
Aug Se
p
Oct
2016 2017
RM
USD 1 = RM
9.1465
8.4278
8.9685
8.2289
7.60
7.80
8.00
8.20
8.40
8.60
8.80
9.00
9.20
9.40
Jan
Feb
Ma
r
Apr
Ma
y
Jun Jul
Aug Se
p
Oct
Nov
Dec Ja
n
Feb
Ma
r
Apr
Ma
y
Jun Jul
Aug Se
p
Oct
2016 2017
RM
PHP 100 = RM
0.0194
0.0175
0.0197
0.0186
0.0160
0.0165
0.0170
0.0175
0.0180
0.0185
0.0190
0.0195
0.0200
Jan
Feb
Ma
r
Apr
Ma
y
Jun Jul
Aug Se
p
Oct
Nov
Dec Ja
n
Feb
Ma
r
Apr
Ma
y
Jun Jul
Aug Se
p
Oct
2016 2017
RM
VND 100 = RM
55.8927
50.3380
57.5002
54.1814
46.00
48.00
50.00
52.00
54.00
56.00
58.00
60.00
Jan
Feb
Ma
r
Apr
Ma
y
Jun Jul
Aug Se
p
Oct
Nov
Dec Ja
n
Feb
Ma
r
Apr
Ma
y
Jun Jul
Aug Se
p
Oct
2016 2017RM
HKD 100 = RM
0.0313
0.0296
0.0334
0.0313
0.027
0.028
0.029
0.030
0.031
0.032
0.033
0.034
Jan
Feb
Ma
r
Apr
Ma
y
Jun Jul
Aug Se
p
Oct
Nov
Dec Ja
n
Feb
Ma
r
Apr
Ma
y
Jun Jul
Aug Se
p
Oct
2016 2017
RM
IDR 100 = RM
6.4609
5.8723
6.8277
6.4980
5.20
5.40
5.60
5.80
6.00
6.20
6.40
6.60
6.80
7.00
Jan
Feb
Ma
r
Apr
Ma
y
Jun Jul
Aug Se
p
Oct
Nov
Dec Ja
n
Feb
Ma
r
Apr
Ma
y
Jun Jul
Aug Se
p
Oct
2016 2017
RM
INR 100 = RM
8MITI Tower, No. 7, Jalan Sultan Haji Ahmad Shah, 50480 Kuala Lumpur, Malaysia Tel: +603 - 8000 8000 Fax: +603 - 6202 9446
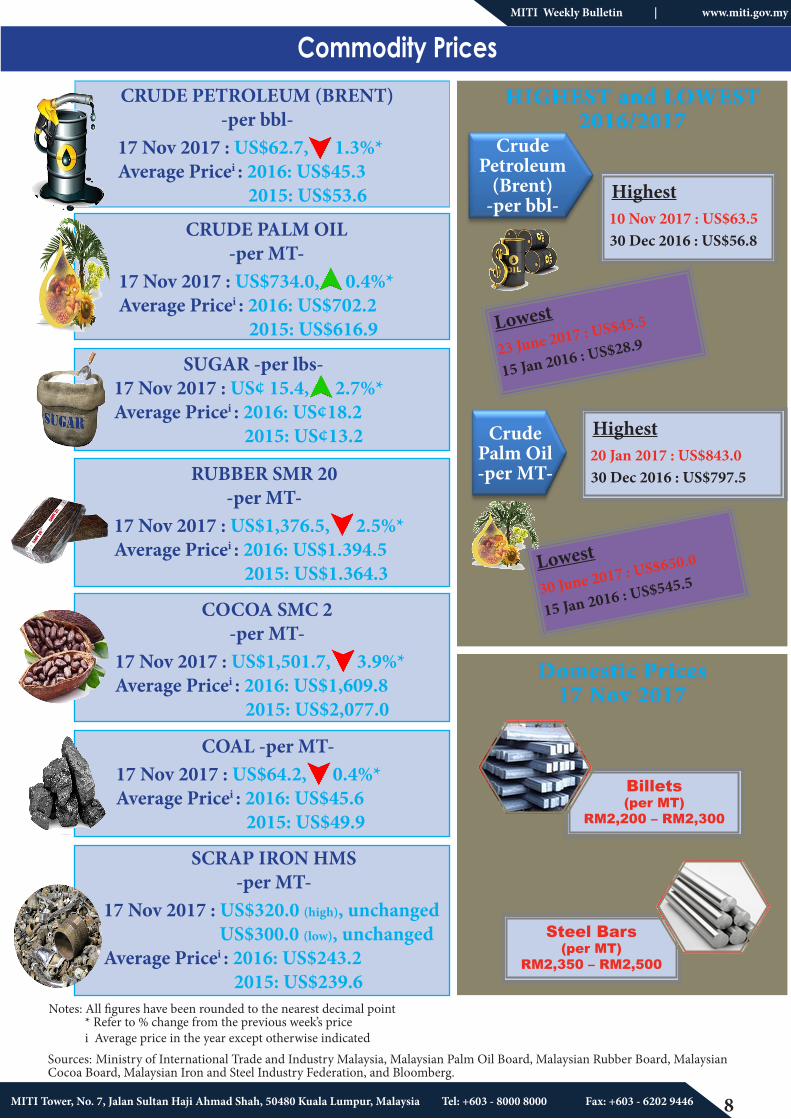
Sources: Ministry of International Trade and Industry Malaysia, Malaysian Palm Oil Board, Malaysian Rubber Board, Malaysian Cocoa Board, Malaysian Iron and Steel Industry Federation, and Bloomberg.
Commodity Prices
Notes: All figures have been rounded to the nearest decimal point * Refer to % change from the previous week’s price i Average price in the year except otherwise indicated
CRUDE PETROLEUM (BRENT)-per bbl-
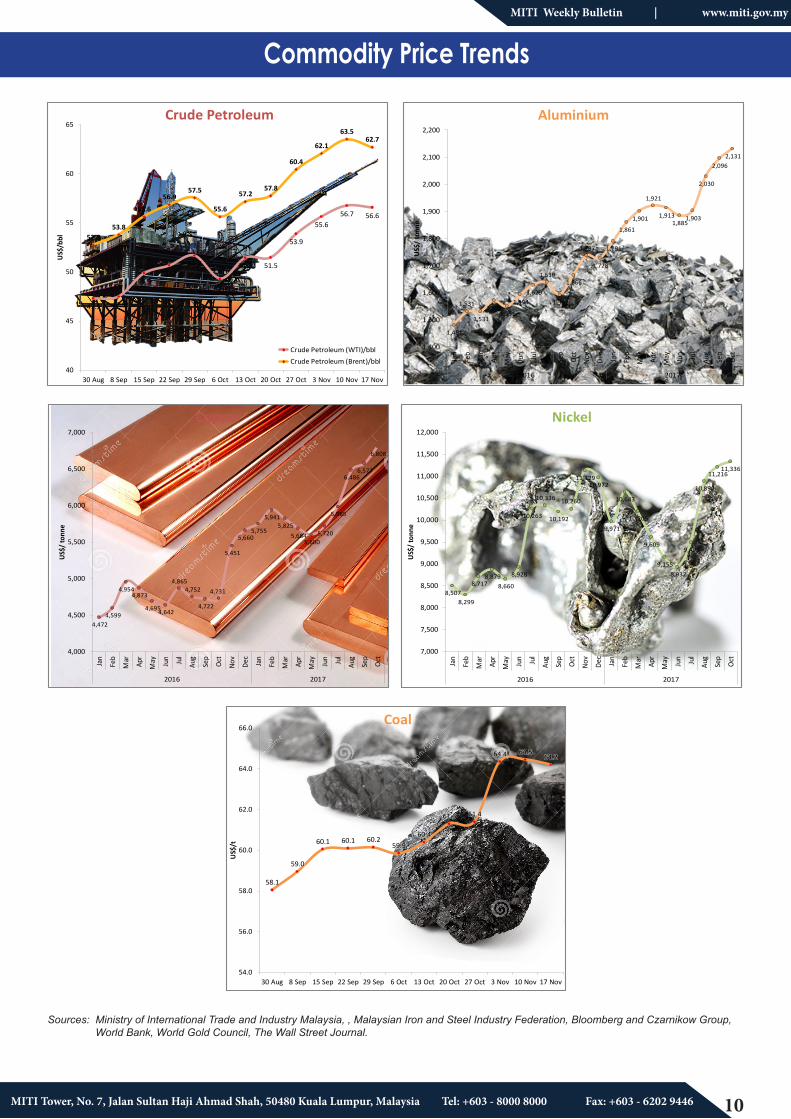
17 Nov 2017 : US$62.7, 1.3%*Average Pricei : 2016: US$45.3 2015: US$53.6
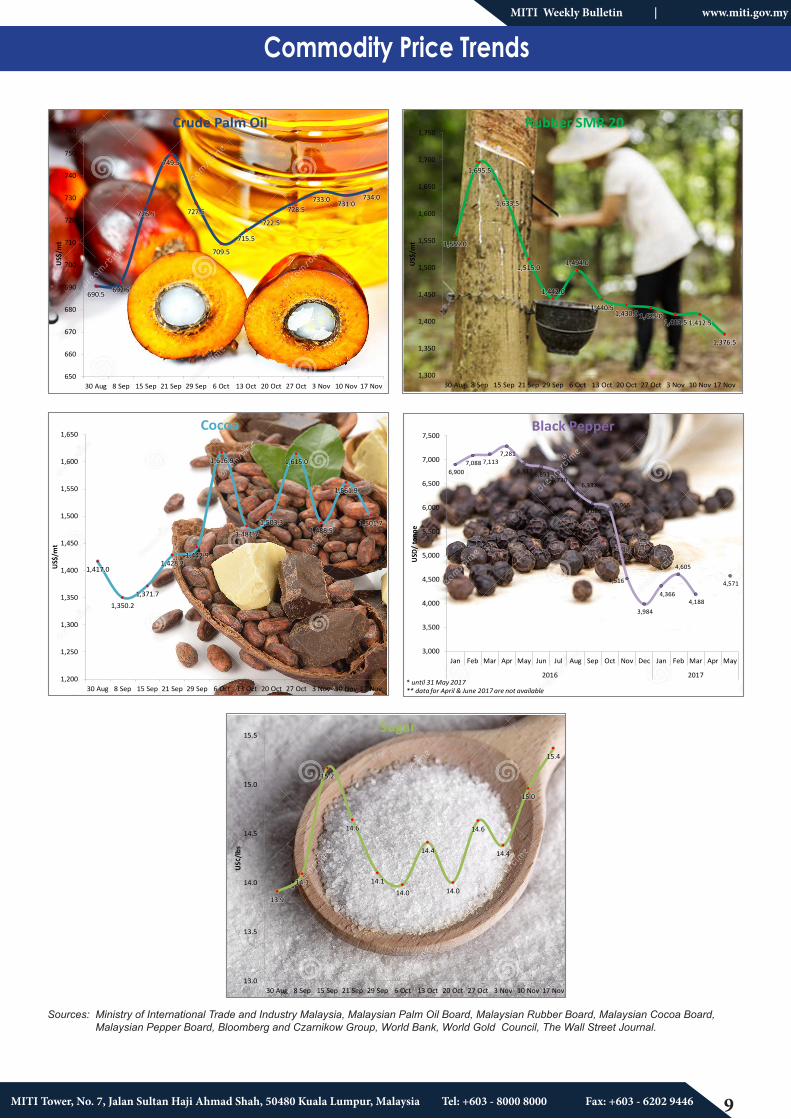
CRUDE PALM OIL-per MT-
17 Nov 2017 : US$734.0, 0.4%*Average Pricei : 2016: US$702.2 2015: US$616.9
RUBBER SMR 20-per MT-
17 Nov 2017 : US$1,376.5, 2.5%*Average Pricei : 2016: US$1.394.5 2015: US$1.364.3
COAL -per MT-17 Nov 2017 : US$64.2, 0.4%*Average Pricei : 2016: US$45.6 2015: US$49.9
COCOA SMC 2-per MT-
17 Nov 2017 : US$1,501.7, 3.9%*Average Pricei : 2016: US$1,609.8 2015: US$2,077.0
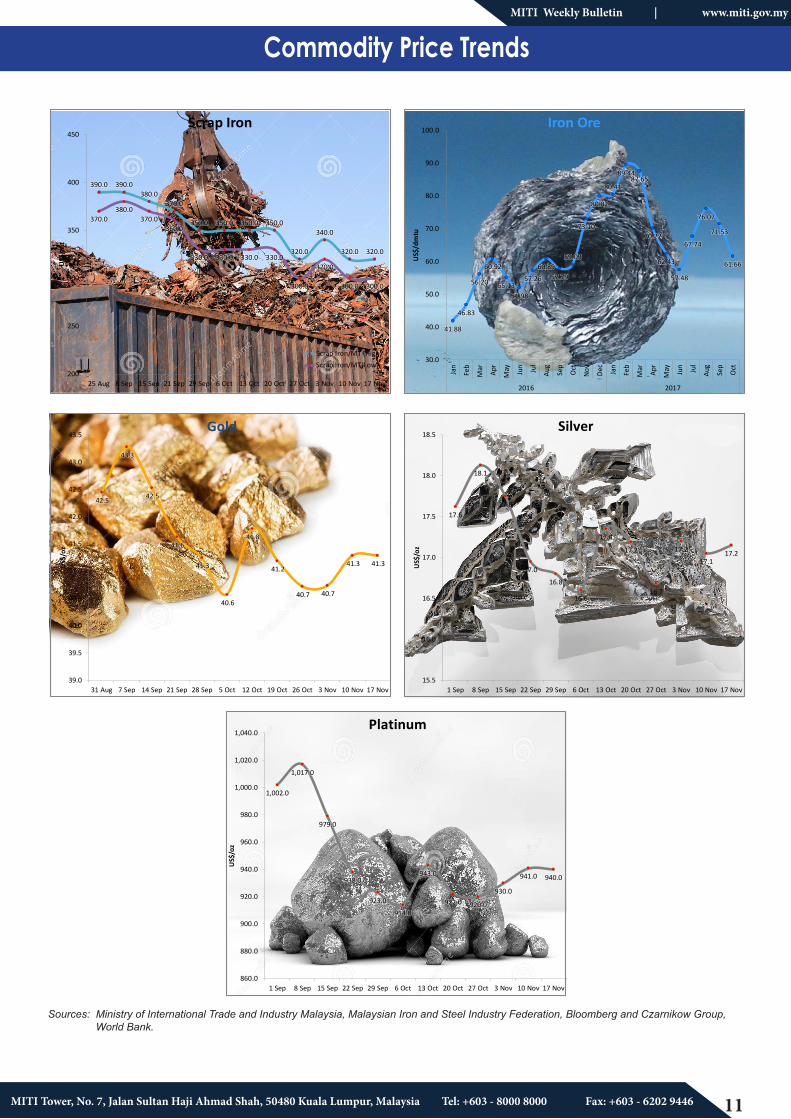
SCRAP IRON HMS-per MT-
17 Nov 2017 : US$320.0 (high), unchanged US$300.0 (low), unchangedAverage Pricei : 2016: US$243.2 2015: US$239.6
HIGHEST and LOWEST 2016/2017
Highest 10 Nov 2017 : US$63.5 30 Dec 2016 : US$56.8
Lowest
23 June 2017 : US$45.5
15 Jan 2016 : US$28.9
Crude Petroleum
(Brent)-per bbl-
Highest 20 Jan 2017 : US$843.0 30 Dec 2016 : US$797.5
Lowest
15 Jan 2016 : US$545.5 30 June 2017 : US$650.0
Crude Palm Oil -per MT-
Domestic Prices17 Nov 2017
Steel Bars(per MT)
RM2,350 – RM2,500
Billets(per MT)
RM2,200 – RM2,300
SUGAR -per lbs-17 Nov 2017 : US¢ 15.4, 2.7%*Average Pricei : 2016: US¢18.2 2015: US¢13.2
MITI Weekly Bulletin | www.miti.gov.my
9MITI Tower, No. 7, Jalan Sultan Haji Ahmad Shah, 50480 Kuala Lumpur, Malaysia Tel: +603 - 8000 8000 Fax: +603 - 6202 9446
MITI Weekly Bulletin | www.miti.gov.my
Commodity Price Trends
Sources: Ministry of International Trade and Industry Malaysia, Malaysian Palm Oil Board, Malaysian Rubber Board, Malaysian Cocoa Board, Malaysian Pepper Board, Bloomberg and Czarnikow Group, World Bank, World Gold Council, The Wall Street Journal.
690.5 692.5
726.5
749.5
727.5
709.5
715.5
722.5
728.5733.0 731.0
734.0
650
660
670
680
690
700
710
720
730
740
750
760
30 Aug 8 Sep 15 Sep 21 Sep 29 Sep 6 Oct 13 Oct 20 Oct 27 Oct 3 Nov 10 Nov 17 Nov
US$
/mt
Crude Palm Oil
1,417.0
1,350.21,371.7
1,428.21,442.9
1,616.9
1,481.71,503.3
1,615.0
1,488.5
1,561.9
1,501.7
1,200
1,250
1,300
1,350
1,400
1,450
1,500
1,550
1,600
1,650
30 Aug 8 Sep 15 Sep 21 Sep 29 Sep 6 Oct 13 Oct 20 Oct 27 Oct 3 Nov 10 Nov 17 Nov
US$
/mt
Cocoa
13.9
14.1
15.2
14.6
14.114.0
14.4
14.0
14.6
14.4
15.0
15.4
13.0
13.5
14.0
14.5
15.0
15.5
30 Aug 8 Sep 15 Sep 21 Sep 29 Sep 6 Oct 13 Oct 20 Oct 27 Oct 3 Nov 10 Nov 17 Nov
US¢
/lbs
Sugar
1,559.0
1,695.5
1,633.5
1,515.0
1,442.0
1,494.0
1,440.51,430.0 1,425.0
1,413.5 1,412.5
1,376.5
1,300
1,350
1,400
1,450
1,500
1,550
1,600
1,650
1,700
1,750
30 Aug 8 Sep 15 Sep 21 Sep 29 Sep 6 Oct 13 Oct 20 Oct 27 Oct 3 Nov 10 Nov 17 Nov
US$
/mt
Rubber SMR 20
6,900 7,088 7,113
7,281
6,917 6,851 6,730
6,337
6,085 5,965
4,516
3,984
4,366
4,605
4,188
4,571
3,000
3,500
4,000
4,500
5,000
5,500
6,000
6,500
7,000
7,500
Jan Feb Mar Apr May Jun Jul Aug Sep Oct Nov Dec Jan Feb Mar Apr May
2016 2017
USD
/ to
nne
Black Pepper
* until 31 May 2017** data for April & June 2017 are not available
10MITI Tower, No. 7, Jalan Sultan Haji Ahmad Shah, 50480 Kuala Lumpur, Malaysia Tel: +603 - 8000 8000 Fax: +603 - 6202 9446
Sources: Ministry of International Trade and Industry Malaysia, , Malaysian Iron and Steel Industry Federation, Bloomberg and Czarnikow Group, World Bank, World Gold Council, The Wall Street Journal.
58.1
59.0
60.1 60.1 60.259.9
60.4
61.3 61.4
64.4 64.564.2
54.0
56.0
58.0
60.0
62.0
64.0
66.0
30 Aug 8 Sep 15 Sep 22 Sep 29 Sep 6 Oct 13 Oct 20 Oct 27 Oct 3 Nov 10 Nov 17 Nov
US$
/t
Coal
1,481
1,531
1,531
1,571 1,551
1,594 1,629
1,639
1,592
1,666
1,737
1,728
1,791
1,861
1,901
1,921
1,913 1,885
1,903
2,030
2,096 2,131
1,400
1,500
1,600
1,700
1,800
1,900
2,000
2,100
2,200
Jan
Feb
Mar Apr
May Jun Jul
Aug
Sep
Oct
Nov
Dec
Jan
Feb
Mar Apr
May Jun Jul
Aug
Sep
Oct
2016 2017
US$
/ to
nne
Aluminium
4,472 4,599
4,954 4,873
4,695 4,642
4,865 4,752
4,722
4,731
5,451
5,660 5,755
5,941 5,825
5,684 5,600
5,720
5,985
6,486 6,577
6,808
4,000
4,500
5,000
5,500
6,000
6,500
7,000
Jan
Feb
Mar Apr
May Jun Jul
Aug
Sep
Oct
Nov
Dec
Jan
Feb
Mar Apr
May Jun Jul
Aug
Sep
Oct
2016 2017
US$
/ to
nne
Copper
8,507 8,299
8,717 8,879
8,660
8,928
10,263
10,336
10,192
10,260
11,129 10,972
9,971
10,643
10,205
9,609
9,155 8,932
9,491
10,890
11,216 11,336
7,000
7,500
8,000
8,500
9,000
9,500
10,000
10,500
11,000
11,500
12,000
Jan
Feb
Mar Apr
May Jun Jul
Aug
Sep
Oct
Nov
Dec
Jan
Feb
Mar Apr
May Jun Jul
Aug
Sep
Oct
2016 2017
US$
/ to
nne
Nickel
47.3 47.5
49.950.7
51.7
49.3
51.5 51.5
53.9
55.656.7 56.6
52.853.8
55.6
56.957.5
55.6
57.257.8
60.4
62.1
63.562.7
40
45
50
55
60
65
30 Aug 8 Sep 15 Sep 22 Sep 29 Sep 6 Oct 13 Oct 20 Oct 27 Oct 3 Nov 10 Nov 17 Nov
US$
/bbl
Crude Petroleum
Crude Petroleum (WTI)/bbl Crude Petroleum (Brent)/bbl
Commodity Price TrendsMITI Weekly Bulletin | www.miti.gov.my
11MITI Tower, No. 7, Jalan Sultan Haji Ahmad Shah, 50480 Kuala Lumpur, Malaysia Tel: +603 - 8000 8000 Fax: +603 - 6202 9446
MITI Weekly Bulletin | www.miti.gov.my
Sources: Ministry of International Trade and Industry Malaysia, Malaysian Iron and Steel Industry Federation, Bloomberg and Czarnikow Group, World Bank.
1,002.0
1,017.0
979.0
938.0
923.0
914.0
943.0
922.0 920.0
930.0
941.0 940.0
860.0
880.0
900.0
920.0
940.0
960.0
980.0
1,000.0
1,020.0
1,040.0
1 Sep 8 Sep 15 Sep 22 Sep 29 Sep 6 Oct 13 Oct 20 Oct 27 Oct 3 Nov 10 Nov 17 Nov
US$
/oz
Platinum
390.0 390.0380.0
370.0
350.0 350.0 350.0 350.0
320.0
340.0
320.0 320.0
370.0380.0
370.0360.0
330.0 330.0 330.0 330.0
300.0
320.0
300.0 300.0
200
250
300
350
400
450
25 Aug 8 Sep 15 Sep 21 Sep 29 Sep 6 Oct 13 Oct 20 Oct 27 Oct 3 Nov 10 Nov 17 Nov
US$
/mt
Scrap Iron
Scrap Iron/MT (High) Scrap Iron/MT(Low)
41.88
46.83
56.20
60.92
55.1351.98
57.26
60.8957.79
59.09
73.10
80.02
80.41
89.4487.65
70.22
62.43
57.48
67.74
76.07
71.53
61.66
30.0
40.0
50.0
60.0
70.0
80.0
90.0
100.0
Jan
Feb
Mar Apr
May Jun Jul
Aug
Sep
Oct
Nov
Dec
Jan
Feb
Mar Apr
May Jun Jul
Aug
Sep
Oct
2016 2017
US$
/dm
tu
Iron Ore
17.6
18.1
17.8
17.0
16.8
16.6
17.4
17.2
16.7
17.2
17.117.2
15.5
16.0
16.5
17.0
17.5
18.0
18.5
1 Sep 8 Sep 15 Sep 22 Sep 29 Sep 6 Oct 13 Oct 20 Oct 27 Oct 3 Nov 10 Nov 17 Nov
US$
/oz
Silver
42.5
43.3
42.5
41.6
41.3
40.6
41.8
41.2
40.7 40.7
41.3 41.3
39.0
39.5
40.0
40.5
41.0
41.5
42.0
42.5
43.0
43.5
31 Aug 7 Sep 14 Sep 21 Sep 28 Sep 5 Oct 12 Oct 19 Oct 26 Oct 3 Nov 10 Nov 17 Nov
US$
/oz
Gold
Commodity Price Trends
12MITI Tower, No. 7, Jalan Sultan Haji Ahmad Shah, 50480 Kuala Lumpur, Malaysia Tel: +603 - 8000 8000 Fax: +603 - 6202 9446
MITI Weekly Bulletin | www.miti.gov.my
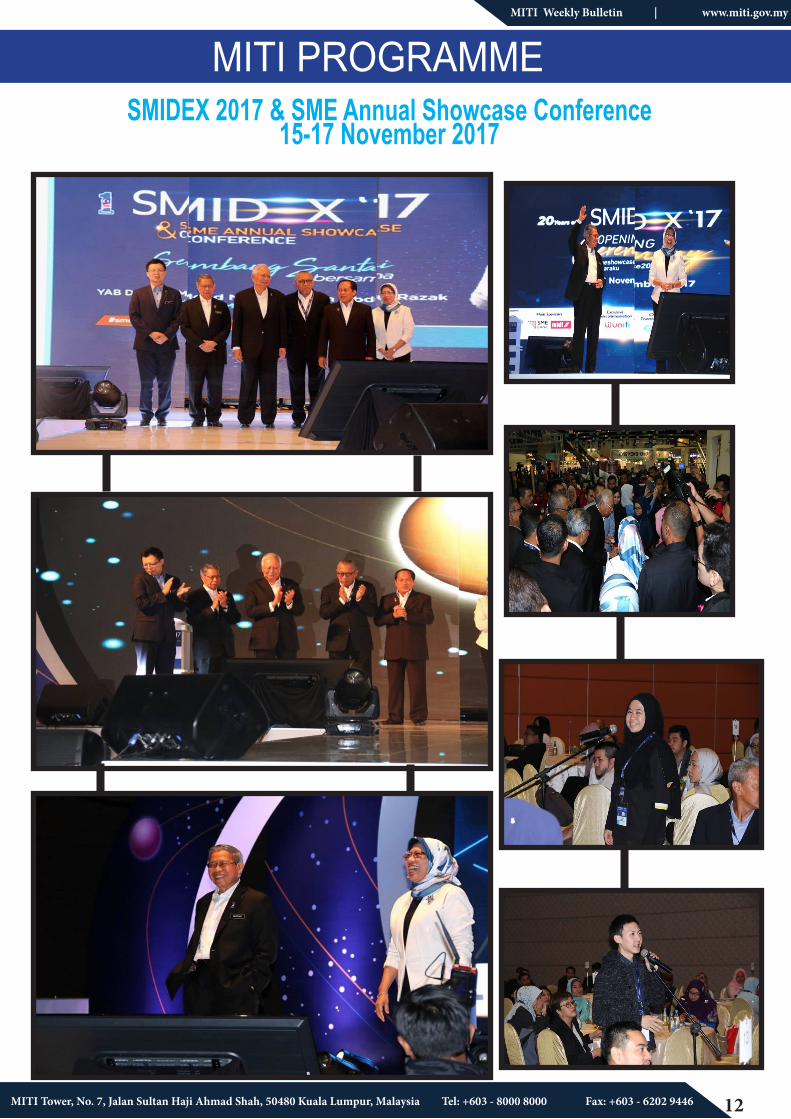
MITI PROGRAMMEMITI PROGRAMMEMITI PROGRAMMEMITI PROGRAMME
SMIDEX 2017 & SME Annual Showcase Conference 15-17 November 2017
13MITI Tower, No. 7, Jalan Sultan Haji Ahmad Shah, 50480 Kuala Lumpur, Malaysia Tel: +603 - 8000 8000 Fax: +603 - 6202 9446
MITI Weekly Bulletin | www.miti.gov.my
MITI PROGRAMME
14MITI Tower, No. 7, Jalan Sultan Haji Ahmad Shah, 50480 Kuala Lumpur, Malaysia Tel: +603 - 8000 8000 Fax: +603 - 6202 9446
MITI Weekly Bulletin | www.miti.gov.my
of Technical Terms
Source: http://www.miti.gov.my/index.php/glossary
Sustainable GrowthA term much used by environmentalists, meaning economic growth that can continue in the long term without non-renewable resources being used up or pollution becoming intolerable. Mainstream economists use the term, too, to describe a rate of growth that an economy can sustain indefinitely without causing a rise in inflation.
Swiss FormulaA ‘non-linear formula’ which reduces high tariffs, tariff peaks and tariff escalations. Higher tariffs will be subject to greater reductions compared to lower tariffs. A smaller coefficient would result in a deeper cut compared to a larger coefficient.
Swiss Formula :
C : coefficient to determine tariff reductions in each country;
t0 : The existing tariff rate for a particular country; and
t1 : The bound tariff rate for that country.
Tariff / DutyCustoms duties on merchandise imports. Levied either on an ad valorem basis (percentage of value) or on a specific basis (e.g. $7 per 100 kgs.). Tariffs give price advantage to similar locally-produced goods and raise revenues for the government.
Tariff CappingThe maximum duty allowed after applying the formula for tariff reduction.
Tariff EscalationLow tariffs for raw or unfinished materials, somewhat higher for semi-finished products and highest for finished products. Generally adopted by industrialized countries to restrict import of finished goods from developing countries.
Tariff LineDescription of a single product in a national tariff schedule, together with the applicable tariff/duty rate.
Tariff PeaksRelatively high tariffs, usually on “sensitive” products, amidst generally low tariff levels. For devel-oped countries, tariffs of 15% and above are generally recognised as “tariff peaks”.
15MITI Tower, No. 7, Jalan Sultan Haji Ahmad Shah, 50480 Kuala Lumpur, Malaysia Tel: +603 - 8000 8000 Fax: +603 - 6202 9446
Announcement
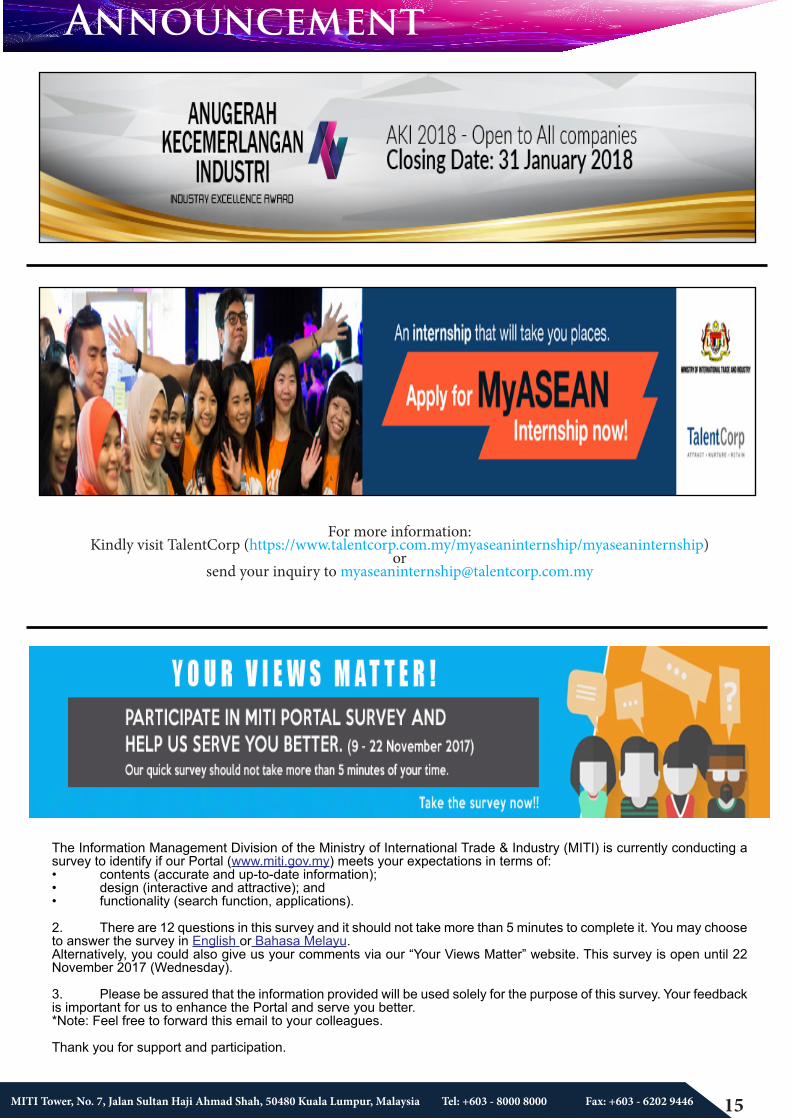
For more information:Kindly visit TalentCorp (https://www.talentcorp.com.my/myaseaninternship/myaseaninternship)
or send your inquiry to [email protected]
The Information Management Division of the Ministry of International Trade & Industry (MITI) is currently conducting a survey to identify if our Portal (www.miti.gov.my) meets your expectations in terms of:• contents (accurate and up-to-date information);• design (interactive and attractive); and• functionality (search function, applications).
2. There are 12 questions in this survey and it should not take more than 5 minutes to complete it. You may choose to answer the survey in English or Bahasa Melayu. Alternatively, you could also give us your comments via our “Your Views Matter” website. This survey is open until 22 November 2017 (Wednesday).
3. Please be assured that the information provided will be used solely for the purpose of this survey. Your feedback is important for us to enhance the Portal and serve you better. *Note: Feel free to forward this email to your colleagues.
Thank you for support and participation.
16MITI Tower, No. 7, Jalan Sultan Haji Ahmad Shah, 50480 Kuala Lumpur, Malaysia Tel: +603 - 8000 8000 Fax: +603 - 6202 9446
MITI Weekly Bulletin | www.miti.gov.my
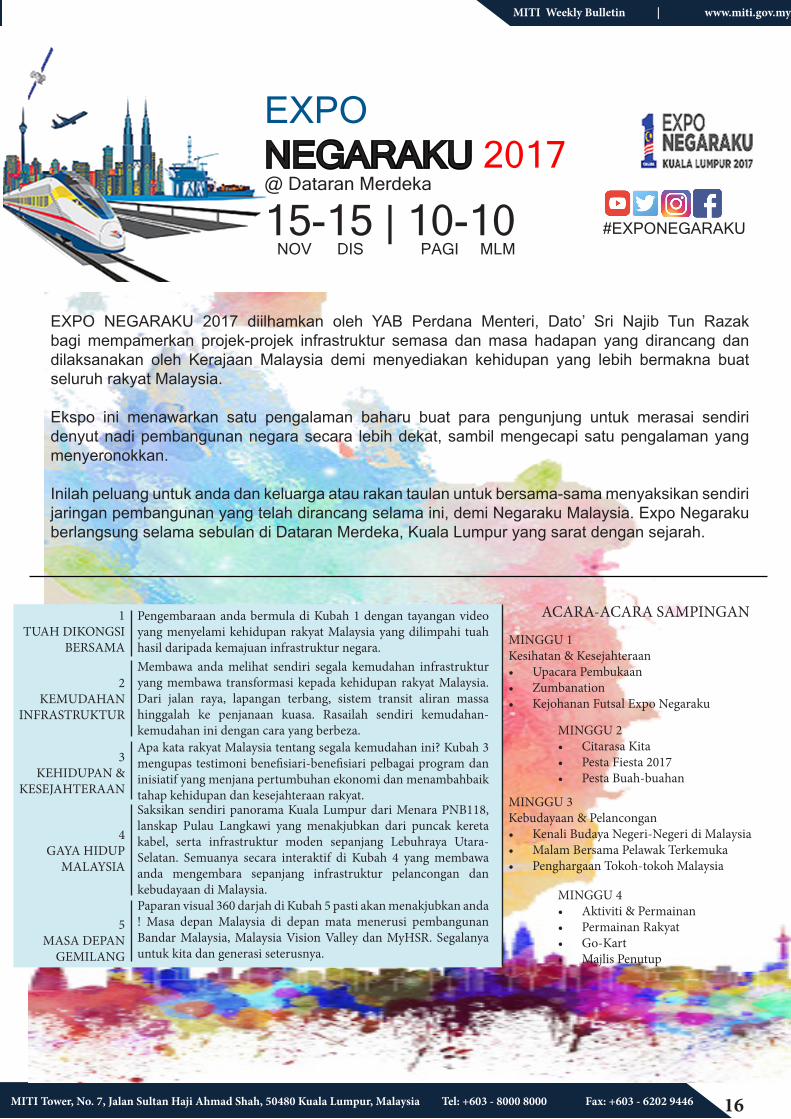
EXPONEGARAKU 2017@ Dataran Merdeka
#EXPONEGARAKU15-15 | 10-10 NOV DIS PAGI MLM
1 TUAH DIKONGSI
BERSAMA
Pengembaraan anda bermula di Kubah 1 dengan tayangan video yang menyelami kehidupan rakyat Malaysia yang dilimpahi tuah hasil daripada kemajuan infrastruktur negara.
Paparan visual 360 darjah di Kubah 5 pasti akan menakjubkan anda ! Masa depan Malaysia di depan mata menerusi pembangunan Bandar Malaysia, Malaysia Vision Valley dan MyHSR. Segalanya untuk kita dan generasi seterusnya.
5 MASA DEPAN
GEMILANG
Saksikan sendiri panorama Kuala Lumpur dari Menara PNB118, lanskap Pulau Langkawi yang menakjubkan dari puncak kereta kabel, serta infrastruktur moden sepanjang Lebuhraya Utara-Selatan. Semuanya secara interaktif di Kubah 4 yang membawa anda mengembara sepanjang infrastruktur pelancongan dan kebudayaan di Malaysia.
4 GAYA HIDUP
MALAYSIA
Apa kata rakyat Malaysia tentang segala kemudahan ini? Kubah 3 mengupas testimoni benefisiari-benefisiari pelbagai program dan inisiatif yang menjana pertumbuhan ekonomi dan menambahbaik tahap kehidupan dan kesejahteraan rakyat.
3KEHIDUPAN &
KESEJAHTERAAN
Membawa anda melihat sendiri segala kemudahan infrastruktur yang membawa transformasi kepada kehidupan rakyat Malaysia. Dari jalan raya, lapangan terbang, sistem transit aliran massa hinggalah ke penjanaan kuasa. Rasailah sendiri kemudahan-kemudahan ini dengan cara yang berbeza.
2KEMUDAHAN
INFRASTRUKTUR
ACARA-ACARA SAMPINGAN
MINGGU 1Kesihatan & Kesejahteraan• Upacara Pembukaan• Zumbanation• Kejohanan Futsal Expo Negaraku
MINGGU 3Kebudayaan & Pelancongan• Kenali Budaya Negeri-Negeri di Malaysia• Malam Bersama Pelawak Terkemuka• Penghargaan Tokoh-tokoh Malaysia
MINGGU 2• Citarasa Kita• Pesta Fiesta 2017• Pesta Buah-buahan
MINGGU 4• Aktiviti & Permainan• Permainan Rakyat• Go-Kart• Majlis Penutup
EXPO NEGARAKU 2017 diilhamkan oleh YAB Perdana Menteri, Dato’ Sri Najib Tun Razak bagi mempamerkan projek-projek infrastruktur semasa dan masa hadapan yang dirancang dan dilaksanakan oleh Kerajaan Malaysia demi menyediakan kehidupan yang lebih bermakna buat seluruh rakyat Malaysia.
Ekspo ini menawarkan satu pengalaman baharu buat para pengunjung untuk merasai sendiri denyut nadi pembangunan negara secara lebih dekat, sambil mengecapi satu pengalaman yang menyeronokkan.
Inilah peluang untuk anda dan keluarga atau rakan taulan untuk bersama-sama menyaksikan sendiri jaringan pembangunan yang telah dirancang selama ini, demi Negaraku Malaysia. Expo Negaraku berlangsung selama sebulan di Dataran Merdeka, Kuala Lumpur yang sarat dengan sejarah.
17MITI Tower, No. 7, Jalan Sultan Haji Ahmad Shah, 50480 Kuala Lumpur, Malaysia Tel: +603 - 8000 8000 Fax: +603 - 6202 9446
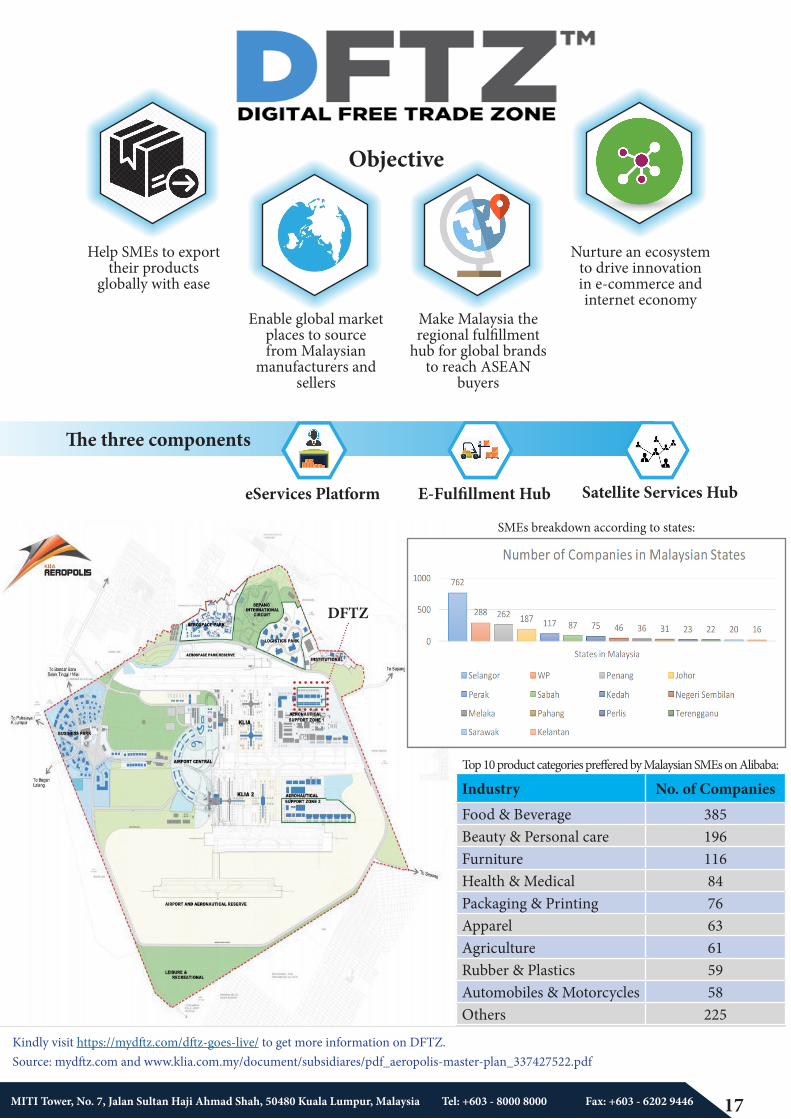
Objective
Help SMEs to export their products
globally with ease
Nurture an ecosystem to drive innovation in e-commerce and internet economy
Make Malaysia the regional fulfillment
hub for global brands to reach ASEAN
buyers
Enable global market places to source from Malaysian
manufacturers and sellers
The three components
eServices Platform E-Fulfillment Hub Satellite Services Hub
Industry No. of CompaniesFood & Beverage 385Beauty & Personal care 196Furniture 116Health & Medical 84Packaging & Printing 76Apparel 63Agriculture 61Rubber & Plastics 59Automobiles & Motorcycles 58Others 225
Top 10 product categories preffered by Malaysian SMEs on Alibaba:
SMEs breakdown according to states:
Source: mydftz.com and www.klia.com.my/document/subsidiares/pdf_aeropolis-master-plan_337427522.pdfKindly visit https://mydftz.com/dftz-goes-live/ to get more information on DFTZ.
DFTZ
18MITI Tower, No. 7, Jalan Sultan Haji Ahmad Shah, 50480 Kuala Lumpur, Malaysia Tel: +603 - 8000 8000 Fax: +603 - 6202 9446
MITI Weekly Bulletin | www.miti.gov.my
MITI Weekly Bulletin (MWB) Mobile AppsMITI MWB APPs is now available for IOS, Android and Windows platforms. MWB APPs can be download from Gallery of Malaysian Government Mobile APPs (GAMMA) at the link: http://gamma.malaysia.gov.my/#/appDetails/85
MWB Facebook PageLike MWB page at https://www.facebook.com/MITIWeeklyBulletin/?fref=ts
Dear Readers,
Kindly click the link below for any comments in this issue. MWB reserves the right to edit and republish letters as reprints. http://www.miti.gov.my/index.php/forms/form/13
12 RABIULAWAL 1439H / 1 Disember 2017
Perbanyakkan berselawat ke atasNabi junjungan kita
Nabi Muhammad S.A.W.


