Audit Sampling Pertemuan 15-16
Matakuliah : A0294/Audit SI Lanjutan Tahun : 2009
Bina Nusantara University 2
Learning Outcomes
Pada akhir pertemuan ini, diharapkan mahasiswa akan mampu :• Memahami teknik penentuan ukuran sample• Memahami teknik pengambilan sample
Bina Nusantara University 3
Attribute sampling
• It is a statistical method used to estimate the proportion of a characteristic in a population (absence or presence of a control)
• The auditor is normally attempting to determine the operating effectiveness of a control procedure in terms of deviations from the prescribed control
Bina Nusantara University 4
Attribute sampling
• Planning– 1st - Determine the objective(s) of the test– 2nd - Define the control deviation conditions.– 3rd - Define the population– 4rd - Define the period covered by the test– 5th - Define the sampling unit.– 6th –Define the technical parameters to determine the
sample size
Bina Nusantara University 5
Attribute sampling
• Sample size
– It could be determined using:• Mathematic formulas• Statistic tables• software (CAAT: ACL or IDEA)
Bina Nusantara University 6
Attribute sampling
• Select the sample, perform the tests and evaluate the results– Selection using:
• Tables of random numbers• software (CAATS: ACL or IDEA or EXCEL)
– Evaluation of results using:• Satistic tables • Software (CAATS: ACL or IDEA or EXCEL)
Bina Nusantara University 7
Attribute sampling
• Key concepts– Confidence level, say 90%(complement of risk of
incorrect acceptance: 10%)– Expected deviation rate (EDR)– Maximum Tolerable deviation rate (MTDR)– Precision of the test (P<=MTDR-ER)– Confidence interval– Sample size– Results evaluation
Bina Nusantara University 8
Attribute sampling
Confidence level (CL) or reliability level (RL) It is a probability of the auditor being correct in
his/her evaluation of the risk of control (genneraly varies from 90 to 99%)
CL is 100% if all the items in the population are examined
Bina Nusantara University 9
Attribute sampling
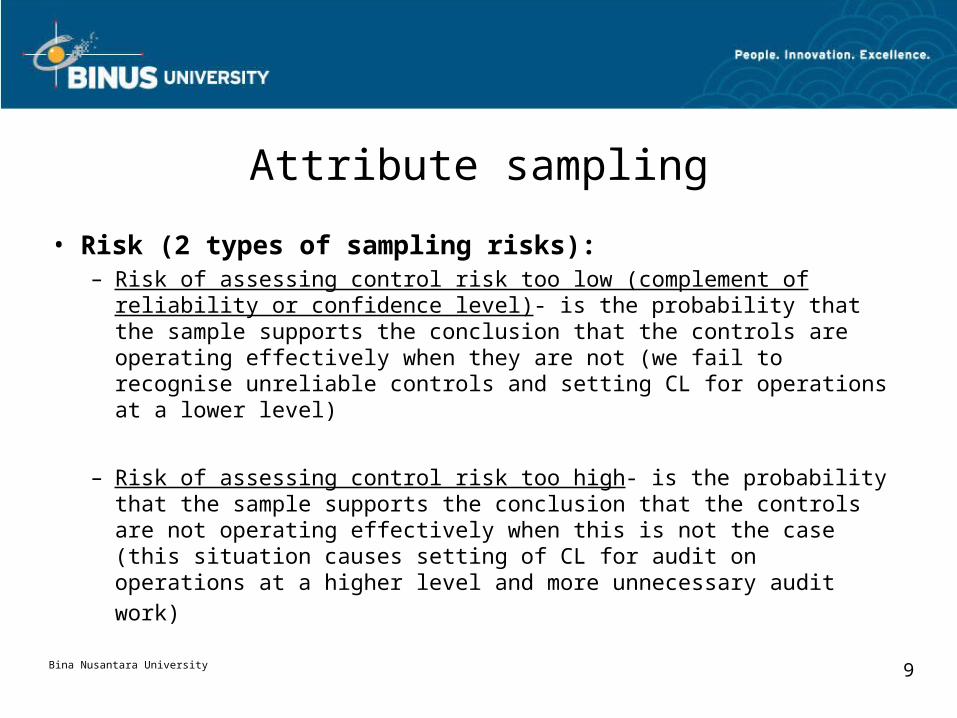
• Risk (2 types of sampling risks):– Risk of assessing control risk too low (complement of reliability
or confidence level)- is the probability that the sample supports the conclusion that the controls are operating effectively when they are not (we fail to recognise unreliable controls and setting CL for operations at a lower level)
– Risk of assessing control risk too high- is the probability that the sample supports the conclusion that the controls are not operating effectively when this is not the case (this situation causes setting of CL for audit on operations at a higher level and more unnecessary audit work)
Bina Nusantara University 10
Attribute sampling
Expected deviation rate (EDR)
• Maximum expected of deviations in the population based on last year audit or a pilot test
• EDR allows to define an interval of confidence for the sample identifying its precision (precision<=MTDR-EDR)
• The bigger EDR (more per cent or number of errors) the larger is the sample size
Bina Nusantara University 11
Attribute sampling
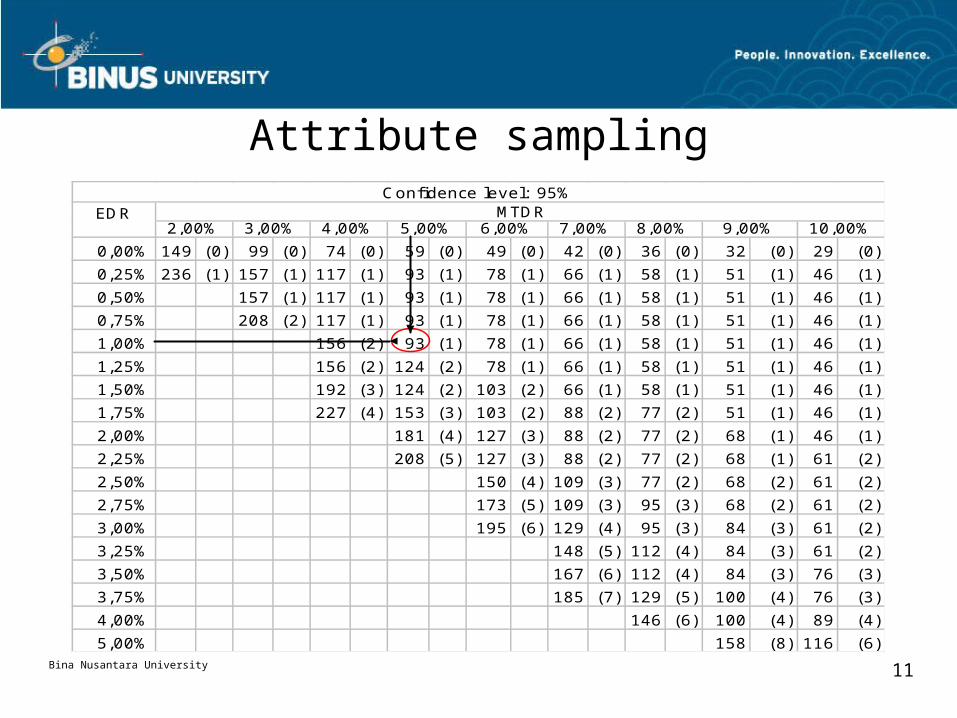
0,00% 149 (0) 99 (0) 74 (0) 59 (0) 49 (0) 42 (0) 36 (0) 32 (0) 29 (0)
0,25% 236 (1) 157 (1) 117 (1) 93 (1) 78 (1) 66 (1) 58 (1) 51 (1) 46 (1)
0,50% 157 (1) 117 (1) 93 (1) 78 (1) 66 (1) 58 (1) 51 (1) 46 (1)
0,75% 208 (2) 117 (1) 93 (1) 78 (1) 66 (1) 58 (1) 51 (1) 46 (1)
1,00% 156 (2) 93 (1) 78 (1) 66 (1) 58 (1) 51 (1) 46 (1)
1,25% 156 (2) 124 (2) 78 (1) 66 (1) 58 (1) 51 (1) 46 (1)
1,50% 192 (3) 124 (2) 103 (2) 66 (1) 58 (1) 51 (1) 46 (1)
1,75% 227 (4) 153 (3) 103 (2) 88 (2) 77 (2) 51 (1) 46 (1)
2,00% 181 (4) 127 (3) 88 (2) 77 (2) 68 (1) 46 (1)
2,25% 208 (5) 127 (3) 88 (2) 77 (2) 68 (1) 61 (2)
2,50% 150 (4) 109 (3) 77 (2) 68 (2) 61 (2)
2,75% 173 (5) 109 (3) 95 (3) 68 (2) 61 (2)
3,00% 195 (6) 129 (4) 95 (3) 84 (3) 61 (2)
3,25% 148 (5) 112 (4) 84 (3) 61 (2)
3,50% 167 (6) 112 (4) 84 (3) 76 (3)
3,75% 185 (7) 129 (5) 100 (4) 76 (3)
4,00% 146 (6) 100 (4) 89 (4)
5,00% 158 (8) 116 (6)
Confidence level: 95%MTDREDR
2,00% 3,00% 4,00% 5,00% 6,00% 7,00% 8,00% 9,00% 10,00%
Bina Nusantara University 12
Attribute sampling
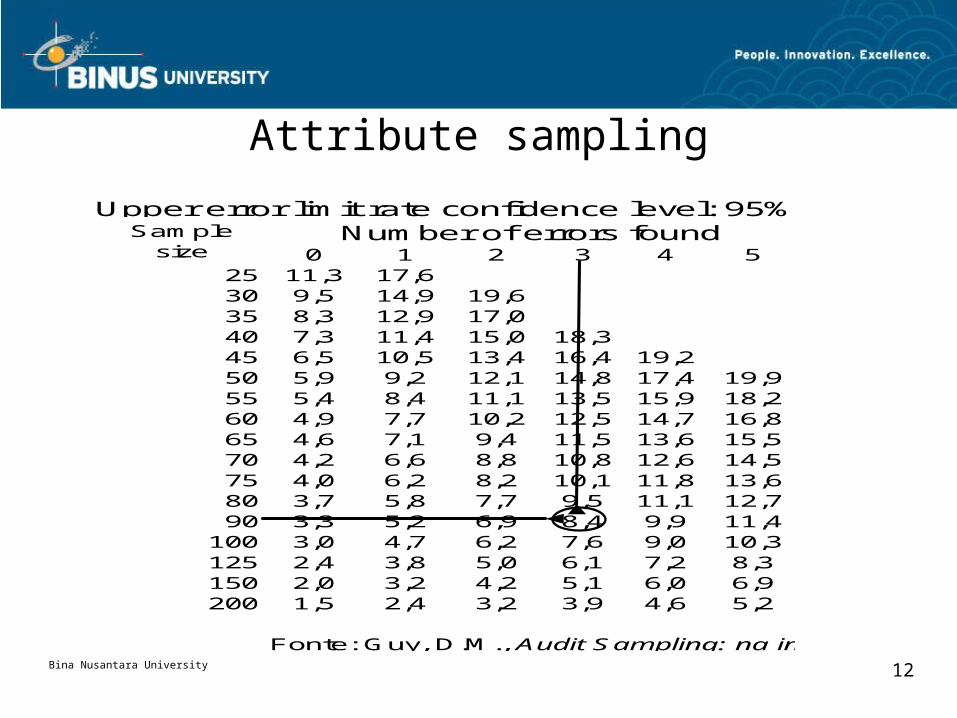
0 1 2 3 4 525 11,3 17,630 9,5 14,9 19,635 8,3 12,9 17,040 7,3 11,4 15,0 18,345 6,5 10,5 13,4 16,4 19,250 5,9 9,2 12,1 14,8 17,4 19,955 5,4 8,4 11,1 13,5 15,9 18,260 4,9 7,7 10,2 12,5 14,7 16,865 4,6 7,1 9,4 11,5 13,6 15,570 4,2 6,6 8,8 10,8 12,6 14,575 4,0 6,2 8,2 10,1 11,8 13,680 3,7 5,8 7,7 9,5 11,1 12,790 3,3 5,2 6,9 8,4 9,9 11,4
100 3,0 4,7 6,2 7,6 9,0 10,3125 2,4 3,8 5,0 6,1 7,2 8,3150 2,0 3,2 4,2 5,1 6,0 6,9200 1,5 2,4 3,2 3,9 4,6 5,2
Fonte: Guy, D.M., Audit Sampling: na introduction , 58
Sample size
Number of errors foundUpper error limit rate confidence level: 95%
Bina Nusantara University 13
Variables sampling
Auditor problem:• Is there the possibility of overstatement in value
of some item of the population which could result in a qualified opinion?
Bina Nusantara University 14
Variables sampling statistical methods
• Sampling proporcionate to size (PPS/MUS)• Classical variables sampling:
– Direct projection (stratification required);– Ratio or difference estimation (when errors are fairly
frequent)
Bina Nusantara University 15
Monetary Unit Sampling (MUS)
The classical variables sampling can fail in the detection of the material mistake because:– The methods of selection are random and based on
physical registers (we maynot choose a document that contains a mistake)
– There is a possibility not to project this mistake for the population, so there is the possibility not to detect one material mistake
Bina Nusantara University 16
Monetary Unit Sampling (MUS)
• Auditor precautions:– examine all the big transactions that individually can
contain a material mistake– apply a method of sampling for the remaining items on
basis of a stratified selection (nevertheless the stratification does not remove totally the problem of the possibility not to select a group of items that totalizes a material mistake)
Bina Nusantara University 17
Monetary Unit Sampling (MUS)
• Another approach:– as bigger values are the most relevant items for the
auditor the suggested new approach makes a selection based on the weight of monetary value, generically designated by probability-proportional-to-size (PPS) or monetary unit sampling (MUS)
Bina Nusantara University 18
Monetary Unit Sampling (MUS)
• Evaluation of results
– The Poisson distribution is used for the evaluation of results:
– Tables– Audit Software (ACL, IDEA, Etc…)– Specific programmes
Bina Nusantara University 19
Monetary Unit Sampling (MUS)
• Opinion formulation
– The auditor, based on the evidence of the sample, declares, with a CL of y %, an upper error limit in the population (where the amount depends on the results of the sample, for a sample size of n and for a number x errors found in the sample).
Bina Nusantara University 20
Monetary Unit Sampling (MUS)
– Risk– Monetary precision (MP)– Expected error– Tolerable error (materiality threshold)– Sample size– Confidence factor R (Poisson) – Expansion factors for expected error– Upper error limit
Bina Nusantara University 21
Monetary Unit Sampling (MUS)
• Risk (2 types of sampling risks):– Risk of incorrect acceptance- is the probability
that the sample supports the conclusion that the book value is not materially misstated when it is (not identified qualified opinion)
– Risk of incorrect rejection- is the probability that the sample supports the conclusion that the book value is materially misstated when it is not (this situation cause more audit work)
Bina Nusantara University 22
Monetary Unit Sampling (MUS)
Monetary precision (MP)
It is a basic threshold to determine the sample size that means, the auditor expects a maximum amount of overstatement in the population equivalent to the MP even if there are no misstatements in the sample, for a certain confidence level (auditor judgement)
Bina Nusantara University 23
Monetary Unit Sampling (MUS)
Expected error (EE)– Based on last year experience and inherent risk
evaluation, considering the results of tests of controls and other procedures, expected error is the amount of overstatement the auditor expects to find in the population
– It is used to control the risk of incorrect rejection due to a small sample size (increases the initial sample size)
Bina Nusantara University 24
Monetary Unit Sampling (MUS)
Tolerable error (TE)– It is the maximum overstatement error for a population of
accounts or group of transactions that can be accepted by the auditor without causing material error in the financial demonstrations (judgement of the auditor)
– It is compared against the results of the sample in order to decide whether the auditor accepts the population as free of material errors or alternatively qualifies the opinion
– Commission stated in Annex IV CR 1828 that the maximum materiality threshold is 2%
Bina Nusantara University 25
Nature and Cause of Errors
• The auditor should consider:– The nature – The cause
In order to evaluate the sample results this means that he have to classify the errors before the extrapolation:
• anomalous error• Systematic error
• Random error
Bina Nusantara University 26
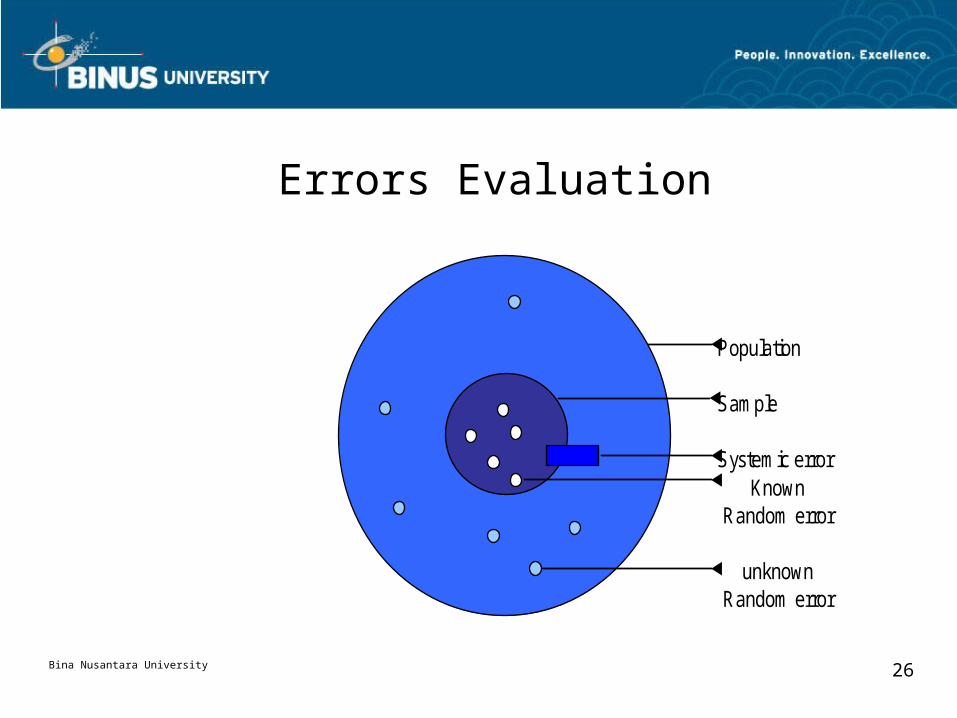
Errors Evaluation
Population
Sample
Systemic errorKnown
Random error
unknown Random error
Bina Nusantara University 27
Errors Evaluation
• anomalous error
– The error arises from an isolated event that has not occurred other than on specifically identifiable occasions and is therefore not representative of similar errors in the population
the auditor has to have a high degree of certainty that such error is not representative of the population
Bina Nusantara University 28
Errors Evaluation
• Systematic error– is a non-random exception that is likely to have
occurred more than once on positively identifiable occasions.
– The auditor obtains the effect of each systematic error on the total population by performing additional audit in order to make a qualitative evaluation of how, why, when and where the systematic error occurred
Bina Nusantara University 29
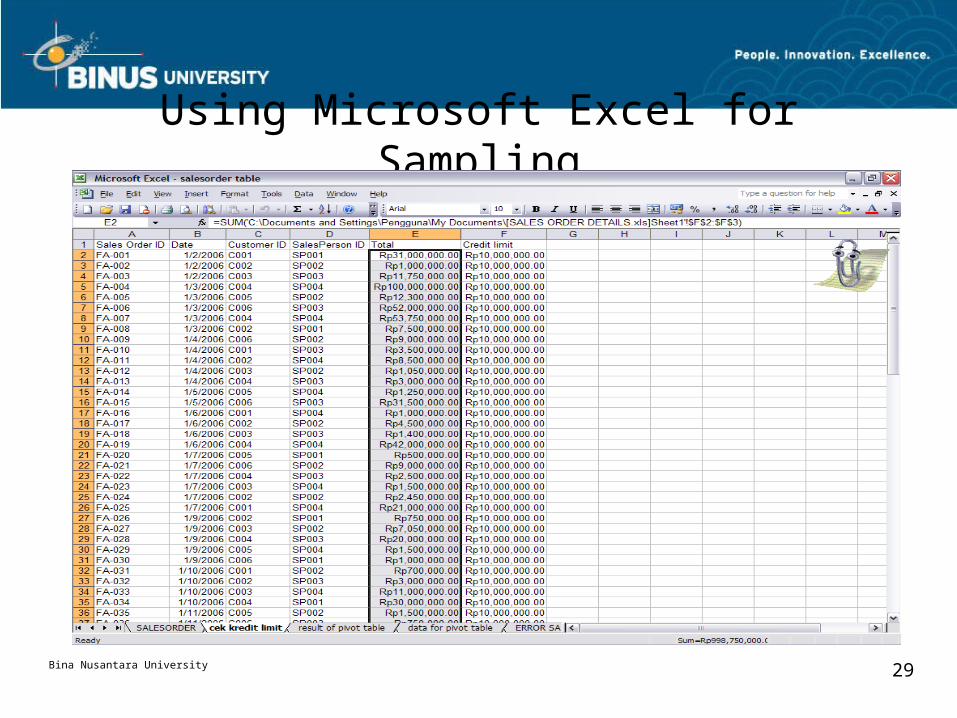
Using Microsoft Excel for Sampling

Bina Nusantara University 30
The End


