distribution of body weight, height and body mass index in ... · distribution of body weight,...
TRANSCRIPT
ORIGINAL ARTICLE
Distribution of Body Weight, Height andBody Mass Index .in a National Sample ofMalaysian Adults
T 0 lim, MRCP*, L M Ding, MHA*, M Zaki, FRCP**, A B Suleiman, FRACP**, S Fatimah, ***S Siti***, A Tahir, MPH***, A H Maimunah, MPH***, *Clinical Research Centre, **Department ofNephrology, Jalan Pahang, 50586, Kuala Lumpur, ***Institut Kesihatan Umum, Kuala Lumpur
Introduction
The distributions of body weight, height and body massindex (BMI) in' a representative national sample ofMalaysian adults have not previously been described.Such information is of epidemiological interest, and isalso useful in public health practice.
The relationship between BMI and mortality is Ushaped l
-4. Both low and high BMI are associated withincrease risk of all-cause mortality. High body massindex in particular is associated with increase risk ofhypertension, diabetes and hyperlipidaemia5• Height isnegatively associated with mortality, with shorterindividuals having higher mortality risk'. This is notdue to the biological effect of height per se but is areflection of nutritional and health deficit earlier in life
108
with resulting failure to attain growth potential.Countries that have undergone rapid socio-economicdevelopment, for example Japan, have witnessed markedsecular increase in height among younger cohorts as wellas improvement in health status5• Thus, information onpopulation distribution of anthropometric indicators areuseful for predicting health burden in a population aswell as for describing changes in physical statusassociated the rapid socio-economic development in thelast 4 decades.
We present here the distribution of body weight, heightand body mass index by age, sex and ethnicity using thedata from the National Health and Morbidity survey(NHMS) completed in 1996.
Med J Malaysia Vol 55 No 1 March 2000
Materials and Methods
Sampling design and sample
The NHMS was a multi-purpose health survey designedto describe the health status, health related behaviourand health services utilisation for a representativesample of the population of Malaysia. An up to date andrepresentative sampling frame for this population wasprovided by the frame used by the annual Labour Forcesurvey conducted by the Department of Statistics6
• Thesampling frame was stratified by state and urban/ruralresidence. A stratified two stage cluster sampling designwith self-weighting sample was used to draw a sampleof 17995 private dwellings. However, only 13025(87%) of dwellings were contactable or responded. Allresidents of sampled dwellings were included yielding asample size of 59903 individuals. For NHMS
ORIGINAL ARTICLE
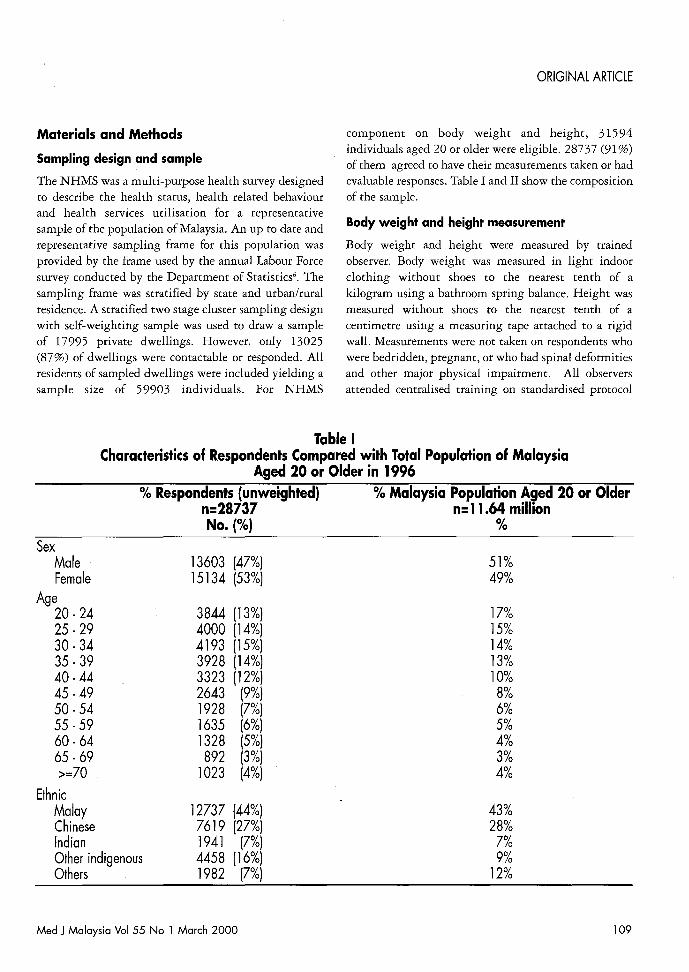
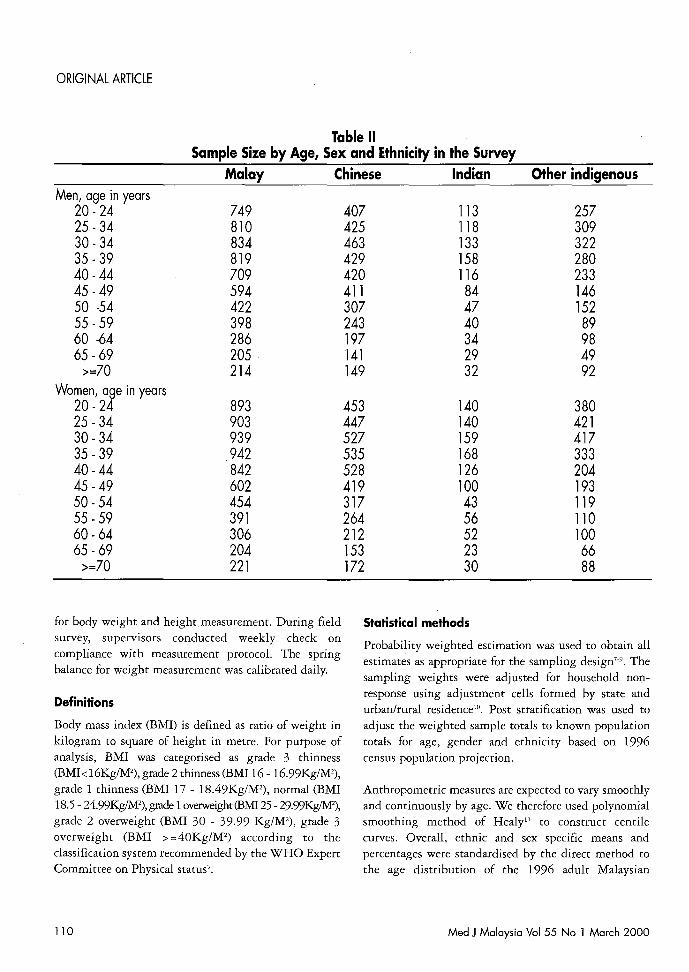
component on body weight and height, 31594individuals aged 20 or older were eligible. 28737 (91 %)
of them agreed to have their measurements taken or hadevaluable responses. Table I and II show the compositionof the sample.
Body weight and height measurement
Body weight and height were measured by trainedobserver. Body weight was measured in light indoorclothing without shoes to the nearest tenth of akilogram using a bathroom spring balance. Height wasmeasured without shoes to the nearest tenth of acentimetre using a measuring tape attached to a rigidwall. Measurements were not taken on respondents whowere bedridden, pregnant, or who had spinal deformitiesand other major physical impairment. All observersattended centralised training on standardised protocol
Table ICharacteristics of Respondents Compared with Total Population of Malaysia
Aged 20 or Older in 1996% Respondents (unweighted) %Malaysia Population Aged 20 or Older
n=28737 n=11.64 millionNo. (%) %
SexMale 13603 (47%) 51%Female 15134 (53%) 49%
Age20 - 24 3844 (13%) 17%25 - 29 4000 (14%) 15%30 -34 4193 (15%) 14%35 - 39 3928 (14%) 13%40-44 3323 (12%) 10%45 -49 2643 (9%) 8%50 -54 1928 (7%) 6%55 -59 1635 (6%) 5%60- 64 1328 (5%) 4%65 -69 892 (3%) 3%>=70 1023 (4%) 4%
EthnicMalay 12737 (44%) 43%Chinese 7619 (27%) 28%Indian 1941 (7%) 7%Other indigenous 4458 (16%) 9%Others 1982 (7%) 12%
Mad J Malaysia Vol 55 No 1 March 2000 109
ORIGINAL ARTICLE
Table IISample Size by Age, Sex and Ethnicity in the Survey
Malay Chinese Indian Other indigenousMen, age in years
20 -24 749 407 113 25725 -34 810 425 118 30930 -34 834 463 133 32235 -39 819 429 158 28040-44 709 420 116 23345 -49 594 411 84 14650 -54 422 307 47 15255 -59 398 243 40 8960 -64 286 197 34 9865 -69 205 141 29 49
>=70 214 149 32 92Women, age in years
20 -24 893 453 140 38025 -34 903 447 140 42130 -34 939 527 159 41735 -39 942 535 168 33340 -44 842 528 126 20445 -49 602 419 100 19350-54 454 317 43 11955 -59 391 264 56 11060 -64 306 212 52 10065 -69 204 153 23 66
>=70 221 172 30 88
for body weight and height measurement. During fieldsurvey, supervisors conducted weekly check oncompliance with measurement protocol. The springbalance for weight measurement was calibrated daily.
Definitions
Body mass index (BMI) is defined as ratio of weight inkilogram to square of height in metre. For purpose ofanalysis, BMI was categorised as grade 3 thinness(BMI<16Kg/M'), grade 2 thinness (BMI 16 - 16.99Kg/M'),grade 1 thinness (BMI 17 - 18.49Kg/M'), normal (BMI18.5 - 24.99KglM'), grade 1overweight (EM! 25 - 29.99KgIM'),grade 2 overweight (BMI 30 - 39.99 Kg/M'), grade 3overweight (BMI > =40Kg/M') according to theclassification system recommended by the WHO ExpertCommittee on Physical status'.
110
Statistical methods
Probability weighted estimation was used to obtain allestimates as appropriate for the sampling design709
• Thesampling weights were adjusted for household nonresponse using adjustment cells formed by state andurban/rural residence lO
• Post stratification was used toadjust the weighted sample totals to known populationtotals for age, gender and ethnicity based on 1996census population projection.
Anthropometric measures are expected to vary smoothlyand continuously by age. We therefore used polynomialsmoothing method of Healyll to construct centilecurves. Overall, ethnic and sex specific means andpercentages were standardised by the direct method tothe age distribution of the 1996 adult Malaysian
Med J Malaysia Vol 55 No 1 March 2000
DISTRIBUTION OF BODY WEIGHT, HEIGHT AND BODY MASS INDEX
population. S_Plus l2 and STATA13 software packageswere used for analysis.
Results
Percentiles distribution
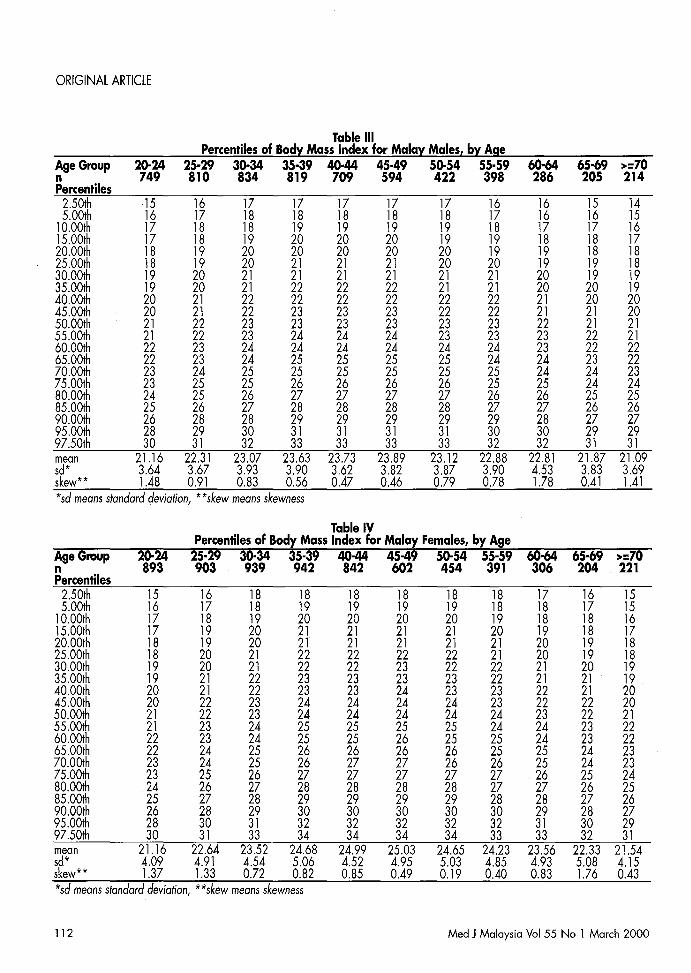
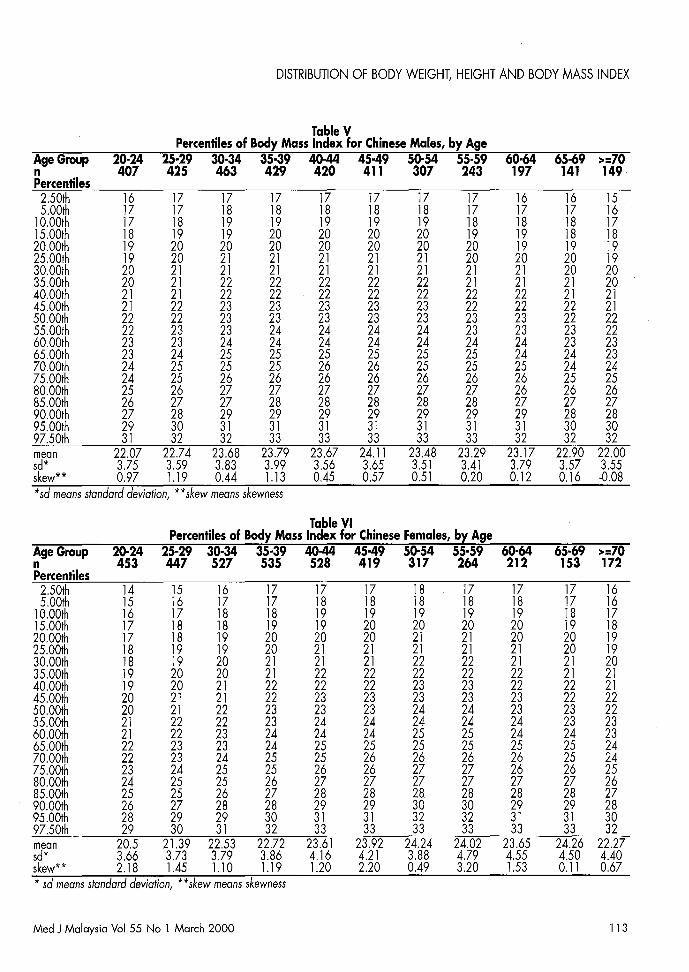
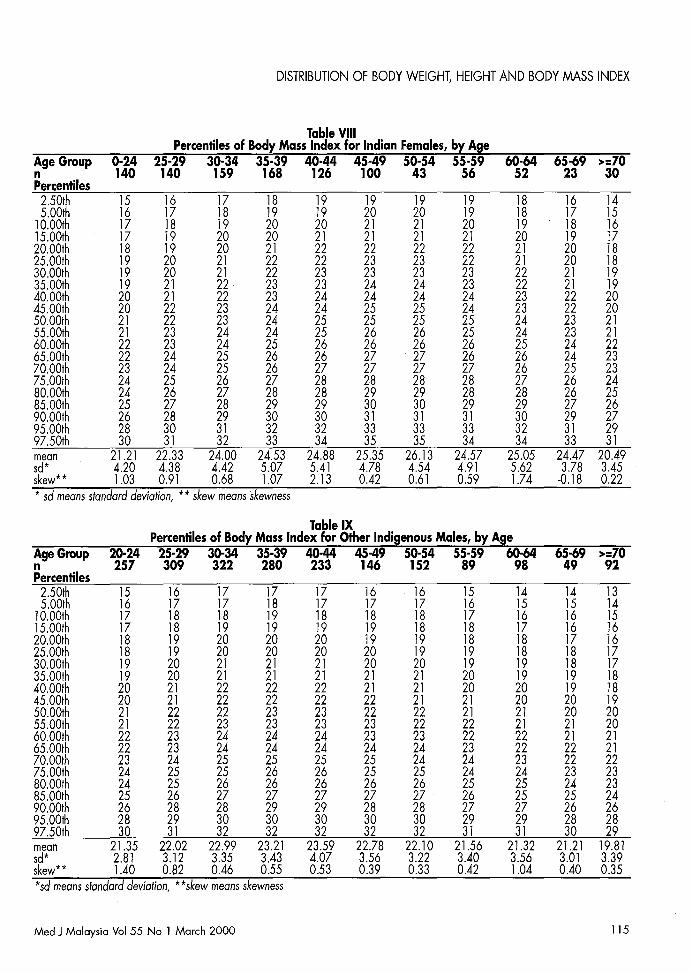
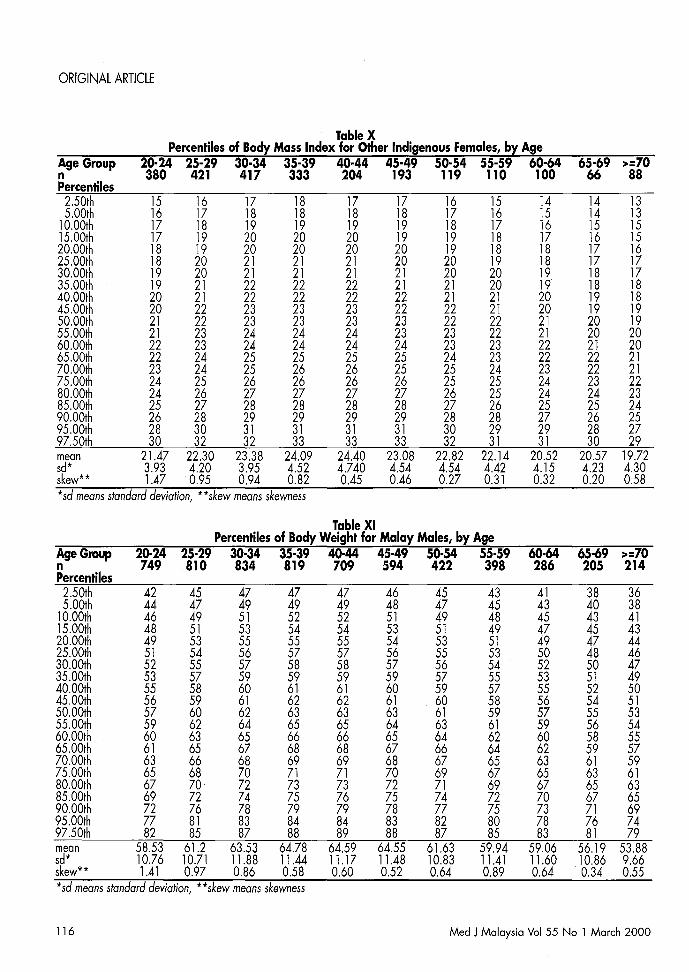
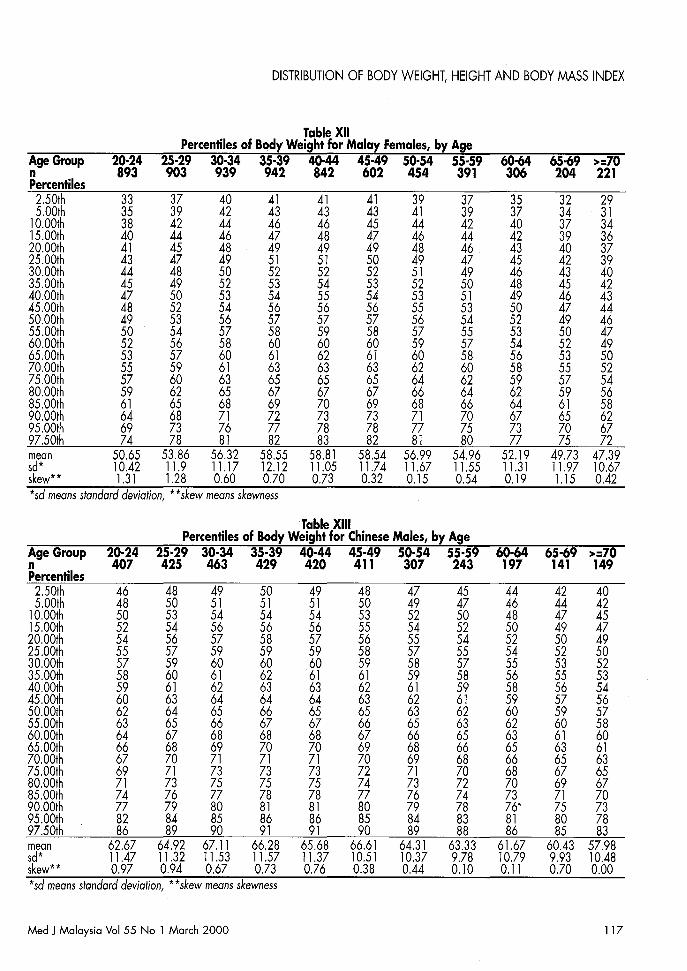
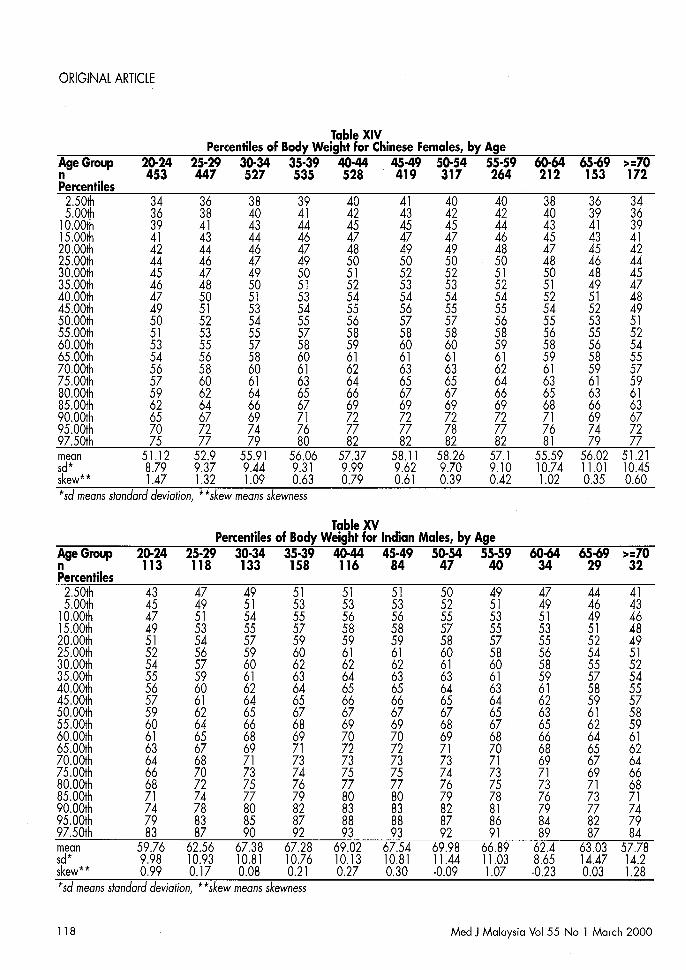
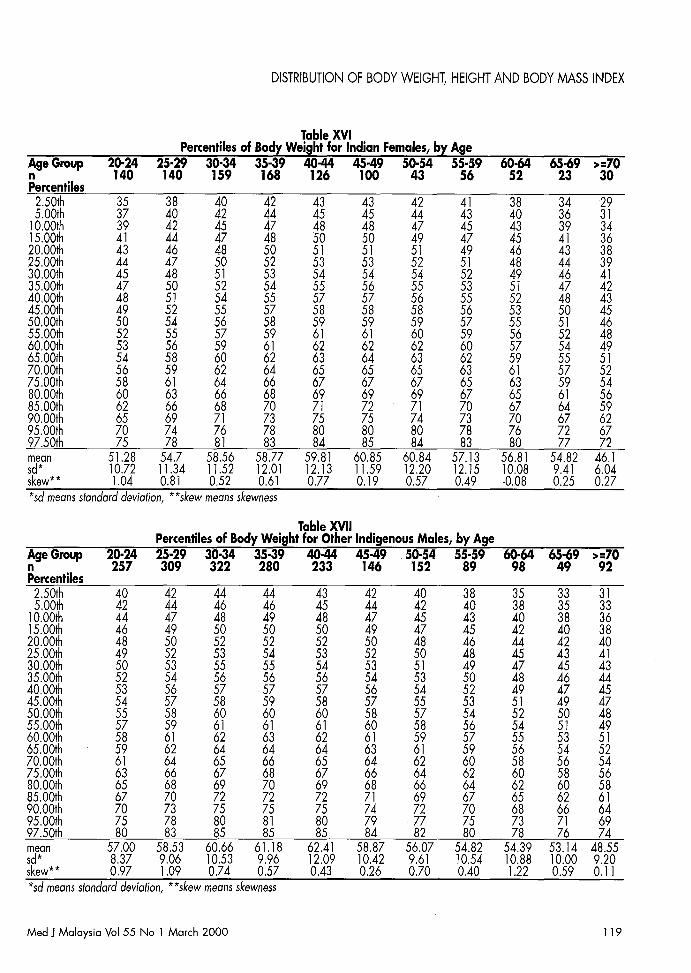
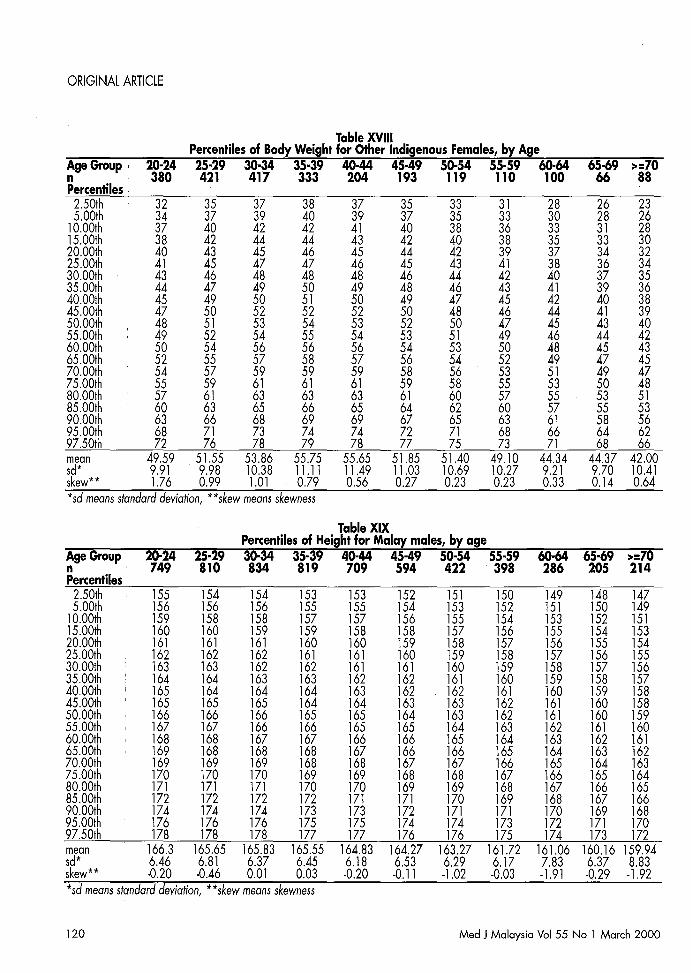
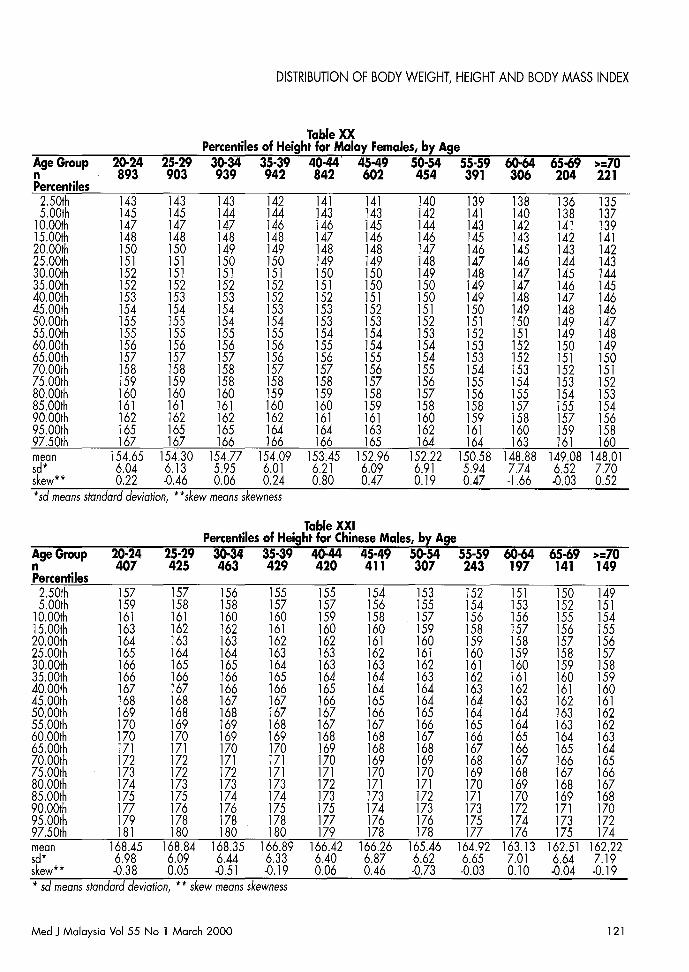
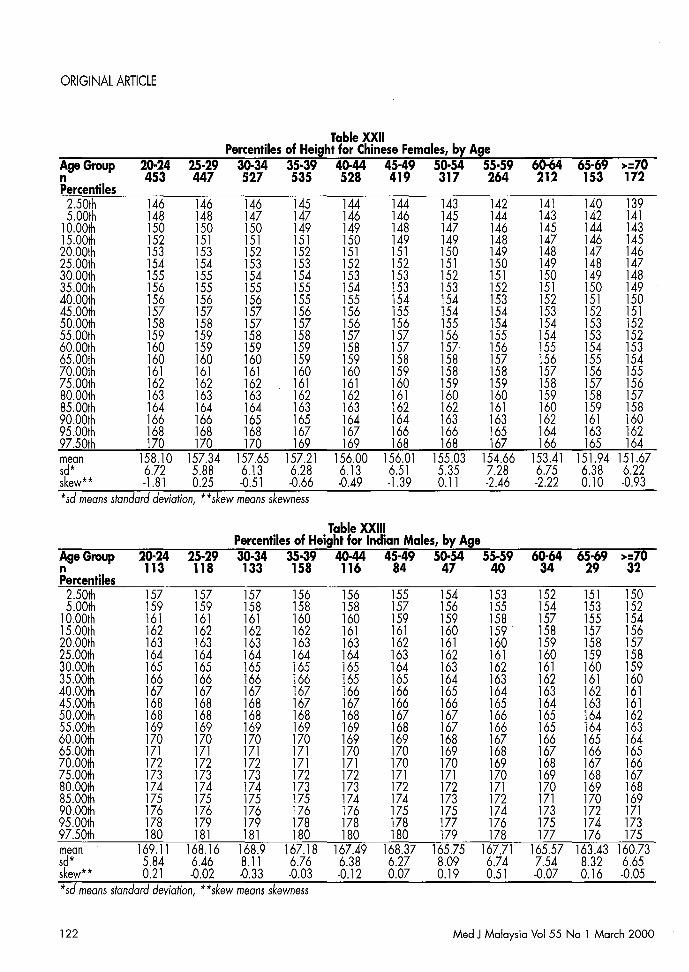
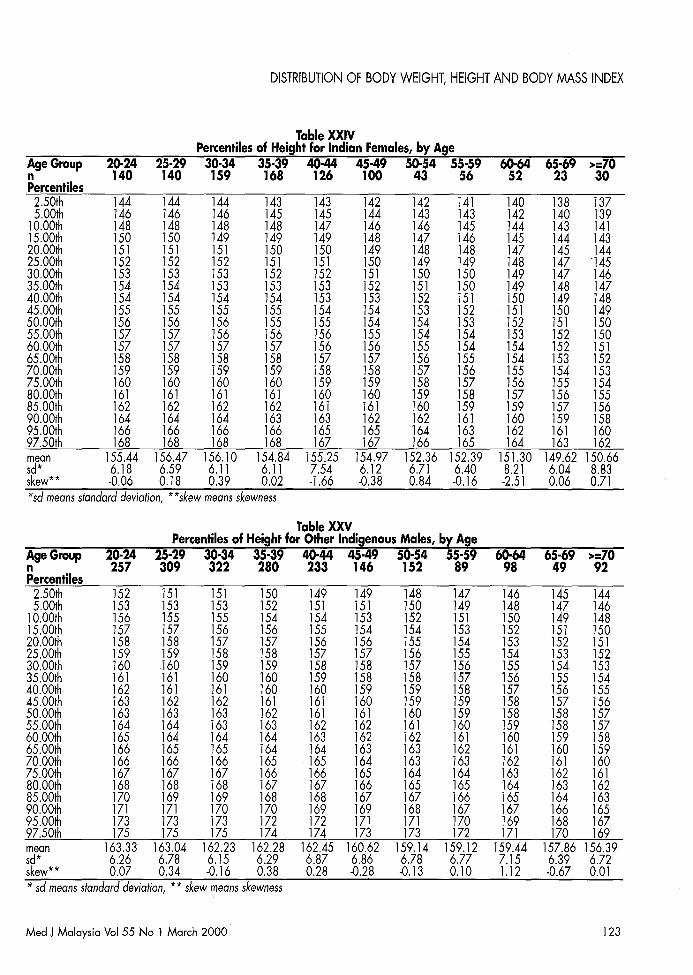
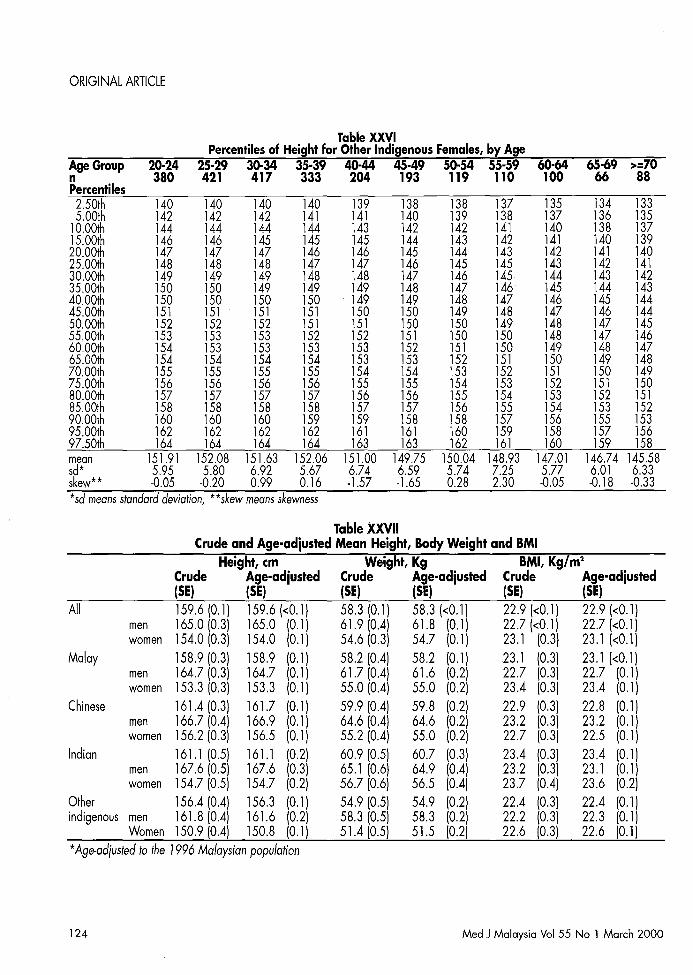
The percentiles of body weight, height and BMI by age,gender an.d ethnicity are shown in Tables III to XXVI.In all ethnic-gender groups, BMI rose with increasingage till fifth or sixth decade, thereafter it declined. Therise in BMI with age was steeper for women than men.In contrast there was an obvious decrease in height withage in both sexes and all ethnic groups.
Mean 8MI
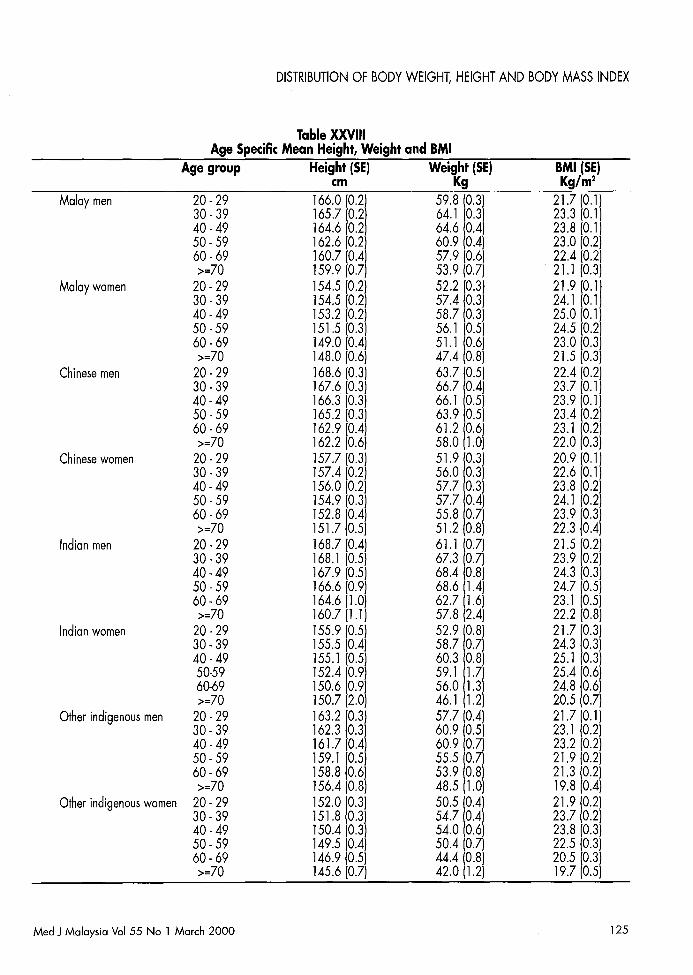
Tables XXVII and XXVIII show the mean height,weight and BMI by gender, ethnicity and age. Womenhave higher mean BMI than men except for Chinese.Among women, Indian had the highest BMI, followedby Malay, Other indigenous and then Chinese. Amongmen, Chinese had the highest BMI followed by Indian,Malay and other indigenous. Among Indian, Malay andother indigenous ethnic group, women had higher BMIthan men in all age groups till the seventh decadeonwards when the mean BMI of the two sexesconverged. In contrast, young Chinese men had higherBMI than their female counterparts until the fifthdecade. Thereafter, the reverse was true.
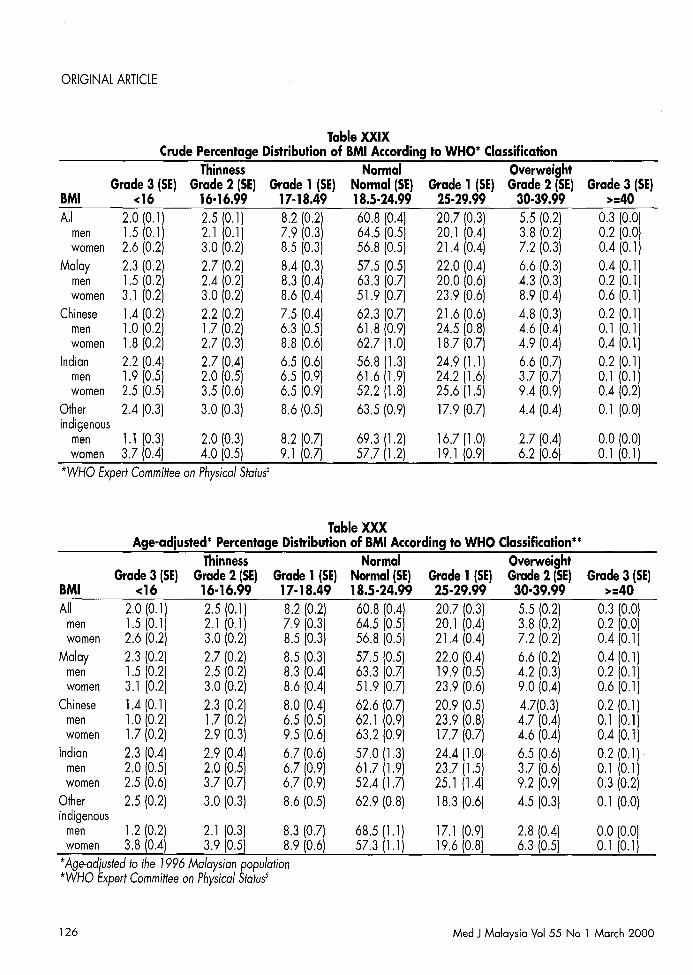
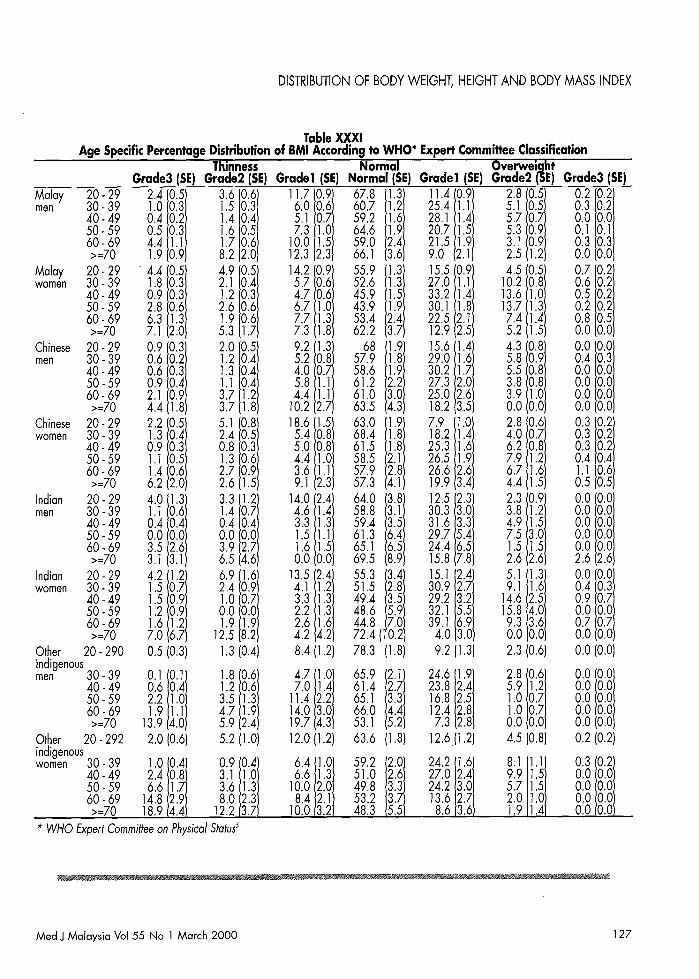
Percentage distribution of 8MI
Tables XXIX to XXXI show the percentagedistribution of BMI according to WHO classification'.Overall, 26.5% of the adult population had BMI in theoverweight range but only about 6% had grade 2 orhigher overweight, 61 % had normal BMI and 13% hadgrade 1 or higher thinness. Both overweight andthinness were more common among women than men.Indian had the highest prevalence of overweight,followed by Malay, Chinese and other indigenous groupthe lowest prevalence.
Discussion
We advise caution m interpreting the results. Thestability of the centile estimates is assured only if based on
Med J Malaysia Vol 55 No 1 March 2000
large sample sizes. This was clearly the case for Malay,Chinese and other indigenous ethnic group's estimates.However sample sizes for Indian in the older age groups(age 65 - 70+) were small. The smoothing methodemployed to construct the centile curves had masked theunderlying sampling variability. One should also becautious in interpreting cross sectional datalongitudinally. The rise in BMI with age may beinterpreted as due to sedentary lifestyle associated withageing. However, the tendency of the rise to flatten oreven reverses beyond age 50 - 60 should not beinterpreted as due to ageing effect. One alternativeexplanation is selective survival. People with lower BMItend to survive with increasing age thus shifting the BMIdistribution of survivors downwards. On the other hand,the decrease in height with age is more reasonablyinterpreted as due to cohort effect. Younger cohorts attainbetter growth potential because of better nutrition thanolder cohorts. Cross sectional data as presented herecannot differentiate the individual contribution ofageing,selective survival and cohort effect.
Characteristics of the BMI distribution of the Malaysianpopulation, as shown here, largely resemble thoseobserved in other substantial population surveys,,14-16.
The right skewed distribution, the age trend in BMI,differences between the 2 sexes and variation among theethnic groups are all well described characteristics ofpopulation BMI distribution. The most notable findingsare the remarkably low BMI prevailing in all ethnicgroups in our population. This is in sharp contrast toWestern populationsI4
-16, and is comparable to other
non-western populations'.
The other notable finding is the marked secular increasein height among younger cohorts. Younger Malaysiansfrom all ethnic groups had attained better growthpotential as a result of better nutrition and heathbrought on by the socio-economic development thiscountry has witnessed in the last 4 decades. Countriesthat have similarly undergone rapid socio-economicdevelopment, for example Japan, have experiencedsimilar changes in population height'.
The distributions of anthropometric measurements ofMalaysian adults described here are not merely ofepidemiological interest. They are useful in their own
111
ORIGINAL ARTICLE
Table IIIPercentiles of Body Mass Index for Malay Males, by Age
Age Group 20·24 25·29 30·34 35·39 40·44 45·49 50-54 55·59 60·64 65·69 >=70n 749 810 834 819 709 594 422 398 286 205 214Percentiles
2.50th 15 16 17 17 17 17 17 16 16 15 145.00th 16 17 18 18 18 18 18 17 16 16 15
10.00th 17 18 18 19 19 19 19 18 17 17 1615.00th 17 18 19 20 20 20 19 19 18 18 1720.00th 18 19 20 20 20 20 20 19 19 18 1825.00th 18 19 20 21 21 21 20 20 19 19 1830.00th 19 20 21 21 21 21 21 21 20 19 1935.00th 19 20 21 22 22 22 21 21 20 20 1940.00th 20 21 22 22 22 22 22 22 21 20 2045.00th 20 21 22 23 23 23 22 22 21 21 2050.00th 21 22 23 23 23 23 23 23 22 21 2155.00th 21 22 23 24 24 24 23 23 23 22 2160.00th 22 23 24 24 24 24 24 24 23 22 2265.00th 22 23 24 25 25 25 25 24 24 23 2270.00th 23 24 25 25 25 25 25 25 24 24 2375.00th 23 25 25 26 26 26 26 25 25 24 2480.00th 24 25 26 27 27 27 27 26 26 25 2585.00th 25 26 27 28 28 28 28 27 27 26 2690.00th 26 28 28 29 29 29 29 29 28 27 2795.00th 28 29 30 31 31 31 31 30 30 29 2997.50th 30 31 32 33 33 33 33 32 32 31 31mean 21.16 22.31 23.07 23.63 23.73 23.89 23.12 22.88 22.81 21.87 21.09sd* 3.64 3.67 3.93 3.90 3.62 3.82 3.87 3.90 4.53 3.83 3.69skew** 1.48 0.91 0.83 0.56 0.47 0.46 0.79 0.78 1.78 0.41 1.41*sd means standard deviation, **skew means skewness
Table IVPercentiles of Body Mass Index for Malay Females, by Age
Age Group 20·24 25·29 30·34 35·39 40·44 45-49 50·54 55·59 60·64 65·69 >=70n 893 903 939 942 842 602 454 391 306 204 221Percentiles
2.50th 15 16 18 18 18 18 18 18 17 16 155.00th 16 17 18 19 19 19 19 18 18 17 15
10.00th 17 18 19 20 20 20 20 19 18 18 1615.00th 17 19 20 21 21 21 21 20 19 18 1720.00th 18 19 20 21 21 21 21 21 20 19 1825.00th 18 20 21 22 22 22 22 21 20 19 1830.00th 19 20 21 22 22 23 22 22 21 20 1935.00th 19 21 22 23 23 23 23 22 21 21 1940.00th 20 21 22 23 23 24 23 23 22 21 2045.00th 20 22 23 24 24 24 24 23 22 22 2050.00th 21 22 23 24 24 24 24 24 23 22 2155.00th 21 23 24 25 25 25 25 24 24 23 2260.00th 22 23 24 25 25 26 25 25 24 23 2265.00th 22 24 25 26 26 26 26 25 25 24 2370.00th 23 24 25 26 27 27 26 26 25 24 2375.00th 23 25 26 27 27 27 27 27 26 25 2480.00th 24 26 27 28 28 28 28 27 27 26 2585.00th 25 27 28 29 29 29 29 28 28 27 2690.00th 26 28 29 30 30 30 30 30 29 28 2795.00th 28 30 31 32 32 32 32 32 31 30 2997.50th 30 31 33 34 34 34 34 33 33 32 31mean 21.16 22.64 23.52 24.68 24.99 25.03 24.65 24.23 23.56 22.33 21.54sd* 4.09 4.91 4.54 5.06 4.52 4.95 5.03 4.85 4.93 5.08 4.15skew** 1.37 1.33 0.72 0.82 0.85 0.49 0.19 0.40 0.83 1.76 0.43*sd means standard deviation, **skew means skewness
112 Med J Malaysia Vol 55 No 1 March 2000
DISTRIBUTION OF BODY WEIGHT, HEIGHT AND BODY MASS INDEX
Table VPercentiles of Body Mass Index for Chinese Malesl by Age
Age Group 20·24 25·29 30·34 35·39 40·44 45·49 50·54 55·59 60·64 65·69 >=70n 407 425 463 429 420 411 307 243 197 141 149Percentiles
2.50th 16 17 17 17 17 17 17 17 16 16 155.00th 17 17 18 18 18 18 18 17 17 17 16
10.00th 17 18 19 19 19 19 19 18 18 18 1715.00th 18 19 19 20 20 20 20 19 19 18 1820.00th 19 20 20 20 20 20 20 20 19 19 1925.00th 19 20 21 21 21 21 21 20 20 20 1930.00th 20 21 21 21 21 21 21 21 21 20 2035.00th 20 21 22 22 22 22 22 21 21 21 2040.00th 21 21 22 22 22 22 22 22 22 21 2145.00th 21 22 23 23 23 23 23 22 22 22 2150.00th 22 22 23 23 23 23 23 23 23 22 2255.00th 22 23 23 24 24 24 24 23 23 23 2260.00th 23 23 24 24 24 24 24 24 24 23 2365.00th 23 24 25 25 25 25 25 25 24 24 2370.00th 24 25 25 25 26 26 25 25 25 24 2475.00th 24 25 26 26 26 26 26 26 26 25 2580.00th 25 26 27 27 27 27 27 27 26 26 2685.00th 26 27 27 28 28 28 28 28 27 27 2790.00th 27 28 29 29 29 29 29 29 29 28 2895.00th 29 30 31 31 31 31 31 31 31 30 3097.50th 31 32 32 33 33 33 33 33 32 32 32mean 22.07 22.74 23.68 23.79 23.67 24.11 23.48 23.29 23.17 22.90 22.00sd' 3.75 3.59 3.83 3.99 3.56 3.65 3.51 3.41 3.79 3.57 3.55skew" 0.97 1.19 0.44 1.13 0.45 0.57 0.51 0.20 0.12 0.16 -0.08'sd means standard deviation, "skew means skewness
Table VIPercentiles of Body Mass Index for Chinese Femalesl by Age
Age Group 20·24 25·29 30·34 35·39 40·44 45·49 50·54 55·59 60·64 65·69 >=70n 453 447 527 535 528 419 317 264 212 153 172Percentiles
2.50th 14 15 16 17 17 17 18 17 17 17 165.00th 15 16 17 17 18 18 18 18 18 17 16
10.00th 16 17 18 18 19 19 19 19 19 18 1715.00th 17 18 18 19 19 20 20 20 20 19 1820.00th 17 18 19 20 20 20 21 21 20 20 1925.00th 18 19 19 20 21 21 21 21 21 20 1930.00th 18 19 20 21 21 21 22 22 21 21 2035.00th 19 20 20 21 22 22 22 22 22 21 2140.00th 19 20 21 22 22 22 23 23 22 22 2145.00th 20 21 21 22 23 23 23 23 23 22 2250.00th 20 21 22 23 23 23 24 24 23 23 2255.00th 21 22 22 23 24 24 24 24 24 23 2360.00th 21 22 23 24 24 24 25 25 24 24 2365.00th 22 23 23 24 25 25 25 25 25 25 2470.00th 22 23 24 25 25 26 26 26 26 25 2475.00th 23 24 25 25 26 26 27 27 26 26 2580.00th 24 25 25 26 27 27 27 27 27 27 2685.00th 25 25 26 27 28 28 28 28 28 28 2790.00th 26 27 28 28 29 29 30 30 29 29 2895.00th 28 29 29 30 31 31 32 32 31 31 3097.50th 29 30 31 32 33 33 33 33 33 33 32mean 20.5 21.39 22.53 22.72 23.61 23.92 24.24 24.02 23.65 24.26 22.27sd' 3.66 3.73 3.79 3.86 4.16 4.21 3.88 4.79 4.55 4.50 4.40skew" 2.18 1.45 1.10 1.19 1.20 2.20 0.49 3.20 1.53 0.11 0.67, sd means standard deviation, "skew means skewness
Med J Malaysia Vol 55 No 1 March 2000 113
ORIGINAL ARTICLE
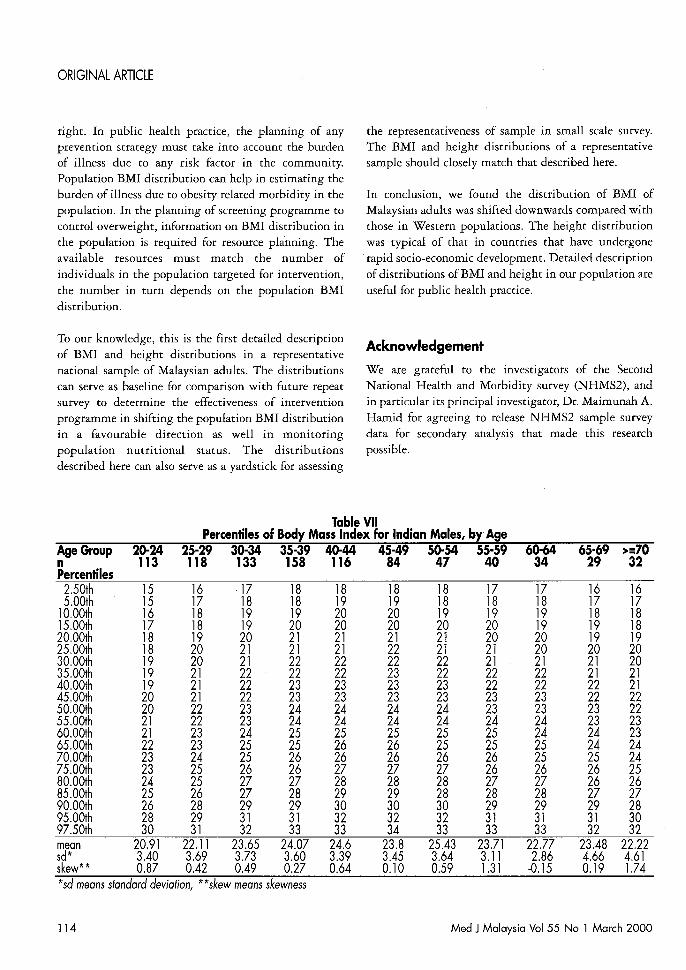
right. In public health practice, the planning of anyprevention strategy must take into account the burdenof illness due to any risk factor in the community.Population BMI distribution can help in estimating theburden of illness due to obesity related morbidity in thepopulation. In the planning of screening programme tocontrol overweight, information on BMI distribution inthe population is required for resource planning. Theavailable resources must match the number ofindividuals in the population targeted for intervention,the number in turn depends on the population BMIdistribution.
To our knowledge, this is the first detailed descriptionof BMI and height distributions in a representativenational sample of Malaysian adults. The distributionscan serve as baseline for comparison with future repeatsurvey to determine the effectiveness of interventionprogramme in shifting the population BMI distributionin a favourable direction as well in monitoringpopulation nutritional status. The distributionsdescribed here can also serve as a yardstick for assessing
the representativeness of sample in small scale survey.The BMI and height distributions of a representativesample should closely match that described here.
In conclusion, we found the distribution of BMI ofMalaysian adults was shifted downwards compared withthose in Western populations. The height distributionwas typical of that in countries that have undergonerapid socio-economic development. Detailed descriptionof distributions of BMI and height in our population areuseful for public health practice.
Acknowledgement
We are grateful to the investigators of the SecondNational Health and Morbidity survey (NHMS2), andin particular its principal investigator, Dr. Maimunah A.Hamid for agreeing to release NHMS2 sample surveydata for secondary analysis that made this researchpossible.
Table VIIPercentiles of Body Mass Index for Indian Malesl by Age
Age Group 20·24 25·29 30·34 35·39 40·44 45·49 50·54 55·59 60·64 65·69 >=70n 113 118 133 158 116 84 47 40 34 29 32Percentiles
2.50th 15 16 17 18 18 18 18 17 17 16 165.00th 15 17 18 18 19 19 18 18 18 17 17
10.00th 16 18 19 19 20 20 19 19 19 18 1815.00th 17 18 19 20 20 20 20 20 19 19 1820.00th 18 19 20 21 21 21 21 20 20 19 1925.00th 18 20 21 21 21 22 21 21 20 20 2030.00th 19 20 21 22 22 22 22 21 21 21 2035.00th 19 21 22 22 22 23 22 22 22 21 2140.00th 19 21 22 23 23 23 23 22 22 22 2145.00th 20 21 22 23 23 23 23 23 23 22 2250.00th 20 22 23 24 24 24 24 23 23 23 2255.00th 21 22 23 24 24 24 24 24 24 23 2360.00th 21 23 24 25 25 25 25 25 24 24 2365.00th 22 23 25 25 26 26 25 25 25 24 2470.00th 23 24 25 26 26 26 26 26 25 25 2475.00th 23 25 26 26 27 27 27 26 26 26 2580.00th 24 25 27 27 28 28 28 27 27 26 2685.00th 25 26 27 28 29 29 28 28 28 27 2790.00th 26 28 29 29 30 30 30 29 29 29 2895.00th 28 29 31 31 32 32 32 31 31 31 3097.50th 30 31 32 33 33 34 33 33 33 32 32mean 20.91 22.11 23.65 24.07 24.6 23.8 25.43 23.71 22.77 23.48 22.22sd* 3.40 3.69 3.73 3.60 3.39 3.45 3.64 3.11 2.86 4.66 4.61skew** 0.87 0.42 0.49 0.27 0.64 0.10 0.59 1.31 -0.15 0.19 1.74*sd means standard deviation, **skew means skewness
114 Med JMalaysia Vol 55 No 1 March 2000
DISTRIBUTION OF BODY WEIGHT, HEIGHT AND BODY MASS INDEX
Table VIIIPercentiles of Body Mass Index for Indian Females, by Age
Age Group 0·24 25·29 30·34 35·39 40·44 45·49 50·54 55·59 60·64 65·69 >=70n 140 140 159 168 126 100 43 56 52 23 30Percentiles
2.50th 15 16 17 18 19 19 19 19 18 16 145.00th 16 17 18 19 19 20 20 19 18 17 15
10.00th 17 18 19 20 20 21 21 20 19 18 1615.00th 17 19 20 20 21 21 21 21 20 19 1720.00th 18 19 20 21 22 22 22 22 21 20 1825.00th 19 20 21 22 22 23 23 22 21 20 1830.00th 19 20 21 22 23 23 23 23 22 21 1935.00th 19 21 22 23 23 24 24 23 22 21 1940.00th 20 21 22 23 24 24 24 24 23 22 2045.00th 20 22 23 24 24 25 25 24 23 22 2050.00th 21 22 23 24 25 25 25 25 24 23 2155.00th 21 23 24 24 25 26 26 25 24 23 2160.00th 22 23 24 25 26 26 26 26 25 24 2265.00th 22 24 25 26 26 27 27 26 26 24 2370.00th 23 24 25 26 27 27 27 27 26 25 2375.00th 24 25 26 27 28 28 28 28 27 26 2480.00th 24 26 27 28 28 29 29 28 28 26 2585.00th 25 27 28 29 29 30 30 29 29 27 2690.00th 26 28 29 30 30 31 31 31 30 29 2795.00th 28 30 31 32 32 33 33 33 32 31 2997.50th 30 31 32 33 34 35 35 34 34 33 31mean 21.21 22.33 24.00 24.53 24.88 25.35 26.13 24.57 25.05 24.47 20.49sd* 4.20 4.38 4.42 5.07 5.41 4.78 4.54 4.91 5.62 3.78 3.45skew** 1.03 0.91 0.68 1.07 2.13 0.42 0.61 0.59 1.74 -0.18 0.22* sd means standard deviation, ** skew means skewness
Table IXPercentiles of Body Mass Index for Other Indigenous Males, by Age
Age Group 20·24 25·29 30·34 35·39 40·44 45-49 50·54 55·59 60·64 65·69 >=70n 257 309 322 280 233 146 152 89 98 49 92Percentiles
2.50th 15 16 17 17 17 16 16 15 14 14 135.00th 16 17 17 18 17 17 17 16 15 15 14
10.00th 17 18 18 19 18 18 18 17 16 16 1515.00th 17 18 19 19 19 19 18 18 17 16 1620.00th 18 19 20 20 20 19 19 18 18 17 1625.00th 18 19 20 20 20 20 19 19 18 18 1730.00th 19 20 21 21 21 20 20 19 19 18 1735.00th 19 20 21 21 21 21 21 20 19 19 1840.00th 20 21 22 22 22 21 21 20 20 19 1845.00th 20 21 22 22 22 22 21 21 20 20 1950.00th 21 22 22 23 23 22 22 21 21 20 2055.00th 21 22 23 23 23 23 22 22 21 21 2060.00th 22 23 24 24 24 23 23 22 22 21 2165.00th 22 23 24 24 24 24 24 23 22 22 2170.00th 23 24 25 25 25 25 24 24 23 22 2275.00th 24 25 25 26 26 25 25 24 24 23 2380.00th 24 25 26 26 26 26 26 25 25 24 2385.00th 25 26 27 27 27 27 27 26 25 25 2490.00th 26 28 28 29 29 28 28 27 27 26 2695.00th 28 29 30 30 30 30 30 29 29 28 2897.50th 30 31 32 32 32 32 32 31 31 30 29mean 21.35 22.02 22.99 23.21 23.59 22.78 22.10 21.56 21.32 21.21 19.81sd* 2.81 3.12 3.35 3.43 4.07 3.56 3.22 3.40 3.56 3.01 3.39skew** 1.40 0.82 0.46 0.55 0.53 0.39 0.33 0.42 1.04 0.40 0.35*sd means standard deviation, **skew means skewness
Med J Malaysia Vol 55 No 1 March 2000 115
ORIGINAL ARTICLE
Table XPercentiles of Body Mass Index for Other Indigenous Females, by Age
Age Group 20·24 25·29 30·34 35·39 40·44 45·49 50·54 55·59 60·64 65·69 >=70n 380 421 417 333 204 193 119 110 100 66 88Percentiles
2.50th 15 16 17 18 17 17 16 15 14 14 135.00th 16 17 18 18 18 18 17 16 15 14 13
10.00th 17 18 19 19 19 19 18 17 16 15 1515.00th 17 19 20 20 20 19 19 18 17 16 1520.00th 18 19 20 20 20 20 19 18 18 17 1625.00th 18 20 21 21 21 20 20 19 18 17 1730.00th 19 20 21 21 21 21 20 20 19 18 1735.00th 19 21 22 22 22 21 21 20 19 18 1840.00th 20 21 22 22 22 22 21 21 20 19 1845.00th 20 22 23 23 23 22 22 21 20 19 1950.00th 21 22 23 23 23 23 22 22 21 20 1955.00th 21 23 24 24 24 23 23 22 21 20 2060.00th 22 23 24 24 24 24 23 23 22 21 2065.00th 22 24 25 25 25 25 24 23 22 22 2170.00th 23 24 25 26 26 25 25 24 23 22 2175.00th 24 25 26 26 26 26 25 25 24 23 2280.00th 24 26 27 27 27 27 26 25 24 24 2385.00th 25 27 28 28 28 28 27 26 25 25 2490.00th 26 28 29 29 29 29 28 28 27 26 2595.00th 28 30 31 31 31 31 30 29 29 28 2797.50th 30 32 32 33 33 33 32 31 31 30 29mean 21.47 22.30 23.38 24.09 24.40 23.08 22.82 22.14 20.52 20.57 19.72sd* 3.93 4.20 3.95 4.52 4.740 4.54 4.54 4.42 4.15 4.23 4.30skew** 1.47 0.95 0.94 0.82 0.45 0.46 0.27 0.31 0.32 0.20 0.58*sd means standard deviation, **skew means skewness
Table XIPercentiles of Body Weight for Malay Males, by Age
Age Group 20·24 25·29 30·34 35·39 40·44 45·49 50·54 55·59 60·64 65·69 >=70n 749 810 834 819 709 594 422 398 286 205 214Percentiles
2.50th 42 45 47 47 47 46 45 43 41 38 365.00th 44 47 49 49 49 48 47 45 43 40 38
10.00th 46 49 51 52 52 51 49 48 45 43 4115.00th 48 51 53 54 54 53 51 49 47 45 4320.00th 49 53 55 55 55 54 53 51 49 47 4425.00th 51 54 56 57 57 56 55 53 50 48 4630.00th 52 55 57 58 58 57 56 54 52 50 4735.00th 53 57 59 59 59 59 57 55 53 51 4940.00th 55 58 60 61 61 60 59 57 55 52 5045.00th 56 59 61 62 62 61 60 58 56 54 5150.00th 57 60 62 63 63 63 61 59 57 55 5355.00th 59 62 64 65 65 64 63 61 59 56 5460.00th 60 63 65 66 66 65 64 62 60 58 5565.00th 61 65 67 68 68 67 66 64 62 59 5770.00th 63 66 68 69 69 68 67 65 63 61 5975.00th 65 68 70 71 71 70 69 67 65 63 6180.00th 67 70 72 73 73 72 71 69 67 65 6385.00th 69 72 74 75 76 75 74 72 70 67 6590.00th 72 76 78 79 79 78 77 75 73 71 6995.00th 77 81 83 84 84 83 82 80 78 76 7497.50th 82 85 87 88 89 88 87 85 83 81 79mean 58.53 61.2 63.53 64.78 64.59 64.55 61.63 59.94 59.06 56.19 53.88sd* 10.76 10.71 11.88 11.44 11.17 11.48 10.83 11.41 11.60 10.86 9.66skew** 1.41 0.97 0.86 0.58 0.60 0.52 0.64 0.89 0.64 0.34 0.55*sd means standard deviation, **skew means skewness
116 Med JMalaysia Vol 55 No 1 March 2000
DISTRIBUTION OF BODY WEIGHT, HEIGHT AND BODY MASS INDEX
ORIGINAL ARTICLE
Table XIVPercentiles of Body Weight for Chinese Females, by Age
Age Group 20·24 25·29 30·34 35·39 40·44 45·49 50·54 55·59 60·64 65·69 >=70n 453 447 527 535 528 419 317 264 212 153 172Percentiles
2.50th 34 36 38 39 40 41 40 40 38 36 345.00th 36 38 40 41 42 43 42 42 40 39 36
10.00th 39 41 43 44 45 45 45 44 43 41 3915.00th 41 43 44 46 47 47 47 46 45 43 4120.00th 42 44 46 47 48 49 49 48 47 45 4225.00th 44 46 47 49 50 50 50 50 48 46 4430.00th 45 47 49 50 51 52 52 51 50 48 4535.00th 46 48 50 51 52 53 53 52 51 49 4740.00th 47 50 51 53 54 54 54 54 52 51 4845.00th 49 51 53 54 55 56 55 55 54 52 4950.00th 50 52 54 55 56 57 57 56 55 53 5155.00th 51 53 55 57 58 58 58 58 56 55 5260.00th 53 55 57 58 59 60 60 59 58 56 5465.00th 54 56 58 60 61 61 61 61 59 58 5570.00th 56 58 60 61 62 63 63 62 61 59 5775.00th 57 60 61 63 64 65 65 64 63 61 5980.00th 59 62 64 65 66 67 67 66 65 63 6185.00th 62 64 66 67 69 69 69 69 68 66 6390.00th 65 67 69 71 72 72 72 72 71 69 6795.00th 70 72 74 76 77 77 78 77 76 74 7297.50th 75 77 79 80 82 82 82 82 81 79 77mean 51.12 52.9 55.91 56.06 57.37 58.11 58.26 57.1 55.59 56.02 51.21sd* 8.79 9.37 9.44 9.31 9.99 9.62 9.70 9.10 10.74 11.01 10.45skew** 1.47 1.32 1.09 0.63 0.79 0.61 0.39 0.42 1.02 0.35 0.60*sd means standard deviation, **skew means skewness
Table XVPercentiles of Body Weight for Indian Males, by Age
Age Group 20·24 25·29 30·34 35·39 40·44 45·49 50·54 55·59 60·64 65·69 >=70n 113 118 133 158 116 84 47 40 34 29 32Percentiles
2.50th 43 47 49 51 51 51 50 49 47 44 415.00th 45 49 51 53 53 53 52 51 49 46 43
10.00th 47 51 54 55 56 56 55 53 51 49 4615.00th 49 53 55 57 58 58 57 55 53 51 4820.00th 51 54 57 59 59 59 58 57 55 52 4925.00th 52 56 59 60 61 61 60 58 56 54 5130.00th 54 57 60 62 62 62 61 60 58 55 5235.00th 55 59 61 63 64 63 63 61 59 57 5440.00th 56 60 62 64 65 65 64 63 61 58 5545.00th 57 61 64 65 66 66 65 64 62 59 5750.00th 59 62 65 67 67 67 67 65 63 61 5855.00th 60 64 66 68 69 69 68 67 65 62 5960.00th 61 65 68 69 70 70 69 68 66 64 6165.00th 63 67 69 71 72 72 71 70 68 65 6270.00th 64 68 71 73 73 73 73 71 69 67 6475.00th 66 70 73 74 75 75 74 73 71 69 6680.00th 68 72 75 76 77 77 76 75 73 71 6885.00th 71 74 77 79 80 80 79 78 76 73 7190.00th 74 78 80 82 83 83 82 81 79 77 7495.00th 79 83 85 87 88 88 87 86 84 82 7997.50th 83 87 90 92 93 93 92 91 89 87 84mean 59.76 62.56 67.38 67.28 69.02 67.54 69.98 66.89 62.4 63.03 57.78sd* 9.98 10.93 10.81 10.76 10.13 10.81 11.44 11.03 8.65 14.47 14.2skew** 0.99 0.17 0.08 0.21 0.27 0.30 -0.09 1.07 -0.23 0.03 1.28*sd means standard deviation, **skew means skewness
118 Med J Malaysia Vol 55 No 1 March 2000
DISTRIBUTION OF BODY WEIGHT, HEIGHT AND BODY MASS INDEX
Table XVIPercentiles of Body Weight for Indian Femalesl by Age
Age Group 20-24 25-29 30-34 35-39 40-44 45-49 50-54 55-59 60-64 65-69 >=70n 140 140 159 168 126 100 43 56 52 23 30Percentiles
2.50th 35 38 40 42 43 43 42 41 38 34 295.00th 37 40 42 44 45 45 44 43 40 36 31
10.00th 39 42 45 47 48 48 47 45 43 39 3415.00th 41 44 47 48 50 50 49 47 45 41 3620.00th 43 46 48 50 51 51 51 49 46 43 3825.00th 44 47 50 52 53 53 52 51 48 44 3930.00th 45 48 51 53 54 54 54 52 49 46 4135.00th 47 50 52 54 55 56 55 53 51 47 4240.00th 48 51 54 55 57 57 56 55 52 48 4345.00th 49 52 55 57 58 58 58 56 53 50 4550.00th 50 54 56 58 59 59 59 57 55 51 4655.00th 52 55 57 59 61 61 60 59 56 52 4860.00th 53 56 59 61 62 62 62 60 57 54 4965.00th 54 58 60 62 63 64 63 62 59 55 5170.00th 56 59 62 64 65 65 65 63 61 57 5275.00th 58 61 64 66 67 67 67 65 63 59 5480.00th 60 63 66 68 69 69 69 67 65 61 5685.00th 62 66 68 70 71 72 71 70 67 64 5990.00th 65 69 71 73 75 75 74 73 70 67 6295.00th 70 74 76 78 80 80 80 78 76 72 6797.50th 75 78 81 83 84 85 84 83 80 77 72mean 51.28 54.7 58.56 58.77 59.81 60.85 60.84 57.13 56.81 54.82 46.1sd* 10.72 11.34 11.52 12.01 12.13 11.59 12.20 12.15 10.08 9.41 6.04skew** 1.04 0.81 0.52 0.61 0.77 0.19 0.57 0.49 -0.08 0.25 0.27*sd means standard deviation, **skew means skewness
Table XVIIPercentiles of Body Weight for Other Indigenous Malesl by Age
Age Group 20-24 25-29 30-34 35-39 40-44 45-49 50-54 55-59 60-64 65-69 >=70n 257 309 322 280 233 146 152 89 98 49 92Percentiles
2.50th 40 42 44 44 43 42 40 38 35 33 315.00th 42 44 46 46 45 44 42 40 38 35 33
10.00th 44 47 48 49 48 47 45 43 40 38 3615.00th 46 49 50 50 50 49 47 45 42 40 3820.00th 48 50 52 52 52 50 48 46 44 42 4025.00th 49 52 53 54 53 52 50 48 45 43 4130.00th 50 53 55 55 54 53 51 49 47 45 4335.00th 52 54 56 56 56 54 53 50 48 46 4440.00th 53 56 57 57 57 56 54 52 49 47 4545.00th 54 57 58 59 58 57 55 53 51 49 4750.00th 55 58 60 60 60 58 57 54 52 50 4855.00th 57 59 61 61 61 60 58 56 54 51 4960.00th 58 61 62 63 62 61 59 57 55 53 5165.00th 59 62 64 64 64 63 61 59 56 54 5270.00th 61 64 65 66 65 64 62 60 58 56 5475.00th 63 66 67 68 67 66 64 62 60 58 5680.00th 65 68 69 70 69 68 66 64 62 60 5885.00th 67 70 72 72 72 71 69 67 65 62 6190.00th 70 73 75 75 75 74 72 70 68 66 6495.00th 75 78 80 81 80 79 77 75 73 71 6997.50th 80 83 85 85 85 84 82 80 78 76 74mean 57.00 58.53 60.66 61.18 62.41 58.87 56.07 54.82 54.39 53.14 48.55sd* 8.37 9.06 10.53 9.96 12.09 10.42 9.61 10.54 10.88 10.00 9.20skew** 0.97 1.09 0.74 0.57 0.43 0.26 0.70 0.40 1.22 0.59 0.11*sd means standard deviation, **skew means skewness
Med J Malaysia Vol 55 No 1 March 2000 119
ORIGINAL ARTICLE
Table XVIIIPercentiles of Body Weight for Other Indigenous Females, by Age
Age Group , 20·24 25·29 30·34 35·39 40·44 45·49 50·54 55·59 60-64 65·69 >=70n 380 421 417 333 204 193 119 110 100 66 88Percentiles
2.50th 32 35 37 38 37 35 33 31 28 26 235.00th 34 37 39 40 39 37 35 33 30 28 26
10.00th 37 40 42 42 41 40 38 36 33 31 2815.00th 38 42 44 44 43 42 40 38 35 33 3020.00th 40 43 45 46 45 44 42 39 37 34 3225.00th 41 45 47 47 46 45 43 41 38 36 3430.00th 43 46 48 48 48 46 44 42 40 37 3535.00th 44 47 49 50 49 48 46 43 41 39 3640.00th 45 49 50 51 50 49 47 45 42 40 3845.00th 47 50 52 52 52 50 48 46 44 41 3950.00th 48 51 53 54 53 52 50 47 45 43 4055.00th 49 52 54 55 54 53 51 49 46 44 4260.00th 50 54 56 56 56 54 53 50 48 45 4365.00th 52 55 57 58 57 56 54 52 49 47 4570.00th 54 57 59 59 59 58 56 53 51 49 4775.00th 55 59 61 61 61 59 58 55 53 50 4880.00th 57 61 63 63 63 61 60 57 55 53 5185.00th 60 63 65 66 65 64 62 60 57 55 5390.00th 63 66 68 69 69 67 65 63 61 58 5695.00th 68 71 73 74 74 72 71 68 66 64 6297.50th 72 76 78 79 78 77 75 73 71 68 66mean 49.59 51.55 53.86 55.75 55.65 51.85 51.40 49.10 44.34 44.37 42.00sd* 9.91 9.98 10.38 11.11 11.49 11.03 10.69 10.27 9.21 9.70 10.41skew** 1.76 0.99 1.01 0.79 0.56 0.27 0.23 0.23 0.33 0.14 0.64*sd means standard deviation, **skew means skewness
Table XIXPercentiles of Height for Malay males, by age
Age Group 20·24 25·29 30·34 35·39 40·44 45·49 50·54 55·59 60·64 65·69 >=70n 749 810 834 819 709 594 422 398 286 205 214Percentiles
2.50th 155 154 154 153 153 152 151 150 149 148 1475.00th 156 156 156 155 155 154 153 152 151 150 149
10.00th 159 158 158 157 157 156 155 154 153 152 15115.00th 160 160 159 159 158 158 157 156 155 154 15320.00th 161 161 161 160 160 159 158 157 156 155 15425.00th 162 162 162 161 161 160 159 158 157 156 15530.00th 163 163 162 162 161 161 160 159 158 157 15635.00th 164 164 163 163 162 162 161 160 159 158 15740.00th 165 164 164 164 163 162 162 161 160 159 15845.00th 165 165 165 164 164 163 163 162 161 160 15850.00th 166 166 166 165 165 164 163 162 161 160 15955.00th 167 167 166 166 165 165 164 163 162 161 16060.00th 168 168 167 167 166 166 165 164 163 162 16165.00th 169 168 168 168 167 166 166 165 164 163 16270.00th 169 169 169 168 168 167 167 166 165 164 16375.00th 170 170 170 169 169 168 168 167 166 165 16480.00th 171 171 171 170 170 169 169 168 167 166 16585.00th 172 172 172 172 171 171 170 169 168 167 16690.00th 174 174 174 173 173 172 171 171 170 169 16895.00th 176 176 176 175 175 174 174 173 172 171 17097.50th 178 178 178 177 177 176 176 175 174 173 172mean 166.3 165.65 165.83 165.55 164.83 164.27 163.27 161.72 161.06 160.16 159.94sd* 6.46 6.81 6.37 6.45 6.18 6.53 6.29 6.17 7.83 6.37 8.83skew** -0.20 -0.46 0.01 0.03 -0.20 -0.11 -1.02 -0.03 -1.91 -0.29 -1.92*sd means standard deviation, **skew means skewness
120 Med J Malaysia Vol 55 No 1 March 2000
DISTRIBUTION OF BODY WEIGHT, HEIGHT AND BODY MASS INDEX
Table XXPercentiles of Height for Malay Femalesl by Age
Age Group 20·24 25·29 30·34 35·39 40·44 45·49 50·54 55·59 60·64 65-69 >=70n 893 903 939 942 842 602 454 391 306 204 221Percentiles
2.50th 143 143 143 142 141 141 140 139 138 136 1355.00th 145 145 144 144 143 143 142 141 140 138 137
10.00th 147 147 147 146 146 145 144 143 142 141 13915.00th 148 148 148 148 147 146 146 145 143 142 14120.00th 150 150 149 149 148 148 147 146 145 143 14225.00th 151 151 150 150 149 149 148 147 146 144 14330.00th 152 151 151 151 150 150 149 148 147 145 14435.00th 152 152 152 152 151 150 150 149 147 146 14540.00th 153 153 153 152 152 151 150 149 148 147 14645.00th 154 154 154 153 153 152 151 150 149 148 14650.00th 155 155 154 154 153 153 152 151 150 149 14755.00th 155 155 155 155 154 154 153 152 151 149 14860.00th 156 156 156 156 155 154 154 153 152 150 14965.00th 157 157 157 156 156 155 154 153 152 151 15070.00th 158 158 158 157 157 156 155 154 153 152 15175.00th 159 159 158 158 158 157 156 155 154 153 15280.00th 160 160 160 159 159 158 157 156 155 154 15385.00th 161 161 161 160 160 159 158 158 157 155 15490.00th 162 162 162 162 161 161 160 159 158 157 15695.00th 165 165 165 164 164 163 162 161 160 159 15897.50th 167 167 166 166 166 165 164 164 163 161 160mean 154.65 154.30 154.77 154.09 153.45 152.96 152.22 150.58 148.88 149.08 148.01sd' 6.04 6.13 5.95 6.01 6.21 6.09 6.91 5.94 7.74 6.52 7.70skew" 0.22 -0.46 0.06 0.24 0.80 0.47 0.19 0.47 -1.66 -0.03 0.52'sd means standard deviation, "skew means skewness
Table XXIPercentiles of Height for Chinese Malesl by Age
Age Group 20·24 25·29 30·34 35·39 40·44 45·49 50·54 55·59 60·64 65·69 >=70n 407 425 463 429 420 411 307 243 197 141 149Percentiles
2.50th 157 157 156 155 155 154 153 152 151 150 1495.00th 159 158 158 157 157 156 155 154 153 152 151
10.00th 161 161 160 160 159 158 157 156 156 155 15415.00th 163 162 162 161 160 160 159 158 157 156 15520.00th 164 163 163 162 162 161 160 159 158 157 15625.00th 165 164 164 163 163 162 161 160 159 158 15730.00th 166 165 165 164 163 163 162 161 160 159 15835.00th 166 166 166 165 164 164 163 162 161 160 15940.00th 167 167 166 166 165 164 164 163 162 161 16045.00th 168 168 167 167 166 165 164 164 163 162 16150.00th 169 168 168 167 167 166 165 164 164 163 16255.00th 170 169 169 168 167 167 166 165 164 163 16260.00th 170 170 169 169 168 168 167 166 165 164 16365.00th 171 171 170 170 169 168 168 167 166 165 16470.00th 172 172 171 171 170 169 169 168 167 166 16575.00th 173 172 172 171 171 170 170 169 168 167 16680.00th 174 173 173 173 172 171 171 170 169 168 16785.00th 175 175 174 174 173 173 172 171 170 169 16890.00th 177 176 176 175 175 174 173 173 172 171 17095.00th 179 178 178 178 177 176 176 175 174 173 17297.50th 181 180 180 180 179 178 178 177 176 175 174mean 168.45 168.84 168.35 166.89 166.42 166.26 165.46 164.92 163.13 162.51 162.22sd' 6.98 6.09 6.44 6.33 6.40 6.87 6.62 6.65 7.01 6.64 7.19skew" -0.38 0.05 -0.51 -0.19 0.06 0.46 -0.73 -0.03 0.10 -0.04 -0.19, sd means standard deviation, " skew means skewness
Med J Malaysia Vol 55 No 1 March 2000 121
ORIGINAL ARTICLE
Table XXIIPercentiles of Height for Chinese Females, by Age
Age Group 20·24 25·29 30·34 35·39 40·44 45·49 50·54 55·59 60-64 65·69 >=70n 453 447 527 535 528 419 317 264 212 153 172Percentiles
2.50th 146 146 146 145 144 144 143 142 141 140 1395.00th 148 148 147 147 146 146 145 144 143 142 141
10.00th 150 150 150 149 149 148 147 146 145 144 14315.00th 152 151 151 151 150 149 149 148 147 146 14520.00th 153 153 152 152 151 151 150 149 148 147 14625.00th 154 154 153 153 152 152 151 150 149 148 14730.00th 155 155 154 154 153 153 152 151 150 149 14835.00th 156 155 155 155 154 153 153 152 151 150 14940.00th 156 156 156 155 155 154 154 153 152 151 15045.00th 157 157 157 156 156 155 154 154 153 152 15150.00th 158 158 157 157 156 156 155 154 154 153 15255.00th 159 159 158 158 157 157 156 155 154 153 15260.00th 160 159 159 159 158 157 157 156 155 154 15365.00th 160 160 160 159 159 158 158 157 156 155 15470.00th 161 161 161 160 160 159 158 158 157 156 15575.00th 162 162 162 161 161 160 159 159 158 157 15680.00th 163 163 163 162 162 161 160 160 159 158 15785.00th 164 164 164 163 163 162 162 161 160 159 15890.00th 166 166 165 165 164 164 163 163 162 161 16095.00th 168 168 168 167 167 166 166 165 164 163 16297.50th 170 170 170 169 169 168 168 167 166 165 164mean 158.10 157.34 157.65 157.21 156.00 156.01 155.03 154.66 153.41 151.94 151.67sd* 6.72 5.88 6.13 6.28 6.13 6.51 5.35 7.28 6.75 6.38 6.22skew** -1.81 0.25 -0.51 -0.66 -0.49 -1.39 0.11 -2.46 -2.22 0.10 -0.93*sd means standard deviation, **skew means skewness
Table XXIIIPercentiles of Height for Indian Males, by Age
Age Group 20·24 25·29 30·34 35·39 40·44 45·49 50·54 55·59 60·64 65·69 >=70n 113 118 133 158 116 84 47 40 34 29 32Percentiles
2.50th 157 157 157 156 156 155 154 153 152 151 1505.00th 159 159 158 158 158 157 156 155 154 153 152
10.00th 161 161 161 160 160 159 159 158 157 155 15415.00th 162 162 162 162 161 161 160 159 158 157 15620.00th 163 163 163 163 163 162 161 160 159 158 15725.00th 164 164 164 164 164 163 162 161 160 159 15830.00th 165 165 165 165 165 164 163 162 161 160 15935.00th 166 166 166 166 165 165 164 163 162 161 16040.00th 167 167 167 167 166 166 165 164 163 162 16145.00th 168 168 168 167 167 166 166 165 164 163 16150.00th 168 168 168 168 168 167 167 166 165 164 16255.00th 169 169 169 169 169 168 167 166 165 164 16360.00th 170 170 170 170 169 169 168 167 166 165 16465.00th 171 171 171 171 170 170 169 168 167 166 16570.00th 172 172 172 171 171 170 170 169 168 167 16675.00th 173 173 173 172 172 171 171 170 169 168 16780.00th 174 174 174 173 173 172 172 171 170 169 16885.00th 175 175 175 175 174 174 173 172 171 170 16990.00th 176 176 176 176 176 175 175 174 173 172 17195.00th 178 179 179 178 178 178 177 176 175 174 17397.50th 180 181 181 180 180 180 179 178 177 176 175mean 169.11 168.16 168.9 167.18 167.49 168.37 165.75 167.71 165.57 163.43 160.73sd* 5.84 6.46 8.11 6.76 6.38 6.27 8.09 6.74 7.54 8.32 6.65skew** 0.21 -0.02 -0.33 -0.03 -0.12 0.07 0.19 0.51 -0.07 0.16 -0.05*sd means standard deviation, **skew means skewness
122 Med J Malaysia Vol 55 No 1 March 2000
DISTRIBUTION OF BODY WEIGHT, HEIGHT AND BODY MASS INDEX
Table XXIVPercentiles of Height for Indian Females, by Age
Age Group 20-24 25-29 30-34 35-39 40-44 45-49 50-54 55-59 60-64 65-69 >=70n 140 140 159 168 126 100 43 56 52 23 30Percentiles
2.50th 144 144 144 143 143 142 142 141 140 138 1375.00th 146 146 146 145 145 144 143 143 142 140 139
10.00th 148 148 148 148 147 146 146 145 144 143 14115.00th 150 150 149 149 149 148 147 146 145 144 14320.00th 151 151 151 150 150 149 148 148 147 145 14425.00th 152 152 152 151 151 150 149 149 148 147 '14530.00th 153 153 153 152 152 151 150 150 149 147 14635.00th 154 154 153 153 153 152 151 150 149 148 14740.00th 154 154 154 154 153 153 152 151 150 149 14845.00th 155 155 155 155 154 154 153 152 151 150 14950.00th 156 156 156 155 155 154 154 153 152 151 15055.00th 157 157 156 156 156 155 154 154 153 152 15060.00th 157 157 157 157 156 156 155 154 154 152 15165.00th 158 158 158 158 157 157 156 155 154 153 15270.00th 159 159 159 159 158 158 157 156 155 154 15375.00th 160 160 160 160 159 159 158 157 156 155 15480.00th 161 161 161 161 160 160 159 158 157 156 15585.00th 162 162 162 162 161 161 160 159 159 157 15690.00th 164 164 164 163 163 162 162 161 160 159 15895.00th 166 166 166 166 165 165 164 163 162 161 16097.50th 168 168 168 168 167 167 166 165 164 163 162mean 155.44 156.47 156.10 154.84 155.25 154.97 152.36 152.39 151.30 149.62 150.66sd* 6.18 6.59 6.11 6.11 7.54 6.12 6.71 6.40 8.21 6.04 8.83skew** -0.06 0.18 0.39 0.02 -1.66 -0.38 0.84 -0.16 -2.51 0.06 0.71*sd means standard deviation, **skew means skewness
Table XXVPercentiles of Height for Other Indigenous Males, by Age
Age Group 20-24 25-29 30-34 35-39 40-44 45-49 50-54 55-59 60-64 65-69 >=70n 257 309 322 280 233 146 152 89 98 49 92Percentiles
2.50th 152 151 151 150 149 149 148 147 146 145 1445.00th 153 153 153 152 151 151 150 149 148 147 146
10.00th 156 155 155 154 154 153 152 151 150 149 14815.00th 157 157 156 156 155 154 154 153 152 151 15020.00th 158 158 157 157 156 156 155 154 153 152 15125.00th 159 159 158 158 157 157 156 155 154 153 15230.00th 160 160 159 159 158 158 157 156 155 154 15335.00th 161 161 160 160 159 158 158 157 156 155 15440.00th 162 161 161 160 160 159 159 158 157 156 15545.00th 163 162 162 161 161 160 159 159 158 157 15650.00th 163 163 163 162 161 161 160 159 158 158 15755.00th 164 164 163 163 162 162 161 160 159 158 15760.00th 165 164 164 164 163 162 162 161 160 159 15865.00th 166 165 165 164 164 163 163 162 161 160 15970.00th 166 166 166 165 165 164 163 163 162 161 16075.00th 167 167 167 166 166 165 164 164 163 162 16180.00th 168 168 168 167 167 166 165 165 164 163 16285.00th 170 169 169 168 168 167 167 166 165 164 16390.00th 171 171 170 170 169 169 168 167 167 166 16595.00th 173 173 173 172 172 171 171 170 169 168 16797.50th 175 175 175 174 174 173 173 172 171 170 169mean 163.33 163.04 162.23 162.28 162.45 160.62 159.14 159.12 159.44 157.86 156.39sd* 6.26 6.78 6.15 6.29 6.87 6.86 6.78 6.77 7.15 6.39 6.72skew** 0.07 0.34 -0.16 0.38 0.28 -0.28 -0.13 0.10 1.12 -0.67 0.01*sd means standard deviation, ** skew means skewness
Med J Malaysia Vol 55 No 1 March 2000 123
ORIGINAL ARTICLE
Table XXVIPercentiles of Height for Other Indigenous Females, by Age
Age Group 20-24 25-29 30·34 35-39 40-44 45·49 50-54 55-59 60·64 65-69 >=70n 380 421 417 333 204 193 119 110 100 66 88Percentiles
2.50th 140 140 140 140 139 138 138 137 135 134 1335.00th 142 142 142 141 141 140 139 138 137 136 135
10.00th 144 144 144 144 143 142 142 141 140 138 13715.00th 146 146 145 145 145 144 143 142 141 140 13920.00th 147 147 147 146 146 145 144 143 142 141 14025.00th 148 148 148 147 147 146 145 145 143 142 14130.00th 149 149 149 148 148 147 146 145 144 143 14235.00th 150 150 149 149 149 148 147 146 145 144 14340.00th 150 150 150 150 149 149 148 147 146 145 14445.00th 151 151 151 151 150 150 149 148 147 146 14450.00th 152 152 152 151 151 150 150 149 148 147 14555.00th 153 153 153 152 152 151 150 150 148 147 14660.00th 154 153 153 153 153 152 151 150 149 148 14765.00th 154 154 154 154 153 153 152 151 150 149 14870.00th 155 155 155 155 154 154 153 152 151 150 14975.00th 156 156 156 156 155 155 154 153 152 151 15080.00th 157 157 157 157 156 156 155 154 153 152 15185.00th 158 158 158 158 157 157 156 155 154 153 15290.00th 160 160 160 159 159 158 158 157 156 155 15395.00th 162 162 162 162 161 161 160 159 158 157 15697.50th 164 164 164 164 163 163 162 161 160 159 158mean 151.91 152.08 151.63 152.06 151.00 149.75 150.04 148.93 147.01 146.74 145.58sd* 5.95 5.80 6.92 5.67 6.74 6.59 5.74 7.25 5.77 6.01 6.33skew** -0.05 -0.20 0.99 0.16 -1.57 -1.65 0.28 2.30 -0.05 -0.18 -0.33*sd means standard deviation, **skew means skewness
Table XXVIICrude and Age-adjusted Mean Height, Body Weight and BMI
Height, em Weight, Kg BMI, Kg/m2
Crude Age-adjusted Crude Age-adjusted Crude Age-adjusted(SE) (SE) (SE) (SE) (SE) (SE)
All 159.6 (0.1) 159.6 «0.1) 58.3 (0.1) 58.3 «0.1) 22.9 «0.1) 22.9 «0.1)men 165.0 (0.3) 165.0 (0.1) 61.9 (0.4) 61.8 (0.1) 22.7 «0.1) 22.7 «0.1)women 154.0 (0.3) 154.0 (0.1) 54.6 (0.3) 54.7 (0.1) 23.1 (0.3) 23.1 «0.1)
Malay 158.9 (0.3) 158.9 (0.1) 58.2 (0.4) 58.2 (0.1) 23.1 (0.3) 23.1 «0.1)men 164.7 (0.3) 164.7 (0.1) 61.7 (0.4) 61.6 (0.2) 22.7 (0.3) 22.7 (0.1)women 153.3 (0.3) 153.3 (0.1) 55.0 (0.4) 55.0 (0.2) 23.4 (0.3) 23.4 (0.1)
Chinese 161.4 (0.3) 161.7 (0.1) 59.9 (0.4) 59.8 (0.2) 22.9 (0.3) 22.8 (0.1)men 166.7 (0.4) 166.9 (0.1) 64.6 (0.4) 64.6 (0.2) 23.2 (0.3) 23.2 (0.1)women 156.2 (0.3) 156.5 (0.1) 55.2 (0.4) 55.0 (0.2) 22.7 (0.3) 22.5 (0.1)
Indian 161.1 (0.5) 161.1 (0.2) 60.9 (0.5) 60.7 (0.3) 23.4 (0.3) 23.4 (0.1)men 167.6 (0.5) 167.6 (0.3) 65.1 (0.6) 64.9 (0.4) 23.2 (0.3) 23.1 (0.1)women 154.7 (0.5) 154.7 (0.2) 56.7 (0.6) 56.5 (0.4) 23.7 (0.4) 23.6 (0.2)
Other 156.4 (0.4) 156.3 (0.1) 54.9 (0.5) 54.9 (0.2) 22.4 (0.3) 22.4 (0.1)indigenous men 161.8(0.4) 161.6 (0.2) 58.3 (0.5) 58.3 (0.2) 22.2 (0.3) 22.3 (0.1)
Women 150.9 (0.4) 150.8 (0.1) 51.4 (0.5) 51.5 (0.2) 22.6 (0.3) 22.6 (0.1)*Age-adjusted to the 1996 Malaysian population
124 Med JMalaysia Vol 55 No 1 March 2000
DISTRIBUTION OF BODY WEIGHT, HEIGHT AND BODY MASS INDEX
Table XXVIIIAge Specific Mean Height, Weight and 8MI
Age group Height (SE) Weight (SE) 8MI (SE)cm Kg Kg/m2
Malay men 20-29 166.0 (0.2) 59.8 (0.3) 21.7 (0.1)30 -39 165.7 (0.2) 64.1 (0.3) 23.3 (0.1)40-49 164.6 (0.2) 64.6 (0.4) 23.8 (O.ll50 -59 162.6 (0.2) 60.9 (0.4) 23.0 (0.260 -69 160.7 10.4) 57.9 (0.6j 22.4 (0.2)>=70 159.9 0.7) 53.9 (0.7 21.1 (0.3)
Malay women 20 -29 154.5 (0.2) 52.2 (0.3) 21.9 (0.1)30 -39 154.5 (0.2) 57.4 (0.3) 24.1 (0.1)40-49 153.2 (0.2) 58.7 (0.3) 25.0 (0.1)50-59 151.5 (0.3) 56.1 (0.5) 24.5 (0.2)60- 69 149.0 (0.4) 51.1 10.6) 23.0 (0.3)>=70 148.0 (0.6) 47.4 0.8) 21.5 (0.3)
Chinese men 20 -29 168.6 (0.3) 63.7 10.5) 22.4 (0.2j30 -39 167.6 (0.3) 66.7 0.4) 23.7 (0.140-49 166.3 (0.3) 66.1 (0.5) 23.9 (0.1)50-59 165.2 (0.3) 63.9 (0.5) 23.4 (0.2)60-69 162.9 (0.4) 61.2 (0.6) 23.1 (0.2)>=70 162.2 (0.6) 58.0 (1.0) 22.0 (0.3)
Chinese women 20 -29 157.7 10.3) 51.9 (0.3) 20.9 (0.1)30 -39 157.4 0.2) 56.0 (0.3) 22.6 (0.1)40-49 156.0 (0.2) 57.7 (0.3) 23.8 (0.2)50-59 154.9 (0.3) 57.7 10.4) 24.1 (0.2)60-69 152.8 (0.4) 55.8 0.7) 23.9 (0.3)>=70 151.7 (0.5) 51.2 (0.8) 22.3 (0.4)
Indian men 20 -29 168.7 fO.4) 61.1 (0.7) 21.5 (0.2)30- 39 168.1 0.5) 67.3 (0.7) 23.9 (0.2)40-49 167.910.5) 68.4 (0.81 24.3 (0.3)50-59 166.6 0.9) 68.6 (1.4 24.7 (0.5)60-69 164.6 (1.0) 62.7 (1.6) 23.1 (0.5)>=70 160.7 (1.1) 57.8 (2.4) 22.2 (0.8)
Indian women 20 -29 155.9 (0.5) 52.9 (0.8) 21.7 (0.3)30 -39 155.5 (0.4) 58.7 (0.7) 24.3 (0.3)40-49 155.1 (0.51 60.3 fO.8) 25.1 (0.3)50-59 152.4 (0.9 59.1 1.7) 25.4 (0.6)60-69 150.6 (0.9) 56.0 (1.3) 24.810.6)>=70 150.7 (2.0) 46.1 (1.2) 20.5 0.7)
Other indigenous men 20 -29 163.2 (0.3) 57.7 (0.4) 21.7 (0.1)30 -39 162.3 (0.3) 60.9 (0.51 23.1 (0.2)40-49 161.7 (0.4) 60.9 (0.7 23.2 (0.2)50 -59 159.1 (0.5) 55.5 (0.7) 21.9 (0.2)60-69 158.8 (0.6) 53.9 (0.8) 21.3 (0.2)>=70 156.4 (0.8) 48.5 (1.0) 19.8 (0.4)
Other indigenous women 20 -29 152.0 (0.3) 50.5 (0.4) 21.9 10.2)30 -39 151.8 (0.3) 54.7 (0.4) 23.7 0.2)40-49 150.4 (0.3) 54.0 (0.6) 23.8 (0.3)50-59 149.5 (0.4) 50.4 (0.7) 22.5 (0.3)60 -69 146.9 (0.5) 44.4 (0.8) 20.5 (0.3)>=70 145.6 (0.7) 42.0 (1.2) 19.7 (0.5)
Med J Malaysia Vol 55 No 1 March 2000 125
ORIGINAL ARTICLE
Table XXIXCrude Percentage Distribution of BMI According to WHO* Classification
Thinness Normal OverweightGrade 3 (SE) Grade 2 (SE) Grade 1 (SE) Normal (SE) Grade 1 (SE) Grade 2 (SE) Grade 3 (SE)
BMI <16 16-16.99 17-18.49 18.5-24.99 25-29.99 30-39.99 >=40All 2.0 (0.1) 2.5 (0.1) 8.2 (0.2) 60.8 (0.4) 20.7 (0.3) 5.5 (0.2) 0.3 (0.0)
men 1.5 (0.1) 2.1 (0.1) 7.9 (0.3) 64.5 (0.5) 20.1 (0.4) 3.8 (0.2) 0.2 (0.0)women 2.6 (0.2) 3.0 (0.2) 8.5 (0.3) 56.8 (0.5) 21.4 (0.4) 7.2 (0.3) 0.4 (0.1)
Malay 2.3 (0.2) 2.7 (0.2) 8.4 (0.3) 57.5 (0.5) 22.0 (0.4) 6.6 (0.3) 0.4 (0.1)men 1.5 (0.2) 2.4 (0.2) 8.3 (0.4) 63.3 (0.7) 20.0 (0.6) 4.3 (0.3) 0.2 (0.1)women 3.1 (0.2) 3.0 (0.2) 8.6 (0.4) 51.9 (0.7) 23.9 (0.6) 8.9 (0.4) 0.6 (0.1)
Chinese 1.4 (0.2) 2.2 (0.2) 7.5 (0.4) 62.3 (0.7) 21.6 (0.6) 4.8 (0.3) 0.2 (0.1)men 1.0 (0.2) 1.7 (0.2) 6.3 (0.5) 61.8 (0.9) 24.5 (0.8) 4.6 (0.4) 0.1 (0.1)women 1.8 (0.2) 2.7 (0.3) 8.8 (0.6) 62.7 (1.0) 18.7 (0.7) 4.9 (0.4) 0.4 (0.1)
Indian 2.2 (0.4) 2.7 (0.4) 6.5 (0.6) 56.8 (1.3) 24.9 (1.1) 6.6 (0.7) 0.2 (0.1)men 1.9 (0.5) 2.0 (0.5) 6.5 (0.9) 61.6 (1.9) 24.2 (1.6) 3.7 (0.7) 0.1 (0.1)women 2.5 (0.5) 3.5 (0.6) 6.5 (0.9) 52.2 (1.8) 25.6 (1.5) 9.4 (0.9) 0.4 (0.2)
Other 2.4 (0.3) 3.0 (0.3) 8.6 (0.5) 63.5 (0.9) 17.9 (0.7) 4.4 (0.4) 0.1 (0.0)indigenous
men 1.1 (0.3) 2.0 (0.3) 8.2 (0.7) 69.3 (1.2) 16.7 (1.0) 2.7 (0.4) 0.0 (0.0)women 3.7 (0.4) 4.0 (0.5) 9.1 (0.7) 57.7 (1.2) 19.1 (0.9) 6.2 (0.6) 0.1 (0.1)
*WHO Expert Committee on Physical Status5
Table XXXAge-adjusted* Percentage Distribution of BMI According to WHO Classification"
Thinness Normal OverweightGrade 3 (SE) Grade 2 (SE) Grade 1 (SE) Normal (SE) Grade 1(SE) Grade 2 (SE) Grade 3 (SE)
BMI <16 16-16.99 17-18.49 18.5-24.99 25-29.99 30-39.99 >=40All 2.0 (0.1) 2.5 (0.1) 8.2 (0.2) 60.8 (0.4) 20.7 (0.3) 5.5 (0.2) 0.3 (0.0)
men 1.5 (0.1) 2.1 (0.1) 7.9 (0.3) 64.5 (0.5) 20.1 (0.4) 3.8 (0.2) 0.2 (0.0)women 2.6 (0.2) 3.0 (0.2) 8.5 (0.3) 56.8 (0.5) 21.4 (0.4) 7.2 (0.2) 0.4 (0.1)
Malay 2.3 (0.2) 2.7 (0.2) 8.5 (0.3) 57.5 (0.5) 22.0 (0.4) 6.6 (0.2) 0.4 (0.1)men 1.5 (0.2) 2.5 (0.2) 8.3 (0.4) 63.3 (0.7) 19.9 (0.5) 4.2 (0.3) 0.2 (0.1)women 3.1 (0.2) 3.0 (0.2) 8.6 (0.4) 51.9 (0.7) 23.9 (0.6) 9.0 (0.4) 0.6 (0.1)
Chinese 1.4 (0.1) 2.3 (0.2) 8.0 (0.4) 62.6 (0.7) 20.9 (0.5) 4.7(0.3) 0.2 (0.1)men 1.0 (0.2) 1.7 (0.2) 6.5 (0.5) 62.1 (0.9) 23.9 (0.8) 4.7 (0.4) 0.1 (0.1)women 1.7 (0.2) 2.9 (0.3) 9.5 (0.6) 63.2 (0.9) 17.7 (0.7) 4.6 (0.4) 0.4 (0.1)
Indian 2.3 (0.4) 2.9 (0.4) 6.7 (0.6) 57.0 (1.3) 24.4 (1.0) 6.5 (0.6) 0.2 (0.1)men 2.0 (0.5) 2.0 (0.5) 6.7 (0.9) 61.7 (1.9) 23.7 (1.5) 3.7 (0.6) 0.1 (0.1)women 2.5 (0.6) 3.7 (0.7) 6.7 (0.9) 52.4 (1.7) 25.1 (1.4) 9.2 (0.9) 0.3 (0.2)
Other 2.5 (0.2) 3.0 (0.3) 8.6 (0.5) 62.9 (0.8) 18.3 (0.6) 4.5 (0.3) 0.1 (0.0)indigenous
men 1.2 (0.2) 2.1 (0.3) 8.3 (0.7) 68.5 (1.1) 17.1 (0.9) 2.8 (0.4) 0.0 (0.0)women 3.8 (0.4) 3.9 (0.5) 8.9 (0.6) 57.3 (1.1) 19.6 (0.8) 6.3 (0.5) 0.1 (0.1)
*Age-adiusted to the- 1996 Malaysian population*WHO Expert Committee on Physical Status5
126 Med J Malaysia Vol 55 No 1 March 2000
DISTRIBUTION OF BODY WEIGHT, HEIGHT AND BODY MASS INDEX
Table XXXIAge Specific Percentage Distribution of 8MI According to WHO' Expert Committee Classification
Thinness Normal OverweishtGrade3 (SE) Grade2 (SE) Gradel (SE) Normal (SE) Gradel (SE) Grade2 (5E) Grade3 (SE)
Malay 20 -29 2.4 0.5 3.6 0.6 11.7 0.9 67.8 1.3 11.4 0.9 2.8 0.5 0.2 0.2men 30 -39 1.0 0.3 1.5 0.3 6.0 0.6 60.7 1.2 25.4 1.1 5.1 0.5 0.3 0.2
40-49 0.4 0.2 1.4 0.4 5.1 0.7 59.2 1.6 28.1 1.4 5.7 0.7 0.0 0.050 -59 0.5 0.3 1.6 0.5 7.3 1.0 64.6 1.9 20.7 1.5 5.3 0.9 0.1 0.160-69 4.4 1.1 1.7 0.6 10.0 1.5 59.0 2.4 21.5 1.9 3.1 0.9 0.3 0.3>=70 1.9 0.9 8.2 2.0 12.3 2.3 66.1 3.6 9.0 2.1 2.5 1.2 0.0 0.0
Malay 20 -29 . 4.4 0.5 4.9 0.5 14.2 0.9 55.9 1.3 15.5 0.9 4.5 0.5 0.7 0.2women 30 -39 1.8 0.3 2.1 0.4 5.7 0.6 52.6 1.3 27.0 1.1 10.2 0.8 0.6 0.2
40-49 0.9 0.3 1.2 0.3 4.7 0.6 45.9 1.5 33.2 1.4 13.6 1.0 0.5 0.250 -59 2.8 0.6 2.6 0.6 6.7 1.0 43.9 1.9 30.1 1.8 13.7 1.3 0.2 0.260- 69 6.3 1.3 1.9 0.6 7.7 1.3 53.4 2.4 22.5 2.1 7.4 1.4 0.8 0.5>=70 7.1 2.0 5.3 1.7 7.3 1.8 62.2 3.7 12.9 2.5 5.2 1.5 0.0 0.0
Chinese 20 -29 0.9 0.3 2.0 0.5 9.2 1.3 68 1.9 15.6 1.4 4.3 0.8 0.0 0.0men 30 - 39 0.6 0.2 1.2 0.4 5.2 0.8 57.9 1.8 29.0 1.6 5.8 0.9 0.4 0.3
40-49 0.6 0.3 1.3 0.4 4.0 0.7 58.6 1.9 30.2 1.7 5.5 0.8 0.0 0.050 -59 0.9 0.4 1.1 0.4 5.8 1.1 61.2 2.2 27.3 2.0 3.8 0.8 0.0 0.060- 69 2.1 0.9 3.7 1.2 4.4 1.1 61.0 3.0 25.0 2.6 3.9 1.0 0.0 0.0>=70 4.4 1.8 3.7 1.8 10.2 2.7 63.5 4.3 18.2 3.5 0.0 0.0 0.0 0.0
Chinese 20 -29 2.2 0.5 5.1 0.8 18.6 1.5 63.0 1.9 7.9 1.0 2.8 0.6 0.3 0.2women 30 - 39 1.3 0.4 2.4 0.5 5.4 0.8 68.4 1.8 18.2 1.4 4.0 0.7 0.3 0.2
40-49 0.9 0.3 0.8 0.3 5.0 0.8 61.5 1.8 25.3 1.6 6.2 0.8 0.3 0.250 -59 1.1 0.5 1.3 0.6 4.4 1.0 58.5 2.1 26.5 1.9 7.9 1.2 0.4 0.460- 69 1.4 0.6 2.7 0.9 3.6 1.1 57.9 2.8 26.6 2.6 6.7 1.6 1.1 0.6>=70 6.2 2.0 2.6 1.5 9.1 2.3 57.3 4.1 19.9 3.4 4.4 1.5 0.5 0.5
4.0 1.3 3.3 1.2 14.0 2.4 64.0 3.8 12.5 2.3 2.3 0.9 0.0 0.01.1 0.6 1.4 0.7 4.6 1.4 58.8 3.1 30.3 3.0 3.8 1.2 0.0 0.00.4 0.4 0.4 0.4 3.3 1.3 59.4 3.5 31.6 3.3 4.9 1.5 0.0 0.00.0 0.0 0.0 0.0 1.5 1.1 61.3 6.4 29.7 5.4 7.5 3.0 0.0 0.03.5 2.6 3.9 2.7 1.6 1.5 65.1 6.5 24.4 6.5 1.5 1.5 0.0 0.03.1 3.1 6.5 4.6 0.0 0.0 69.5 8.9 15.8 7.8 2.6 2.6 2.6 2.64.2 1.2 6.9 1.6 13.5 2.4 55.3 3.4 15.1 2.4 5.1 1.3 0.0 0.01.5 0.7 2.4 0.9 4.1 1.2 51.5 2.8 30.9 2.7 9.1 1.6 0.4 0.31.5 0.9 1.0 0.7 3.3 1.3 49.4 3.5 29.2 3.2 14.6 2.5 0.9 0.71.2 0.9 0.0 0.0 2.2 1.3 48.6 5.9 32.1 5.5 15.8 4.0 0.0 0.01.6 1.2 1.9 1.9 2.6 1.6 44.8 7.0 39.1 6.9 9.3 3.6 0.7 0.77.0 6.7 12.5 8.2 4.2 4.2 72.4 (10.2 4.0 3.0 0.0 0.0 0.0 0.00.5 (0.3) 1.3 (0.4) 8.4 (1.2) 78.3 (1.8) 9.2 (1.3) 2.3 (0.6) 0.0 (0.0)
0.1 0.1 1.8 0.6 4.7 1.0 65.9 2.1 24.6 1.9 2.8 0.6 0.0 0.00.6 0.4 1.2 0.6 7.0 1.4 61.4 2.7 23.8 2.4 5.9 1.2 0.0 0.02.2 1.0 3.5 1.3 11.4 2.2 65.1 3.3 16.8 2.5 1.0 0.7 0.0 0.01.9 1.1 4.7 1.9 14.0 3.0 66.0 4.4 12.4 2.8 1.0 0.7 0.0 0.0
13.9 4.0 5.9 2.4 19.7 4.3 53.1 5.2 7.3 2.8 0.0 0.0 0.0 0.02.0 (0.6) 5.2 (1.0) 12.0 (1.2) 63.6 (1.8) 12.6 (1.2) 4.5 (0.8) 0.2 (0.2)
Indian 20 -29men 30 -39
40-4950 -5960- 69>=70
Indian 20 -29women 30 - 39
40-4950 -5960- 69>=70
Other 20 -290indigenousmen 30 -39
40 -4950- 5960 -69>=70
Other 20 -292indigenouswomen 30 -39 1.0 0.4 0.9 0.4 6.4 1.0 59.2 2.0 24.2 1.6 8.1 1.1 0.3 0.2
40-49 2.4 0.8 3.1 1.0 6.6 1.3 51.0 2.6 27.0 2.4 9.9 1.5 0.0 0.050 -59 6.6 1.7 3.6 1.3 10.0 2.0 49.8 3} 24.2 3.g 5.7 1.5 0.0 0.060 -69 14.8 2.9 8.0 2.3 8.4 2.1 53.2 3. 13.6 2.7 2.0 1.0 0.0 0.0>=70 18.9 4.4 12.2 3.7 10.0 3.2 48.3 5.5 8.6 3.6 1.9 1.4 0.0 0.0
* WHO Expert Committee on Physical Status5
Med J Malaysia Vol 55 No 1 March 2000 127
ORIGINAL ARTICLE
1. Waaler HT. Height, weight and mortality. TheNorwegian experience. Acta Medica Scandinavicasupplementum, 1984,679: 1-56.
2. Waaler HT. Hazard of obesity The Norwegianexperience. Acta Medica Scandinavica supplementum,1988,723: 17-21.
3. Rissanen A et al. Weight and mortality in Finnish men.] GIn epidemiol 1989,42:781-9.
4. Rissanen A et al. Weight and mortality in Finnishwomen.] GIn epidemiol1991,44:787-95.
5. WHO Expert Committee on Physical Status. Physicalstatus: the Use and Interpretation of Anthropometry:report of a WHO expert committee. WHO technicalreport series; 854, 1995.
6. Labour Force Survey Report 1995, Department ofStatistics. Kuala Lumpur.
7. Cochran WG. Sampling techniques. Third edition,Wiley 1977.
8. Lehtonen R, Pahkinen E. Practical methods for designand analysis of complex surveys. Wiley 1996.
128
9. Skinner C], Holt D, Smith TMF. Analysis of complexsurveys. Wiley 1989.
10. Kessler RC, Little R]A, Groves RM. Advances instrategies for minimizing and adjusting for surveynonresponse. Epidemiologic Reviews 1995;17: 192-204.
11. Healy M]R, Rasbash ], Yang M. Distribution freeestimation of age related centiles. Annals of HumanBiology 1988;15: 17-22.
12. Statistical Sciences, S-PLUS guide to statistical andmathematical analysis, Version 3.3, Seattle: StatSci, adivision of MathSoft, Inc, 1995.
13. Statacorp 1997. Staca Statistical Software: Release 5.0College Station, TX: Stata Corporation.
14. Kurzmarski RJ. Prevalence and weight gain in theUnited States. Am] Clin Nutr 1992; 55: 495S-502S.
15. Miller WJ. Population estimates of overweight andhypertension Canada 1985. Can] Public Health 1985;76: 398-403.
16. Garrow ]S. Obesity and related diseases. ChurchillLivingstone 1988
Med J Malaysia Vol 55 No 1 March 2000