comparison of cfd simulation on tray dryer system · pdf filecomparison of cfd simulation on...
TRANSCRIPT

Comparison of CFD Simulation on Tray Dryer System
Between Porous and Solid Product
SUHAIMI MISHA1,2,a*
, SOHIF MAT1,b
, MOHD HAFIDZ RUSLAN1,c
,
KAMARUZZAMAN SOPIAN1,d
, ELIAS SALLEH1,e
1
Solar Energy Research Institute, Universiti Kebangsaan Malaysia,
43600 Bangi, Selangor, Malaysia 2
Faculty of Mechanical Engineering, Universiti Teknikal Malaysia Melaka,
Hang Tuah Jaya, 76100 Durian Tunggal, Melaka, Malaysia [email protected],
Abstract: - Tray dryer is the most widely used because of its simple and economic design. The product is
spread out on trays at an acceptable thickness. In a tray dryer, more products can be loaded as the trays are
arranged at different levels. Most tray dryers use hot air stream where water is vaporized from the product and
removed by air stream. The drawback of this dryer is non-uniformity in the desired moisture content of end
product. The key to the successful operation of the tray dryer is uniform airflow distribution over the trays.
Therefore, the good design of the drying chamber configuration in a tray dryer is necessary to obtain optimum
performance. This research is to design the uniform airflow distribution throughout the drying chamber using
CFD simulation. The products are represented by porous and solid (non-porous) product. Several
configurations of trays position also was designed and simulated to determine the tray dryer with better airflow
distribution. It was found that by using porous product the overall velocities in the drying chamber are lower
than solid product since some of the hot air stream pass through the porous product. The design C was
recommended to be developed for both porous and solid product which can produce more uniform drying and
shorter drying time because of good temperature and velocity distribution throughout the drying chamber.
Key-Words: - Drying simulation; Tray dryer; Uniform drying
1 Introduction The measurement of drying parameters in the drying
chamber is expensive, difficult, and time
consuming, as sensors and data loggers have to be
installed in many positions, especially in a large-
scale dryer. Computational fluid dynamics (CFD)
simulation is used extensively because of its
capability to solve equations for the conservation of
mass, momentum, and energy using numerical
methods to predict the temperature, velocity, and
pressure profiles in the drying chamber.
An industrial batch-type tray dryer for drying
fruits has been designed and constructed by
Mathioulakis et al. [1]. CFD is used to simulate the
air pressure and the air velocity profiles in the
drying chamber. The result shows that comparison
of the simulation result by the CFD and
experimental data shows a strong correlation
between drying rate and air velocity. Dionissios and
Adrian-Gabriel Ghious [2] studied the numerical
simulation inside a drying chamber. A set of
measurements was obtained experimentally above
one single tray to validate the model. The validation
between the measured data and the simulation
results by CFD shows that the standard k–e model is
the most adequate turbulence model.
Mirade [3] using a two-dimensional CFD model
with time-dependent boundary conditions to
investigate the homogeneity of the distribution of
the air velocity in an industrial meat dryer for
several low and high levels of the ventilation cycle.
All airflow simulations are consistent with the
heterogeneity of drying usually observed in practice.
The product is represented by solid rectangle object.
Chr. Lamnatou et al. [4] developed and
investigated a numerical model of heat and mass
transfer during convective drying of a porous body
using the finite-volume method. The results show
that the aspect ratio of the drying plate and the flow
separation influence the flow field and heat/mass
transfer coefficients. The increase in the contact
surfaces between the porous body and air also
contributes to the improvement of drying behavior.
Jacek Smolka et al. [5] studied a numerical model of
Latest Trends in Renewable Energy and Environmental Informatics
ISBN: 978-1-61804-175-3 59
Nomenclature
C, D prescribed matrices σk turbulent Prandtl numbers for k
C0, C1 empirical coefficients σε turbulent Prandtl numbers for ε
Cij prescribed matrices E total energy
Dij mass diffusion coefficient vi velocity vector
ρ density of fluid vmag velocity magnitude
k turbulent kinetic energy (τij)eff deviatoric stress tensor
ε rate of dissipation p pressure
µ dynamic viscosity Prt Prandtl number
µt turbulent viscosity T temperature
Gk generation of turbulent kinetic energy cp specific heat capacity at constant
due to the mean velocity gradients pressure
Gb generation of turbulent kinetic energy u velocity magnitude in x direction
due to buoyancy t time
YM contribution of the fluctuating dilatation Sk, Sε, Sh user-defined source terms
in compressible turbulence to the overall Si source term for ith momentum
dissipation rate equation
C1�, C2�, C3� constants used in turbulent model
a drying oven using the CFD simulation. Several
new configurations were simulated to improve
uniformity of temperature in the drying chamber. A
new shape and position of the heater and additional
baffle directing the airflow were found as the most
effective. The simulation results show very good
agreement with the experimental data.
The use of CFD as a tool to manage the velocity,
temperature, and pressure in the drying chamber can
be carried out to design a new dryer system. The
objective of this research is to design the large scale
tray dryer for any product. The dried product can be
represented as a solid or porous media depending on
the character of the product. The CFD is used as a
tool to predict the airflow distribution in the drying
chamber to obtain the uniform drying. CFD has also
been widely used in food industry to investigate the
flow pattern of the air in the drying chamber [6,7].
Uniform airflow distribution in drying chamber is
very important because it gave significant effect on
the efficiency and the homogeneity of the products
being dried. The use of desiccant material in drying
application would also improve the uniformity of
dried product, among other advantages [8].
2 Methods and Simulation The dryer system obtained heat from the solar
energy. The water-to-air heat exchanger is used to
heat the air at inlet 1 and 2. The water is circulated
through the solar collector and heat exchanger. The
fan is used to force the air stream pass through the
heat exchanger in the cross flow direction. However
the experimental setup is not shown in this paper
since the focus of this paper on the drying chamber
configuration.
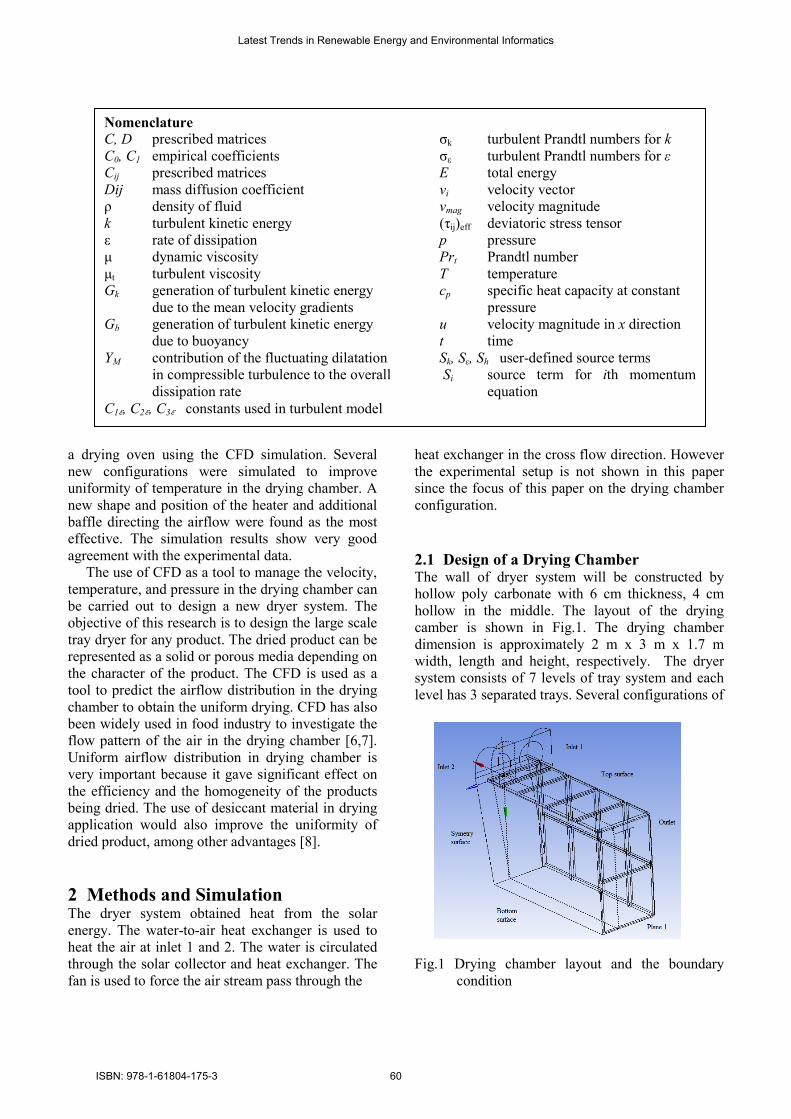
2.1 Design of a Drying Chamber The wall of dryer system will be constructed by
hollow poly carbonate with 6 cm thickness, 4 cm
hollow in the middle. The layout of the drying
camber is shown in Fig.1. The drying chamber
dimension is approximately 2 m x 3 m x 1.7 m
width, length and height, respectively. The dryer
system consists of 7 levels of tray system and each
level has 3 separated trays. Several configurations of
Fig.1 Drying chamber layout and the boundary
condition
Latest Trends in Renewable Energy and Environmental Informatics
ISBN: 978-1-61804-175-3 60
drying chamber and trays position was designed and
simulated to find the most optimize design. After
investigates many designs of drying chamber and
trays position, four designs were selected as shown
in Fig.2. The thickness of the products in each tray
is 6 cm. The velocity and temperature distribution
were analysed to ensure the uniform drying
throughout the drying chamber.
2.2 Basic Governing Equations The mass, momentum and energy conservation
result in the continuity, Navier-Stokes and energy
equation, respectively [9]. The turbulent model is
used in this CFD simulation. The turbulent kinetic
energy, k, and its rate of dissipation, ε, are
calculated from the following transport equations
[10]:
∂∂� ���� � ∂∂ ������ ∂∂x� ��µ � µ�σ�� ∂�∂�� ��
��� � �� � �� � �� �1� �� ���� � ��!" ������ ��!# $%µ � µ&
σε' �ε�!#(+
)*+ +� ��� � ),+��� � )-+� +.� � �+ �2�
Convective heat and mass transfer modeling in the
k -ε models is given by the following equation:
∂∂� ��0� � ∂∂ 1���0 � 2�3 ∂∂ $�� � 45µ�Pr� � ∂8∂ � ��τ��9::( � �; �3�
Porous media are modeled by the addition of a
momentum source term to the standard fluid flow
equations. The source term is composed of two
parts: a viscous loss term and an inertial loss term.
S � >? @�µA� � ? c� 12,
�C*,
�C* �ADEFA�G �4�
2.3 Simulation Details The numerical finite volume method as used in
Fluent 12.1 has been used for solving the equations.
All the geometrical configurations were displayed in
Fig.2. They were used to build up a numerical
model based on an unstructured three dimensional
mesh by tetrahedral cell. The pattern of air stream in
the drying chamber is important and since there was
no variable condition in this study, the simulation
was carried out in steady state condition. The plane
1 was selected (Fig.1) to study and analyse the
velocity and temperature in the drying chamber.
Plane 1 is located in between of two axial fans,
which considered as the weak zone compared to
others areas in the drying chamber. Mesh adaption
was performed in the simulation until mesh
independence is achieved. The set up of boundary
conditions were defined as followings:
• Inlet 1: air mass flow rate 1.715 kg/s
(approximately velocity of 8.8 m/s normal
to air inlet) and air temperature of 75oC.
• Inlet 2: air mass flow rate 0.8575 kg/s (half
of the inlet 1 but give same velocity, 8.8
m/s) and air temperature of 75oC.
• Outlet: Assuming gauge pressure=0 at the
outlet.
• Product: The trays were assumed as porous
product with 10% porosity (case 1) and
solid product (case 2).
• Wall: Heat transfer coefficient of the
chamber wall and environmental conditions
were defined. The environment temperature
is assumed at 300C and temperature at the
top roof is 600C (contact to the heat source
from radiation). The bottom surface is
assumed as no heat loss. Only half of the
drying chamber was analysed since the
shape is symmetry by defining the
symmetry surface to the middle boundary.
3 Result and discussion The most suitable design can be assessed by
comparing the uniformity of air flow distribution in
the drying chamber. Even though the simulation was
done in three dimensions but the analysis was
carried out only at plane 1 as indicated in Fig.2.
Several planes have been studied but plane 1 is
among the poor zone in term of hot air distribution
since it was located in between the two fans.
Therefore the study is focus on plane 1 and
assuming others plane have better hot air
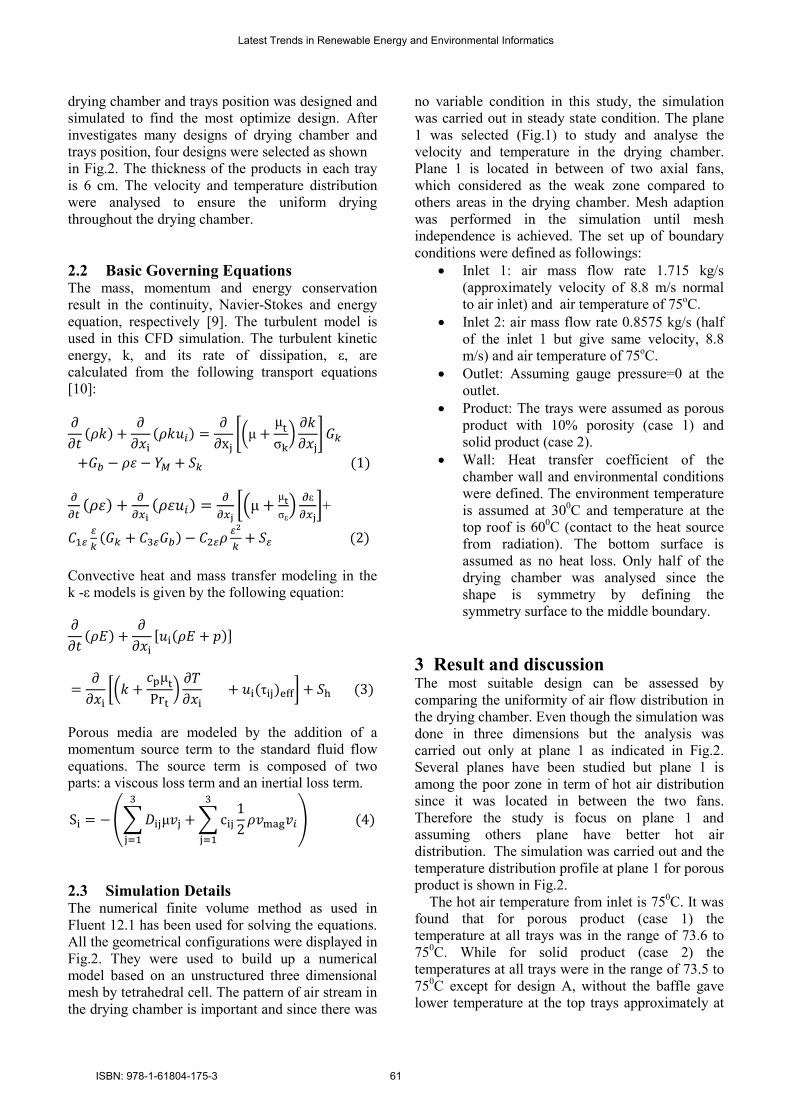
distribution. The simulation was carried out and the
temperature distribution profile at plane 1 for porous
product is shown in Fig.2.
The hot air temperature from inlet is 750C. It was
found that for porous product (case 1) the
temperature at all trays was in the range of 73.6 to
750C. While for solid product (case 2) the
temperatures at all trays were in the range of 73.5 to
750C except for design A, without the baffle gave
lower temperature at the top trays approximately at
Latest Trends in Renewable Energy and Environmental Informatics
ISBN: 978-1-61804-175-3 61
72.90C. The difference of temperature among the
trays for both cases is considered small and it can be
assumed that all design successfully achieved the
reasonable uniform air temperature in the drying
chamber. The porous and solid product not gave
significance effect on the temperature distribution in
the drying chamber. The numbers of trays from 1 to
21 were indicated in Fig.2(a).
Fig.2 Design of four drying chamber and
temperature distribution profiles using CFD
simulations at plane 1 for porous product
In drying application, the temperature, velocity and
humidity of drying air condition gave significant
effect to the drying process. In this simulation study,
only temperature and velocity of the drying air can
be analysed since the equation used is not involved
humidity. Humidity analysis will be done in the
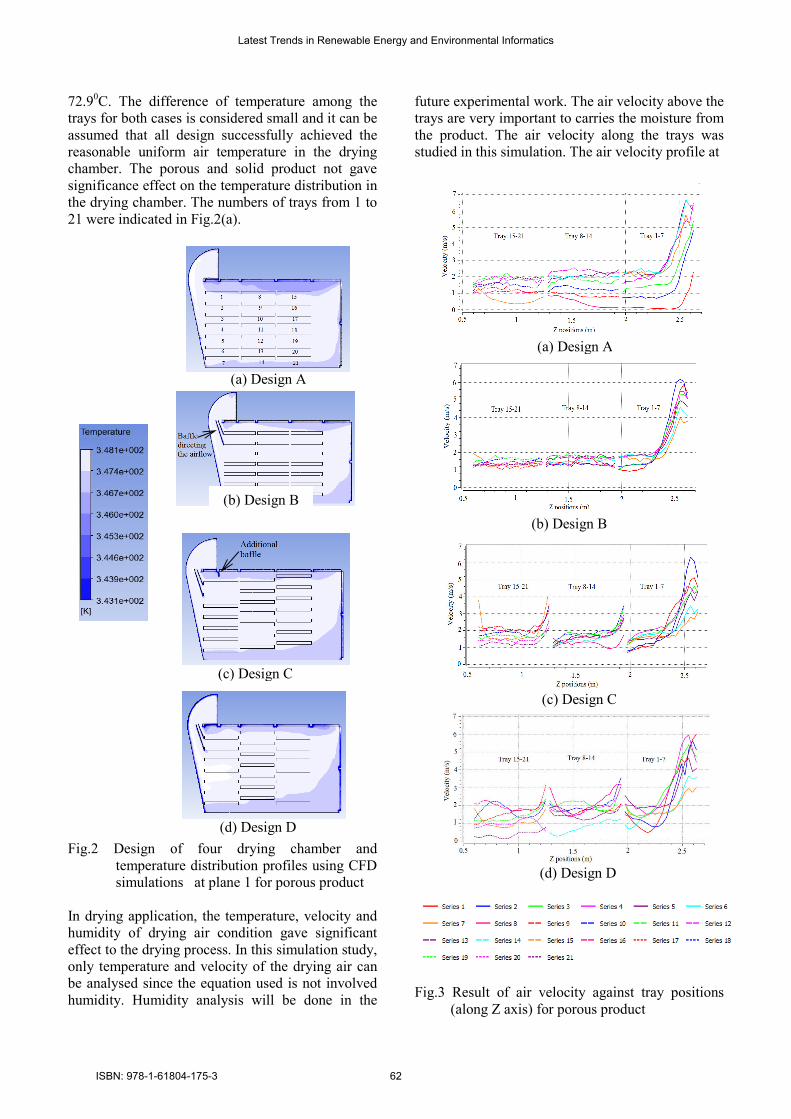
future experimental work. The air velocity above the
trays are very important to carries the moisture from
the product. The air velocity along the trays was
studied in this simulation. The air velocity profile at
Fig.3 Result of air velocity against tray positions
(along Z axis) for porous product
(a) Design A
(d) Design D
(c) Design C
(b) Design B
(d) Design D
(c) Design C
(a) Design A
(b) Design B
(b) Design B
Latest Trends in Renewable Energy and Environmental Informatics
ISBN: 978-1-61804-175-3 62

2.5 cm above the trays for each tray is shown in
Fig.3 and Fig.4 for porous and solid product,
respectively. Generally the average air velocities at
trays 1 to 7 are higher than other trays since the
positions are close to the air inlet. Based on design
A and B, as the drying air passes over the trays, the
air velocity would decrease. Based on Fig. 3(a) the
air velocities at the first and second level of trays
(from top) are lower than 1 m/s which are not good
for the drying process. The air velocity was
improved by adding baffle to channel the airflow to
the first and second level of trays as shown in Fig
3(b). The air velocities achieved at least 1 m/s for all
trays and look more uniform in the range of 1 to 2
m/s except for the first column of trays with the
maximum velocity of 6.2 m/s.
Since the baffle was improves the air velocity
profile, the baffle is maintains in the next design and
different trays position were studied. In design C, all
the trays are exposed directly to the airflow. It
shows that the air velocities are higher at the front of
each tray and lower at the rear of the tray except for
tray number 15 because the airflow through the
small area (Fig.3(c)). In this design additional baffle
is required to improve the airflow at the first level of
tray. In general the air velocities profiles at trays 8
to 14 and trays 15 to 21 are higher than design B.
However the air velocity at ends of trays 1 and 2 are
lower than 1 m/s (minimum 0.7 m/s). In design D,
the trays 1 to 7 and trays 15 to 21 are placed at the
same level as in design A and B but the trays 8 to 14
are place in between the existing levels. The design
was increased air velocities at certain area but there
are several trays with low air velocity, below than 1
m/s (Fig.3(d)).
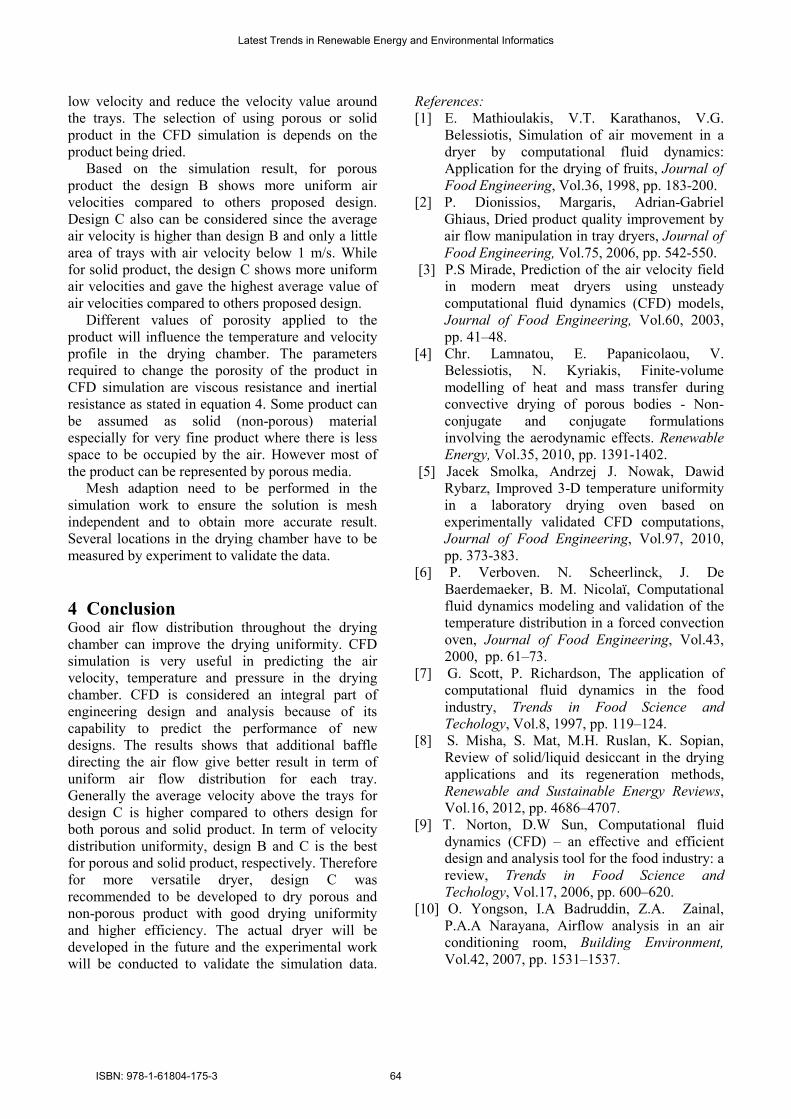
Based on Fig. 4(a) the air velocity at the first top
three of trays level are lower than 1 m/s. The
velocity was improved by adding baffle as shown in
Fig. 4(b). The velocities exceed 1 m/s for all trays
except tray number 10 with minimum air velocity at
0.3 m/s. In design C, the velocity profiles are more
uniform and the air velocity at trays 8 to14 and trays
15 to 21 were increases as shown in Fig. 4(c). The
average air velocity is approximately 3 m/s and only
little part of tray number 8 not achieved 1 m/s
(around 0.6 m/s). In design D, the air velocity for all
trays also achieved 1 m/s except for tray number 21
with minimum air velocity at 0.6 m/s (Fig 4(d)).
However, in general the air velocity at trays 8 to 21
is below 2.5 m/s which are lower than design B and
C.
The temperature profiles for all design (design
A,B,C and D) and cases (porous and solid product)
are considered successfully achieved the reasonable
uniform air temperature distribution in the drying
chamber. However the air velocities above the trays
are different for each design and case.
Fig.4 Result of air velocity against tray positions
(along Z axis) for solid product
Basically the velocities at the above of trays in the
drying chamber are higher for solid product
compared to the porous product. This is because
some of the hot air pass through the product at very
(c) Design C
(d) Design D
(b) Design B
(a) Design A
Latest Trends in Renewable Energy and Environmental Informatics
ISBN: 978-1-61804-175-3 63
low velocity and reduce the velocity value around
the trays. The selection of using porous or solid
product in the CFD simulation is depends on the
product being dried.
Based on the simulation result, for porous
product the design B shows more uniform air
velocities compared to others proposed design.
Design C also can be considered since the average
air velocity is higher than design B and only a little
area of trays with air velocity below 1 m/s. While
for solid product, the design C shows more uniform
air velocities and gave the highest average value of
air velocities compared to others proposed design.
Different values of porosity applied to the
product will influence the temperature and velocity
profile in the drying chamber. The parameters
required to change the porosity of the product in
CFD simulation are viscous resistance and inertial
resistance as stated in equation 4. Some product can
be assumed as solid (non-porous) material
especially for very fine product where there is less
space to be occupied by the air. However most of
the product can be represented by porous media.
Mesh adaption need to be performed in the
simulation work to ensure the solution is mesh
independent and to obtain more accurate result.
Several locations in the drying chamber have to be
measured by experiment to validate the data.
4 Conclusion Good air flow distribution throughout the drying
chamber can improve the drying uniformity. CFD
simulation is very useful in predicting the air
velocity, temperature and pressure in the drying
chamber. CFD is considered an integral part of
engineering design and analysis because of its
capability to predict the performance of new
designs. The results shows that additional baffle
directing the air flow give better result in term of
uniform air flow distribution for each tray.
Generally the average velocity above the trays for
design C is higher compared to others design for
both porous and solid product. In term of velocity
distribution uniformity, design B and C is the best
for porous and solid product, respectively. Therefore
for more versatile dryer, design C was
recommended to be developed to dry porous and
non-porous product with good drying uniformity
and higher efficiency. The actual dryer will be
developed in the future and the experimental work
will be conducted to validate the simulation data.
References:
[1] E. Mathioulakis, V.T. Karathanos, V.G.
Belessiotis, Simulation of air movement in a
dryer by computational fluid dynamics:
Application for the drying of fruits, Journal of
Food Engineering, Vol.36, 1998, pp. 183-200.
[2] P. Dionissios, Margaris, Adrian-Gabriel
Ghiaus, Dried product quality improvement by
air flow manipulation in tray dryers, Journal of
Food Engineering, Vol.75, 2006, pp. 542-550.
[3] P.S Mirade, Prediction of the air velocity field
in modern meat dryers using unsteady
computational fluid dynamics (CFD) models,
Journal of Food Engineering, Vol.60, 2003,
pp. 41–48.
[4] Chr. Lamnatou, E. Papanicolaou, V.
Belessiotis, N. Kyriakis, Finite-volume
modelling of heat and mass transfer during
convective drying of porous bodies - Non-
conjugate and conjugate formulations
involving the aerodynamic effects. Renewable
Energy, Vol.35, 2010, pp. 1391-1402.
[5] Jacek Smolka, Andrzej J. Nowak, Dawid
Rybarz, Improved 3-D temperature uniformity
in a laboratory drying oven based on
experimentally validated CFD computations,
Journal of Food Engineering, Vol.97, 2010,
pp. 373-383.
[6] P. Verboven. N. Scheerlinck, J. De
Baerdemaeker, B. M. Nicolaï, Computational
fluid dynamics modeling and validation of the
temperature distribution in a forced convection
oven, Journal of Food Engineering, Vol.43,
2000, pp. 61–73.
[7] G. Scott, P. Richardson, The application of
computational fluid dynamics in the food
industry, Trends in Food Science and
Techology, Vol.8, 1997, pp. 119–124.
[8] S. Misha, S. Mat, M.H. Ruslan, K. Sopian,
Review of solid/liquid desiccant in the drying
applications and its regeneration methods,
Renewable and Sustainable Energy Reviews,
Vol.16, 2012, pp. 4686–4707.
[9] T. Norton, D.W Sun, Computational fluid
dynamics (CFD) – an effective and efficient
design and analysis tool for the food industry: a
review, Trends in Food Science and
Techology, Vol.17, 2006, pp. 600–620.
[10] O. Yongson, I.A Badruddin, Z.A. Zainal,
P.A.A Narayana, Airflow analysis in an air
conditioning room, Building Environment,
Vol.42, 2007, pp. 1531–1537.
Latest Trends in Renewable Energy and Environmental Informatics
ISBN: 978-1-61804-175-3 64