communications and multimedia · buku maklumat statistik. 2 ... nota sekiranya sesuatu jadual tidak...
TRANSCRIPT
1
2016
RM
Suruhanjaya Komunikasi dan Multimedia MalaysiaMalaysian Communications and Multimedia Commission
MCMC Tower 1, Jalan IMPACT, Cyber 663000 Cyberjaya, Selangor Darul Ehsan, MalaysiaTel: +603 8688 8000 Fax: +603 8688 1000Website : www.mcmc.gov.my
COMMUNICATIONS AND MULTIMEDIA
KOMUNIKASI DAN MULTIMEDIA
Pocket Book of Statistics
SPECIAL EDITIONEDISI KHAS
Buku Maklumat Statistik
2
© MALAYSIAN COMMUNICATIONS AND MULTIMEDIA COMMISSION, 2016
The information or material in this publication is protected under copyright and save where otherwise stated, may be reproduced for non-commercial use provided it is reproduced accurately and not used in a misleading context. Where any material is reproduced, Malaysian Communications and Multimedia Commission (MCMC), as the source of the material must be identified and copyright status acknowledged.
The permission to reproduced does not extend to any information or material the copyright of which belongs to any other person, organisation or third party. Authorisation or permission to reproduce such information or material must be obtained from the copyright holders concerned.
This work is based on sources believed to be reliable, but MCMC does not warrant the accuracy or completeness of any information for any purpose and cannot accept responsibility for any error or omission.
Published by Malaysian Communications and Multimedia CommissionMCMC Tower 1,Jalan IMPACT, Cyber 663000 Cyberjaya, Selangor Darul EhsanTel: +603 8688 8000 Fax: +603 8688 1000Aduan MCMC: 1-800-188-030http://www.mcmc.gov.my
Design and Printed by:Adspert Sdn Bhd
I
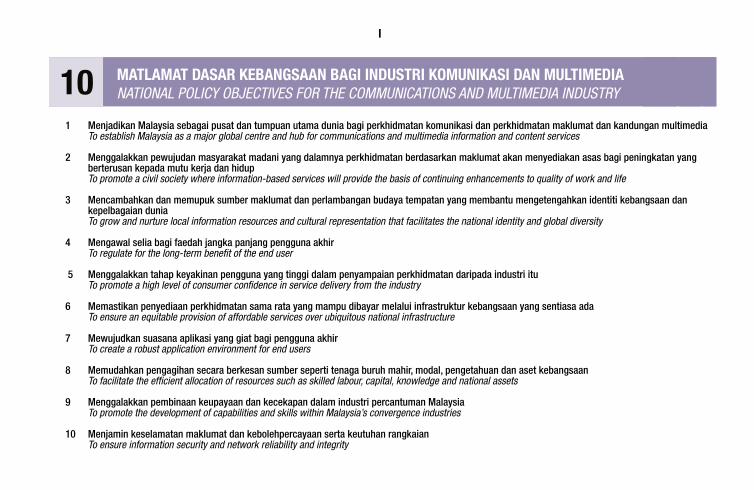
MATLAMAT DASAR KEBANGSAAN BAGI INDUSTRI KOMUNIKASI DAN MULTIMEDIANATIONAL POLICY OBJECTIVES FOR THE COMMUNICATIONS AND MULTIMEDIA INDUSTRY10
1 Menjadikan Malaysia sebagai pusat dan tumpuan utama dunia bagi perkhidmatan komunikasi dan perkhidmatan maklumat dan kandungan multimedia To establish Malaysia as a major global centre and hub for communications and multimedia information and content services
2 Menggalakkan pewujudan masyarakat madani yang dalamnya perkhidmatan berdasarkan maklumat akan menyediakan asas bagi peningkatan yang berterusan kepada mutu kerja dan hidup
To promote a civil society where information-based services will provide the basis of continuing enhancements to quality of work and life
3 Mencambahkan dan memupuk sumber maklumat dan perlambangan budaya tempatan yang membantu mengetengahkan identiti kebangsaan dan kepelbagaian dunia
To grow and nurture local information resources and cultural representation that facilitates the national identity and global diversity
4 Mengawal selia bagi faedah jangka panjang pengguna akhir To regulate for the long-term benefit of the end user
5 Menggalakkan tahap keyakinan pengguna yang tinggi dalam penyampaian perkhidmatan daripada industri itu To promote a high level of consumer confidence in service delivery from the industry
6 Memastikan penyediaan perkhidmatan sama rata yang mampu dibayar melalui infrastruktur kebangsaan yang sentiasa ada To ensure an equitable provision of affordable services over ubiquitous national infrastructure
7 Mewujudkan suasana aplikasi yang giat bagi pengguna akhir To create a robust application environment for end users
8 Memudahkan pengagihan secara berkesan sumber seperti tenaga buruh mahir, modal, pengetahuan dan aset kebangsaan To facilitate the efficient allocation of resources such as skilled labour, capital, knowledge and national assets
9 Menggalakkan pembinaan keupayaan dan kecekapan dalam industri percantuman Malaysia To promote the development of capabilities and skills within Malaysia’s convergence industries
10 Menjamin keselamatan maklumat dan kebolehpercayaan serta keutuhan rangkaian To ensure information security and network reliability and integrity

II
Nota
Sekiranya sesuatu jadual tidak diikuti oleh nota tentang sumber data, maka seluruh data yang terkandung di dalamnya berpunca semata-mata daripada Suruhanjaya Komunikasi dan Multimedia Malaysia (MCMC).
Angka-angka awalan dicondongkan.
Angka-angka yang dipinda digariskan.
Angka yang terkandung dalam sesuatu jadual merujuk kepada penghujung tempoh. Sebagai contoh, kadar penembusan tahunan bagi sesuatu perkhidmatan dikira dengan menggunakan jumlah langganan dan anggaran jumlah penduduk pada hujung tahun. Ini adalah berbeza daripada amalan demografi Malaysia di mana jumlah penduduk pertengahan tahun dianggap sebagai jumlah penduduk tahunan. Sekiranya kedua-dua amalan ini hendaklah diselaraskan kepada norma demografi, maka kadar penembusan seperti pada penghujung Jun hendaklah digunakan.
Jumlah campuran mungkin berbeza kerana pembundaran.
Notes
Where a table is not accompanied by a source acknowledgement, that table carries data that emanated solely from the Malaysian Communications and Multimedia Commission (MCMC). Preliminary figures are italicised.
Revised figures are underscored.
Figures presented in tables are as at the end of the period. Hence a penetration rate for a given year is calculated using the number of subscriptions and estimated population as at the end of the year. This is different from the Malaysian demographic practice of using the mid-year population as the population for that year. If the practices need to be synchronised to the demographic norm, then the penetration rates as at end June of that year must be used.
The added total may differ due to rounding.
III
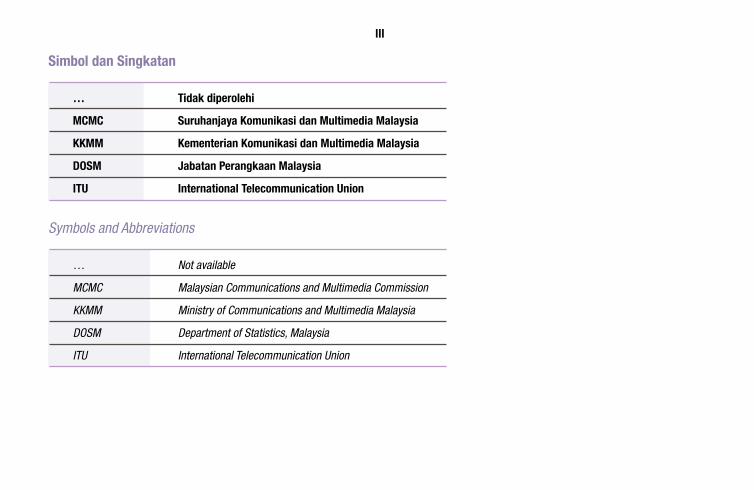
Simbol dan Singkatan
… Tidak diperolehi
MCMC Suruhanjaya Komunikasi dan Multimedia Malaysia
KKMM Kementerian Komunikasi dan Multimedia Malaysia
DOSM Jabatan Perangkaan Malaysia
ITU International Telecommunication Union
Symbols and Abbreviations
… Not available
MCMC Malaysian Communications and Multimedia Commission
KKMM Ministry of Communications and Multimedia Malaysia
DOSM Department of Statistics, Malaysia
ITU International Telecommunication Union

IV
Muka surat ini sengaja dibiarkan kosongThis page is intentionally left blank
V
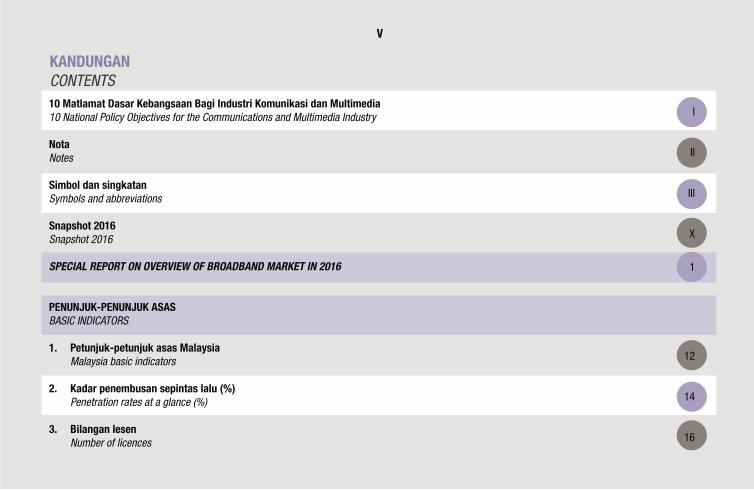
10 Matlamat Dasar Kebangsaan Bagi Industri Komunikasi dan Multimedia10 National Policy Objectives for the Communications and Multimedia Industry
NotaNotes
Simbol dan singkatanSymbols and abbreviations
Snapshot 2016Snapshot 2016
SPECIAL REPORT ON OVERVIEW OF BROADBAND MARKET IN 2016
PENUNJUK-PENUNJUK ASASBASIC INDICATORS
1. Petunjuk-petunjuk asas Malaysia Malaysia basic indicators
2. Kadar penembusan sepintas lalu (%) Penetration rates at a glance (%)
3. Bilangan lesen Number of licences
KANDUNGANCONTENTS
I
II
III
X
12
14
16
1
V
VI
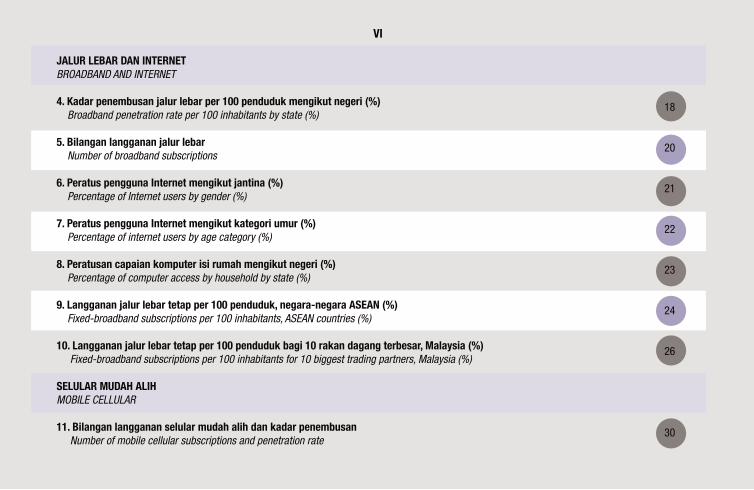
JALUR LEBAR DAN INTERNETBROADBAND AND INTERNET
4. Kadar penembusan jalur lebar per 100 penduduk mengikut negeri (%) Broadband penetration rate per 100 inhabitants by state (%)
5. Bilangan langganan jalur lebar Number of broadband subscriptions
6. Peratus pengguna Internet mengikut jantina (%) Percentage of Internet users by gender (%)
7. Peratus pengguna Internet mengikut kategori umur (%) Percentage of internet users by age category (%)
8. Peratusan capaian komputer isi rumah mengikut negeri (%) Percentage of computer access by household by state (%)
9. Langganan jalur lebar tetap per 100 penduduk, negara-negara ASEAN (%) Fixed-broadband subscriptions per 100 inhabitants, ASEAN countries (%)
10. Langganan jalur lebar tetap per 100 penduduk bagi 10 rakan dagang terbesar, Malaysia (%) Fixed-broadband subscriptions per 100 inhabitants for 10 biggest trading partners, Malaysia (%)
SELULAR MUDAH ALIHMOBILE CELLULAR
11. Bilangan langganan selular mudah alih dan kadar penembusan Number of mobile cellular subscriptions and penetration rate
18
20
21
22
23
24
26
30
VI
VII
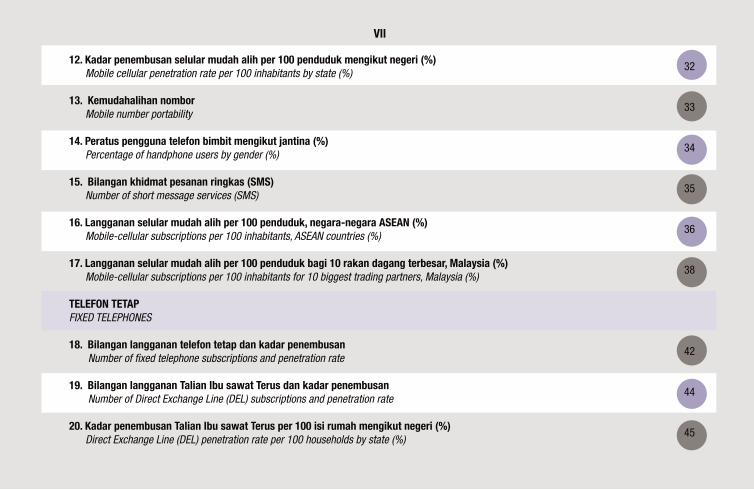
12. Kadar penembusan selular mudah alih per 100 penduduk mengikut negeri (%) Mobile cellular penetration rate per 100 inhabitants by state (%) 13. Kemudahalihan nombor Mobile number portability
14. Peratus pengguna telefon bimbit mengikut jantina (%) Percentage of handphone users by gender (%) 15. Bilangan khidmat pesanan ringkas (SMS) Number of short message services (SMS)
16. Langganan selular mudah alih per 100 penduduk, negara-negara ASEAN (%) Mobile-cellular subscriptions per 100 inhabitants, ASEAN countries (%) 17. Langganan selular mudah alih per 100 penduduk bagi 10 rakan dagang terbesar, Malaysia (%) Mobile-cellular subscriptions per 100 inhabitants for 10 biggest trading partners, Malaysia (%) TELEFON TETAPFIXED TELEPHONES
18. Bilangan langganan telefon tetap dan kadar penembusan Number of fixed telephone subscriptions and penetration rate
19. Bilangan langganan Talian Ibu sawat Terus dan kadar penembusan Number of Direct Exchange Line (DEL) subscriptions and penetration rate
20. Kadar penembusan Talian Ibu sawat Terus per 100 isi rumah mengikut negeri (%) Direct Exchange Line (DEL) penetration rate per 100 households by state (%)
32
33
34
35
36
38
42
44
45
VII
VIII
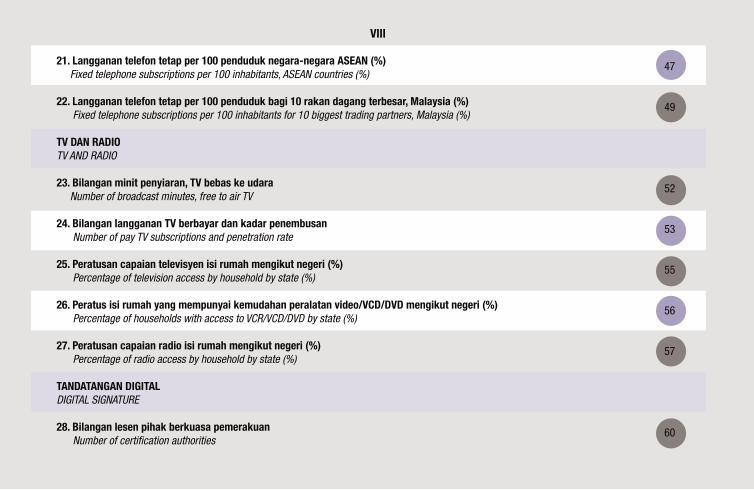
21. Langganan telefon tetap per 100 penduduk negara-negara ASEAN (%) Fixed telephone subscriptions per 100 inhabitants, ASEAN countries (%)
22. Langganan telefon tetap per 100 penduduk bagi 10 rakan dagang terbesar, Malaysia (%) Fixed telephone subscriptions per 100 inhabitants for 10 biggest trading partners, Malaysia (%)
TV DAN RADIOTV AND RADIO
23. Bilangan minit penyiaran, TV bebas ke udara Number of broadcast minutes, free to air TV
24. Bilangan langganan TV berbayar dan kadar penembusan Number of pay TV subscriptions and penetration rate
25. Peratusan capaian televisyen isi rumah mengikut negeri (%) Percentage of television access by household by state (%)
26. Peratus isi rumah yang mempunyai kemudahan peralatan video/VCD/DVD mengikut negeri (%) Percentage of households with access to VCR/VCD/DVD by state (%)
27. Peratusan capaian radio isi rumah mengikut negeri (%) Percentage of radio access by household by state (%)
TANDATANGAN DIGITALDIGITAL SIGNATURE
28. Bilangan lesen pihak berkuasa pemerakuan Number of certification authorities
47
49
52
53
55
56
57
60
VIII
IX
29. Bilangan sijil yang dikeluarkan mengikut jenis Number of certificates issued by type
KEDUDUKAN MALAYSIA DALAM INDEKS BERKAITAN ICTMALAYSIA RANKING FOR ICT RELATED INDICES
30. Kedudukan Malaysia dalam indeks berkaitan ICT Malaysia ranking for ICT related indices
61
64
IX
X
SELULAR MUDAH ALIHMOBILE-CELLULAR
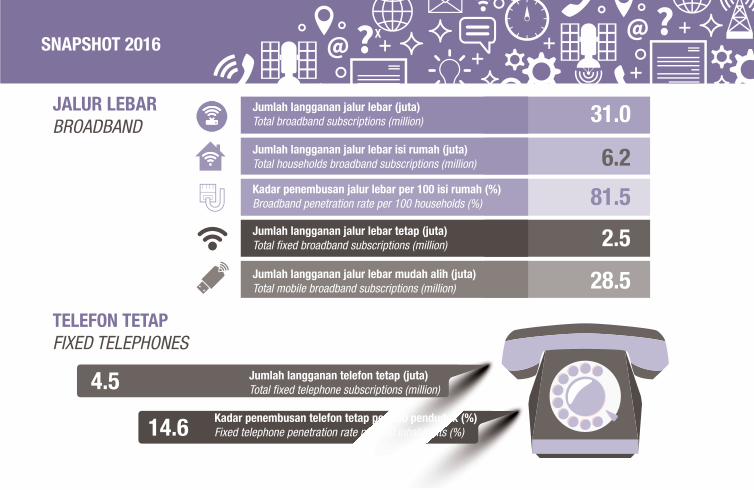
Jumlah langganan jalur lebar (juta)Total broadband subscriptions (million)
Jumlah langganan jalur lebar isi rumah (juta)Total households broadband subscriptions (million)
Kadar penembusan jalur lebar per 100 isi rumah (%)Broadband penetration rate per 100 households (%)
Jumlah langganan jalur lebar tetap (juta)Total fixed broadband subscriptions (million)
Jumlah langganan jalur lebar mudah alih (juta)Total mobile broadband subscriptions (million)
TELEFON TETAPFIXED TELEPHONES
Jumlah langganan telefon tetap (juta)Total fixed telephone subscriptions (million)
Kadar penembusan telefon tetap per 100 penduduk (%)Fixed telephone penetration rate per 100 inhabitants (%)
4.5
14.6
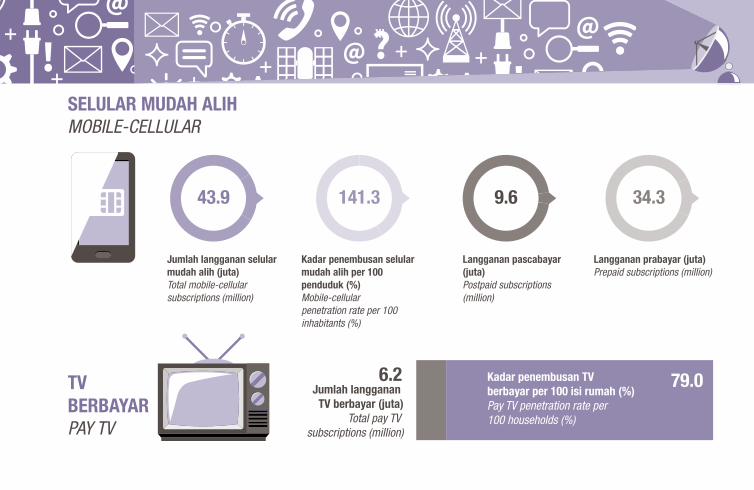
43.9 141.3 9.6 34.3
Jumlah langganan selular mudah alih (juta)Total mobile-cellular subscriptions (million)
Kadar penembusan selular mudah alih per 100 penduduk (%)Mobile-cellular penetration rate per 100 inhabitants (%)
Langganan pascabayar (juta)Postpaid subscriptions (million)
Langganan prabayar (juta)Prepaid subscriptions (million)
TV BERBAYARPAY TV
6.2 79.0Kadar penembusan TV berbayar per 100 isi rumah (%)Pay TV penetration rate per 100 households (%)
Jumlah langganan TV berbayar (juta)
Total pay TV subscriptions (million)
JALUR LEBARBROADBAND 31.0
6.2
81.5
28.5
2.5
SNAPSHOT 2016
X
XI
SELULAR MUDAH ALIHMOBILE-CELLULAR
Jumlah langganan jalur lebar (juta)Total broadband subscriptions (million)
Jumlah langganan jalur lebar isi rumah (juta)Total households broadband subscriptions (million)
Kadar penembusan jalur lebar per 100 isi rumah (%)Broadband penetration rate per 100 households (%)
Jumlah langganan jalur lebar tetap (juta)Total fixed broadband subscriptions (million)
Jumlah langganan jalur lebar mudah alih (juta)Total mobile broadband subscriptions (million)
TELEFON TETAPFIXED TELEPHONES
Jumlah langganan telefon tetap (juta)Total fixed telephone subscriptions (million)
Kadar penembusan telefon tetap per 100 penduduk (%)Fixed telephone penetration rate per 100 inhabitants (%)
4.5
14.6
43.9 141.3 9.6 34.3
Jumlah langganan selular mudah alih (juta)Total mobile-cellular subscriptions (million)
Kadar penembusan selular mudah alih per 100 penduduk (%)Mobile-cellular penetration rate per 100 inhabitants (%)
Langganan pascabayar (juta)Postpaid subscriptions (million)
Langganan prabayar (juta)Prepaid subscriptions (million)
TV BERBAYARPAY TV
6.2 79.0Kadar penembusan TV berbayar per 100 isi rumah (%)Pay TV penetration rate per 100 households (%)
Jumlah langganan TV berbayar (juta)
Total pay TV subscriptions (million)
JALUR LEBARBROADBAND 31.0
6.2
81.5
28.5
2.5
XI

XII
Muka surat ini sengaja dibiarkan kosongThis page is intentionally left blank
XII
1
SPECIAL REPORT ON OVERVIEW OF BROADBAND MARKET IN 2016
1
2
INTRODUCTION
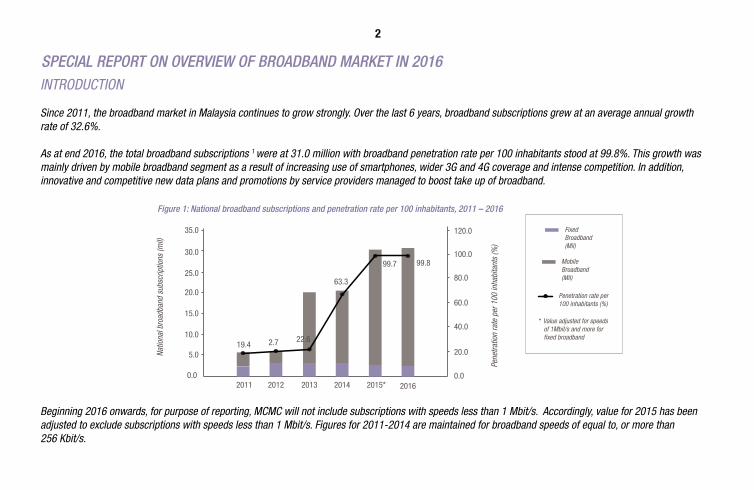
Since 2011, the broadband market in Malaysia continues to grow strongly. Over the last 6 years, broadband subscriptions grew at an average annual growth rate of 32.6%.
As at end 2016, the total broadband subscriptions 1 were at 31.0 million with broadband penetration rate per 100 inhabitants stood at 99.8%. This growth was mainly driven by mobile broadband segment as a result of increasing use of smartphones, wider 3G and 4G coverage and intense competition. In addition, innovative and competitive new data plans and promotions by service providers managed to boost take up of broadband.
Beginning 2016 onwards, for purpose of reporting, MCMC will not include subscriptions with speeds less than 1 Mbit/s. Accordingly, value for 2015 has been adjusted to exclude subscriptions with speeds less than 1 Mbit/s. Figures for 2011-2014 are maintained for broadband speeds of equal to, or more than 256 Kbit/s.
0.0
20.0
40.0
60.0
80.0
100.0
120.0
5.0
10.0
15.0
20.0
25.0
30.0
35.0
2011 2012 2013 2014 2015* 2016
Natio
nal b
road
band
sub
scrip
tions
(mil)
Pene
tratio
n ra
te p
er 1
00 in
habi
tant
s (%
)
Figure 1: National broadband subscriptions and penetration rate per 100 inhabitants, 2011 – 2016
0.0
19.4 2.7 22.6
63.3
99.7 99.8
Penetration rate per 100 inhabitants (%)
FixedBroadband(Mil)
MobileBroadband(Mil)
* Value adjusted for speeds of 1Mbit/s and more for fixed broadband
SPECIAL REPORT ON OVERVIEW OF BROADBAND MARKET IN 2016

3
Malaysia achieved 81.5% household penetration rate
Broadband penetration rate per 100 households 2 has grown steadily from 2011 to 2016, reaching 81.5% in 2016. Household broadband subscriptions increased by 11.6% to 6.2 million in 2016 from 5.5 million in 2015, contributed by substantial increase in postpaid mobile broadband segment.
0.0
20.0
40.0
60.0
80.0
100.0
1.0
2.0
3.0
4.0
5.0
6.0
7.0
8.0
2011 2012 2013 2014 2015* 2016
Hous
ehol
d br
oadb
and
subs
crip
tions
(mil)
Broa
dban
d pe
netra
tion
rate
per
100
hou
seho
lds
(%)
Figure 2: National broadband subscriptions and penetration rate per 100 households, 2011 – 2016
0.0
62.3 66.0 67.1 70.274.2
81.5
BroadbandPenetration rate per 100 households(%)
Householdbroadbandsubscriptions(Mil)
* Value adjusted for speeds of 1Mbit/s and more for fixed broadband
Broadband penetration rate per 100 households
The broadband penetration rate per 100 households is calculated by dividing the number of household subscriptions by the number of households and multiplied by 100, as follows:
(Household subscriptions)(No.of households)
x 100 =
4
FIXED BROADBAND
Fixed broadband is being provided via Asymmetric Digital Subscriber Line (ADSL), Symmetric Digital Subscriber Line (SDSL), Very-high-bit-rate Digital Subscriber Line (VDSL), Fiber to the Home (FTTH), Satellite, Fixed Wireless Access (FWA), Evolution-Data Optimized (EVDO), and Fixed Worldwide Interoperability for Microwave Access (WiMAX).
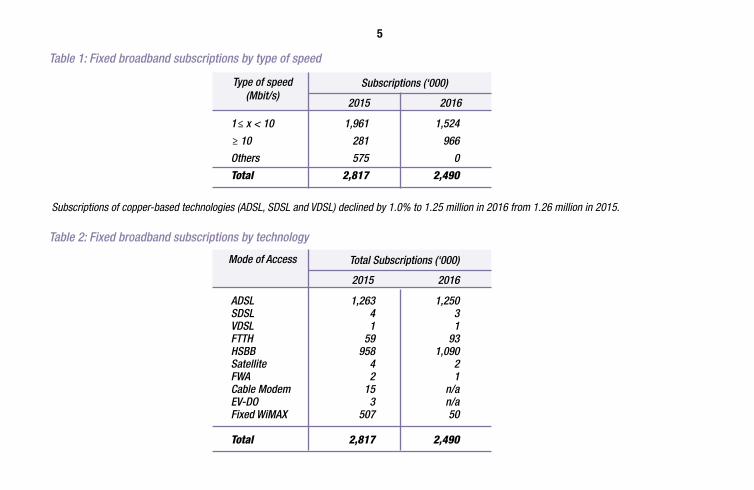
Fixed broadband continues to play a vital role in providing broadband connectivity. In 2016, fixed broadband contributed 8.0% of total broadband market share or 2.5 million of subscriptions (2015:2.8 million).
The decline was caused by substitution from fixed to mobile broadband as well as requirement set by International Telecommunication Union (ITU) to classify WiMAX into fixed and mobile broadband 3.
High Speed Broadband grew at around 245.0% year-on-year
Malaysia has made significant progress in High Speed Broadband 4 deployment, as a result of copper-to-fiber migration and consumers’ appetite for rich and premium multimedia services. This has driven demand for higher bandwidth and better quality of services with more capacity.
This has contributed to the significant increase of 243.8% from 0.28 million in 2015 to 0.97 million in 2016 in number of subscriptions by type of speed equals to or more than 10 Mbit/s.
5
Table 1: Fixed broadband subscriptions by type of speed
Subscriptions of copper-based technologies (ADSL, SDSL and VDSL) declined by 1.0% to 1.25 million in 2016 from 1.26 million in 2015.
Table 2: Fixed broadband subscriptions by technology
Subscriptions (‘000)
1≤ x < 10
≥ 10
Others
Total
1,961
281
575
2,817
1,524
966
0
2,490
Type of speed (Mbit/s)
2015 2016
Total Subscriptions (‘000)
ADSLSDSLVDSLFTTHHSBBSatelliteFWACable ModemEV-DOFixed WiMAX
Total
1,26341
59958
42
153
507
2,817
1,250 3 1
93 1,090
2 1
n/an/a 50
2,490
Mode of Access
2015 2016
6
Figure 3: Mobile broadband market shares by segment
2015 2016
Pay-per-use47.4%
Pay-per-use25.7%
Prepaid29.3%
Prepaid43.6%
Postpaid23.3% Postpaid
30.7%
MOBILE BROADBAND
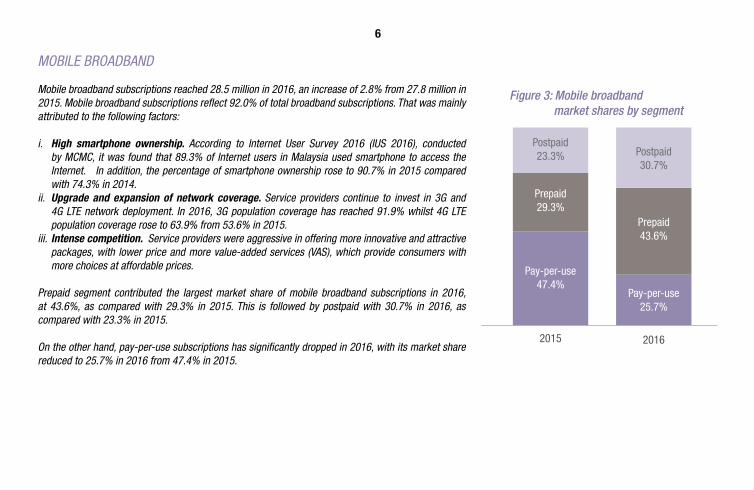
Mobile broadband subscriptions reached 28.5 million in 2016, an increase of 2.8% from 27.8 million in 2015. Mobile broadband subscriptions reflect 92.0% of total broadband subscriptions. That was mainly attributed to the following factors:
i. High smartphone ownership. According to Internet User Survey 2016 (IUS 2016), conducted by MCMC, it was found that 89.3% of Internet users in Malaysia used smartphone to access the Internet. In addition, the percentage of smartphone ownership rose to 90.7% in 2015 compared with 74.3% in 2014.
ii. Upgrade and expansion of network coverage. Service providers continue to invest in 3G and 4G LTE network deployment. In 2016, 3G population coverage has reached 91.9% whilst 4G LTE population coverage rose to 63.9% from 53.6% in 2015.
iii. Intense competition. Service providers were aggressive in offering more innovative and attractive packages, with lower price and more value-added services (VAS), which provide consumers with more choices at affordable prices.
Prepaid segment contributed the largest market share of mobile broadband subscriptions in 2016, at 43.6%, as compared with 29.3% in 2015. This is followed by postpaid with 30.7% in 2016, as compared with 23.3% in 2015.
On the other hand, pay-per-use subscriptions has significantly dropped in 2016, with its market share reduced to 25.7% in 2016 from 47.4% in 2015.
7
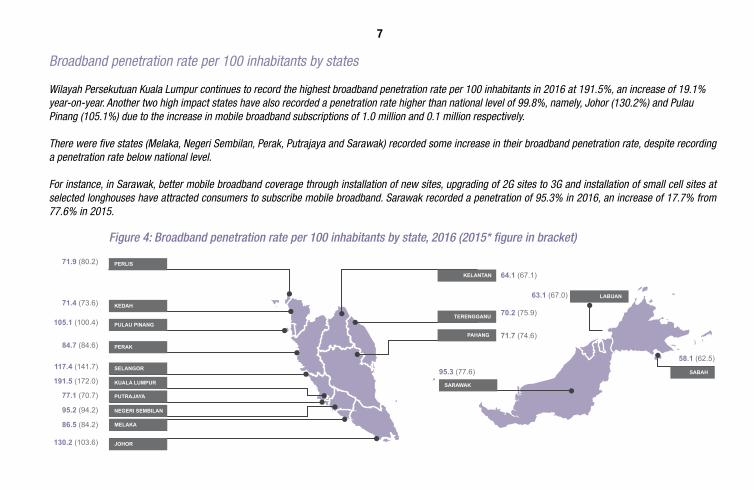
Broadband penetration rate per 100 inhabitants by states
Wilayah Persekutuan Kuala Lumpur continues to record the highest broadband penetration rate per 100 inhabitants in 2016 at 191.5%, an increase of 19.1% year-on-year. Another two high impact states have also recorded a penetration rate higher than national level of 99.8%, namely, Johor (130.2%) and Pulau Pinang (105.1%) due to the increase in mobile broadband subscriptions of 1.0 million and 0.1 million respectively.
There were five states (Melaka, Negeri Sembilan, Perak, Putrajaya and Sarawak) recorded some increase in their broadband penetration rate, despite recording a penetration rate below national level.
For instance, in Sarawak, better mobile broadband coverage through installation of new sites, upgrading of 2G sites to 3G and installation of small cell sites at selected longhouses have attracted consumers to subscribe mobile broadband. Sarawak recorded a penetration of 95.3% in 2016, an increase of 17.7% from 77.6% in 2015.
Figure 4: Broadband penetration rate per 100 inhabitants by state, 2016 (2015* figure in bracket)
KELANTAN
TERENGGANU
PAHANG
LABUAN
SABAH
SARAWAK
71.9 (80.2)
64.1 (67.1)
70.2 (75.9)
71.7 (74.6)
58.1 (62.5)
95.3 (77.6)
71.4 (73.6)
105.1 (100.4)
84.7 (84.6)
117.4 (141.7)
63.1 (67.0)
191.5 (172.0)
77.1 (70.7)
95.2 (94.2)
86.5 (84.2)
130.2 (103.6)
PERLIS
KUALA LUMPUR
NEGERI SEMBILAN
KEDAH
PULAU PINANG
MELAKA
JOHOR
PERAK
SELANGOR
PUTRAJAYA
8
On the other hand, in 2016 there were eight states which recorded a decline in their broadband penetration rate namely, Kedah, Kelantan, Pahang, Perlis, Sabah, Selangor, Terengganu and Wilayah Persekutuan Labuan. It was partly due to the drop in pay-per-use subscriptions for mobile broadband as a result of termination, switching to postpaid or prepaid plan as well as reduction in multi SIM subscriptions.
With regard to Selangor, a decline of 25.0% in broadband penetration rate was mainly contributed by Celcom’s adjustment and reconciliation of their pay-per-use subscriptions. According to Celcom, this is due to a number of systems-related issues encountered in 2016, as a result of its IT transformation programme.States other than Wilayah Persekutuan Kuala Lumpur, Johor, Selangor and Pulau Pinang registered penetration rate between 58.0% and 95.3%, which is below national average.
OUTLOOK
Going forward, MCMC foresees that the fixed broadband will grow at a reasonable rate of 3% per annum over the next 5-year period (2017-2021). This is driven by the higher demand for bandwidth to support digital services as well as quadruple play.
FTTH will be the fastest growing technology with average annual growth of 9.0% during the forecast period. The government’s plan to provide Malaysians with affordable broadband at higher speeds through initiative of “Double the Speed at the Same Price” in 2017 is expected to boost take-up of fixed broadband subscriptions with speeds more than 10 Mbit/s.
Competitive pricing continues to drive mobile broadband growth. The number of mobile broadband subscriptions will continue to grow steadily in 2017 onwards, with prepaid subscriptions continue to dominate the mobile broadband market. However, there was a growing trend of gradual shift to postpaid subscriptions in 2015. Postpaid and prepaid segments are expected to grow at an average annual growth of 2.0% over the forecast period. In view of the higher proportion of prepaid subscriptions, there is a tendency for high churn rate as switching is made possible with the mobile number portability and less consumer loyalty to a particular brand or service provider.
9
1 Proportion of individuals with broadband access that can be provided via fixed network at downstream speeds of ≥1 Mbit/s or mobile networks (e.g. WCDMA, HSPA, WiMAX IEEE 802.16e and LTE)
2 Proportion of households with unique subscription of broadband access that can be provided via fixed network at downstream speeds of ≥1 Mbit/s or mobile networks (e.g. WCDMA, HSPA, WiMAX IEEE 802.16e and LTE). A household consists of related and/or unrelated persons who usually live together and make common provisions for food and other essentials of livings
3 Previously, all WiMAX subscriptions were included under fixed broadband
4 Broadband access with speed >10 Mbit/s
Explanatory notes:

10
Muka surat ini sengaja dibiarkan kosongThis page is intentionally left blank
10
11
PENUNJUK-PENUNJUK ASAS MALAYSIA MALAYSIA BASIC INDICATORS
11
12
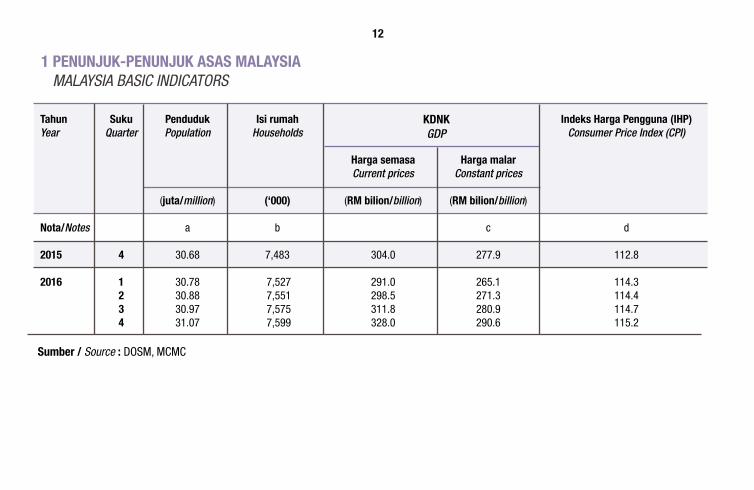
1 PENUNJUK-PENUNJUK ASAS MALAYSIA MALAYSIA BASIC INDICATORS
TahunYear
Nota/Notes
2015
2016
SukuQuarter
4
1234
Penduduk Population
(juta/million)
a
30.68
30.7830.8830.9731.07
Isi rumahHouseholds
(‘000)
b
7,483
7,527 7,551 7,575 7,599
Harga semasaCurrent prices
(RM bilion/billion)
304.0
291.0298.5311.8328.0
Harga malarConstant prices
(RM bilion/billion)
c
277.9
265.1271.3280.9290.6
Indeks Harga Pengguna (IHP)Consumer Price Index (CPI)
d
112.8
114.3114.4114.7115.2
KDNKGDP
Sumber / Source : DOSM, MCMC
13
Nota penjelasan: Explanatory notes: a. Unjuran penduduk seperti pada penghujung tempoh berdasarkan Banci 2010 Population projections as at end of period, based on Census 2010
b. Bilangan isi rumah diperolehi dengan membahagikan bilangan penduduk dengan purata saiz isi rumah Number of households derived by dividing populations by average household size
Isi rumah ditakrifkan sebagai seorang atau sekumpulan orang yang bersaudara atau orang tidak bersaudara yang biasanya tinggal bersama dan membuat peruntukan yang sama untuk makanan dan keperluan hidup yang lain
A household consists of related and/or unrelated persons who usually live together and make common provisions for food and other essentials of living.
c. Tahun asas adalah 2010 Base year is 2010 d. Tahun asas adalah 2010 Base year is 2010 IHP bagi sesuatu suku tahun merujuk kepada indeks purata dari 1 Januari hingga hujung suku tahun tersebut
The CPI reported against a quarter, refers to the average index for the period spanning 1st January to the end of that quarter
14
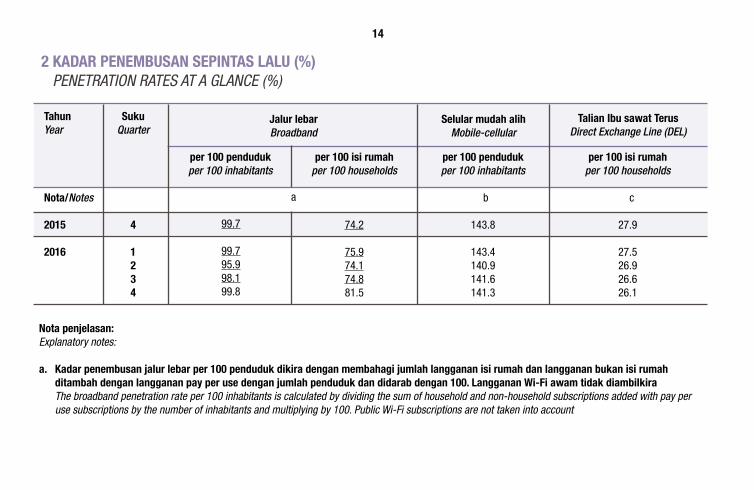
2 KADAR PENEMBUSAN SEPINTAS LALU (%) PENETRATION RATES AT A GLANCE (%)
TahunYear
Nota/Notes
2015
2016
SukuQuarter
4
1234
per 100 penduduk per 100 inhabitants
per 100 isi rumahper 100 households
c
27.9
27.526.926.626.1
Talian Ibu sawat TerusDirect Exchange Line (DEL)
Jalur lebarBroadband
per 100 isi rumahper 100 households
74.2
75.974.174.881.5
per 100 penduduk per 100 inhabitants
b
143.8
143.4140.9141.6141.3
Selular mudah alihMobile-cellular
99.7
99.795.998.199.8
a
Nota penjelasan: Explanatory notes: a. Kadar penembusan jalur lebar per 100 penduduk dikira dengan membahagi jumlah langganan isi rumah dan langganan bukan isi rumah
ditambah dengan langganan pay per use dengan jumlah penduduk dan didarab dengan 100. Langganan Wi-Fi awam tidak diambilkira The broadband penetration rate per 100 inhabitants is calculated by dividing the sum of household and non-household subscriptions added with pay per
use subscriptions by the number of inhabitants and multiplying by 100. Public Wi-Fi subscriptions are not taken into account
15
Kadar penembusan jalur lebar per 100 isi rumah dikira dengan membahagi jumlah langganan isi rumah dengan jumlah isi rumah dan didarab dengan 100
The broadband penetration rate per 100 households is calculated by dividing the number of household subscriptions by the number of households and multiplied by 100
Bermula suku keempat 2015, pengiraan langganan dan kadar penembusan jalur lebar disemak semula dengan tidak lagi mengambil kira jalur
lebar tetap yang berkelajuan kurang daripada 1 Mbit/s Commencing Q4 2015, the calculation for broadband subscriptions and penetration rates are revised to exclude fixed broadband with downstream speeds
less than 1 Mbit/s b. Kadar penembusan selular mudah alih dikira sebagai jumlah langganan dibahagi jumlah penduduk dan didarabkan dengan 100. Penembusan
yang melebihi 100% boleh berpunca daripada pelanggan yang melanggan melebihi daripada satu langganan The mobile cellular penetration rate refers to the total subscriptions divided by the total population and multiplied by 100. A penetration rate over 100% can
occur because of multiple subscriptions
c. Kadar penembusan Talian Ibu sawat Terus per 100 isi rumah dikirakan dengan membahagi jumlah langganan isi rumah dengan jumlah isi rumah dan didarab dengan 100
The Direct Exchange Line (DEL) penetration rate per 100 households is calculated by dividing the number of household subscriptions by the number of households and multiplying by 100
16
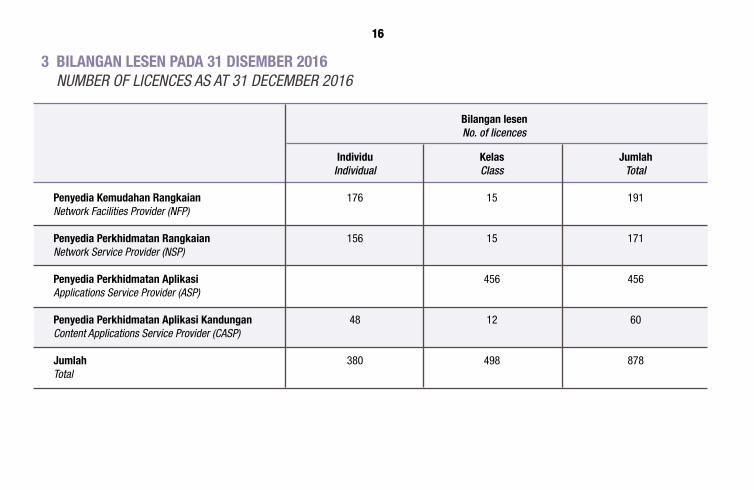
3 BILANGAN LESEN PADA 31 DISEMBER 2016 NUMBER OF LICENCES AS AT 31 DECEMBER 2016
Penyedia Kemudahan RangkaianNetwork Facilities Provider (NFP)
Penyedia Perkhidmatan Rangkaian Network Service Provider (NSP)
Penyedia Perkhidmatan Aplikasi Applications Service Provider (ASP)
Penyedia Perkhidmatan Aplikasi KandunganContent Applications Service Provider (CASP)
JumlahTotal
IndividuIndividual
176
156
48
380
KelasClass
15
15
456
12
498
JumlahTotal
191
171
456
60
878
Bilangan lesenNo. of licences
16
17
JALUR LEBAR DAN INTERNETBROADBAND AND INTERNET
17
18
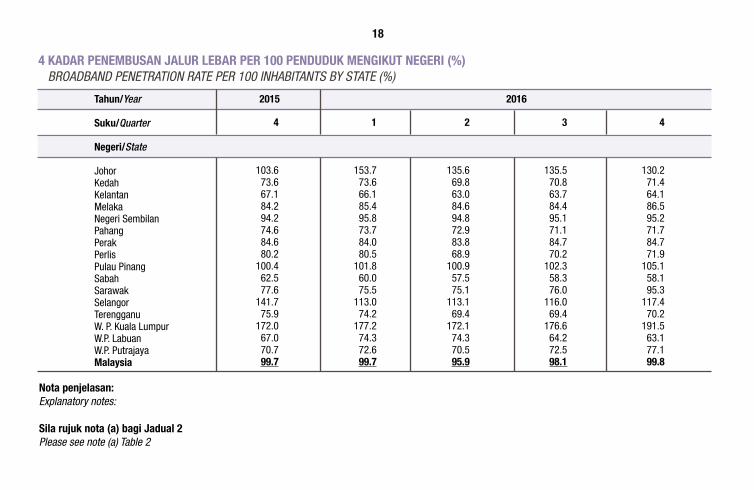
4 KADAR PENEMBUSAN JALUR LEBAR PER 100 PENDUDUK MENGIKUT NEGERI (%) BROADBAND PENETRATION RATE PER 100 INHABITANTS BY STATE (%)
Tahun/Year
Suku/Quarter Negeri/State
JohorKedahKelantanMelakaNegeri SembilanPahangPerakPerlisPulau PinangSabahSarawakSelangorTerengganuW. P. Kuala LumpurW.P. LabuanW.P. PutrajayaMalaysia
4
103.673.667.184.294.274.684.680.2
100.462.577.6
141.775.9
172.067.070.799.7
2015 2016
1
153.773.666.185.495.873.784.080.5
101.860.075.5
113.074.2
177.274.372.699.7
2
135.669.863.084.694.872.983.868.9
100.957.575.1
113.169.4
172.174.370.595.9
4
130.271.464.186.595.271.784.771.9
105.158.195.3
117.470.2
191.563.177.199.8
3
135.570.863.784.495.171.184.770.2
102.358.376.0
116.069.4
176.664.272.598.1
Nota penjelasan: Explanatory notes: Sila rujuk nota (a) bagi Jadual 2Please see note (a) Table 2

19
Kada
r pen
embu
san
per 1
00 is
i rum
ah (%
) /Pe
netra
tion
rate
per
100
hou
seho
lds
(%)
KADAR PENEMBUSAN JALUR LEBAR PER 100 PENDUDUK MENGIKUT NEGERI, 2016BROADBAND PENETRATION RATE PER 100 INHABITANTS BY STATE, 2016
0
50
100
150
200
250
99.8Malaysia,
130.2
71.4 64.1
86.5 95.2
71.7
84.7
71.9
105.1
58.1
95.3
117.4
70.2
191.5
63.177.1
20
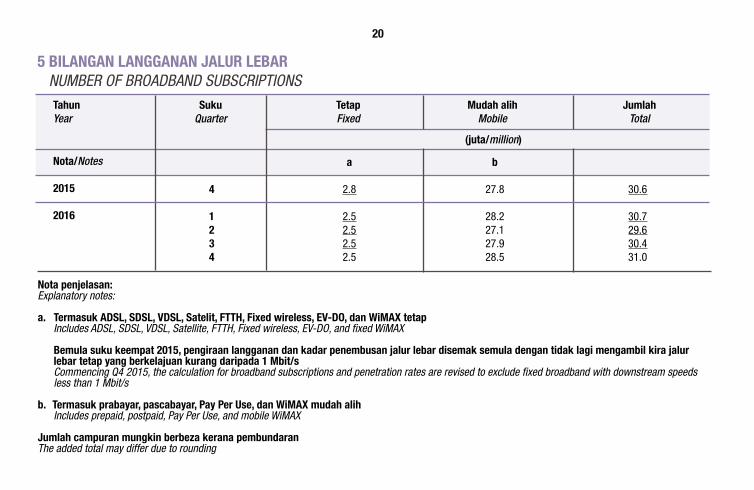
5 BILANGAN LANGGANAN JALUR LEBAR NUMBER OF BROADBAND SUBSCRIPTIONS
Nota/Notes
2015
2016
a
2.8
2.52.52.52.5
b
27.8
28.227.127.928.5
30.6
30.729.630.431.0
Mudah alihMobile
TetapFixed
Jumlah Total
(juta/million)
4
1234
SukuQuarter
TahunYear
Nota penjelasan: Explanatory notes: a. Termasuk ADSL, SDSL, VDSL, Satelit, FTTH, Fixed wireless, EV-DO, dan WiMAX tetap Includes ADSL, SDSL, VDSL, Satellite, FTTH, Fixed wireless, EV-DO, and fixed WiMAX Bemula suku keempat 2015, pengiraan langganan dan kadar penembusan jalur lebar disemak semula dengan tidak lagi mengambil kira jalur
lebar tetap yang berkelajuan kurang daripada 1 Mbit/s Commencing Q4 2015, the calculation for broadband subscriptions and penetration rates are revised to exclude fixed broadband with downstream speeds
less than 1 Mbit/s b. Termasuk prabayar, pascabayar, Pay Per Use, dan WiMAX mudah alih Includes prepaid, postpaid, Pay Per Use, and mobile WiMAX Jumlah campuran mungkin berbeza kerana pembundaranThe added total may differ due to rounding
21
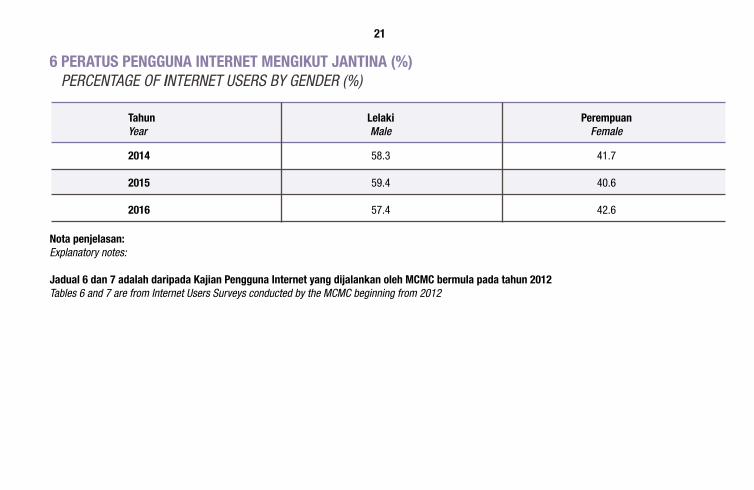
6 PERATUS PENGGUNA INTERNET MENGIKUT JANTINA (%) PERCENTAGE OF INTERNET USERS BY GENDER (%)
2014
2015
2016
58.3
59.4
57.4
41.7
40.6
42.6
PerempuanFemale
LelakiMale
TahunYear
Nota penjelasan: Explanatory notes: Jadual 6 dan 7 adalah daripada Kajian Pengguna Internet yang dijalankan oleh MCMC bermula pada tahun 2012 Tables 6 and 7 are from Internet Users Surveys conducted by the MCMC beginning from 2012
22
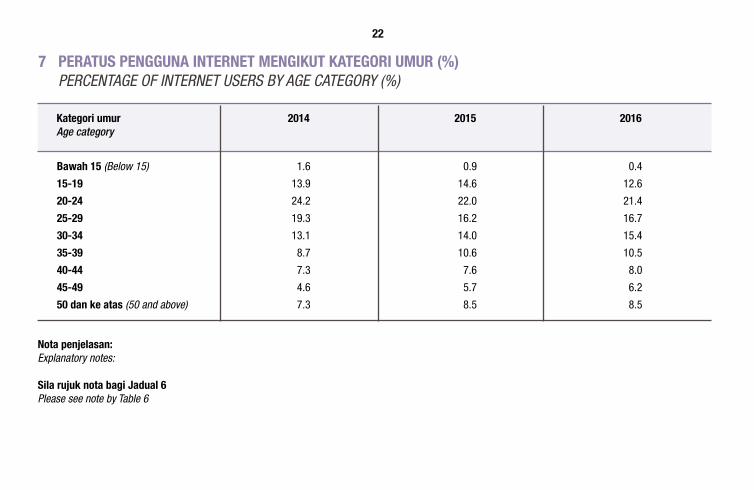
1.6
13.9
24.2
19.3
13.1
8.7
7.3
4.6
7.3
0.9
14.6
22.0
16.2
14.0
10.6
7.6
5.7
8.5
Bawah 15 (Below 15)
15-19
20-24
25-29
30-34
35-39
40-44
45-49
50 dan ke atas (50 and above)
7 PERATUS PENGGUNA INTERNET MENGIKUT KATEGORI UMUR (%) PERCENTAGE OF INTERNET USERS BY AGE CATEGORY (%)
Nota penjelasan: Explanatory notes: Sila rujuk nota bagi Jadual 6Please see note by Table 6
20152014Kategori umurAge category
0.4
12.6
21.4
16.7
15.4
10.5
8.0
6.2
8.5
2016
23
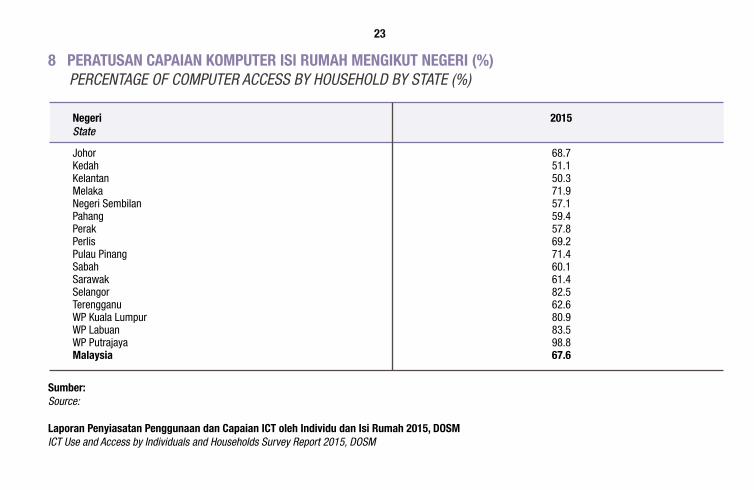
8 PERATUSAN CAPAIAN KOMPUTER ISI RUMAH MENGIKUT NEGERI (%) PERCENTAGE OF COMPUTER ACCESS BY HOUSEHOLD BY STATE (%)
JohorKedahKelantanMelakaNegeri SembilanPahangPerakPerlisPulau PinangSabah SarawakSelangorTerengganuWP Kuala LumpurWP LabuanWP PutrajayaMalaysia
68.751.150.371.957.159.457.869.271.460.161.482.562.680.983.598.867.6
2015NegeriState
Sumber: Source:
Laporan Penyiasatan Penggunaan dan Capaian ICT oleh Individu dan Isi Rumah 2015, DOSMICT Use and Access by Individuals and Households Survey Report 2015, DOSM
24
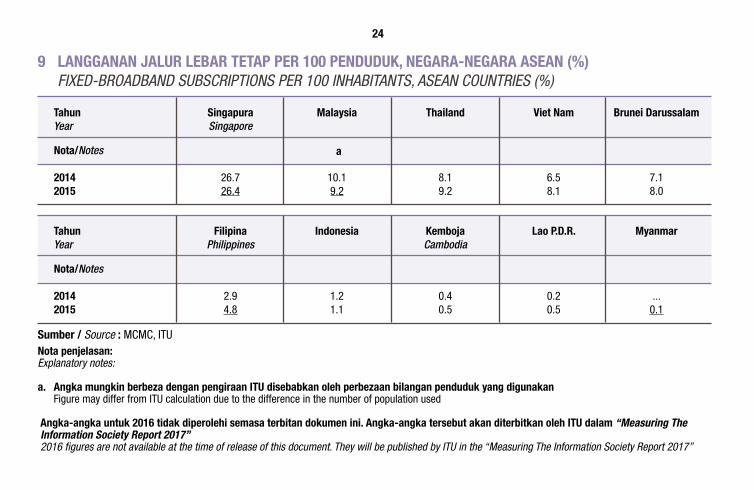
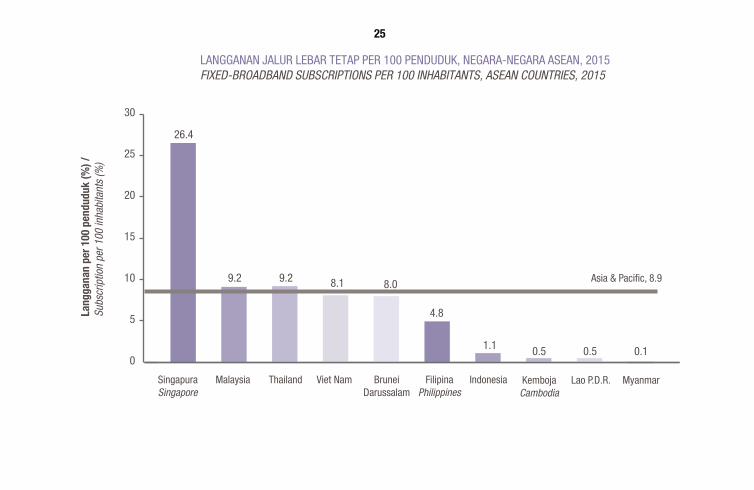
9 LANGGANAN JALUR LEBAR TETAP PER 100 PENDUDUK, NEGARA-NEGARA ASEAN (%) FIXED-BROADBAND SUBSCRIPTIONS PER 100 INHABITANTS, ASEAN COUNTRIES (%)
Nota/Notes
20142015
26.726.4
8.19.2
ThailandSingapuraSingapore
TahunYear
10.19.2
Malaysia
6.58.1
Viet Nam
7.18.0
Brunei Darussalam
a
Nota/Notes
20142015
2.94.8
0.40.5
KembojaCambodia
FilipinaPhilippines
TahunYear
1.21.1
Indonesia
0.20.5
Lao P.D.R.
...0.1
Myanmar
Sumber / Source : MCMC, ITU Nota penjelasan: Explanatory notes: a. Angka mungkin berbeza dengan pengiraan ITU disebabkan oleh perbezaan bilangan penduduk yang digunakan Figure may differ from ITU calculation due to the difference in the number of population used
Angka-angka untuk 2016 tidak diperolehi semasa terbitan dokumen ini. Angka-angka tersebut akan diterbitkan oleh ITU dalam “Measuring The Information Society Report 2017”2016 figures are not available at the time of release of this document. They will be published by ITU in the “Measuring The Information Society Report 2017”
25
0
5
10
15
20
25
30
Lang
gana
n pe
r 100
pen
dudu
k (%
) /Su
bscr
iptio
n pe
r 100
inha
bita
nts
(%)
LANGGANAN JALUR LEBAR TETAP PER 100 PENDUDUK, NEGARA-NEGARA ASEAN, 2015FIXED-BROADBAND SUBSCRIPTIONS PER 100 INHABITANTS, ASEAN COUNTRIES, 2015
SingapuraSingapore
Malaysia Thailand Viet Nam BruneiDarussalam
FilipinaPhilippines
Indonesia KembojaCambodia
Lao P.D.R. Myanmar
26.4
9.2 9.2 8.1 8.0
4.8
1.1
Asia & Pacific, 8.9
0.5 0.5 0.1
26
10.19.2
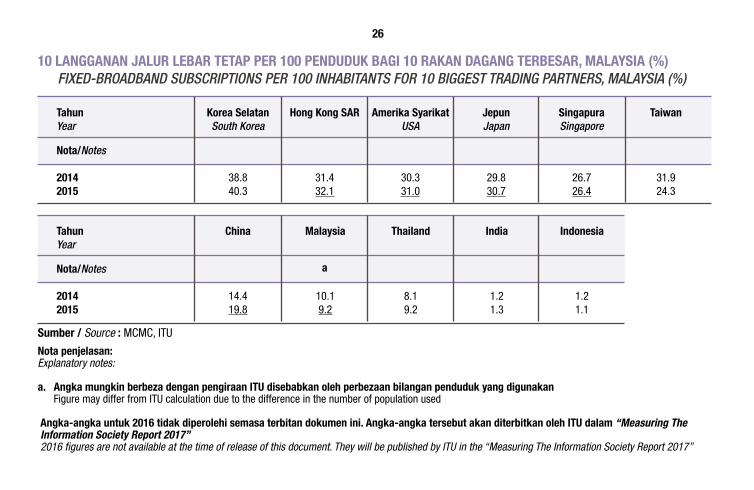
Sumber / Source : MCMC, ITU Nota penjelasan: Explanatory notes: a. Angka mungkin berbeza dengan pengiraan ITU disebabkan oleh perbezaan bilangan penduduk yang digunakan Figure may differ from ITU calculation due to the difference in the number of population used
Angka-angka untuk 2016 tidak diperolehi semasa terbitan dokumen ini. Angka-angka tersebut akan diterbitkan oleh ITU dalam “Measuring The Information Society Report 2017”2016 figures are not available at the time of release of this document. They will be published by ITU in the “Measuring The Information Society Report 2017”
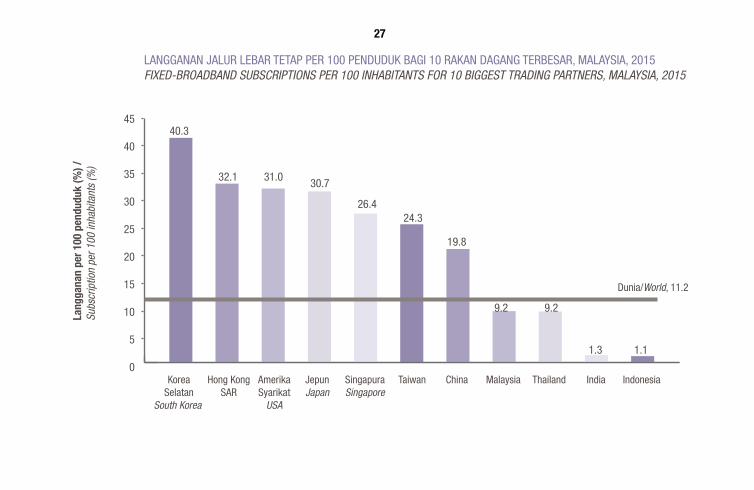
10 LANGGANAN JALUR LEBAR TETAP PER 100 PENDUDUK BAGI 10 RAKAN DAGANG TERBESAR, MALAYSIA (%) FIXED-BROADBAND SUBSCRIPTIONS PER 100 INHABITANTS FOR 10 BIGGEST TRADING PARTNERS, MALAYSIA (%)
Nota/Notes
20142015
TahunYear
Nota/Notes
20142015
TahunYear
38.840.3
30.331.0
Amerika SyarikatUSA
Korea SelatanSouth Korea
31.432.1
Hong Kong SAR
29.830.7
JepunJapan
26.726.4
SingapuraSingapore
a
8.19.2
ThailandChina Malaysia
1.21.3
India
1.21.1
Indonesia
31.924.3
Taiwan
14.419.8
27
0
5
10
15
20
25
30
35
40
45
Lang
gana
n pe
r 100
pen
dudu
k (%
) /Su
bscr
iptio
n pe
r 100
inha
bita
nts
(%)
LANGGANAN JALUR LEBAR TETAP PER 100 PENDUDUK BAGI 10 RAKAN DAGANG TERBESAR, MALAYSIA, 2015FIXED-BROADBAND SUBSCRIPTIONS PER 100 INHABITANTS FOR 10 BIGGEST TRADING PARTNERS, MALAYSIA, 2015
SingapuraSingapore
KoreaSelatan
South Korea
MalaysiaHong KongSAR
ThailandJepunJapan
Indonesia
Dunia/World, 11.2
AmerikaSyarikat
USA
Taiwan China India
40.3
32.1 31.0 26.4
30.7
24.3
9.29.2
1.3 1.1
19.8

28
Muka surat ini sengaja dibiarkan kosongThis page is intentionally left blank
28

29
SELULAR MUDAH ALIHMOBILE CELLULAR
29
30
TahunYear
2015
2016
SukuQuarter
4
1234
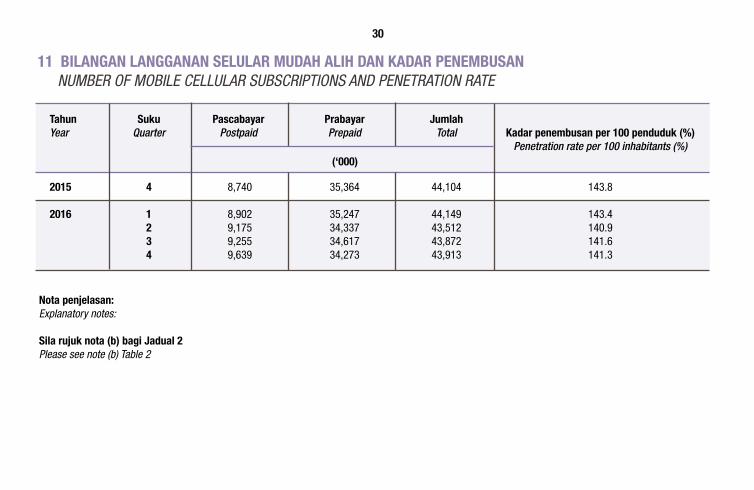
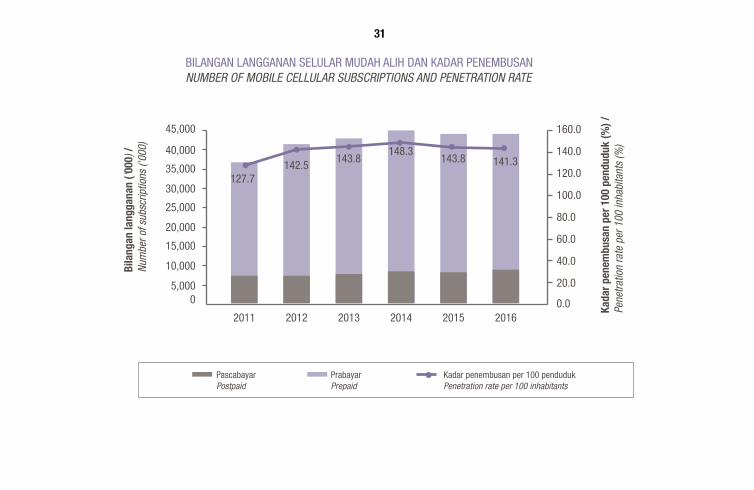
PascabayarPostpaid
8,740
8,902 9,175 9,255 9,639
PrabayarPrepaid
35,364
35,247 34,337 34,617 34,273
Kadar penembusan per 100 penduduk (%)Penetration rate per 100 inhabitants (%)
143.8
143.4140.9141.6141.3
11 BILANGAN LANGGANAN SELULAR MUDAH ALIH DAN KADAR PENEMBUSAN NUMBER OF MOBILE CELLULAR SUBSCRIPTIONS AND PENETRATION RATE
Jumlah Total
44,104
44,14943,51243,87243,913
(‘000)
Nota penjelasan: Explanatory notes: Sila rujuk nota (b) bagi Jadual 2Please see note (b) Table 2
31
Bila
ngan
lang
gana
n ('0
00) /
Num
ber o
f sub
scrip
tions
('00
0)
Kada
r pen
embu
san
per 1
00 p
endu
duk
(%) /
Pene
tratio
n ra
te p
er 1
00 in
habi
tant
s (%
)
BILANGAN LANGGANAN SELULAR MUDAH ALIH DAN KADAR PENEMBUSANNUMBER OF MOBILE CELLULAR SUBSCRIPTIONS AND PENETRATION RATE
5,0000
10,000
15,000
20,000
25,000
30,000
35,000
40,000
45,000
0.0
20.0
40.0
60.0
80.0
100.0
120.0
140.0
160.0
2011 2012 2013 2014 2015 2016
PascabayarPostpaid
PrabayarPrepaid
Kadar penembusan per 100 pendudukPenetration rate per 100 inhabitants
127.7142.5
143.8148.3
143.8 141.3
32
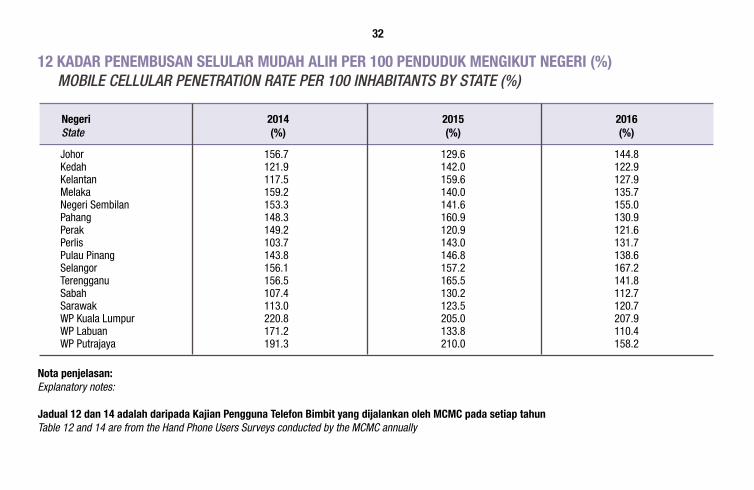
12 KADAR PENEMBUSAN SELULAR MUDAH ALIH PER 100 PENDUDUK MENGIKUT NEGERI (%) MOBILE CELLULAR PENETRATION RATE PER 100 INHABITANTS BY STATE (%)
JohorKedahKelantanMelakaNegeri SembilanPahangPerakPerlisPulau PinangSelangorTerengganuSabahSarawakWP Kuala LumpurWP LabuanWP Putrajaya
NegeriState
Nota penjelasan: Explanatory notes:
Jadual 12 dan 14 adalah daripada Kajian Pengguna Telefon Bimbit yang dijalankan oleh MCMC pada setiap tahunTable 12 and 14 are from the Hand Phone Users Surveys conducted by the MCMC annually
156.7121.9117.5159.2153.3148.3149.2103.7143.8156.1156.5107.4113.0220.8171.2191.3
2014(%)
129.6142.0159.6140.0141.6160.9120.9143.0146.8157.2165.5130.2123.5205.0133.8210.0
2015(%)
144.8122.9127.9135.7155.0130.9121.6131.7138.6167.2141.8112.7120.7207.9110.4158.2
2016(%)
33
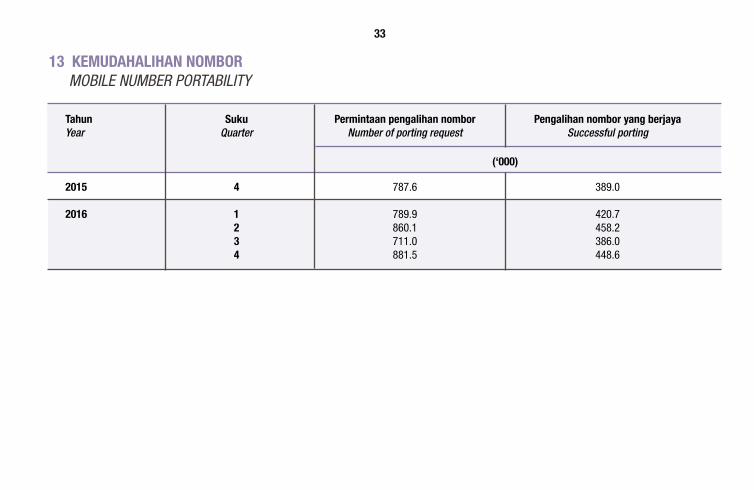
13 KEMUDAHALIHAN NOMBOR MOBILE NUMBER PORTABILITY
TahunYear
2015
2016
SukuQuarter
4
1234
Pengalihan nombor yang berjayaSuccessful porting
389.0
420.7458.2386.0448.6
(‘000)
Permintaan pengalihan nomborNumber of porting request
787.6
789.9860.1711.0881.5
34
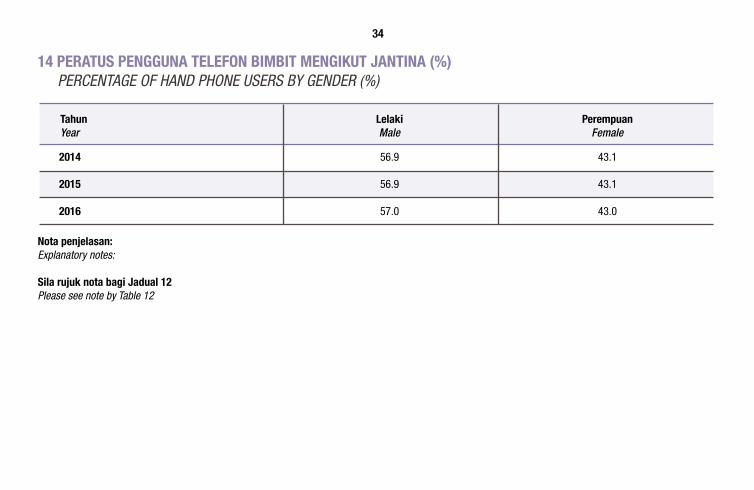
14 PERATUS PENGGUNA TELEFON BIMBIT MENGIKUT JANTINA (%) PERCENTAGE OF HAND PHONE USERS BY GENDER (%)
2014
2015
2016
56.9
56.9
57.0
43.1
43.1
43.0
PerempuanFemale
LelakiMale
TahunYear
Nota penjelasan: Explanatory notes: Sila rujuk nota bagi Jadual 12Please see note by Table 12
35
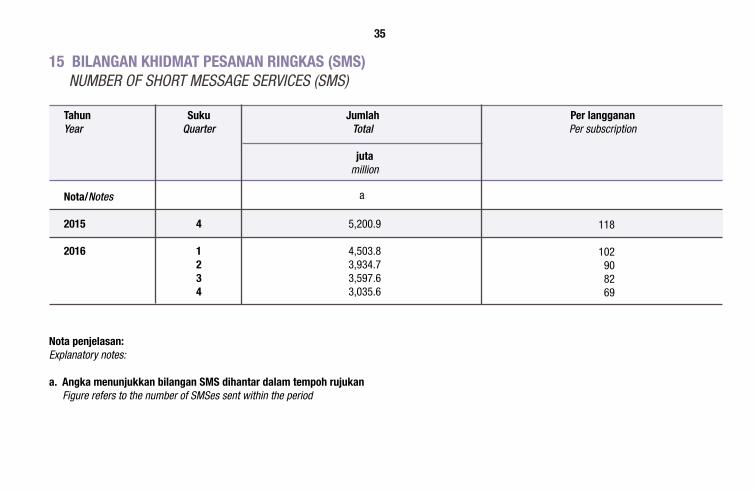
15 BILANGAN KHIDMAT PESANAN RINGKAS (SMS) NUMBER OF SHORT MESSAGE SERVICES (SMS)
TahunYear
Nota/Notes
2015
2016
SukuQuarter
4
1234
Per langgananPer subscription
JumlahTotal
a
Nota penjelasan: Explanatory notes: a. Angka menunjukkan bilangan SMS dihantar dalam tempoh rujukan Figure refers to the number of SMSes sent within the period
118
102 90 82 69
jutamillion
5,200.9
4,503.8 3,934.7 3,597.6 3,035.6
36
146.9146.5
SingapuraSingapore
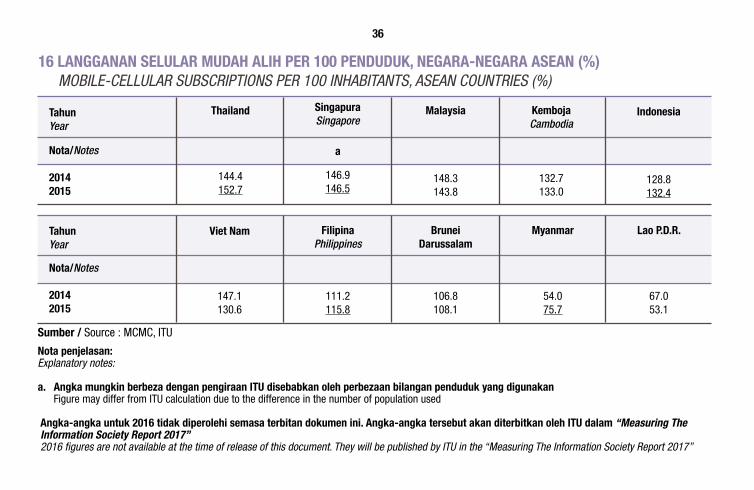
16 LANGGANAN SELULAR MUDAH ALIH PER 100 PENDUDUK, NEGARA-NEGARA ASEAN (%) MOBILE-CELLULAR SUBSCRIPTIONS PER 100 INHABITANTS, ASEAN COUNTRIES (%)
148.3143.8
Malaysia
147.1130.6
Viet Nam
a
106.8108.1
Nota/Notes
20142015
TahunYear
Nota/Notes
20142015
TahunYear
111.2115.8
128.8132.4
Indonesia
54.075.7
Myanmar
67.053.1
Lao P.D.R.
Sumber / Source : MCMC, ITU
Brunei Darussalam
FilipinaPhilippines
144.4152.7
Thailand
132.7133.0
KembojaCambodia
Nota penjelasan: Explanatory notes: a. Angka mungkin berbeza dengan pengiraan ITU disebabkan oleh perbezaan bilangan penduduk yang digunakan Figure may differ from ITU calculation due to the difference in the number of population used
Angka-angka untuk 2016 tidak diperolehi semasa terbitan dokumen ini. Angka-angka tersebut akan diterbitkan oleh ITU dalam “Measuring The Information Society Report 2017”2016 figures are not available at the time of release of this document. They will be published by ITU in the “Measuring The Information Society Report 2017”
37
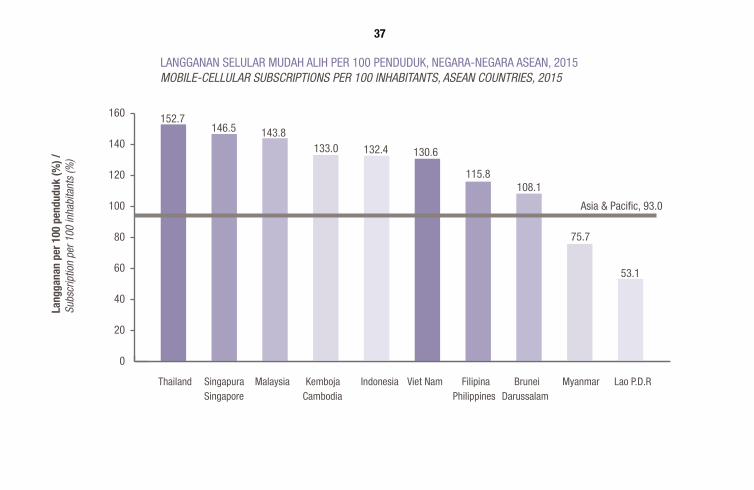
Asia & Pacific,
0
20
40
60
80
100
120
140
160
93.0
LANGGANAN SELULAR MUDAH ALIH PER 100 PENDUDUK, NEGARA-NEGARA ASEAN, 2015MOBILE-CELLULAR SUBSCRIPTIONS PER 100 INHABITANTS, ASEAN COUNTRIES, 2015
Lang
gana
n pe
r 100
pen
dudu
k (%
) /Su
bscr
iptio
n pe
r 100
inha
bita
nts
(%)
Thailand SingapuraSingapore
Malaysia KembojaCambodia
Indonesia Viet Nam FilipinaPhilippines
BruneiDarussalam
Myanmar Lao P.D.R
152.7146.5 143.8
133.0 132.4 130.6
115.8108.1
75.7
53.1
38
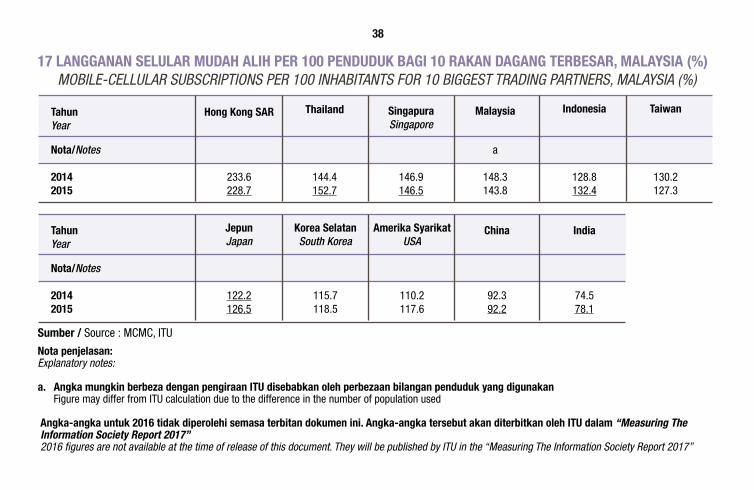
110.2117.6
115.7118.5
Nota/Notes
20142015
TahunYear
Nota/Notes
20142015
TahunYear
Korea SelatanSouth Korea
146.9146.5
SingapuraSingapore
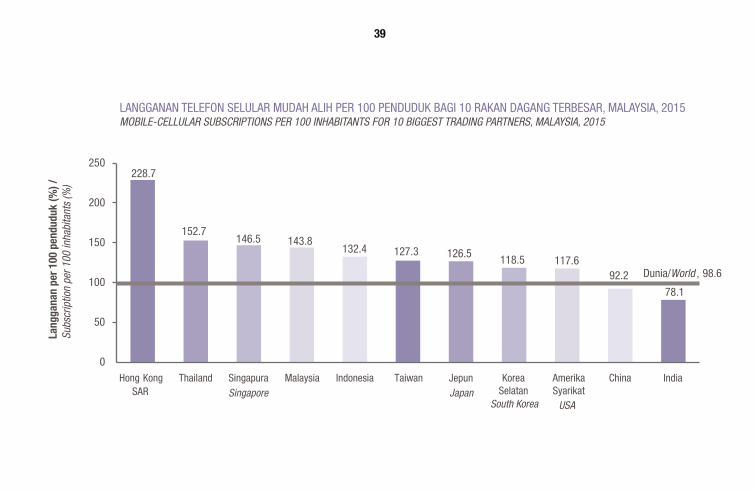
17 LANGGANAN SELULAR MUDAH ALIH PER 100 PENDUDUK BAGI 10 RAKAN DAGANG TERBESAR, MALAYSIA (%) MOBILE-CELLULAR SUBSCRIPTIONS PER 100 INHABITANTS FOR 10 BIGGEST TRADING PARTNERS, MALAYSIA (%)
233.6228.7
JepunJapan
122.2126.5
Hong Kong SAR
130.2127.3
Taiwan
74.578.1
India
128.8132.4
Indonesia
92.392.2
China
Sumber / Source : MCMC, ITU
a
148.3143.8
Amerika SyarikatUSA
MalaysiaThailand
144.4152.7
Nota penjelasan: Explanatory notes: a. Angka mungkin berbeza dengan pengiraan ITU disebabkan oleh perbezaan bilangan penduduk yang digunakan Figure may differ from ITU calculation due to the difference in the number of population used
Angka-angka untuk 2016 tidak diperolehi semasa terbitan dokumen ini. Angka-angka tersebut akan diterbitkan oleh ITU dalam “Measuring The Information Society Report 2017”2016 figures are not available at the time of release of this document. They will be published by ITU in the “Measuring The Information Society Report 2017”
39
228.7
152.7146.5 143.8
132.4 127.3 126.5 118.5 117.692.2
78.1
Dunia/World ,
0
50
100
150
200
250
Hong Kong Thailand SingapuraSingapore
Malaysia Indonesia Taiwan JepunJapan
South Korea
KoreaSelatan
USA
AmerikaSyarikat
China IndiaSAR
Lang
gana
n pe
r 100
pen
dudu
k (%
) /Su
bscr
iptio
n pe
r 100
inha
bita
nts
(%)
LANGGANAN TELEFON SELULAR MUDAH ALIH PER 100 PENDUDUK BAGI 10 RAKAN DAGANG TERBESAR, MALAYSIA, 2015MOBILE-CELLULAR SUBSCRIPTIONS PER 100 INHABITANTS FOR 10 BIGGEST TRADING PARTNERS, MALAYSIA, 2015
98.6

40
Muka surat ini sengaja dibiarkan kosongThis page is intentionally left blank
40
41
TELEFON TETAPFIXED TELEPHONES
41
42
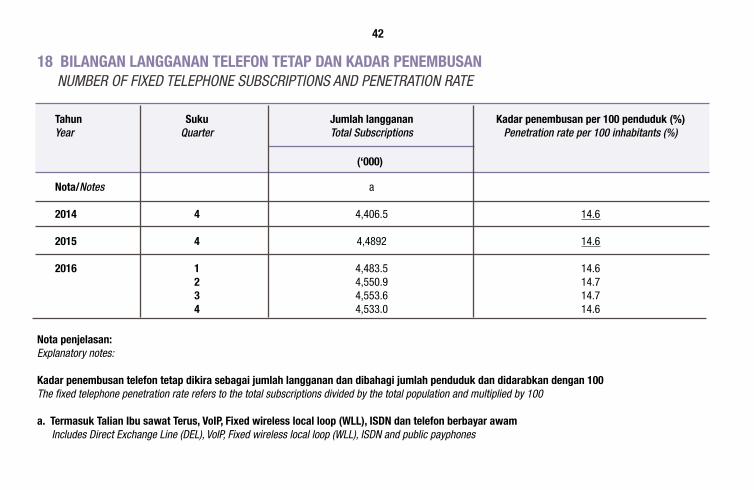
18 BILANGAN LANGGANAN TELEFON TETAP DAN KADAR PENEMBUSAN NUMBER OF FIXED TELEPHONE SUBSCRIPTIONS AND PENETRATION RATE
TahunYear
Nota/Notes
2014
2015
2016
SukuQuarter
4
4
1234
Kadar penembusan per 100 penduduk (%)Penetration rate per 100 inhabitants (%)
14.6
14.6
14.614.714.714.6
(‘000)
Nota penjelasan: Explanatory notes: Kadar penembusan telefon tetap dikira sebagai jumlah langganan dan dibahagi jumlah penduduk dan didarabkan dengan 100The fixed telephone penetration rate refers to the total subscriptions divided by the total population and multiplied by 100
a. Termasuk Talian Ibu sawat Terus, VoIP, Fixed wireless local loop (WLL), ISDN dan telefon berbayar awam Includes Direct Exchange Line (DEL), VoIP, Fixed wireless local loop (WLL), ISDN and public payphones
Jumlah langgananTotal Subscriptions
a
4,406.5
4,4892
4,483.54,550.94,553.64,533.0
43
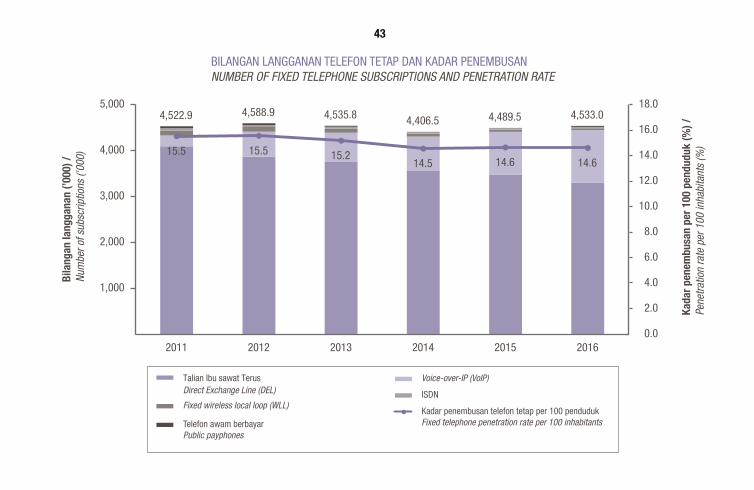
4,522.9 4,588.9 4,535.8 4,406.5 4,489.5 4,533.0
15.5 15.5 15.214.5 14.6 14.6
0.0
2.0
4.0
6.0
8.0
10.0
12.0
14.0
16.0
18.0
1,000
2,000
3,000
4,000
5,000
2011 2012 2013 2014 2015 2016
Voice-over-IP (VoIP)
Fixed wireless local loop (WLL)ISDN
Telefon awam berbayarPublic payphones
Kadar penembusan telefon tetap per 100 pendudukFixed telephone penetration rate per 100 inhabitants
Talian Ibu sawat TerusDirect Exchange Line (DEL)
Bila
ngan
lang
gana
n (’0
00) /
Num
ber o
f sub
scrip
tions
('00
0)
Kada
r pen
embu
san
per 1
00 p
endu
duk
(%) /
Pene
tratio
n ra
te p
er 1
00 in
habi
tant
s (%
)
BILANGAN LANGGANAN TELEFON TETAP DAN KADAR PENEMBUSANNUMBER OF FIXED TELEPHONE SUBSCRIPTIONS AND PENETRATION RATE
44
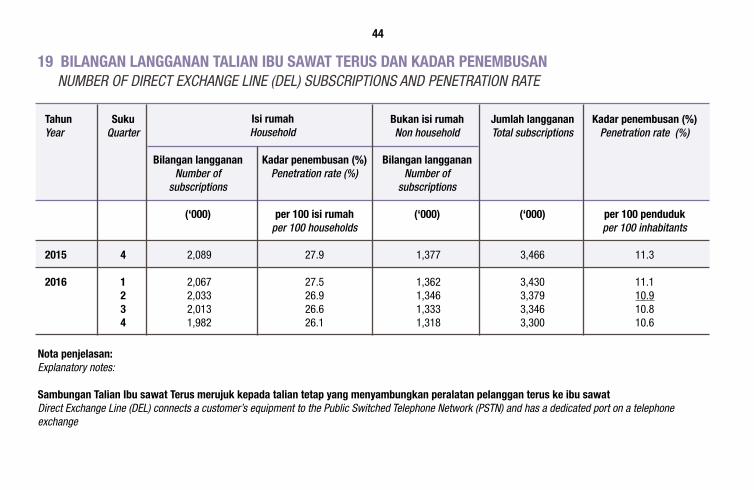
19 BILANGAN LANGGANAN TALIAN IBU SAWAT TERUS DAN KADAR PENEMBUSAN NUMBER OF DIRECT EXCHANGE LINE (DEL) SUBSCRIPTIONS AND PENETRATION RATE
Nota penjelasan: Explanatory notes: Sambungan Talian Ibu sawat Terus merujuk kepada talian tetap yang menyambungkan peralatan pelanggan terus ke ibu sawat Direct Exchange Line (DEL) connects a customer’s equipment to the Public Switched Telephone Network (PSTN) and has a dedicated port on a telephone exchange
TahunYear
2015
2016
SukuQuarter
4
1234
Bilangan langgananNumber of
subscriptions
(‘000)
2,089
2,067 2,033 2,013 1,982
Bukan isi rumahNon household
Bilangan langgananNumber of
subscriptions
(‘000)
1,377
1,362 1,346 1,333 1,318
Kadar penembusan (%)Penetration rate (%)
per 100 pendudukper 100 inhabitants
11.3
11.110.910.810.6
Jumlah langgananTotal subscriptions
(‘000)
3,466
3,4303,3793,3463,300
Kadar penembusan (%)Penetration rate (%)
per 100 isi rumahper 100 households
27.9
27.526.926.626.1
Isi rumahHousehold
45
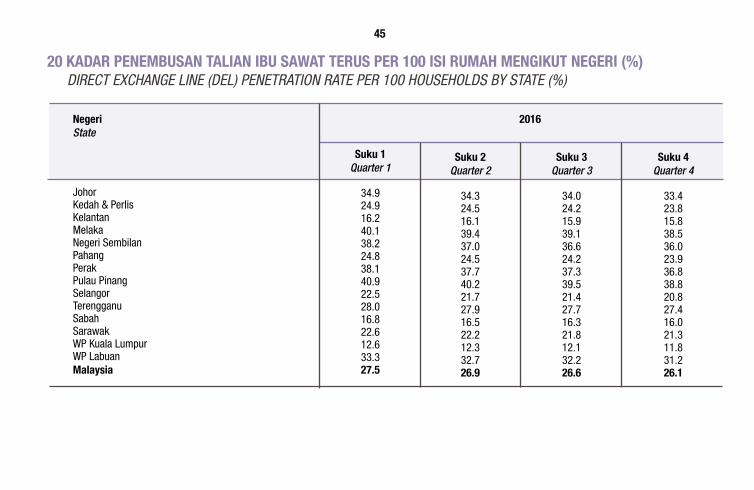
20 KADAR PENEMBUSAN TALIAN IBU SAWAT TERUS PER 100 ISI RUMAH MENGIKUT NEGERI (%) DIRECT EXCHANGE LINE (DEL) PENETRATION RATE PER 100 HOUSEHOLDS BY STATE (%)
JohorKedah & PerlisKelantanMelakaNegeri SembilanPahangPerakPulau PinangSelangorTerengganuSabahSarawakWP Kuala LumpurWP LabuanMalaysia
NegeriState
Suku 1Quarter 1
34.924.916.240.138.224.838.140.922.528.016.822.612.633.327.5
2016
Suku 2Quarter 2
34.324.516.139.437.024.537.740.221.727.916.522.212.332.726.9
Suku 3Quarter 3
34.024.215.939.136.624.237.339.521.427.716.321.812.132.226.6
Suku 4Quarter 4
33.423.815.838.536.023.936.838.820.827.416.021.311.831.226.1
46
0
5
10
15
20
25
30
35
40
45
Kada
r pen
embu
san
per 1
00 is
i rum
ah (%
) /Pe
netra
tion
rate
per
100
hou
seho
lds
(%)
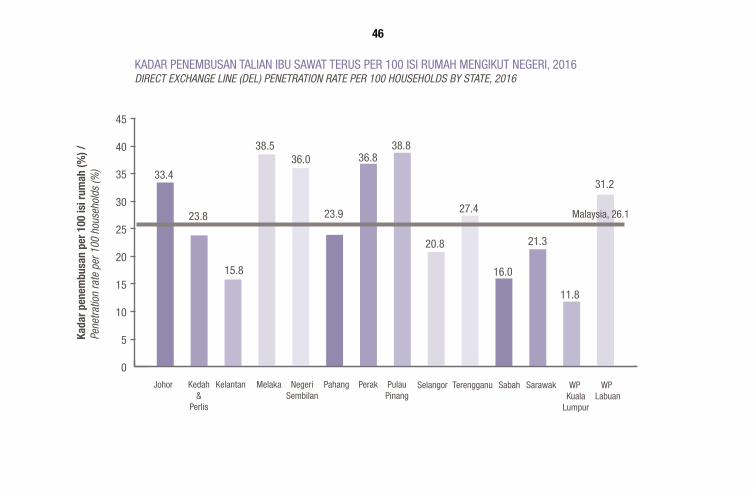
KADAR PENEMBUSAN TALIAN IBU SAWAT TERUS PER 100 ISI RUMAH MENGIKUT NEGERI, 2016DIRECT EXCHANGE LINE (DEL) PENETRATION RATE PER 100 HOUSEHOLDS BY STATE, 2016
Johor Kedah&
Perlis
Melaka NegeriSembilan
Pahang PulauPinang
Perak Terengganu Sabah Sarawak WP Kuala
Lumpur
WP Labuan
Selangor
Malaysia, 26.1
Kelantan
33.4
15.8
38.5
36.8 38.8
20.8
27.4
16.0
21.3
11.8
31.2
36.0
23.9 23.8
47
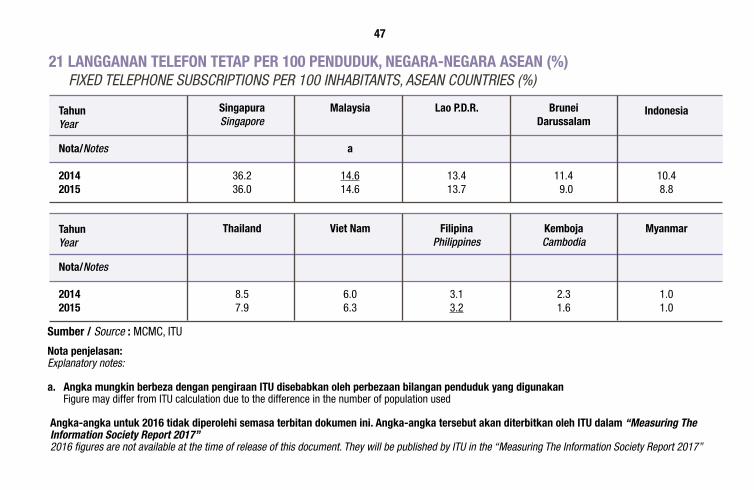
21 LANGGANAN TELEFON TETAP PER 100 PENDUDUK, NEGARA-NEGARA ASEAN (%) FIXED TELEPHONE SUBSCRIPTIONS PER 100 INHABITANTS, ASEAN COUNTRIES (%)
Nota/Notes
20142015
TahunYear
Nota/Notes
20142015
TahunYear
11.49.0
Brunei Darussalam
2.31.6
KembojaCambodia
10.48.8
Indonesia
1.01.0
Myanmar
Sumber / Source : MCMC, ITU
36.236.0
SingapuraSingapore
8.57.9
Thailand
13.413.7
3.13.2
Lao P.D.R.
FilipinaPhilippines
a
14.614.6
Malaysia
6.06.3
Viet Nam
Nota penjelasan: Explanatory notes: a. Angka mungkin berbeza dengan pengiraan ITU disebabkan oleh perbezaan bilangan penduduk yang digunakan Figure may differ from ITU calculation due to the difference in the number of population used
Angka-angka untuk 2016 tidak diperolehi semasa terbitan dokumen ini. Angka-angka tersebut akan diterbitkan oleh ITU dalam “Measuring The Information Society Report 2017”2016 figures are not available at the time of release of this document. They will be published by ITU in the “Measuring The Information Society Report 2017”

48
0
5
10
15
20
25
30
35
40
Lang
gana
n pe
r 100
pen
dudu
k (%
) /Su
bscr
iptio
n pe
r 100
inha
bita
nts
(%)
LANGGANAN TELEFON TETAP PER 100 PENDUDUK, NEGARA-NEGARA ASEAN, 2015FIXED TELEPHONE SUBSCRIPTIONS PER 100 INHABITANTS, ASEAN COUNTRIES, 2015
SingapuraSingapore
Malaysia BruneiDarussalam
Indonesia Thailand Viet Nam
Asia & Pacific, 11.0
Lao P.D.R
14.6
1.6
FilipinaPhilippines
KembojaCambodia
Myanmar
9.0
36.0
13.7
8.86.3
3.01.0
7.9
49
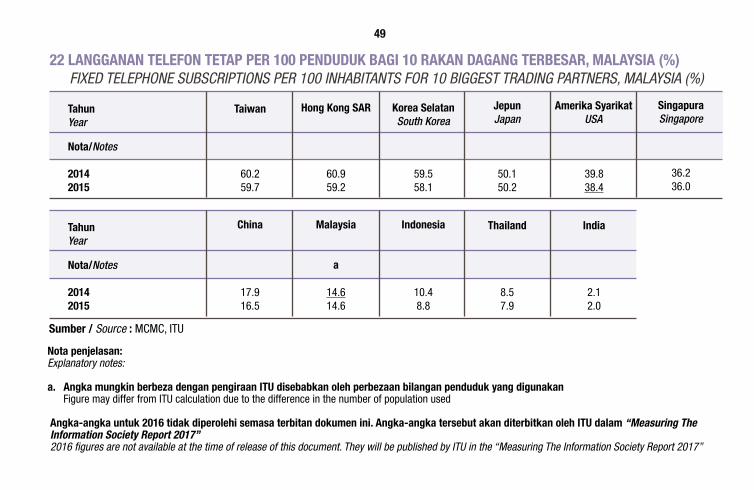
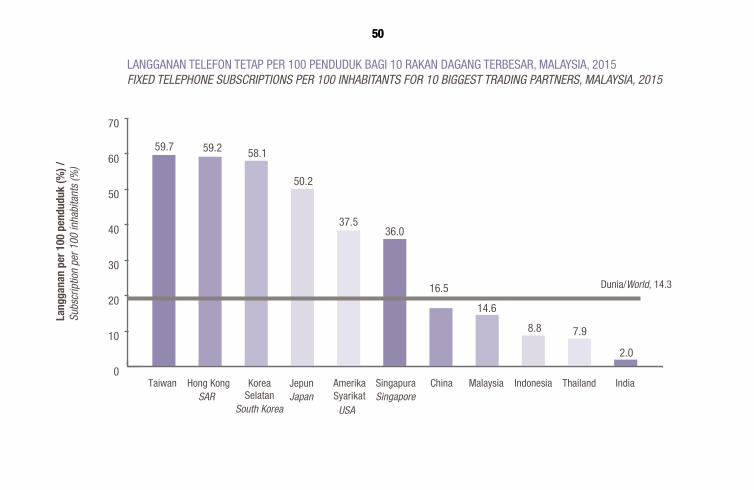
22 LANGGANAN TELEFON TETAP PER 100 PENDUDUK BAGI 10 RAKAN DAGANG TERBESAR, MALAYSIA (%) FIXED TELEPHONE SUBSCRIPTIONS PER 100 INHABITANTS FOR 10 BIGGEST TRADING PARTNERS, MALAYSIA (%)
Nota/Notes
20142015
TahunYear
Nota/Notes
20142015
TahunYear
17.916.5
60.259.7
China
Taiwan
39.838.4
Amerika SyarikatUSA
2.12.0
India
36.236.0
SingapuraSingapore
50.150.2
JepunJapan
8.57.9
Thailand
14.614.6
Malaysia
60.959.2
Hong Kong SAR
a
Sumber / Source : MCMC, ITU
10.48.8
59.558.1
Indonesia
Korea SelatanSouth Korea
Nota penjelasan: Explanatory notes: a. Angka mungkin berbeza dengan pengiraan ITU disebabkan oleh perbezaan bilangan penduduk yang digunakan Figure may differ from ITU calculation due to the difference in the number of population used
Angka-angka untuk 2016 tidak diperolehi semasa terbitan dokumen ini. Angka-angka tersebut akan diterbitkan oleh ITU dalam “Measuring The Information Society Report 2017”2016 figures are not available at the time of release of this document. They will be published by ITU in the “Measuring The Information Society Report 2017”
50
0
10
20
30
40
50
60
70
Lang
gana
n pe
r 100
pen
dudu
k (%
) /Su
bscr
iptio
n pe
r 100
inha
bita
nts
(%)
LANGGANAN TELEFON TETAP PER 100 PENDUDUK BAGI 10 RAKAN DAGANG TERBESAR, MALAYSIA, 2015FIXED TELEPHONE SUBSCRIPTIONS PER 100 INHABITANTS FOR 10 BIGGEST TRADING PARTNERS, MALAYSIA, 2015
Dunia/World, 14.3
59.2
Taiwan Hong KongSAR
KoreaSelatan
South Korea
JepunJapan
USA
AmerikaSyarikat
SingapuraSingapore
China Malaysia Indonesia Thailand India
2.0
36.0
59.7
14.6
58.1
50.2
37.5
16.5
8.8 7.9
50
51
TV DAN RADIOTV AND RADIO
51
52
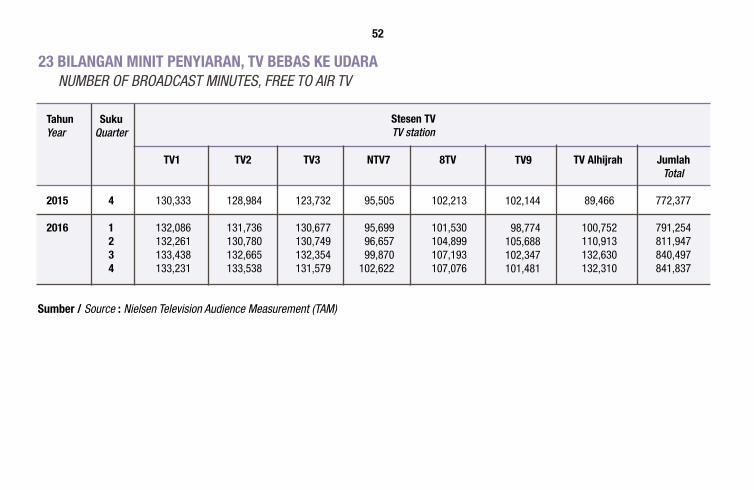
23 BILANGAN MINIT PENYIARAN, TV BEBAS KE UDARA NUMBER OF BROADCAST MINUTES, FREE TO AIR TV
TahunYear
2015
2016
SukuQuarter
4
1234
TV1
130,333
132,086 132,261 133,438 133,231
TV2
128,984
131,736 130,780 132,665 133,538
TV3
123,732
130,677 130,749 132,354 131,579
NTV7
95,505
95,699 96,657 99,870
102,622
8TV
102,213
101,530 104,899 107,193 107,076
102,144
98,774 105,688 102,347 101,481
TV Alhijrah
89,466
100,752 110,913 132,630 132,310
JumlahTotal
772,377
791,254811,947840,497841,837
Stesen TVTV station
Sumber / Source : Nielsen Television Audience Measurement (TAM)
TV9
53
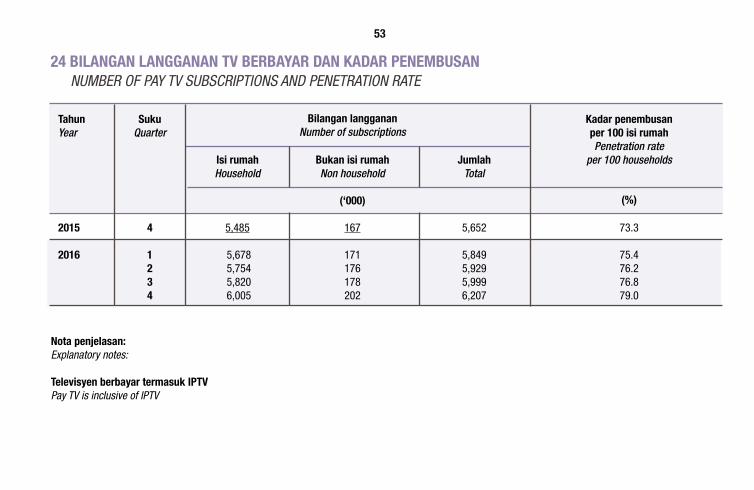
24 BILANGAN LANGGANAN TV BERBAYAR DAN KADAR PENEMBUSAN NUMBER OF PAY TV SUBSCRIPTIONS AND PENETRATION RATE
Nota penjelasan: Explanatory notes: Televisyen berbayar termasuk IPTVPay TV is inclusive of IPTV
TahunYear
2015
2016
SukuQuarter
4
1234
Isi rumahHousehold
5,485
5,678 5,754 5,820 6,005
JumlahTotal
5,652
5,8495,9295,9996,207
Kadar penembusanper 100 isi rumahPenetration rate
per 100 households
73.3
75.476.276.879.0
Bukan isi rumahNon household
(‘000)
167
171176178202
Bilangan langgananNumber of subscriptions
(%)
54
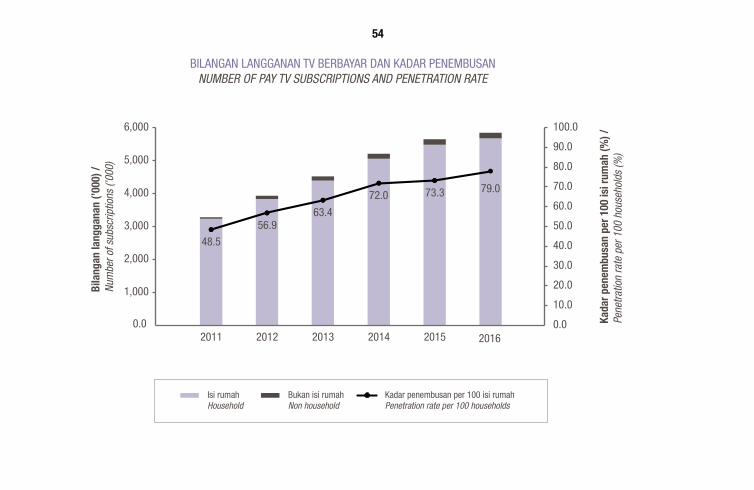
48.5
56.963.4
72.0 73.3 79.0
0.0
10.0
20.0
30.0
40.0
50.0
60.0
70.0
80.0
90.0
100.0
1,000
2,000
3,000
4,000
5,000
6,000
2011 2012 2013 2014 2015 2016
Isi rumahHousehold
Bukan isi rumahNon household
Kadar penembusan per 100 isi rumahPenetration rate per 100 households
Bila
ngan
lang
gana
n (’0
00) /
Num
ber o
f sub
scrip
tions
('00
0)
Kada
r pen
embu
san
per 1
00 is
i rum
ah (%
) /Pe
netra
tion
rate
per
100
hou
seho
lds
(%)
BILANGAN LANGGANAN TV BERBAYAR DAN KADAR PENEMBUSANNUMBER OF PAY TV SUBSCRIPTIONS AND PENETRATION RATE
0.0
55
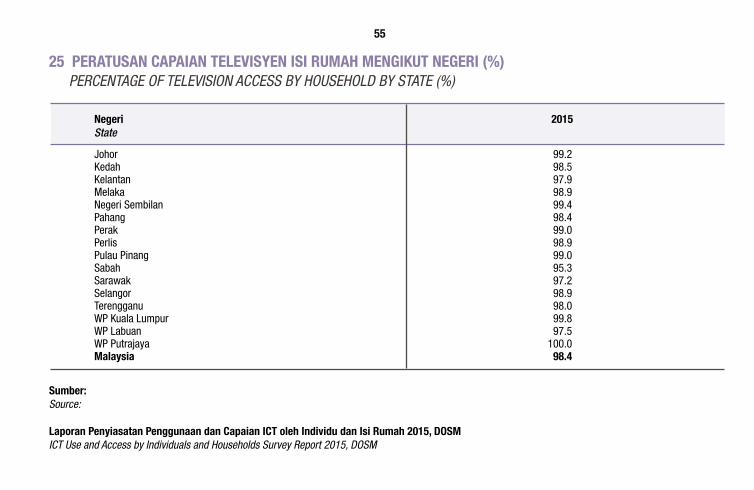
25 PERATUSAN CAPAIAN TELEVISYEN ISI RUMAH MENGIKUT NEGERI (%) PERCENTAGE OF TELEVISION ACCESS BY HOUSEHOLD BY STATE (%)
JohorKedahKelantanMelakaNegeri SembilanPahangPerakPerlisPulau PinangSabah SarawakSelangorTerengganuWP Kuala LumpurWP LabuanWP PutrajayaMalaysia
NegeriState
Sumber: Source:
Laporan Penyiasatan Penggunaan dan Capaian ICT oleh Individu dan Isi Rumah 2015, DOSMICT Use and Access by Individuals and Households Survey Report 2015, DOSM
99.298.597.998.999.498.499.098.999.095.397.298.998.099.897.5
100.098.4
2015
56
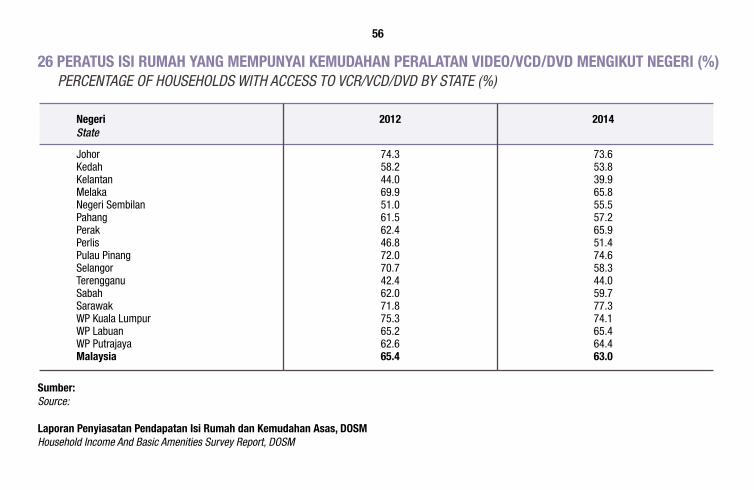
74.358.244.069.951.061.562.446.872.070.742.462.071.875.365.262.665.4
JohorKedahKelantanMelakaNegeri SembilanPahangPerakPerlisPulau PinangSelangorTerengganuSabahSarawakWP Kuala LumpurWP LabuanWP PutrajayaMalaysia
26 PERATUS ISI RUMAH YANG MEMPUNYAI KEMUDAHAN PERALATAN VIDEO/VCD/DVD MENGIKUT NEGERI (%) PERCENTAGE OF HOUSEHOLDS WITH ACCESS TO VCR/VCD/DVD BY STATE (%)
NegeriState
Sumber: Source:
Laporan Penyiasatan Pendapatan Isi Rumah dan Kemudahan Asas, DOSMHousehold Income And Basic Amenities Survey Report, DOSM
2012
73.653.839.965.855.557.265.951.474.658.344.059.777.374.165.464.463.0
2014
57
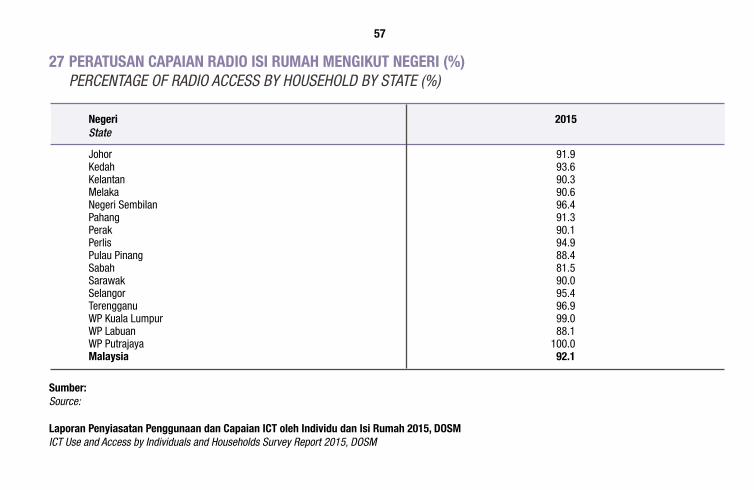
91.993.690.390.696.491.390.194.988.481.590.095.496.999.088.1
100.092.1
JohorKedahKelantanMelakaNegeri SembilanPahangPerakPerlisPulau PinangSabah SarawakSelangorTerengganuWP Kuala LumpurWP LabuanWP PutrajayaMalaysia
27 PERATUSAN CAPAIAN RADIO ISI RUMAH MENGIKUT NEGERI (%) PERCENTAGE OF RADIO ACCESS BY HOUSEHOLD BY STATE (%)
NegeriState
Sumber: Source:
Laporan Penyiasatan Penggunaan dan Capaian ICT oleh Individu dan Isi Rumah 2015, DOSMICT Use and Access by Individuals and Households Survey Report 2015, DOSM
2015

58
Muka surat ini sengaja dibiarkan kosongThis page is intentionally left blank
58
59
TANDATANGAN DIGITALDIGITAL SIGNATURE
59
60
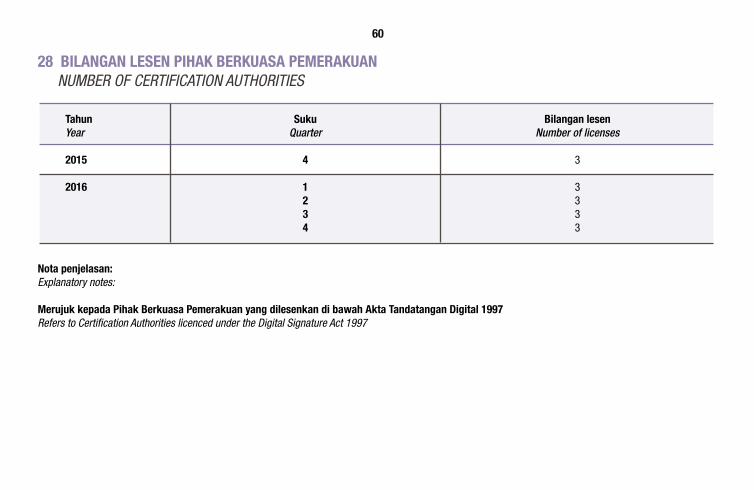
28 BILANGAN LESEN PIHAK BERKUASA PEMERAKUAN NUMBER OF CERTIFICATION AUTHORITIES
Nota penjelasan: Explanatory notes: Merujuk kepada Pihak Berkuasa Pemerakuan yang dilesenkan di bawah Akta Tandatangan Digital 1997 Refers to Certification Authorities licenced under the Digital Signature Act 1997
TahunYear
2015
2016
SukuQuarter
4
1234
Bilangan lesenNumber of licenses
3
3333
61
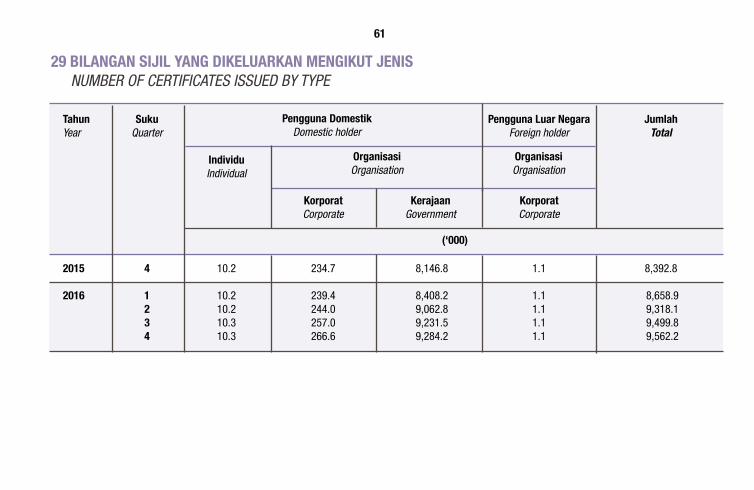
KerajaanGovernment
8,146.8
8,408.2 9,062.8 9,231.5 9,284.2
KorporatCorporate
234.7
239.4244.0257.0266.6
IndividuIndividual
10.2
10.210.210.310.3
29 BILANGAN SIJIL YANG DIKELUARKAN MENGIKUT JENIS NUMBER OF CERTIFICATES ISSUED BY TYPE
TahunYear
2015
2016
SukuQuarter
4
1234
Pengguna DomestikDomestic holder
(‘000)
OrganisasiOrganisation
Pengguna Luar NegaraForeign holder
KorporatCorporate
1.1
1.11.11.11.1
OrganisasiOrganisation
JumlahTotal
8,392.8
8,658.9 9,318.1 9,499.8 9,562.2

62
Muka surat ini sengaja dibiarkan kosongThis page is intentionally left blank
62
63
KEDUDUKAN MALAYSIADALAM INDEKS BERKAITAN ICT MALAYSIA RANKING FOR ICT RELATED INDICES
63
64
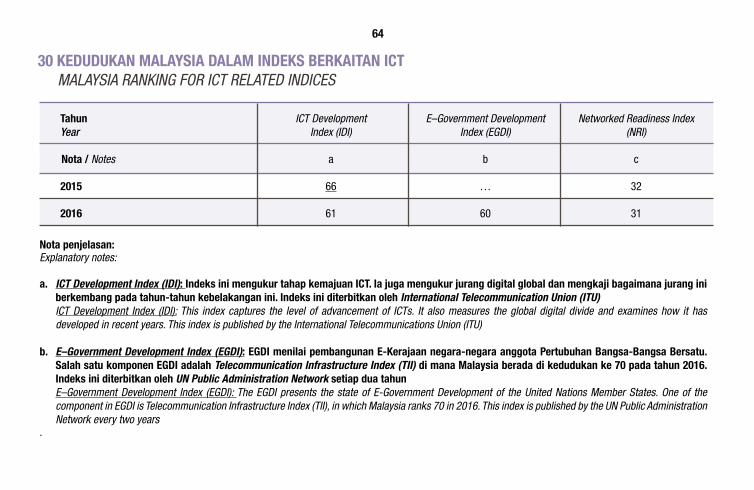
30 KEDUDUKAN MALAYSIA DALAM INDEKS BERKAITAN ICT MALAYSIA RANKING FOR ICT RELATED INDICES
TahunYear
Nota / Notes
2015
2016
ICT Development Index (IDI)
a
66
61
E–Government Development Index (EGDI)
b
…
60
Networked Readiness Index (NRI)
c
32
31
Nota penjelasan: Explanatory notes: a. ICT Development Index (IDI): Indeks ini mengukur tahap kemajuan ICT. Ia juga mengukur jurang digital global dan mengkaji bagaimana jurang ini
berkembang pada tahun-tahun kebelakangan ini. Indeks ini diterbitkan oleh International Telecommunication Union (ITU) ICT Development Index (IDI): This index captures the level of advancement of ICTs. It also measures the global digital divide and examines how it has
developed in recent years. This index is published by the International Telecommunications Union (ITU)
b. E–Government Development Index (EGDI): EGDI menilai pembangunan E-Kerajaan negara-negara anggota Pertubuhan Bangsa-Bangsa Bersatu. Salah satu komponen EGDI adalah Telecommunication Infrastructure Index (TII) di mana Malaysia berada di kedudukan ke 70 pada tahun 2016. Indeks ini diterbitkan oleh UN Public Administration Network setiap dua tahun
E–Government Development Index (EGDI): The EGDI presents the state of E-Government Development of the United Nations Member States. One of the component in EGDI is Telecommunication Infrastructure Index (TII), in which Malaysia ranks 70 in 2016. This index is published by the UN Public Administration Network every two years
.
65
c. Networked Readiness Index (NRI): NRI mengukur keupayaan negara mengeksploitasikan peluang-peluang yang disediakan oleh ICT. Indeks ini telah disusun untuk 139 ekonomi oleh World Economic Forum
Networked Readiness Index (NRI): NRI measures the propensity for countries to exploit the opportunities offered by ICT. The index has been compiled for 139 economies by World Economic Forum
66
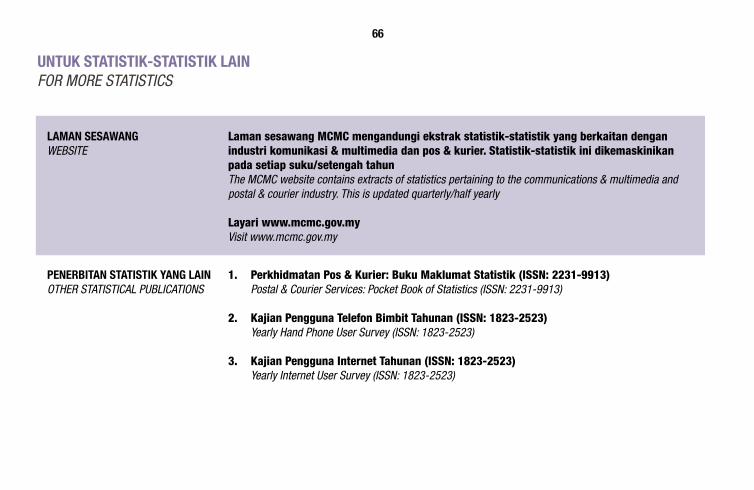
UNTUK STATISTIK-STATISTIK LAINFOR MORE STATISTICS
Laman sesawang MCMC mengandungi ekstrak statistik-statistik yang berkaitan dengan industri komunikasi & multimedia dan pos & kurier. Statistik-statistik ini dikemaskinikan pada setiap suku/setengah tahunThe MCMC website contains extracts of statistics pertaining to the communications & multimedia and postal & courier industry. This is updated quarterly/half yearly
Layari www.mcmc.gov.myVisit www.mcmc.gov.my
LAMAN SESAWANGWEBSITE
1. Perkhidmatan Pos & Kurier: Buku Maklumat Statistik (ISSN: 2231-9913) Postal & Courier Services: Pocket Book of Statistics (ISSN: 2231-9913)
2. Kajian Pengguna Telefon Bimbit Tahunan (ISSN: 1823-2523) Yearly Hand Phone User Survey (ISSN: 1823-2523) 3. Kajian Pengguna Internet Tahunan (ISSN: 1823-2523) Yearly Internet User Survey (ISSN: 1823-2523)
PENERBITAN STATISTIK YANG LAINOTHER STATISTICAL PUBLICATIONS
67
JABATAN STATISTIKSTATISTICS DEPARTMENT
Sila hubungi Jabatan Statistik MCMC sekiranya anda mempunyai pertanyaan yang berkaitan dengan statistik-statistik yang diterbitkan oleh MCMC di alamat e-mel berikut:Please contact the Statistics Department MCMC if you have any queries regarding the statistics published by MCMC at the following email address:
HUBUNGICONTACTS

68
Muka surat ini sengaja dibiarkan kosongThis page is intentionally left blank

69
Muka surat ini sengaja dibiarkan kosongThis page is intentionally left blank

70
Muka surat ini sengaja dibiarkan kosongThis page is intentionally left blank

71
72
2016
RM
Suruhanjaya Komunikasi dan Multimedia MalaysiaMalaysian Communications and Multimedia Commission
MCMC Tower 1, Jalan IMPACT, Cyber 663000 Cyberjaya, Selangor Darul Ehsan, MalaysiaTel: +603 8688 8000 Fax: +603 8688 1000Website : www.mcmc.gov.my
COMMUNICATIONS AND MULTIMEDIA
KOMUNIKASI DAN MULTIMEDIA
Pocket Book of Statistics
SPECIAL EDITIONEDISI KHAS
Buku Maklumat Statistik