cheng chin tiongeprints.utm.my/id/eprint/79104/1/chengchintiongpfght2017.pdf · kaedah pengiraan...
TRANSCRIPT
METHODOLOGICAL ENHANCEMENT OF HEDONIC PRICE INDEX IN
MALAYSIA
CHENG CHIN TIONG
UNIVERSITI TEKNOLOGI MALAYSIA
METHODOLOGICAL ENHANCEMENT OF HEDONIC PRICE INDEX IN
MALAYSIA
CHENG CHIN TIONG
A thesis submitted in fulfilment of the
requirement for the award of the degree of
Doctor of Philosophy (Real Estate)
Faculty of Geoinformation and Real Estate
Universiti Teknologi Malaysia
JULY 2017

iii
DEDICATION
“ This thesis is dedicated to my parents for their endless support and encouragement”

iv
ACKNOWLEDGEMENT
Firstly, I would like to express my sincere gratitude to my advisor Assoc Prof.
Dr. Janice Lee Yim Mei and Prof. Dr. Hishamuddin Bin Mohd Ali for the continuous
support of my Ph.D study and related research, for their patience, motivation, and
immense knowledge. Their guidance helped me in all the time of research and
writing of this thesis. I could not have imagined having a better advisor and mentor
for my Ph.D study.
Besides my advisor, I would like to thank the rest of my thesis committee:
Prof. Dr. Alias Bin Abdul Rahman, Prof. Dr. Md Nasir Bin Daud, and Assoc. Prof.
Dr. Ibrahim @ Atan Bin Sipan, and Dr. Rohaya Binti Abdul Jalil for their insightful
comments and encouragement, but also for the hard question which incented me to
widen my research from various perspectives.
I gratefully acknowledge the funding received towards my PhD from the
Mybrain 15 programme of Higher Education Ministry Malaysia. Moreover, I would
like to thank Universiti Teknologi Malaysia and Faculty of Geoinformation and Real
Estate who gave me access to the laboratory and research facilities. Without their
precious support it would not be possible for me to conduct this research.
Last but not the least, I would like to thank my family and my friends for
supporting me spiritually throughout writing this thesis in general.
v
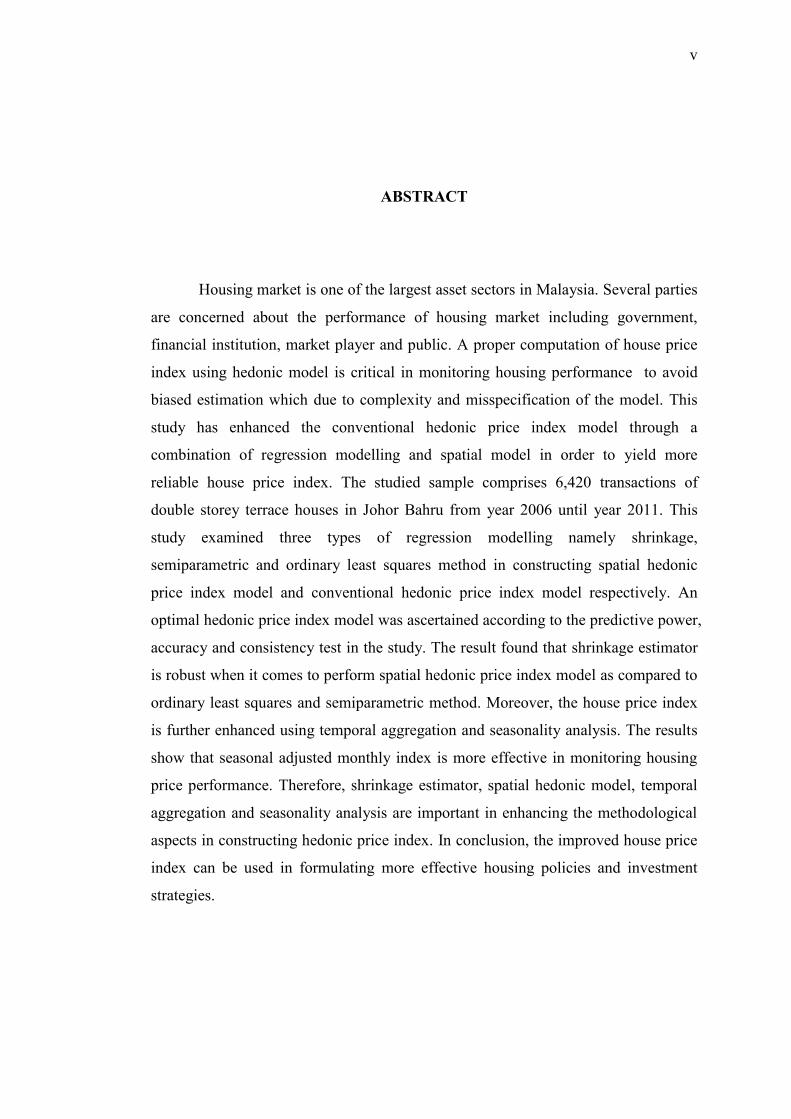
ABSTRACT
Housing market is one of the largest asset sectors in Malaysia. Several parties
are concerned about the performance of housing market including government,
financial institution, market player and public. A proper computation of house price
index using hedonic model is critical in monitoring housing performance to avoid
biased estimation which due to complexity and misspecification of the model. This
study has enhanced the conventional hedonic price index model through a
combination of regression modelling and spatial model in order to yield more
reliable house price index. The studied sample comprises 6,420 transactions of
double storey terrace houses in Johor Bahru from year 2006 until year 2011. This
study examined three types of regression modelling namely shrinkage,
semiparametric and ordinary least squares method in constructing spatial hedonic
price index model and conventional hedonic price index model respectively. An
optimal hedonic price index model was ascertained according to the predictive power,
accuracy and consistency test in the study. The result found that shrinkage estimator
is robust when it comes to perform spatial hedonic price index model as compared to
ordinary least squares and semiparametric method. Moreover, the house price index
is further enhanced using temporal aggregation and seasonality analysis. The results
show that seasonal adjusted monthly index is more effective in monitoring housing
price performance. Therefore, shrinkage estimator, spatial hedonic model, temporal
aggregation and seasonality analysis are important in enhancing the methodological
aspects in constructing hedonic price index. In conclusion, the improved house price
index can be used in formulating more effective housing policies and investment
strategies.
vi
ABSTRAK
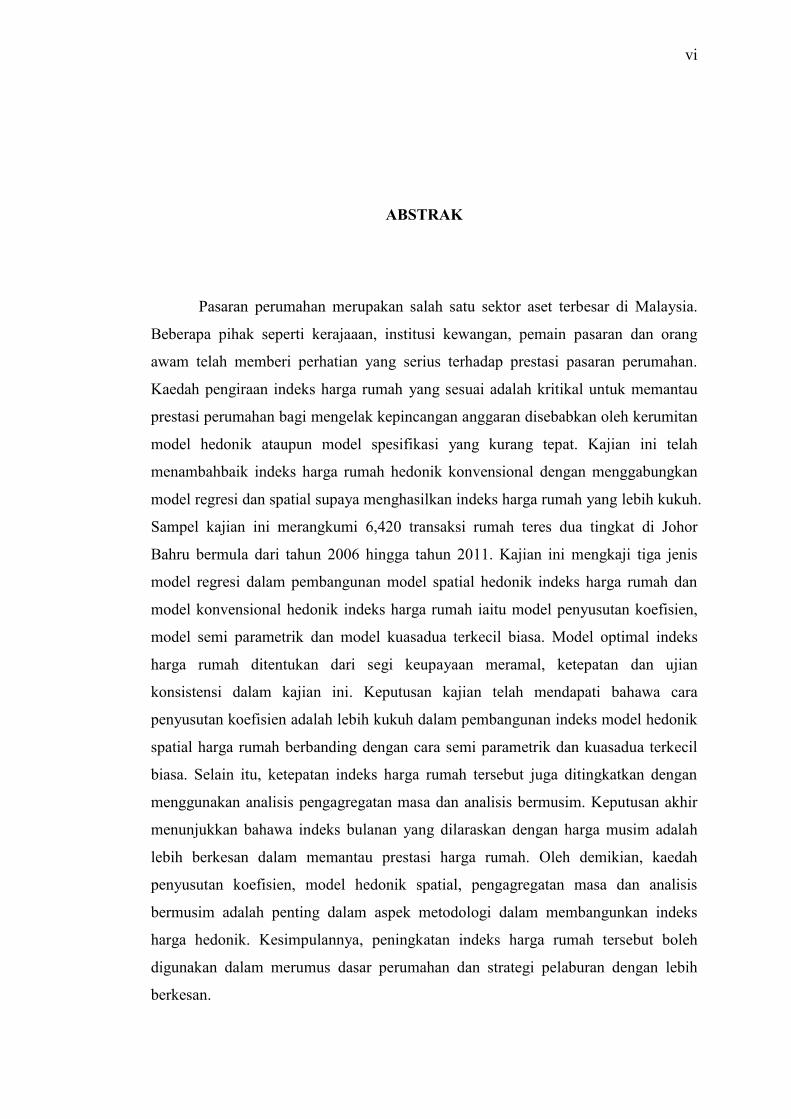
Pasaran perumahan merupakan salah satu sektor aset terbesar di Malaysia.
Beberapa pihak seperti kerajaaan, institusi kewangan, pemain pasaran dan orang
awam telah memberi perhatian yang serius terhadap prestasi pasaran perumahan.
Kaedah pengiraan indeks harga rumah yang sesuai adalah kritikal untuk memantau
prestasi perumahan bagi mengelak kepincangan anggaran disebabkan oleh kerumitan
model hedonik ataupun model spesifikasi yang kurang tepat. Kajian ini telah
menambahbaik indeks harga rumah hedonik konvensional dengan menggabungkan
model regresi dan spatial supaya menghasilkan indeks harga rumah yang lebih kukuh.
Sampel kajian ini merangkumi 6,420 transaksi rumah teres dua tingkat di Johor
Bahru bermula dari tahun 2006 hingga tahun 2011. Kajian ini mengkaji tiga jenis
model regresi dalam pembangunan model spatial hedonik indeks harga rumah dan
model konvensional hedonik indeks harga rumah iaitu model penyusutan koefisien,
model semi parametrik dan model kuasadua terkecil biasa. Model optimal indeks
harga rumah ditentukan dari segi keupayaan meramal, ketepatan dan ujian
konsistensi dalam kajian ini. Keputusan kajian telah mendapati bahawa cara
penyusutan koefisien adalah lebih kukuh dalam pembangunan indeks model hedonik
spatial harga rumah berbanding dengan cara semi parametrik dan kuasadua terkecil
biasa. Selain itu, ketepatan indeks harga rumah tersebut juga ditingkatkan dengan
menggunakan analisis pengagregatan masa dan analisis bermusim. Keputusan akhir
menunjukkan bahawa indeks bulanan yang dilaraskan dengan harga musim adalah
lebih berkesan dalam memantau prestasi harga rumah. Oleh demikian, kaedah
penyusutan koefisien, model hedonik spatial, pengagregatan masa dan analisis
bermusim adalah penting dalam aspek metodologi dalam membangunkan indeks
harga hedonik. Kesimpulannya, peningkatan indeks harga rumah tersebut boleh
digunakan dalam merumus dasar perumahan dan strategi pelaburan dengan lebih
berkesan.
vii
TABLE OF CONTENTS
CHAPTER TITLE PAGE
DECLARATION ii
DEDICATION iii
ACKNOWLEDGEMENT iv
ABSTRACT v
ABSTRAK vi
TABLE OF CONTENTS vii
LIST OF TABLES xii
LIST OF FIGURES xiv
LIST OF ABBREVIATIONS xv
LIST OF APPENDIX xvii
1 INTRODUCTION 1
1.1 Background of Study 1
1.2 Problem Statements 4
1.3 Research Questions 10
1.3.1 Research Objectives 10
1.4 Scope and Limitation of Study 11
1.5 Significance of Study 11
1.6 Research Framework 12
1.7 Thesis Structure 14
viii
2 HOUSE PRICE INDEX CONSTRUCTION METHODS 16
2.1 Introduction 16
2.2 Price Index as Economy Indicator 16
2.3 House Price Index 17
2.4 Price Index Formula 19
2.4.1 Laspeyres Price Index 19
2.4.2 Paasche Price Index 20
2.4.3 Fisher Ideal Index 20
2.5 Housing Index Construction Method 21
2.5.1 Simple mean or Median Method 21
2.5.1.1 Mean 21
2.5.1.2 Median 22
2.5.2 Stratification (Mix Adjustment) 22
2.5.3 Repeat Sales Method 23
2.5.4 Appraisal Based Method 25
2.5.5 Hedonic Regression Method 25
2.5.1.1 Hedonic Model 26
2.5.1.2 Hedonic Time Variable 27
Method
2.5.1.3 Characteristic Price Approach 27
2.5.1.4 Hedonic Imputation Method 28
2.6 Strength and Weakness of House Price Index
Construction Method 29
2.7 Types of Hedonic Regression Methods 37
2.8 Practical Issues in Hedonic Regression Methods 40
2.9 Index Construction Method Used By Official
Index Provider 42
2.9.1 Malaysian House Price Index (MHPI) 43
2.10 Hedonic Modeling 44
2.10.1 Hedonic Variables of Malaysian Hedonic 51
Price Index Model
2.11 Summary 52
ix
3 OPTIMIZATION OF HEDONIC HOUSE PRICE
INDEX 54
3.1 Introduction 54
3.2 Hedonic House Price Index Improvement 54
3.3 Past Studies of Housing Index Improvement 57
3.4 Application of Spatial Econometric 61
3.4.1 Spatial Dependence 61
3.4.2 Spatial Heterogeneity 62
3.4.3 Spatial Autoregressive Model 63
3.4.3.1 First Order Spatial AR model 63
3.4.3.2 The Mixed Autoregressive
Regressive Model 64
3.4.3.3 The Spatial Autoregressive
Error Model 64
3.4.3.4 The Spatial Durbin Model 65
3.4.3.5 The General Spatial Model 65
3.4.4 Trend Surface Analysis and Spatial 66
Correlation
3.4.1.1 The Construction of Spatial
Hedonic Price Index Model
Using Trend Surface Analysis 68
3.5 Multivariate Regression Analysis for
Hedonic Model 69
3.5.1 The Unbiasness of OLS 69
3.5.2 The Variance of OLS Estimator 70
3.6 Semiparametric Regression 71
3.6.1 Application of Semiparametric Regression
In Formulating Spatial Hedonic Model 73
3.7 Spatial Autoregressive Model, Trend Surface
Analysis Model and Semiparametric Bivariate
Smoothing Model for Constructing Spatial Hedonic
Model 77
3.8 The Understanding of Bias and Variance 78
3.9 Shrinkage Estimation 78
3.9.1 Stein Rule Estimation 80
x
3.9.2 Application Stein Rule Estimation in
Hedonic Model 81
3.9.3 Shrinkage Estimator Using Ledoit_Wolf
Theoram 83
3.9.3.1 Variance Shrinkage 84
3.9.3.2 Correlation Shrinkage 85
3.10 Types of Estimator in Developing Housing Index 86
3.11 Seasonality Analysis 87
3.11.1 Seasonal Adjustment 88
3.11.2 Centered Moving Average 88
3.11.3 Seasonal Index 88
3.12 Seasonal Pattern and Buying Behavior 89
3.13 Temporal Aggregation 90
3.13.1 Analysis of Variance 91
3.14 Conclusion 93
4 RESEARCH METHODOLOGY 98
4.1 Introduction 98
4.2 Study Area 98
4.3 Data Collection 100
4.4 Selected Variables 101
4.5 Data Management 102
4.6 Data Quantification 105
4.7 The Flow Chart of Obtaining Methodological
Enhancement of House Price Index 107
4.8 The Process of Obtaining Methodological
Enhancement of House Price Index 108
4.9 Summary 117
5 DATA ANALYSIS 118
5.1 Introduction 118
5.2 Hedonic Model 119
5.3 Housing Performance of Double Storey Terrace
House 122
xi
5.4 Predictive Power of Hedonic Price Index Model 126
5.5 Level of Index Revision 130
5.6 Accuracy of House Price Index 133
5.7 The Selection of Robust Hedonic Price Index
Model 137
5.8 Temporal Aggregation Analysis 139
5.8.1 House Price Index with Different Level
Level of Temporal Aggregation 139
5.8.2 Analysis of Variance (ANOVA) 141
5.8.3 Performance of House Price Index 142
5.9 Seasonality of House Price Index 144
5.9.1 Seasonality Analysis 145
5.10 Seasonal Adjustment 146
5.11 Conclusion 149
6 CONCLUSION AND RECOMMENDATION 151
6.1 Introduction 151
6.2 Research Summary and Findings 151
6.3 Research Contribution 153
6.4 Limitation and Further Research 158
6.5 Conclusion 160
REFERENCES 161
Appendices A-N 173-308
xii
LIST OF TABLES
TABLE NO. TITLE PAGE
2.1 Summary on House Price Index Construction Method 34
2.2 Summary Hedonic Regression Methods 37
2.3 Index Construction Method Used By Several Countries 43
2.4 Hedonic House Price Index Model 45
2.5 Past Development of Hedonic Models in Malaysia 49
4.1 Types of Data 100
4.2 Selected Variables 101
4.3 Summary of Final Dataset 103
4.4 Description on Data Quantification 106
5.1 Regression Analysis of Spatial Hedonic Model 120
5.2 Descriptive Statistics of Hedonic Price Index 123
5.3 The MAPE of Hedonic Price Index Model 127
5.4 The Level of Index Revision of Hedonic Price Index Model 131
5.5 The Accuracy of Hedonic Price Index Model 131
5.6 Ranking for Each Hedonic Price Index Model 138
5.7 ANOVA of Temporal Aggregated House Price Indices 142
5.8 Housing Performance of Temporal Aggregated House Price
Indices 143

xiii
5.9 Regression Analysis of Seasonality Model 145
5.10 Comparison Between AHPI and NAHPI 148
xiv
LIST OF FIGURES
FIGURE NO. TITLE PAGE
1.1 Study Flow Chart 14
3.1 Trend Surface of Different Order 67
3.2 Shrinkage Intensity and Mean Squared Error 80
3.3 Optimization Methodology Flow Chart 94
4.1 Case Study 92
5.1 House Price Index of Double Storey Terrace House 124
5.2 Four Types of Temporal Aggregated House Price Index 136
5.3 Comparison Between Adjusted and Non Adjusted House Price
Index 147
xv
LIST OF ABBREVIATIONS
NAPIC - National Property Information Centre
MHPI - Malaysian House Price Index
OLS - Ordinary Least Square
SR - Stein Rule
ANOVA - Analysis of Variance
MAPE - Mean Absolute Percentage Error
VPSD - Valuation and Property Services Department
PCA - Principal Component Analysis
WRS - Weighted Repeat Sale
DTH - Hedonic Time Dummy
HIM - Hedonic Imputation
RLS - Restricted Least Squares
STAR - Spatiotemporal Autoregressive Model
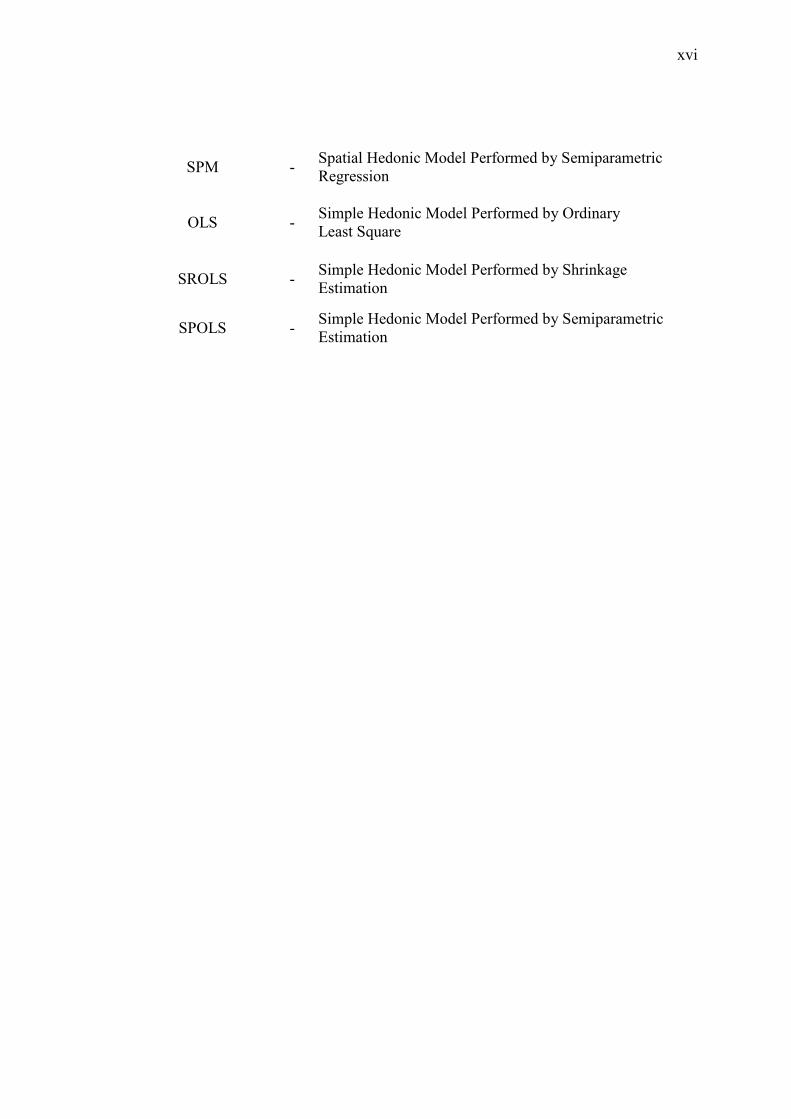
SHM - Spatial Hedonic Model Performed by Ordinary Least Square
SRSHM - Spatial Hedonic Model Performed by Shrinkage Estimation
xvi
SPM - Spatial Hedonic Model Performed by Semiparametric
Regression
OLS - Simple Hedonic Model Performed by Ordinary
Least Square
SROLS - Simple Hedonic Model Performed by Shrinkage
Estimation
SPOLS - Simple Hedonic Model Performed by Semiparametric
Estimation
xvii
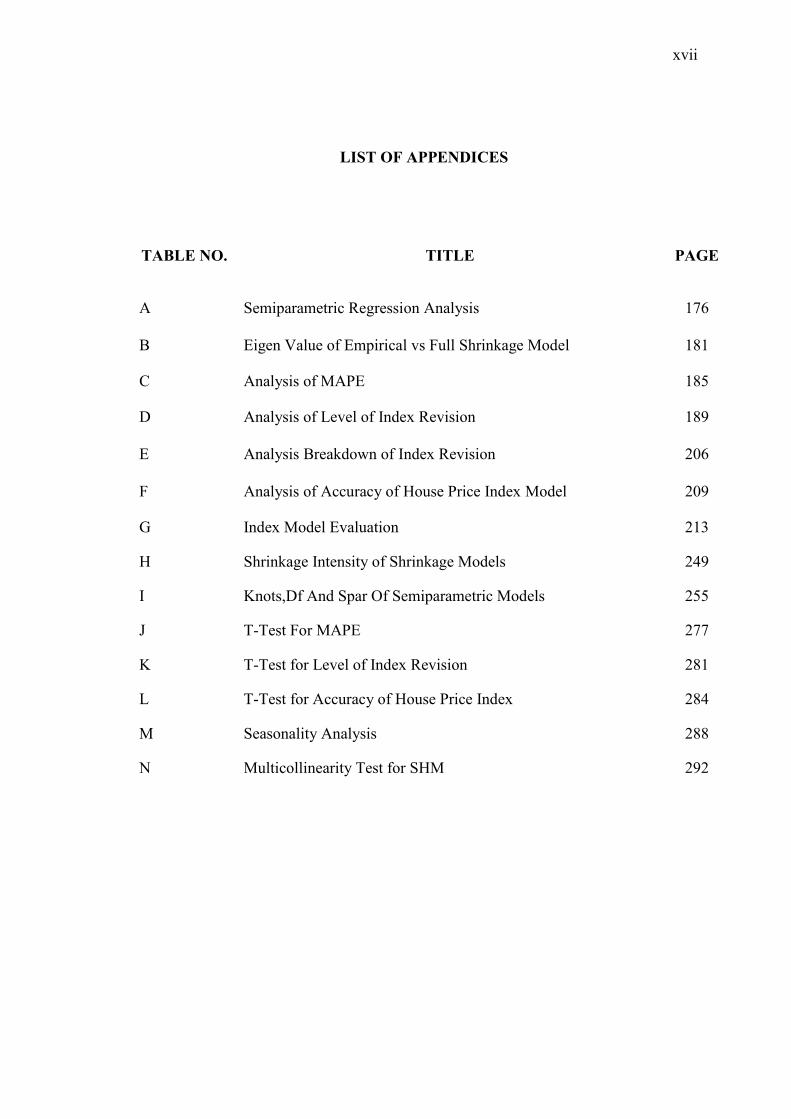
LIST OF APPENDICES
TABLE NO. TITLE PAGE
A Semiparametric Regression Analysis 176
B Eigen Value of Empirical vs Full Shrinkage Model 181
C Analysis of MAPE 185
D Analysis of Level of Index Revision 189
E Analysis Breakdown of Index Revision 206
F Analysis of Accuracy of House Price Index Model 209
G Index Model Evaluation 213
H Shrinkage Intensity of Shrinkage Models 249
I Knots,Df And Spar Of Semiparametric Models 255
J T-Test For MAPE 277
K T-Test for Level of Index Revision 281
L T-Test for Accuracy of House Price Index 284
M Seasonality Analysis 288
N Multicollinearity Test for SHM 292
CHAPTER 1
INTRODUCTION
1.1 Background of Study
Housing market is one of the largest asset sectors in Malaysia. Several parties
are concerned about the performance of housing market including government,
financial institution, market player and public. This is because the downtrend or
uptrend of housing performance will directly affect the decision making by those
parties. Therefore, house price index is an important indicator to measure housing
performance.
Rapid growth in property sector leads to the transformation of physical
property investment into financial products such as housing derivative or home
equity insurance. It stimulates the demand for more reliable, accurate, stable and
warrant house price index to measure performance (Venter, 2008; Ong and Ng,
2009). Clapham et al. (2006) also mentioned that instability in measuring price
movement is unfavourable to the development of markets for financial assets based
on housing index. Therefore, a reliable house price index is needed to assist such
development.
The heterogeneous characteristic of transacted properties in terms of locality
and structural characteristic is a challenge in developing a house price index.
Therefore, a quality adjustment should be considered in price index development.
Otherwise, the housing index could be misleading. According to de Haan and
Diewert (2011), the popular methods to develop house price index are repeat sales
2
method, hedonic regression method, mean/median mix adjustment method and
appraisal base method. Among these methods, repeat sales method and hedonic
regression method are most popular in constructing a quality adjusted price index.
The official house price index which adopted repeat sales method is Case-Shiller
Residential Price Index from United States. Meanwhile, Malaysian House Price
Index (Malaysia), Centa-City Index (Hong Kong), and Halifax House Price Index
(U.K) are using hedonic regression method to construct quality adjusted price index.
In comparing both repeat sales and hedonic regression the latter will be more
appropriate to be applied in Malaysia. The repeat sales method requires same
property to be transacted at least twice. In order to construct the price index it needs
more property transaction. Moreover, according to Clapham et al. (2006) hedonic
model is suitable to assist the development of housing derivatives index compared to
repeated sales and median index because it is less prone to index revision. Since
Malaysia is a developing country, it does not produce a big volume of property
transaction for each period of time. Therefore, the application of repeat sale method
is rather difficult for Malaysia. Hedonic regression method is the most appropriate
method for Malaysia to construct house price index. Hedonic regression method is
more flexible than other methods in term of constructing price index for specific
market because all historical property transaction information can be used to develop
house price index.
Although hedonic model can be used to construct house price index easily,
the econometric problems will affect the reliability of hedonic model. The
econometric problems consist of omitted variables bias, multicolinearity, overfitting,
and selection of functional form in a hedonic model. Therefore, the study towards
optimization of hedonic model is crucial for the development of a reliable house
price index for Malaysia. The application of spatial model, shrinkage and
semiparametric estimators for improving hedonic price model had been studied in
past research. However, it is lack of study in combining these applications to
improve hedonic house price index model. As Hoffmann and Lorenz (2006) say, “the
future will belong to hedonic indices”.
3
Apart from that, house price index can be represented in different temporal
aggregation level such as monthly, quarterly, semi-annually and annually. However,
higher level of temporal aggregation will lead to missing information on the
volatility of house price. In past, house price index is assumed to be smooth and less
risky because real estate is known as hedge against inflation (Hoesli, 1994). However,
the market sentiment at disaggregated periods such as monthly could be different. It
can yield the volatility of house price in short term. A low level of temporal
aggregated price index will unveil more information for improving decision making
of property market players. Malaysia house price index (MPHI) is constructed in
quarterly basis therefore it could lead to temporal aggregation problem and short
term volatility is neglected. As claimed by Ramirez (2012) disaggregated data and
models can enhance the accuracy of time series forecasting. Thus, temporal
disaggregated price index would be effective to assist the formulation of national
economic policy.
Besides, a house price index moves in a cyclical trend cannot be considered
as effect of macroeconomic or market forces. It is because the price change is due to
some events, festivals or seasons. Every country consists of different culture and
seasons that will impact on such trend. Therefore, seasonality analysis is necessary to
be conducted before releasing the price index to public. It is important for policy
maker to determine the actual movement of house price without the seasonal effect.
The seasonal pattern of the Malaysian house price index will mislead the
interpretation of house price movement. As mentioned by Harding et al. (2003) the
seasonal pattern is due to the bargaining power of buyer and seller. Seasonality
analysis is needed to unveil Malaysian property market behavior. The understanding
of property market behavior will help seller and buyer in obtaining good deal.
Thus, an optimal methodology is important because it can yield a reliable
house price index for decision making of various parties in real estate such as valuer,
developer, policy maker, investor and public.
4
1.2 Problem Statements
Malaysian House Price Index (MHPI) is an official price index for Malaysia
housing market since year 1997. The index construction method adopted by MHPI is
hedonic characteristics method and it is using Laspeyres index formula for price
index computation. Basically, it is a simple hedonic model that consists of housing
attributes and neighborhood information. The hedonic price index model is estimated
through ordinary least square (OLS). In addition, it is a quarterly house price index
without seasonal adjustment.
The hedonic characteristics method is an unconstrained hedonic model which
required two separate hedonic models to compute price index. According to
Schwann (1998) this method needs at least 32 observations to compute a viable
model. Therefore, the hedonic characteristics method will need at least 64
observations to compute a house price index. It is a major weakness of this method
because it could hamper the development of house price index for thin market due to
insufficiency of observations. It would make the prediction becomes inaccurate due
to overfitting and multicollinear problems. Therefore, hedonic time dummy method
(single hedonic price index model) is more efficient than hedonic characteristic
method (two separate hedonic price index model) in computing hedonic price index
model.
Moreover, Hill (2012) claimed that the incorporation of geospatial data in
hedonic characteristics model is rather vague. It is because this model will require
average attributes to be substituted into the model such as average land size and etc.
However, the definition of average location is ambiguous since the housing location
is the composition of geo-coordinates x and y. The average value of x and y is not
equal to average location. The situation becomes worse if the location of base period
model (0) and respective period model (t) are totally different. The computed price
index could be misleading. Hence, hedonic time dummy method is more flexible
than hedonic characteristics in forming a spatial hedonic model using geospatial data.
A spatial hedonic model is important to overcome the issue of spatial autocorrelation
and spatial dependences as mentioned in previous research.
5
Therefore, hedonic time dummy is more suitable than hedonic characteristic
method for constructing Malaysian house price index due to simplicity and flexibility.
However, hedonic model will encounter econometric problems and it should be
mitigated in order to yield a better model. In case of hedonic model, omitted
variables bias is likely to happen if significant parameters are not included in a model.
It can lead to large variance in the model and the predictive power becomes weak.
According to previous research, the significant parameters for house price model are
structural characteristics such as land area, built up area and number of bedroom.
Besides, location is one of the important elements which affects the housing value
due to maturity of neighbourhood. “Location!, Location!, Location!” which is often
mentioned in real estate appraisal. A house in an urban area will definitely fetch
higher value than a house in a suburban area. The location variables or geospatial
data can be collected in the form of coordinates. If the geospatial data are not
included in the model it would lead to spatial dependences and spatial heterogeneity
problem and the predictive power of the hedonic model becomes poor.
Hill (2013) claimed that most of the researchers are using geospatial data to
model housing market rather than developing housing index. The official house price
indices that included geospatial data in hedonic price index model are limited such as
FNC Residential Price Index and RPData-Rismark Daily Home Value Index.
Furthermore, the adoption of geospatial data in hedonic price index model is given
less attention by academic research (Schwann, 1998; Clapham et al., 2006;
Wilhelmsson, 2009; Ericson et al., 2013). Although previous research (Can and
Megbolugbe, 1997; Clapp, 2004; Sun et al., 2005; Liu, 2013) adopt various spatial
hedonic models to compute house price index, the strength of spatial hedonic price
index is not clearly highlight in their study. Moreover, their research are similar to
the previous research of hedonic pricing model (Pace et al., 1998; Gelfand et al.,
2003; Daria, 2007; Liu, 2013). Although spatial hedonic price index model
outperforms simple hedonic price index model in term of predictive power, the
differences between both indices are still questionable. As mentioned by Song and
Wilhelmsson (2010), the relationship between predictive power of price index model
and price index movement is unclear.
6
In Malaysia, it is lack of academic research in constructing house price index
using spatial hedonic price index model (Afiqah et al., 2012; Lizam et al., 2013) as
compared to hedonic pricing model (Ismail et al., 2009; Maimun, 2011; Ismail and
Yusof, 2012). The main advantage of spatial hedonic price index model is still
unclear. Malaysian house price index has tried to avoid spatial heterogeneity by
using a defined neighborhood. However, Fik et al. (2003) claimed that it is hard to
define the boundary with little knowledge of neighborhood. Thus, spatial model
(using geocoordinates x,y as location variable) is better than aspatial model (using
neighborhood as location variable).
The existence of collinearity problem in hedonic model can adversely affect
the reliability of hedonic model and lead to overfitting issue. This problem will
produce high value of R-squared. However, the predictive power is weak. Although
hedonic model is flexible to include all quality adjusted elements, it will increase the
complexity of the model. High complexity of model will induce extremely large
error. It becomes worst if number of variables (p) is larger than sample size (n).
Therefore, it will hamper the development of spatial hedonic model if the number of
transacted property is thin. It is because inclusion of geospatial data will make the
model becomes lengthy and complex especially a polynomial form of spatial hedonic
model (Fik et al., 2003; Clapp, 2004). Generally, total error of model is composition
of bias and variance. Although high complexity has less bias, it will increase the
variance of the model simultaneously. Therefore, an optimum composition between
bias and variance should be taken into consideration in computing a model. In order
to calibrate an optimum spatial hedonic price index model, shrinkage estimation is
recommended to be adopted in this study (Bao and Wan, 2007).
In previous study, Bao and Wan (2007) used stein rule estimation (SR) to
perform a hedonic price model. SR estimator is a form of shrinkage estimation that
employs a weighted average of OLS and restricted least square (RLS) estimator. The
result found that SR estimation can overcome the collinear problem because it has
enhanced the predictive mean square error (MSE) of house price model. In addition,
a similar result is found in other related research (Knight and Hill, 1992; Knight and
Hill, 1993; Namba and Ohtani, 2012). In past studies, most of the hedonic models
7
used to construct index through OLS estimation (Costello and Watkins, 2002;
Clapham et al., 2006; Goh et al., 2012). Furthermore, Schafer and Strimmer (2005)
and Opgen-Rhein and Strimmer (2007) found that shrinkage estimation
(Ledoit_Wolf theorem) is applicable for bioinformatics model using small sample
size (n) and larger number of variables (p). The result shows that shrinkage
estimation outperforms OLS in term of mean square error. Therefore, it is useful for
the development of hedonic price index model using small sample (n) and larger
number of variables (p). The application of shrinkage estimation for strengthening
the reliability of spatial hedonic price index model is deem to be feasible.
Moreover, functional form misspecification would affect on the accuracy of
hedonic model in predicting housing index. According to Bao and Wan (2004) if
wrong functional form is selected to compute hedonic model the validity of
interpreting the estimated parameters will be highly questionable. Generally, semi-
log is a famous functional form proposed by Box and Cox (1964) and widely used in
constructing housing index (Goodman, 1978; Halvorsen and Pollakowski, 1981;
Maurer et al., 2004; Clapham et al., 2006; Widlak and Tomczyk, 2010).
Unfortunately, Coulson et al (2008) claimed that semi-log model could expose to the
risk of functional form misspecification.
Breiman (2001) point out that semiparametric and non parametric approaches
are representative of algorithmic modelling culture. Both methods are suitable for
many hedonic modelling situations where incomplete knowledge prevents the exact a
priori specification of non linear or non stationary components of functional form
(Hannonen, 2006). Song and Wilhelmsson (2010) mentioned that more research are
needed in order to gain a better insight into the art of specifying the functional form
of hedonic equation.
Some past studies claimed that nonparametric or semiparametric method
better than parametric models in term of out of sample prediction (Messe and
Wallace, 1991; Pace, 1993; Pavlov, 2000; Clapp, 2004). However, as mentioned by
Hill (2013) there is lack of discussion on nonparametric method in constructing
housing index. Clapp (2004) has applied semiparametric in developing house price
8
index model. The result shown that, semiparametric methods reduce out of sample
mean squared error by 11% as compared to the OLS. In Malaysia, due to lack of
study in this area the application of semiparametric or non parametric in hedonic
price index model is still questionable. Therefore, a semiparametric type of hedonic
price index model is another possible study suggested by Bao and Wan (2004).
The predictive power is a common method to evaluate the reliability of house
price model in most of the research. In fact, the relationship between predictive
power of hedonic price index model and house price movement is rather vague. For
example, Song and Wilhelmsson (2010) claimed that although the predictive power
enhanced by spatial hedonic price index model, it does not affect the house price
index of condominium significantly. Furthermore, some research emphasize the
consistency of price index (Clapham et al., 2006; Baroni et al., 2008; Deng and
Quigley, 2008) because the index revision can make the settlement of future
contracts based on housing index becomes less precise. Hence, it is necessary to
revisit the methods for evaluating hedonic house price index.
In addition, temporal aggregation should be considered in constructing
housing index. The Malaysian house price index (MHPI) is constructed in every
quarter. Therefore, it could lead to the problem of temporal aggregation. This is
because temporal aggregation will affect the specification models, estimation of
parameters and efficiency of forecasting (Brewer and Kenneth, 1973; Wei, 1979).
Furthermore, it may induce bias in risk and return of real estate return and housing
index. Geltner (1993) found that temporal aggregation will lead to smooth and
erroneously eliminate noise in house price movements. As a result, the house price
movements become less risky and the volatility of house price is understated which
may not be true. Geltner (1993) also mentioned that temporal aggregated price index
will hamper seasonality analysis of house price movement. For instance, the price
movements of January, February and March are assumed to be equal and Owusu-
Ansah (2013) claimed that this assumption is questionable since the supply and
demand of housing market is changing over time.
9
The arguments toward temporal aggregation problem of house price index are
highlighted in some previous studies. Calhoun et al. (1995) found that temporal
aggregation smooths price variability across time because spot values are averaged
over time with empirical study. In contrast to Englund et al. (1999) and Owusu-
Ansah (2013) they claimed that the differences of returns and volatilities among
different level of temporal aggregation are small. Moreover, according to Calhoun et
al. (1995) temporal aggregation is one of the factors to be considered in constructing
housing derivatives. Therefore, it is necessary to investigate the importance of
temporal disaggregated price index using Malaysian case study.
Seasonality is one of the factors to be considered for constructing house price
index. Schweser (2011) defined seasonality as a pattern that tends to repeat from one
period to another. Seasonality will have temporary effect on house price movement.
In past, Rosen (1979) mentioned that some factors such as household moving pattern,
marriages and family formation rates contribute to housing seasonality. Miller et al.
(2012) claimed that seasonality problem will happen if the transaction based on a
number of factors common to most households such as school cycles, weather, or
holidays. However, seasonality effect cannot be considered as real supply and
demand forces. Therefore, the seasonal pattern of house price index should be
seasonal adjusted in order to reflect the real performance of housing market.
Miller et al. (2012) has conducted an empirical study on seasonality which
covered 138 Core Based Statistical Areas across United States and they found that on
average home prices peak in June and hit the lowest value in January. Furthermore,
another study carried out by Kaplanski and Levy (2012) stated that house prices are
higher on average in the summer by 0.86% to 3.75%. Some past studies also indicate
the existence of seasonality in house price (Harris, 1989; Reichert, 1990; Karaganis,
2011). Moreover, price index that impose seasonal pattern will be seasonal adjusted
before release to public (Wooldridge, 2006; Greene, 2008). The seasonal pattern
gives less attention by Malaysian house price index. Moreover, Malaysia has a
different culture from other countries in terms of festival, public holiday, school
holiday and weather. These will lead to different bargaining power between seller
10
and buyer as mentioned by Harding et al. (2003). Thus, it is important to explore the
behaviors Malaysian market through seasonality analysis.
To conclude, most of the research highlighted the effectiveness of geospatial
data, shrinkage and semiparametric estimators in enhancing hedonic price model.
However, the improvement of hedonic price index model gives less attention by past
research. Therefore, the research can be further extended to improve hedonic price
index model. In addition, it is lack of comprehensive study on the improvement of
Malaysian house price index. The temporal aggregation and seasonality problems are
not considered in constructing Malaysian house price index. Therefore, it is
necessary to establish the methodological enhancement of Malaysian house price
index.
1.3 Research Questions
The research questions related to the objectives are:
a) Research question 1:
How to improve hedonic price index model?
b) Research question 2:
How to establish the methodological enhancement of house price index?
1.3.1 Research Objectives
1. To evaluate hedonic house price index models.
2. To establish the methodological enhancement of house price index.
11
1.4 Scope and Limitation of Study
This study scope covered four major residential areas of South Johor. It
consists of Pulai, Tebrau, Johor Bahru and Plentong which experienced rapid growth
of property development under Iskandar Regional Development. The main aim of
this research is to focus on the enhancement of hedonic price index. Therefore, this
study will give priority to the regions that can produce large sample of housing
transactions. According to the property transaction data from Valuation and Property
Services Department (JPPH) these regions has produced large transactions volume of
double storey terrace house. The Johor Residential Existing Stock Report 2011-2015
which published by National Property Information Centre (NAPIC) indicated 2-3
storey house placed a largest market share (30%) of residential property. Thus, it
shows the importance of 2-3 storey houses in residential market of Johor. The time
frame in this research is ranged from year 2006 until 2011 due to the issue of data
availability.
1.5 Significance of Study
This section will emphasize the contribution of this study towards the society
and knowledge. In term of contribution to the society, house price index plays an
important role in delivering the information of housing performance to stakeholders.
It helps policy maker to formulate national economic policy respect to housing and
property development. Furthermore, house price index could be used to strengthen
the consultation report of real estate professionals such as property feasibility report.
In addition, house price index is important for investors in term of formulating
property investment strategies. House price index will unveil property market
behavior in long cycle or short cycle which important for buyer and seller in
obtaining a good deal. In future, house price index can be transformed into financial
product such as housing derivatives in order to benefit the financial market in
Malaysia. However, the benefits of house price index would not be realized without a
reliable and house price index. Therefore, it is necessary to revisit the index
construction methodology in order to yield a better Malaysian house price index.
12
This study has contributed knowledge in term of methodological
enhancement of hedonic house price index. The weaknesses of existing methodology
in constructing hedonic house price index are highlighted in previous section. For
example, spatial heterogeneity, multicollinearity, temporal aggregation and
seasonality problem has directly affect the reliability of hedonic house price index.
Therefore, this study has integrated spatial model, shrinkage estimation,
semiparametric estimation, temporal aggregation and seasonality analysis in
improving existing house price index. Furthermore, the evaluation method of
hedonic price index model in previous research is still unclear. Thus, this study has
revisited and established a comprehensive methodology for evaluating the reliability
of hedonic price index model. Finally, this study contributed the methodological
enhancement of hedonic house price index by using Malaysia case study.
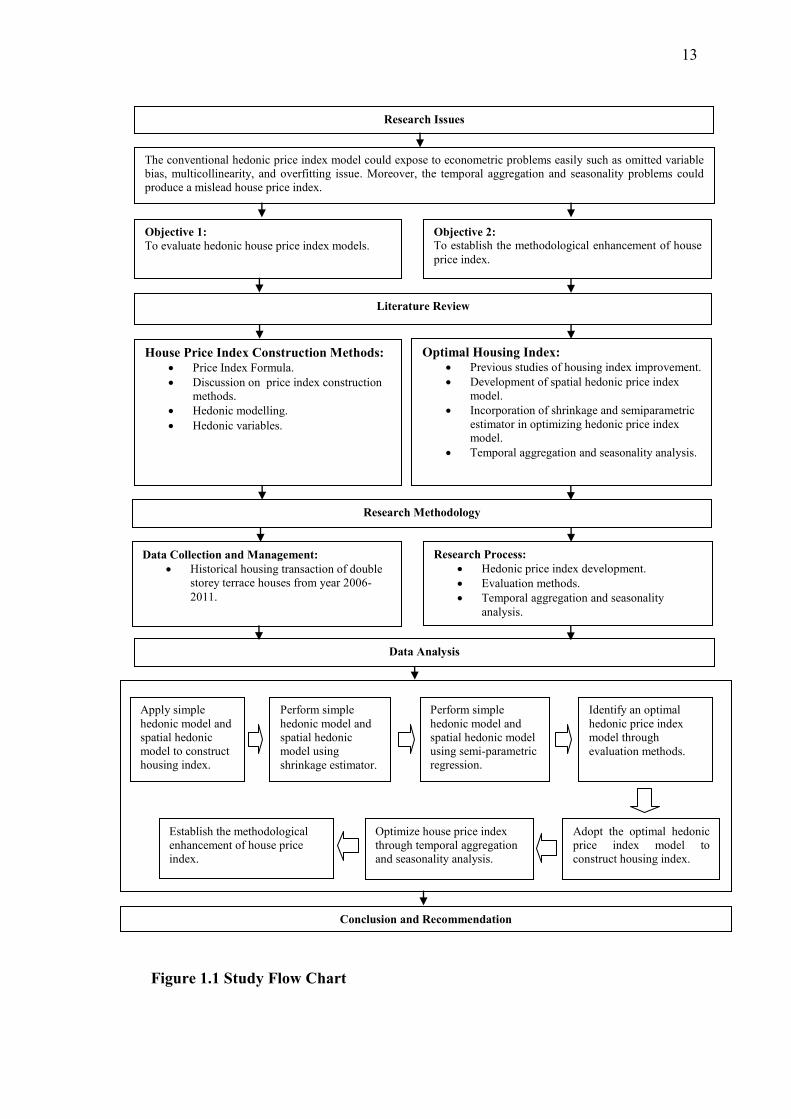
1.6 Research Framework
In order to achieve the two objectives in scientific manner, this section has
developed a research framework for this study. The research framework mainly
comprised of research issues, research objectives, literature review, research
methodology, data analysis, conclusion and recommendation.
Firstly, the research issues and research objectives have highlighted the
importance of enhancing hedonic price index. Secondly, by integrating the literature
review from various sources it used to determine the elements in improving the
hedonic house price index model. Then, the research methodology section will
identify the process of obtaining optimal house price index. After that, it followed by
data analysis. The result of data analysis will be used to establish the methodological
enhancement of house price index. Finally, the research will be ended with
conclusion and recommendation. This section will emphasize the knowledge
contribution of this study as compared to past studies. At last, it will recommend
future research for strengthening the development of hedonic price index model.
13
Figure 1.1 Study Flow Chart
The conventional hedonic price index model could expose to econometric problems easily such as omitted variable
bias, multicollinearity, and overfitting issue. Moreover, the temporal aggregation and seasonality problems could
produce a mislead house price index.
Research Issues
Objective 2:
To establish the methodological enhancement of house
price index.
Objective 1:
To evaluate hedonic house price index models.
Literature Review
House Price Index Construction Methods: Price Index Formula.
Discussion on price index construction
methods.
Hedonic modelling.
Hedonic variables.
Research Methodology
Data Collection and Management:
Historical housing transaction of double
storey terrace houses from year 2006-
2011.
Data Analysis
Conclusion and Recommendation
Optimal Housing Index: Previous studies of housing index improvement.
Development of spatial hedonic price index
model.
Incorporation of shrinkage and semiparametric
estimator in optimizing hedonic price index
model.
Temporal aggregation and seasonality analysis.
Research Process:
Hedonic price index development.
Evaluation methods.
Temporal aggregation and seasonality
analysis.
Apply simple
hedonic model and
spatial hedonic
model to construct
housing index.
Perform simple
hedonic model and
spatial hedonic
model using
shrinkage estimator.
Perform simple
hedonic model and
spatial hedonic model
using semi-parametric
regression.
Identify an optimal
hedonic price index
model through
evaluation methods.
Adopt the optimal hedonic
price index model to
construct housing index.
Optimize house price index
through temporal aggregation
and seasonality analysis.
Establish the methodological
enhancement of house price
index.
14
1.7 Thesis Structure
Chapter One: Introduction
This chapter is initiated by background of study and problem statements in
order to emphasize the importance of enhancing the methodology of house price
index. After that, it followed by forming research objectives that able to close the
research gap. Due to time constraints of the study, the scope and limitation of study
are written in this chapter. Moreover, it included the contributions of this study
toward the society and the body of knowledge. Finally, a research framework is
attached in order to conduct this research in a scientific manner.
Chapter Two: House Price Index Construction Methods
The second chapter has included all essential parts of housing index
literature in order to achieve the objectives of the study. The initial part of this
chapter will deliver the concept and role of housing index for a country. After that, it
followed by the exploration on available index construction methods for housing. It
is consists of the strengths, weaknesses and improvements on the existing index
construction methods. Besides, it revisited the effectiveness of hedonic regression
method for developing Malaysian House Price Index. Meanwhile, the selection of
hedonic variables is discussed in this chapter.
Chapter Three: Optimization of Hedonic House Price Index
The third chapter has included literatures of hedonic housing index
improvement. There are three major issues to be explored in improving hedonic price
index model such as omitted of spatial variables, model complexity and functional
form misspecification. Besides, the following section unveiled the methods to
identify temporal aggregation and seasonality problem. Both are external factors that
can affect the reliability of house price index.
15
Chapter Four: Research Methodology
Chapter four consists of research methodology that illustrated the process of
obtaining optimal house price index. The initial part covered description of study
area, data collection, and data management. After that, it followed by descriptive
analysis and hedonic price index model development. This chapter has included
evaluation methods for measuring the reliability of hedonic house price index model.
Finally, the chapter is ended with the computation of temporal aggregation and
seasonality analysis.
Chapter Five: Data Analysis
The main aim of this chapter is to explore an optimization methodology for
constructing Malaysian house price index. There are two sections in this study. The
first section will incorporate geospatial data and two types of estimator such as
shrinkage and semiparametric estimation to enhance simple hedonic house price
index model. The reliability of various hedonic models is evaluated based on the 1)
predictive power, 2) accuracy of price index and 3) level of index revision. In
addition, the accuracy of price index is measured by a new method known as double
transformation method which had been mentioned in previous chapter. The second
section has employed temporal aggregation and seasonality analysis for establishing
the methodological enhancement of house price index.
Chapter Six: Conclusion and Recommendation
This chapter has matched the research findings and research objectives in
order to give a comprehensive summary and conclusion of the study. Besides, the
contributions of this study are included in this chapter in order to emphasize the
importance of enhancing hedonic price index model. Finally, the last section of this
chapter provides limitations and recommendations for improving this research in the
future.
REFERENCES
Abdul Hamid Mar Iman (2007). Combining Geographic Information System and
Regression Model to Generate Locational Value Residual Surfaces in the
Assessment of Residential Property Values. Pacific Rim Property Research
Journal. 13(1), 35-62.
Adair, A. S., Berry, J. N., & McGreal, W. S. (1996). Hedonic modelling, housing
submarkets and residential valuation. Journal of property Research, 13(1),
67-83.
Afiqah, N., Diah, M., Lizam, M., & Omar, A. J (2012). The revisited of Malaysian
house price index. Proceedings International Conference of Technology
Management, Business and Entrepreneurship 2012.
Anselin, L., & Bera, A. K. (1998). Spatial dependence in linear regression models
with an introduction to spatial econometrics. Statistics Textbooks and
Monographs, 155, 237-290.
Bailey, M. J., Muth, R. F., & Nourse, H. O. (1963). A regression method for real
estate price index construction. Journal of the American Statistical
Association, 58(304), 933-942.
Barras, R. (1994). Property and the economic cycle: Building cycles revisited∗.
Journal of Property Research, 11(3), 183-197.
Ball, M. J. (1973). Recent empirical work on the determinants of relative house
prices. Urban studies, 10(2), 213-233.
Bao, H. X., & Wan, A. T. (2004). On the use of spline smoothing in estimating
hedonic housing price models: empirical evidence using Hong Kong
data. Real estate economics, 32(3), 487-507.
Bao, H. X., & Wan, A. T. (2007). Improved estimators of hedonic housing price
models. Journal of Real Estate Research, 29(3), 267-302.
162
Baroni, M., Barthélémy, F., & Mokrane, M. (2008). Is it possible to construct
derivatives for the Paris residential market?. The Journal of Real Estate
Finance and Economics, 37(3), 233-264.
Basu, S., & Thibodeau, T. G. (1998). Analysis of spatial autocorrelation in house
prices. The Journal of Real Estate Finance and Economics, 17(1), 61-85.
Berndt, E. R., & Rappaport, N. J. (2001). Price and quality of desktop and mobile
personal computers: A quarter-century historical overview. American
Economic Review, 268-273.
Brewer, Kenneth. R. (1973). Some consequences of temporal aggregation and
systematic sampling for ARMA and ARMAX models. Journal of
Econometrics, 1(2), 133-154.
Bitter, C., Mulligan, G. F., & Dall’erba, S. (2007). Incorporating spatial variation in
housing attribute prices: a comparison of geographically weighted regression
and the spatial expansion method. Journal of Geographical Systems, 9(1), 7-
27.
Box, G. E., & Cox, D. R. (1964). An analysis of transformations. Journal of the
Royal Statistical Society. Series B (Methodological), 211-252.
Breiman, L. (2001). Statistical modeling: The two cultures (with comments and a
rejoinder by the author). Statistical Science, 16(3), 199-231.
Brunsdon, C., Fotheringham, A. S., & Charlton, M. E. (1996). Geographically
weighted regression: a method for exploring spatial nonstationarity.
Geographical analysis, 28(4), 281-298.
Can, A. (1992). Specification and Estimation of Hedonic Housing Price Models.
Regional Science and Urban Economics. 22(3), 453–474.
Carroll, T. M., Clauretie, T. M., & Jensen, J. (1996). Living next to godliness:
Residential property values and churches. The Journal of Real Estate Finance
and Economics, 12(3), 319-330.
Calhoun, C. A., Chinloy, P., & Megbolugbe, I. F. (1995). Temporal aggregation and
house price index construction. Journal of Housing Research, 6, 419-438.
Case Jr, K. E., Shiller, R. J., & Weiss, A. N. (1993). Index-based futures and options
markets in real estate. The Journal of Portfolio Management, 19(2), 83-92.
163
Can, A. and Megbolugbe, I. (1997). Spatial Dependence and House Price Index
Construction. Journal of Real Estate Finance and Economics. 14(1/2), 203-
222.
Chan, M. L., Khanthavit, A., & Thomas, H. (1996). Seasonality and cultural
influences on four Asian stock markets. Asia Pacific Journal of Management,
13(2), 1-24.
Choy, L. H., Mak, S. W., & Ho, W. K. (2007). Modeling Hong Kong real estate
prices. Journal of Housing and the Built Environment, 22(4), 359-368.
Clapham, E., Englund, P., Quigley, J. M., & Redfearn, C. L. (2006). Revisiting the
past and settling the score: index revision for house price derivatives. Real
Estate Economics, 34(2), 275-302.
Clapp, J. M. (2004). A semiparametric method for estimating local house price
indices. Real Estate Economics, 32(1), 127-160.
Clarke, E. D., Speirs, D. C., Heath, M. R., Wood, S. N., Gurney, W. S. C., & Holmes,
S. J. (2006). Calibrating remotely sensed chlorophyll‐a data by using
penalized regression splines. Journal of the Royal Statistical Society: Series C
(Applied Statistics), 55(3), 331-353.
Costello, G., & Watkins, C. (2002). Towards a system of local house price
indices. Housing Studies, 17(6), 857-873.
Coulson, T., Ezard, T. H. G., Pelletier, F., Tavecchia, G., Stenseth, N. C., Childs, D.
Z., ... & Crawley, M. J. (2008). Estimating the functional form for the density
dependence from life history data. Ecology, 89(6), 1661-1674.
Cohen, J. (1990). Things I have learned (so far).American psychologist, 45(12), 1304.
Daria, S. (2007). Spatial-Temporal Modelling in Real Estate Market Analysis.
Masters Degree Project Report. University of Queensland, Australia.
De Haan, J., & Diewert, W. E. (2011). Handbook on residential property price
indexes.
Deng, Y., & Quigley, J. M. (2008). Index revision, house price risk, and the market
for house price derivatives. The Journal of Real Estate Finance and
Economics, 37(3), 191-209.
Diah, M., Lizam, M., Rosmera, N. A., & Omar, A. J. (2013). The construction of real
estate price index: modelling by incorporating spatial elements.
164
Diewert, W. E. (2001). The consumer price index and index number theory: a
survey. Department of Economics UBC discussion paper 01, 2.
Dubin, R. A. (1998). Spatial autocorrelation: a primer. Journal of housing
economics, 7(4), 304-327.
Dubin, R. A. (2003). Robustness of Spatial Autocorrelation Specifications: Some
Monte Carlo Evidence. Journal of Regional Science. 43(2), 221-248.
Eilers, P. H., & Marx, B. D. (1996). Flexible smoothing with B-splines and penalties.
Statistical science, 89-102.
Englund, P., Quigley, J. M., & Redfearn, C. L. (1999). The choice of methodology
for computing housing price indexes: comparisons of temporal aggregation
and sample definition. The journal of real estate finance and economics,
19(2), 91-112.
Ericson, L. E., Song, H. S., Winstrand, J., & Wilhelmsson, M. (2013). Regional
house price index construction–the case of Sweden. International Journal of
Strategic Property Management, 17(3), 278-304.
Fletcher, M., Gallimore, P., & Mangan, J. (2000). The modelling of housing
submarkets. Journal of Property Investment & Finance, 18(4), 473-487.
Fletcher, M., Gallimore, P., & Mangan, J. (2000). The modelling of housing
submarkets. Journal of Property Investment & Finance, 18(4), 473-487.
Fenwick, D. (2013). Uses of Residential Property Price Indices. Handbook on
Residential Property Price Indices, 15-20.
Fik, T. J., Ling, D. C., and Mulligan, G. F. (2003). Modelling Spatial Variation in
Housing Prices: A Variable Interaction Approach. Real Estate Economics.
31(4), 623–646.
Fisher, I. (1922). The making of index numbers: a study of their varieties, tests, and
reliability (No. 1). Houghton Mifflin.
Fortmann-Roe, S. (2012). Understanding the bias-variance tradeoff. Website:
http://scott.fortmann-roe.com/docs/BiasVariance.html
François, D. R., Marius, T., Yan, K., & Paul, V. (2002). Landscaping and house
values: an empirical investigation. Journal of real estate research, 23(1-2),
139-162.
French, J. L., Kammann, E. E., & Wand, M. P. (2001). Theory and Methods-
Comment-Semiparametric Nonlinear Mixed-Effects Models and Their
165
Applications. Journal of the American Statistical Association, 96(456), 1285-
1287.
Fehribach, F., Rutherford, R., & Eakin, M. (2009). An analysis of the determinants
of industrial property valuation. Journal of Real Estate Research.
Gardner Jr, E. S., & McKenzie, E. D. (1985). Forecasting trends in time series.
Management Science, 31(10), 1237-1246.
Geltner, D. (1993). Temporal aggregation in real estate return indices. Real Estate
Economics, 21(2), 141-166.
Gelfand, A. E., Kim, H-J., Sirmans, C. F., and Banerjee, S. (2003). Spatial Modelling
with Spatially Varying Coefficient Processes. Journal of the American
StatisticalAssociation. 98(462), 387-396.
Greene, W. H. (2008). Econometric Analysis, Pearson Prentice Hall.Upper Saddle
River, New Jersey.
Goh, Y. M., Costello, G., & Schwann, G. (2012). Accuracy and robustness of house
price index methods. Housing Studies, 27(5), 643-666.
Goodman, A. C. (1978). Hedonic prices, price indices and housing markets.Journal
of Urban Economics, 5(4), 471-484.
Goodman, A. C., & Thibodeau, T. G. (1998). Housing market segmentation. Journal
of housing economics, 7(2), 121-143.
Haining, R. (1987). Trend–Surface Models With Regional and Local Scales of
Variation With an Application to Aerial Survey Data. Technometrics, 29(4),
461-469.
Halvorsen, R., & Pollakowski, H. O. (1981). Choice of functional form for hedonic
price equations. Journal of Urban Economics, 10(1), 37-49.
Harris, J. C. (1989). The effect of real rates of interest on housing prices. The journal
of real estate finance and economics, 2(1), 47-60.
Harding, J. P., Rosenthal, S. S., & Sirmans, C. F. (2003). Estimating bargaining
power in the market for existing homes. Review of Economics and statistics,
85(1), 178-188.
Hannonen, M. (2006). An analysis of trends and cycles of land prices using wavelet
transforms. International Journal of Strategic Property Management,10(1),
1-21.
166
Hoffmann, J., & Lorenz, A. (2006). Real estate price indices for Germany: past,
present and future. Present and Future (November 30, 2006).
Hoesli, M. (1994). Real estate as a hedge against inflation: learning from the Swiss
case. Journal of Property Valuation and Investment, 12(3), 51-59.
Hoesli, M., Giaccotto, C., & Favarger, P. (1997). Three new real estate price indices
for Geneva, Switzerland. The Journal of Real Estate Finance and Economics,
15(1), 93-109.
Hill, R. (2011). Hedonic price indexes for housing (No. 2011/1). OECD Publishing.
Hill, R. J. (2013). Hedonic price indexes for residential housing: A survey,
evaluation and taxonomy. Journal of Economic Surveys, 27(5), 879-914.
Hill, R.J., D. Melser and B. Reid (2010), ―Hedonic Imputation with Geospatial Data:
An Application of Splines to the Housing Market‖, Mimeo.
HSR international Realtor. Malaysia: Property Market Report 2013. Singapore. 2014.
Ismail S.and Yusof.A.M (2012). Multiple regressions in analysing house price
variations. Communications of the IBIMA, 2012, 1-9.
Ismail, S., Iman, M., Hamid, A., & Navaneethan, R. (2009). Testing for the existence
of housing sub-markets in Penang, Malaysia. Malaysian Journal of Real
Estate, 4(1), 52-70.
Ittig, P. T. (1997). A seasonal index for business. Decision Sciences, 28(2), 335-355.
Jani Venter (2008), The Applications of Commercial Real Estate Derivatives In
Investment Strategies, CB Richard Ellis.
Johnson, C. R. (1970). Positive definite matrices. American Mathematical Monthly,
259-264.
Jones, J. P., & Casetti, E. (Eds.). (1992).Applications of the expansion method (pp.
32-46). London: Routledge.
Junainah, M., Hishamuddin, M. A., & Suriatini, I. (2011). The Existence and
Implications of Thin Real Estate Market. International Journal of Trade,
Economics and Finance, 2(5), 376.
Kaplanski, G., & Levy, H. (2012). Real estate prices: An international study of
seasonality's sentiment effect. Journal of Empirical Finance, 19(1), 123-146.
Karaganis, A. N. (2011). Seasonal and spatial hedonic price indices. Journal of
Property Investment & Finance, 29(3), 297-311.
167
Kain, J. F., & Quigley, J. M. (1970). Evaluating the quality of the residential
environment. Environment and Planning, 2(1), 23-32.
Kaufman, L. and Rousseeuw, P.J. (1990). Finding Groups in Data—An Introduction
to Cluster Analysis. Wiley.
Knight, J. R., Carter Hill, R., & Sirmans, C. F. (1993). Stein rule estimation in real
estate appraisal. Appraisal Journal, 61, 539-539.
Knight, J. R., Hill, R. C., & Sirmans, C. F. (1992). Biased prediction of housing
values. Real Estate Economics, 20(3), 427-456.
Kryvobokov, M., & Wilhelmsson, M. (2007). Analysing location attributes with a
hedonic model for apartment prices in Donetsk, Ukraine. International
Journal of Strategic Property Management, 11(3), 157-178.
Kim, C. W., Phipps, T. T., & Anselin, L. (2003). Measuring the benefits of air
quality improvement: a spatial hedonic approach. Journal of environmental
economics and management, 45(1), 24-39.
Laspeyres, E. (1871). Die berechnung einer mittleren
waarenpreissteigerung. Jahrbücher für Nationalökonomie und
Statistik/Journal of Economics and Statistics, 16, 296-314.
LeSage, J. P. (1999). Spatial econometrics. Morgantown, WV: Regional Research
Institute, West Virginia University.
Legendre, P., & Legendre, L. (1998). Numerical Ecology (second English ed.)
Elsevier Science.Amsterdam, The Netherlands.
Liu, X. (2013). Spatial and Temporal Dependence in House Price Prediction.The
Journal of Real Estate Finance and Economics, 47(2), 341-369.
Li, M. M., & Brown, H. J. (1980). Micro-neighborhood externalities and hedonic
housing prices. Land economics, 125-141.
Lim, C., & McAleer, M. (2001). Monthly seasonal variations: Asian tourism to
Australia. Annals of Tourism Research, 28(1), 68-82.
Lowe, J. (1824). The present state of England in regard to agriculture, trade and
finance: with a comparison of the prospects of England and France. E. Bliss
and E. White.
Lum, S. K. (2004). Property price indices in the Commonwealth: Construction
methodologies and problems. Journal of Property Investment &
Finance, 22(1), 25-54.
168
Maurer, R., Pitzer, M., & Sebastian, S. (2004). Hedonic price indices for the Paris
housing market. Allgemeines Statistisches Archiv, 88(3), 303-326.
Maimun, A., & Hana, N. (2011). Spatiotemporal autoregressive model for
Malaysian housing market analysis (Doctoral dissertation, Universiti
Teknologi Malaysia, Faculty of Geoinformation and Real Estate).
Malaysian Government (1996), Seventh Malaysia Plan, Percetakan Nasional Berhad,
Kuala Lumpur.
Malaysian Government (2001), Eight Malaysia Plan, Percetakan Nasional Berhad,
Kuala Lumpur.
Ministry of Housing and Local Government, Malaysia (1998) Eight Malaysia Plan,
Percetakan Nasional Berhad, Kuala Lumpur.
Makridakis, S., Andersen, A., Carbone, R., Fildes, R., Hibon, M., Lewandowski, R.,
& Winkler, R. (1982). The accuracy of extrapolation (time series) methods:
Results of a forecasting competition. Journal of forecasting, 1(2), 111-153.
McMillen, D. P., & Thorsnes, P. (2003). The Aroma of Tacoma. Journal of Business
& Economic Statistics, 21(2).
Meese, R., & Wallace, N. (1991). Nonparametric estimation of dynamic hedonic
price models and the construction of residential housing price indices. Real
Estate Economics, 19(3), 308-332.
Miller, N., Sah, V., Sklarz, M., & Pampulov, S. (2012). Correcting for the Effects of
Seasonality on Home Prices. Appraisal Journal, 80(1).
Munneke, H. J., & Slade, B. A. (2001). A Metropolitan Transaction‐Based
Commercial Price Index: A Time‐Varying Parameter Approach. Real Estate
Economics, 29(1), 55-84.
Nappi-Choulet, I., & Maury, T. P. (2009). A Spatial and Temporal Autoregressive
Local Estimation for the Paris Housing Market.
Namba, A., & Ohtani, K. (2012). Small Sample Properties Of A Pre-Test Stein-Rule
Estimator For Each Individual Re-Gression Coefficient Under An Alternative
Null Hypothesis In The Pre-Test. Kobe University Economic Review, 58, 1-9.
Ngai, L. R., & Tenreyro, S. (2014). Hot and cold seasons in the housing market. The
American Economic Review, 104(12), 3991-4026.
169
Ong, S. E., & Ng, K. H. (2009). Developing the real estate derivative market for
Singapore: issues and challenges. Journal of Property Investment &
Finance,27(4), 425-432.
Osland, L. (2013). The importance of unobserved attributes in hedonic house price
models. International Journal of Housing Markets and Analysis, 6(1), 63-78.
Owusu-Ansah, A. (2013). Construction of property price indices: Temporal
aggregation and accuracy of various index methods. Property
Management,31(2), 115-131.
Opgen-Rhein, R., & Strimmer, K. (2007). Accurate ranking of differentially
expressed genes by a distribution-free shrinkage approach. Statistical
Applications in Genetics and Molecular Biology, 6(1).
Pace, R. K. (1993). Nonparametric methods with applications to hedonic
models. The Journal of Real Estate Finance and Economics, 7(3), 185-204.
Paasche, H. (1874). Über die Preisentwicklung der letzten Jahre, nach den
Hamburger Börsennotierungen. Jahrbücher für Nationalökonomie und
Statistik, 12, 168-178.
Pavlov, A. D. (2000). Space‐varying regression coefficients: a semi‐parametric
approach applied to real estate markets. Real Estate Economics, 28(2), 249-
283.
Palmquist, R. B. (2005). Property value models.Handbook of environmental
economics, 2, 763-819.
Pace, R. K., Barry, R., Clapp, J. M., & Rodriquez, M. (1998). Spatiotemporal
autoregressive models of neighborhood effects. The Journal of Real Estate
Finance and Economics, 17(1), 15-33.
Pace, R. K., Barry, R., Gilley, O. W., and Sirmans, C. F. (2000). A Method for
Spatial- Temporal Forecasting with an Application to Real Estate Prices.
InternationalJournal of Forecasting. 16(2), 229-246.
Pakes, A. (2002). A Reconsideration of Hedonic Price Indices with an Application to
PC's (No. w8715). National Bureau of Economic Research.
Panik, M. (2009). Regression modeling: methods, theory, and computation with SAS.
CRC press.
Prasad, N., & Richards, A. (2009). Improving median housing price indexes through
stratification. Journal of Real Estate Research.
170
Reichert, A. K. (1990). The impact of interest rates, income, and employment upon
regional housing prices. The Journal of Real Estate Finance and
Economics, 3(4), 373-391.
Residential Property Stock Tables (2010). Pusat Maklumat Harta Tanah Negara
(NAPIC). Jabatan Penilaian & Perkhidmatan Harta. Kementeraian Kewangan
Malaysia. Putrajaya.
Residential Property Stock Tables (2012). Pusat Maklumat Harta Tanah Negara
(NAPIC). Jabatan Penilaian & Perkhidmatan Harta. Kementeraian Kewangan
Malaysia. Putrajaya.
Rosen, H. S. (1979). Housing decisions and the US income tax: An econometric
analysis. Journal of Public Economics, 11(1), 1-23.
Rodriguez, M., & Sirmans, C. F. (1994). Quantifying the value of a view in single-
family housing markets. Appraisal Journal, 62, 600-600.
Robinson, P. M. (1991). Time series with strong dependence. In Advances in
Econometrics, Sixth World Congress (Vol. 1, pp. 47-95).
Ruppert, D., & Carroll, R. J. (2000). Theory & Methods: Spatially‐adaptive Penalties
for Spline Fitting. Australian & New Zealand Journal of Statistics, 42(2),
205-223.
Ruppert, D., Wand, M. P., & Carroll, R. J. (2003). Semiparametric regression (No.
12). Cambridge university press.
SAS Institute Inc. (1999),SAS/STAT User’s Guide, Version 8,Cary, NC: SAS Insti-
tute Inc.
Salkowski, N. J. (2008). Using the SemiPar package. class project, available at
http://www. biostat. umn. edu/~ hodges/SalkowskiRPMProject. pdf, 330.
Schweser. K (2011), CFA Level 2 Book 1: Ethical and professional standards,
quantitative methods, and economics, United States of America.
Schwann, G. M. (1998). A real estate price index for thin markets. The Journal of
Real Estate Finance and Economics, 16(3), 269-287.
Schäfer, J., & Strimmer, K. (2005). A shrinkage approach to large-scale covariance
matrix estimation and implications for functional genomics. Statistical
applications in genetics and molecular biology, 4(1).
Shiller, R. J. (2008). Derivatives markets for home prices (No. w13962). National
Bureau of Economic Research.
171
Shimizu, C., Nishimura, K. G., & Watanabe, T. (2010). Housing Prices in Tokyo: A
Comparison of Hedonic and Repeat Sales Measures. Jahrbücher für
Nationalökonomie und Statistik, 792-813.
Silver, M., & Heravi, S. (2007). The difference between hedonic imputation indexes
and time dummy hedonic indexes. Journal of Business & Economic
Statistics, 25(2), 239-246.
Song, H. S., & Wilhelmsson, M. (2010). Improved price index for
condominiums. Journal of Property Research, 27(1), 39-60.
Stodden, V. (2006). Model selection when the number of variables exceeds the
number of observations (Doctoral dissertation, Stanford University).
Sun, H., Tu, Y., and Yu, S. M. (2005). A Spatio-Temporal Autoregressive Model for
Multi Unit Residential Market Analysis. Journal of Real Estate Finance
andEconomics. 31(2), 155-187.
Sundberg, R. (2002). Shrinkage regression. Encyclopedia of environmetrics.
Valuation and Property Services Department (1997). Malaysian House Price Index:
A Technical Summary. Kuala Lumpur, Ministry of Finance Malaysia
Tyrväinen, L. (1997). The amenity value of the urban forest: an application of the
hedonic pricing method. Landscape and Urban planning, 37(3-4), 211-222.
Wei, W. W. (1979). Some Consequences of Temporal Aggregation in Seasonal Time
Series Models. NBER Chapters, 433-448.
Widlak, M., & Tomczyk, E. (2010). Measuring price dynamics: evidence from the
Warsaw housing market. Journal of European Real Estate Research, 3(3),
203-227.
Wilhelmsson, M. (2009). Construction and updating of property price index series:
The case of segmented markets in Stockholm. Property Management, 27(2),
119-137.
Wooldridge, J. M. (2006). Introductory Econometrics: A Modern Approach
(Thomson South-Western, Mason, OH), 3. Address: Tomaša Ježa, 6.
Wood, R. (2005). A comparison of UK residential house price indices. BIS papers,
21(16), 212-227.
Wood, S. N., & Augustin, N. H. (2002). GAMs with integrated model selection using
penalized regression splines and applications to environmental modelling.
Ecological modelling, 157(2), 157-177.
172
Xu, T. (2008). Heterogeneity in Housing Attribute Prices: A Study of the Interaction
Behaviour between Property Specifics, Location Coordinates and Buyers’
Characteristics. International Journal of Housing Markets and Analysis.
1(2),166-181.
Yao, F., & Lee, T. C. (2008). On knot placement for penalized spline regression.
Journal of the Korean Statistical Society, 37(3), 259-267.
Yao, F., & Lee, T. (2006). Penalized spline models for functional principal
component analysis. Journal of the Royal Statistical Society: Series B
(Statistical Methodology), 68(1), 3-25.
Zabel, J. E. (1999). Controlling for quality in house price indices. The Journal of
Real Estate Finance and Economics, 19(3), 223-241.