annual report 2011 - sapura · tel: 603 8925 6011 • fax: 603 8925 8292 sapura industrial berhad...
TRANSCRIPT
IndustrialIndustrial
IndustrialIndustrial
2011Empowering
Annual Report
20
11
An
nu
al Rep
ort
Sapura Industrial Berhad (17547-W
)
www.sapuraindustrial.com.my
Lot 2 & 4, Jalan P/11, Seksyen 10, Kawasan Perindustrian Bangi,43650 Bandar Baru Bangi, Selangor Darul Ehsan, Malaysia.Tel: 603 8925 6011 • Fax: 603 8925 8292
Sapura Industrial Berhad (17547-W)
AR Cover.indd 1 13/6/11 4:19:37 PM
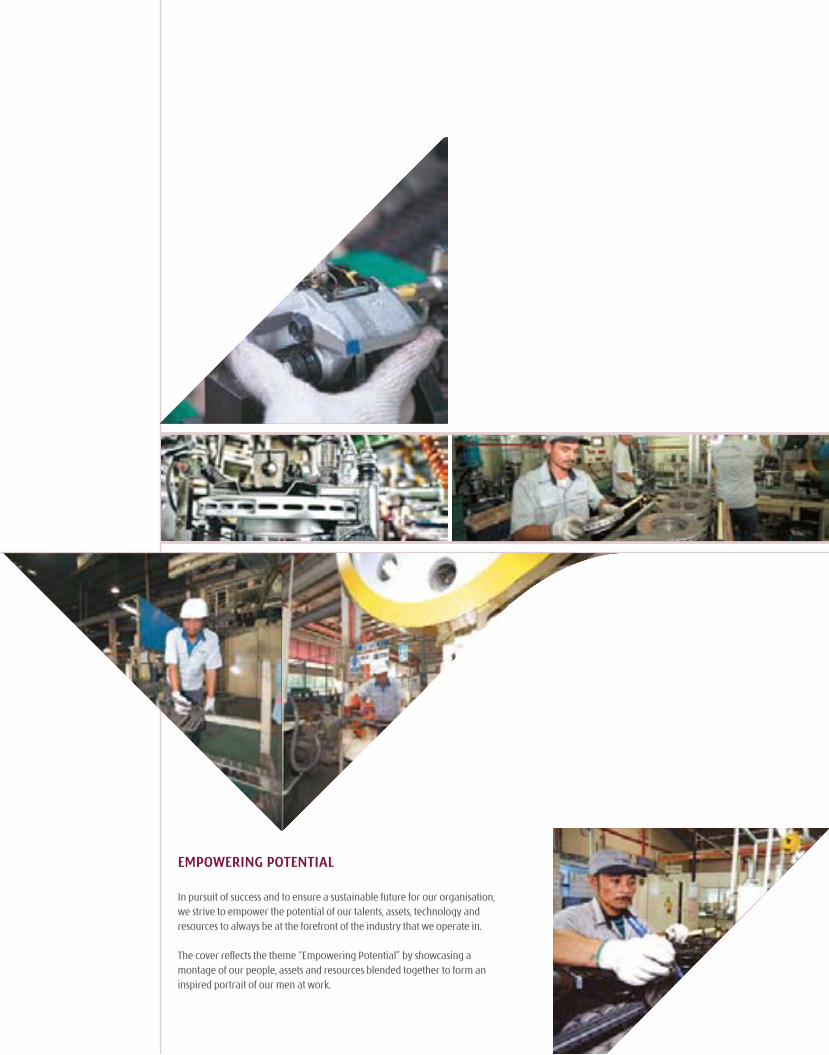
EMPOWERING POTENTIAL
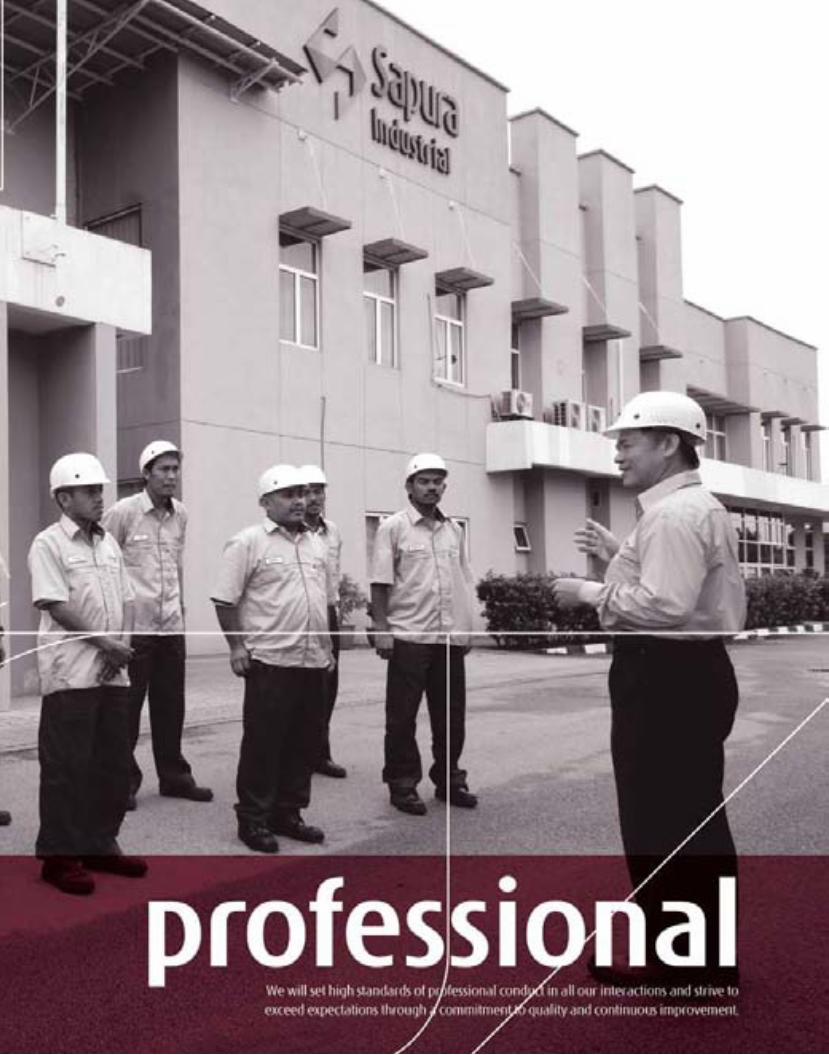
In pursuit of success and to ensure a sustainable future for our organisation, we strive to empower the potential of our talents, assets, technology and resources to always be at the forefront of the industry that we operate in.
The cover reflects the theme “Empowering Potential” by showcasing a montage of our people, assets and resources blended together to form an inspired portrait of our men at work.
Notice of Annual General Meeting 2
Corporate Profile 4
Corporate Information 6
Financial Highlights 7
Corporate Structure 8
Board of Directors 12
Directors’ Profile 14
Chief Executive Officer’s Profile 24
Chairman’s Statement 28
Corporate Social Responsibility 38
Corporate Governance Statement 44
Audit Committee Report 50
Statement on Internal Control 53
Additional Compliance Information 54
Statement of Directors’ Responsibility in Respect
of the Audited Financial Statements 55
Financial Statements 58
Analysis of Shareholdings 128
Particulars of Properties 131
Proxy Form
CONTENTS
2 Sapura Industrial BerhadAnnual Report 2011
NOTICE IS HEREBY GIVEN THAT the 35th Annual General Meeting of the Company will be held at the Multi-Purpose Hall, Ground Floor, Sapura @ Mines, No. 7, Jalan Tasik, The Mines Resort City, 43300 Seri Kembangan, Selangor Darul Ehsan on Wednesday, 13 July 2011 at 11.00 a.m. to transact the following businesses:
AGENDA
ORDINARY BUSINESS
1. To receive the Audited Financial Statements together with the Directors’ and Auditors’ reports for the financial year ended 31 January 2011.
2. To approve the payment of a single tier final dividend of 13.8 sen per ordinary share in respect of the financial year ended 31 January 2011.
3. To re-elect the following Directors who retire pursuant to Article 109 of the Articles of Association of the Company and being eligible, offer themselves for re-election:
i. Datuk Shahril bin Shamsuddinii. Dato’ Azlan bin Hashim
4. To re-elect Encik Wan Ahamad Sabri bin Wan Daud who retires pursuant to Article 113 of the Articles of Association of the Company and being eligible, offers himself for re-election.
5. To re-appoint Tan Sri Dato’ Seri Ir. Shamsuddin bin Abdul Kadir who retires pursuant to Sections 129(1) and (6) of the Companies Act, 1965 and being eligible, offers himself for re-appointment.
6. To re-appoint Messrs Ernst & Young as Auditors of the Company until the conclusion of the next Annual General Meeting and to authorise the Directors to fix their remuneration.
SPECIAL BUSINESS
As Special Business, to consider and if thought fit, to pass the following resolutions:
7. DIRECTORS’ FEES To approve the Directors’ fees for the financial year ended 31 January 2011.
8. AUTHORITY FOR DIRECTORS TO ISSUE SHARES UNDER SECTION 132D OF THE COMPANIES ACT, 1965 “THAT subject to the provisions of the Company’s Articles of Association and the Main Market Listing Requirements of Bursa Malaysia
Securities Berhad (Bursa Malaysia), the Directors be and are hereby empowered, pursuant to Section 132D of the Companies Act, 1965, to issue shares in the Company at any time and upon such terms and conditions and for such purpose as the Directors may, in their absolute discretion deem fit, provided that the aggregate number of shares issued pursuant to this resolution does not exceed ten per centum (10%) of the total issued and paid-up share capital of the Company as at the date of such issuance and that the Directors be and are also empowered to obtain all necessary approvals from the relevant authorities for the issuance and the listing of and quotation for the additional shares so issued on Bursa Malaysia and that such authority shall continue to be in force until the conclusion of the next Annual General Meeting of the Company.”
Ordinary Resolution 1
Ordinary Resolution 2Ordinary Resolution 3
Ordinary Resolution 4
Ordinary Resolution 5
Ordinary Resolution 6
Ordinary Resolution 7
Ordinary Resolution 8
NOTICE OF ANNUAL GENERAL MEETING
3 Sapura Industrial BerhadAnnual Report 2011
NOTICE OF DIVIDEND ENTITLEMENTNOTICE IS HEREBY GIVEN THAT a single tier final dividend of 13.8 sen per ordinary share in respect of the financial year ended 31 January 2011, if approved by the shareholders at the 35th Annual General Meeting, will be payable on 10 August 2011 to Depositors registered in the Record of Depositors at the close of business on 20 July 2011.
A Depositor shall qualify for entitlement only in respect of:
a) Shares transferred into the Depositor’s Securities Account before 4.00 p.m. on 20 July 2011 in respect of ordinary transfers; and
b) Shares bought on Bursa Malaysia Securities Berhad on a cum entitlement basis according to the Rules of Bursa Malaysia Securities Berhad.
BY ORDER OF THE BOARD
LIYANA LEE BINTI ABDULLAH(MIA 10293)Company Secretary
Bandar Baru Bangi, Selangor Darul Ehsan21 June 2011
NOTES:1. Agenda Item 1 This Agenda item is meant for discussion only as under the provisions of Section 169 (1) of the Companies Act, 1965 and the Company’s Articles of Association, formal approval by members is not
required to be obtained. Hence, the matter will not be put forward for voting.
2. Proxy Forms A member of the Company who is entitled to attend and vote at this Meeting is entitled to appoint not more than two (2) proxies to attend and vote on a show of hands or on a poll in his stead. A proxy may but need not be a member of the Company and a member may appoint any person to be his proxy without limitation.
Where a member is an authorised nominee, it may appoint at least one (1) proxy in respect of each securities account it holds with ordinary shares of the Company standing to the credit of the said securities account.
Where a member appoints two (2) proxies to attend and vote, the appointment shall be invalid unless he specifies the proportion of his shareholdings to be represented by each proxy.
An instrument appointing a proxy shall be in writing and in the case of an individual shall be signed by the appointor or by his attorney and in the case of a corporate member, shall be either under its Common Seal or signed by its attorney or an officer of the corporation duly authorised.
The instrument appointing a proxy must be deposited at the Registered Office of the Company at Lot 2 & 4, Jalan P/11, Seksyen 10, Kawasan Perindustrian Bangi, 43650 Bandar Baru Bangi, Selangor Darul Ehsan, not less than forty eight (48) hours before the time set for holding the Meeting or any adjournment thereof.
3. Corporate Representative As an alternative to the appointment of a proxy, a corporate member may appoint its corporate representative to attend this Meeting pursuant to Sections 147(3) and (4) of the Companies
Act, 1965. For this purpose and pursuant to Section 147(5) of the Companies Act, 1965, the corporate member shall provide a certificate under its common seal as prima facie evidence of appointment of the corporate representative. The corporate member may submit the certificate to the Registered Office of the Company prior to the commencement of this Meeting.
4. Directors’ Fees The Directors’ fees for the financial year ended 31 January 2011 amounted to RM300,139.
5. Ordinary Resolution pursuant to Section 132D of the Companies Act, 1965 As at the date of this Notice, no new shares in the Company were issued pursuant to the mandate granted to the Directors at the last Annual General Meeting (AGM) held on 21 July 2010 which
will lapse at the conclusion of the forthcoming 35th AGM.
The proposed Ordinary Resolution 8, if passed, would, subject to the Main Market Listing Requirements of Bursa Malaysia Securities Berhad, enable the Directors to issue up to a maximum of ten per centum (10%) of the total issued and paid-up share capital of the Company at the date of such issuance for such purpose as the Directors consider would be in the best interest of the Company.
The Company is seeking the approval from shareholders on the renewal of the above mandate for the purpose of possible fund raising exercise(s) including but not limited to the further placement of shares to fund future investments, acquisitions and/or meet working capital requirements.
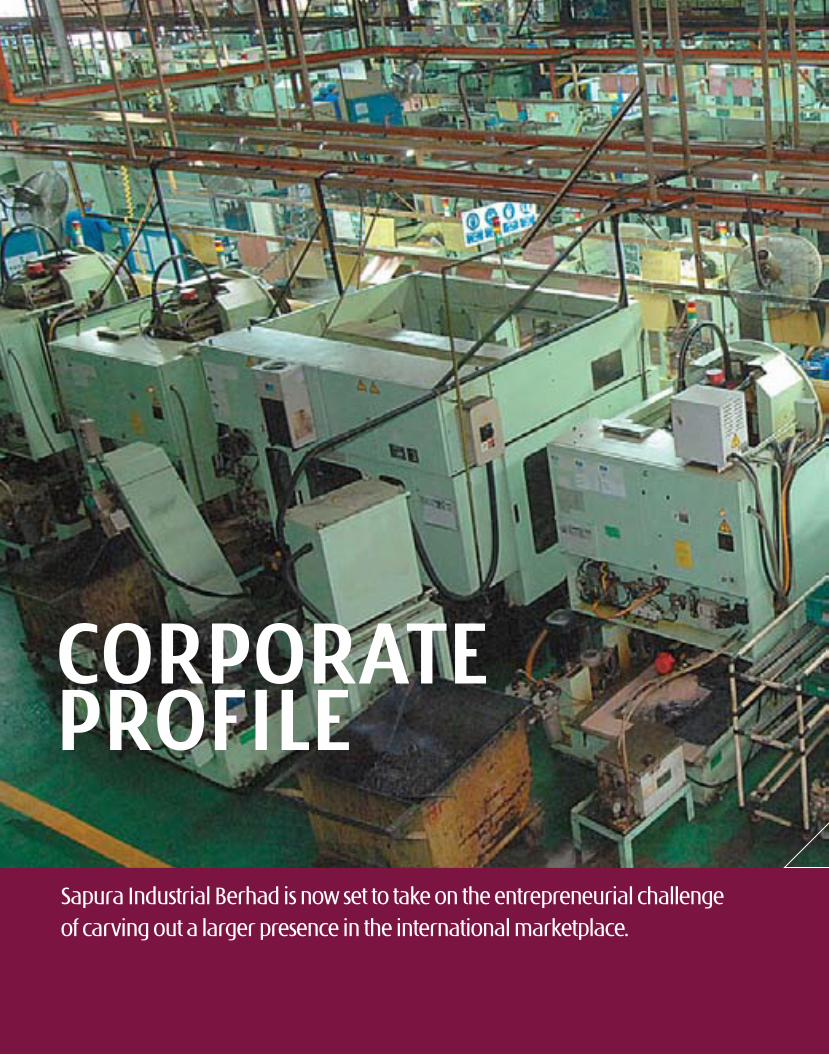
CORPORATE PROFILE
Sapura Industrial Berhad is now set to take on the entrepreneurial challenge of carving out a larger presence in the international marketplace.
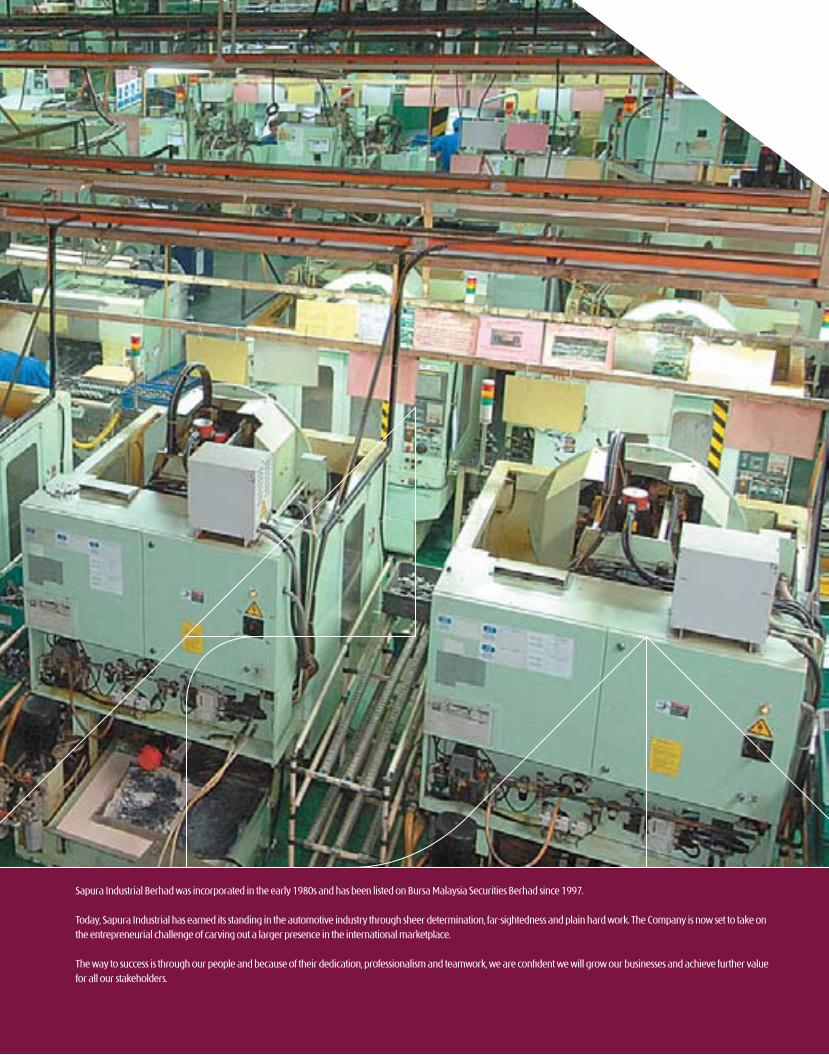
Sapura Industrial Berhad was incorporated in the early 1980s and has been listed on Bursa Malaysia Securities Berhad since 1997.
Today, Sapura Industrial has earned its standing in the automotive industry through sheer determination, far-sightedness and plain hard work. The Company is now set to take on the entrepreneurial challenge of carving out a larger presence in the international marketplace.
The way to success is through our people and because of their dedication, professionalism and teamwork, we are confident we will grow our businesses and achieve further value for all our stakeholders.
6 Sapura Industrial BerhadAnnual Report 2011
BOARD OF DIRECTORSTan Sri Dato’ Seri Ir. Shamsuddin bin Abdul KadirChairmanNon-Independent Non-Executive Director
Datuk Shahril bin ShamsuddinDeputy ChairmanNon-Independent Non-Executive Director
Shahriman bin ShamsuddinExecutive Director
Dato’ Azlan bin HashimNon-Independent Non-Executive Director
Datuk Kisai bin RahmatIndependent Non-Executive Director
Shah Hakim bin ZainIndependent Non-Executive Director
Ir. Md. Shah bin HussinNon-Independent Non-Executive Director
Wan Ahamad Sabri bin Wan DaudIndependent Non-Executive Director
AUDIT COMMITTEEDatuk Kisai bin RahmatChairmanIndependent Non-Executive Director
Dato’ Azlan bin HashimNon-Independent Non-Executive Director
Wan Ahamad Sabri bin Wan DaudIndependent Non-Executive Director
BOARD NOMINATION AND REMUNERATIONCOMMITTEETan Sri Dato’ Seri Ir. Shamsuddin bin Abdul KadirChairmanNon-Independent Non-Executive Director
Datuk Kisai bin Rahmat Independent Non-Executive Director
Wan Ahamad Sabri bin Wan DaudIndependent Non-Executive Director
DIRECTOR IN CHARGE OF SHAREHOLDERS’COMMUNICATIONSDatuk Kisai bin RahmatSenior Independent Non-Executive Director
Mail to:Lot 2 & 4, Jalan P/11, Seksyen 10Kawasan Perindustrian Bangi43650 Bandar Baru BangiSelangor Darul Ehsan
COMPANY SECRETARYLiyana Lee binti Abdullah(MIA No: 10293)
REGISTERED OFFICELot 2 & 4, Jalan P/11, Seksyen 10Kawasan Perindustrian Bangi43650 Bandar Baru BangiSelangor Darul EhsanTel : 603-8925 6011Fax : 603-8925 8292
AUDITORSErnst & YoungChartered AccountantsLevel 23A, Menara MileniumJalan DamanlelaPusat Bandar Damansara50490 Kuala LumpurTel : 603-7495 8000Fax : 603-7495 7959
SHARE REGISTRARTricor Investor Services Sdn. Bhd. Level 17, The Gardens North TowerMid Valley CityLingkaran Syed Putra59200 Kuala LumpurTel : 603-2264 3883Fax : 603-2282 1886
STOCK EXCHANGE LISTINGThe Main Board of Bursa MalaysiaStock Name : SAPINDStock Code : 7811
CORPORATE INFORMATION
7 Sapura Industrial BerhadAnnual Report 2011
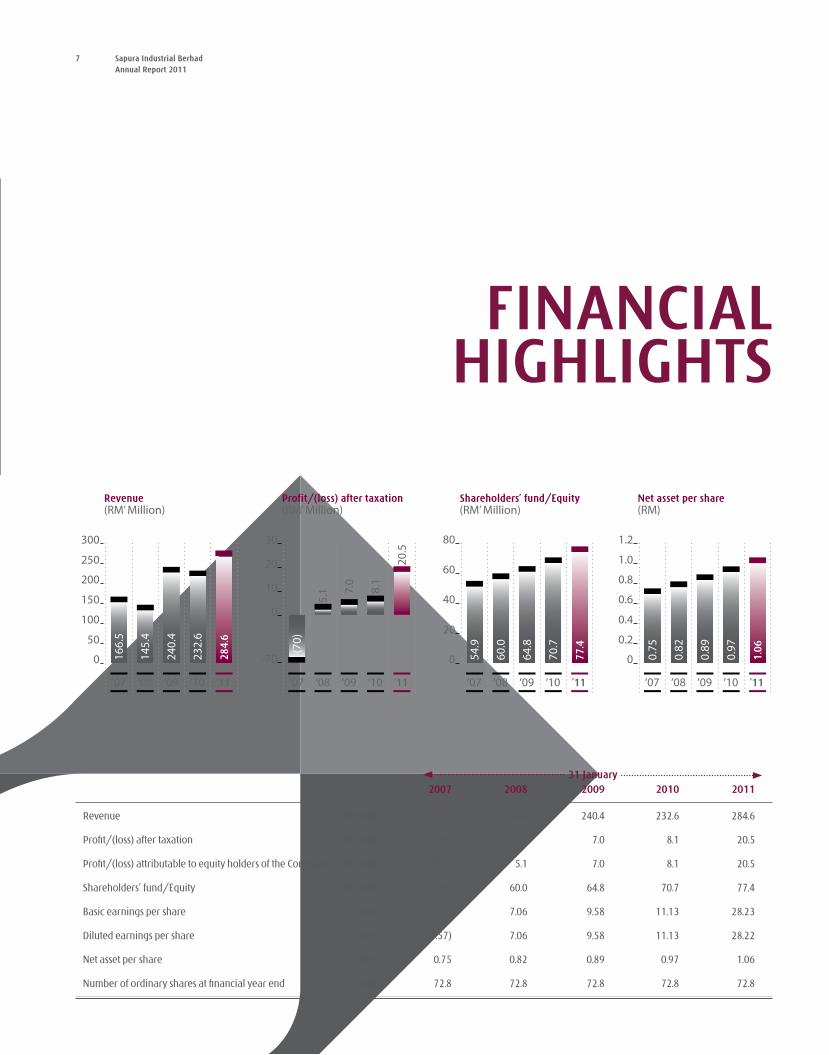
FINANCIAL HIGHLIGHTS
31 January 2007 2008 2009 2010 2011
Revenue (RM’mil) 166.5 145.4 240.4 232.6 284.6
Profit/(loss) after taxation (RM’mil) (70.0) 5.1 7.0 8.1 20.5
Profit/(loss) attributable to equity holders of the Company (RM’mil) (57.9) 5.1 7.0 8.1 20.5
Shareholders’ fund/Equity (RM’mil) 54.9 60.0 64.8 70.7 77.4
Basic earnings per share (sen) (79.57) 7.06 9.58 11.13 28.23
Diluted earnings per share (sen) (79.57) 7.06 9.58 11.13 28.22
Net asset per share (RM) 0.75 0.82 0.89 0.97 1.06
Number of ordinary shares at financial year end (’mil) 72.8 72.8 72.8 72.8 72.8
Revenue (RM’ Million)
‘07
0
100
50
150
250
200
300
-70
0
10
20
30
166.
5
‘08
145.
4
‘09
240.
4
‘10
232.
6
‘11
284.
6
Profit/(loss) after taxation (RM’ Million)
‘07
(70)
‘08
5.1
‘09
7.0
‘10
8.1
‘11
20.5
Shareholders’ fund/Equity (RM’ Million)
‘07
0
20
40
60
80
54.9
‘08
60.0
‘09
64.8
‘10
70.7
‘11
77.4
0
Net asset per share(RM)
‘07
0.2
0.4
0.8
0.6
1.0
1.2
0.75
‘080.
82‘09
0.89
‘10
0.97
‘11
1.06
8 Sapura Industrial BerhadAnnual Report 2011
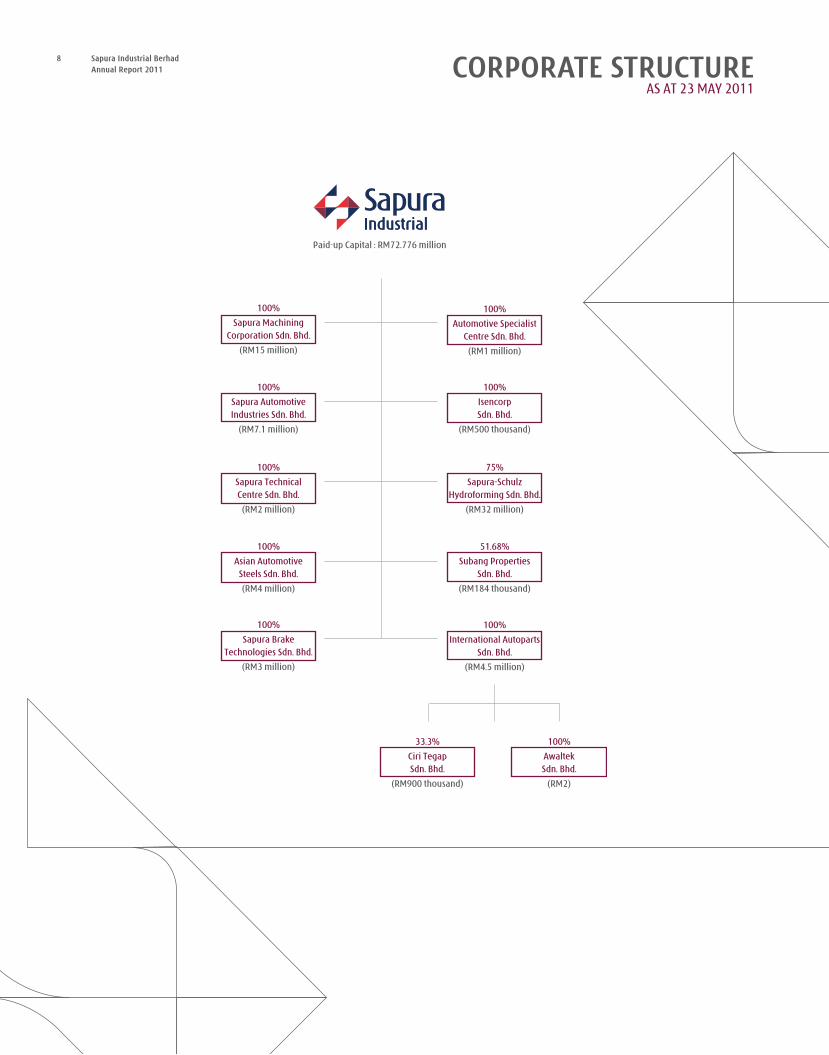
100%
AwaltekSdn. Bhd.
(RM2)
33.3%
Ciri TegapSdn. Bhd.
(RM900 thousand)
100%
International AutopartsSdn. Bhd.
(RM4.5 million)
51.68%
Subang PropertiesSdn. Bhd.
(RM184 thousand)
75%
Sapura-SchulzHydroforming Sdn. Bhd.
(RM32 million)
100%
IsencorpSdn. Bhd.
(RM500 thousand)
100%
Sapura BrakeTechnologies Sdn. Bhd.
(RM3 million)
100%
Asian AutomotiveSteels Sdn. Bhd.
(RM4 million)
100%
Sapura TechnicalCentre Sdn. Bhd.
(RM2 million)
100%
Sapura Automotive Industries Sdn. Bhd.
(RM7.1 million)
100%
Sapura MachiningCorporation Sdn. Bhd.
(RM15 million)
Paid-up Capital : RM72.776 million
100%
Automotive SpecialistCentre Sdn. Bhd.
(RM1 million)
CORPORATE STRUCTUREAS AT 23 MAY 2011
9 Sapura Industrial BerhadAnnual Report 2011
10 Sapura Industrial BerhadAnnual Report 2011

11 Sapura Industrial BerhadAnnual Report 2011
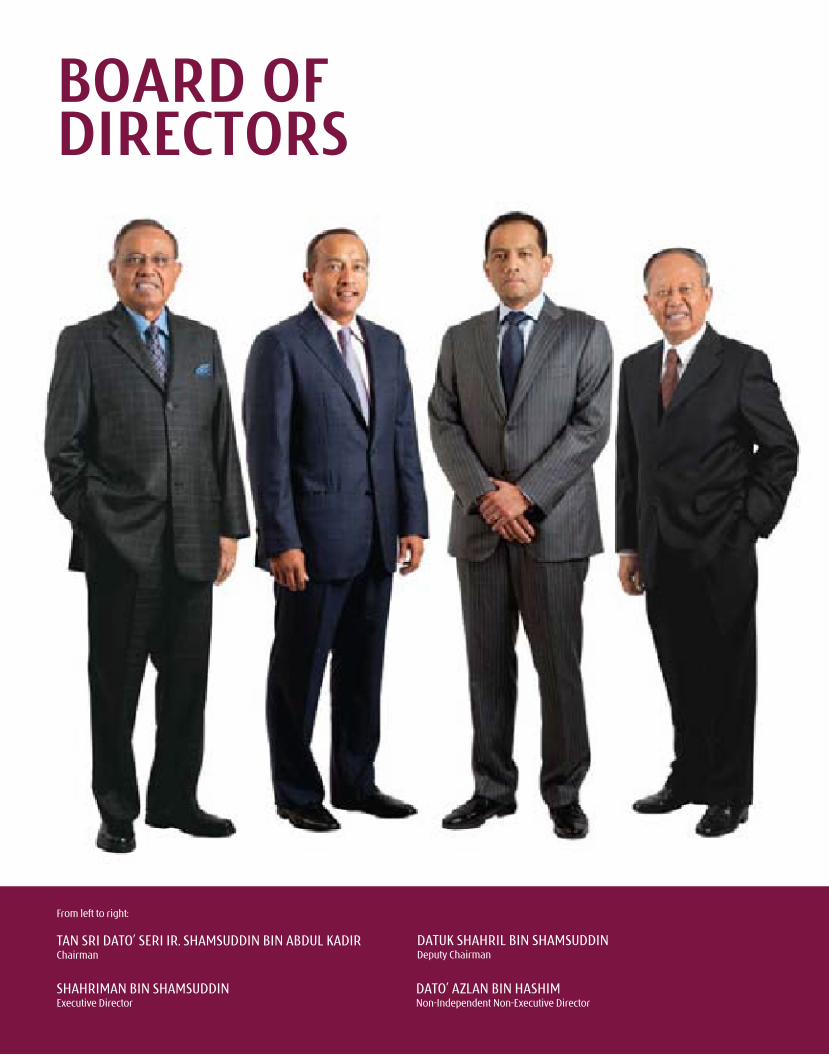
BOARD OF DIRECTORS
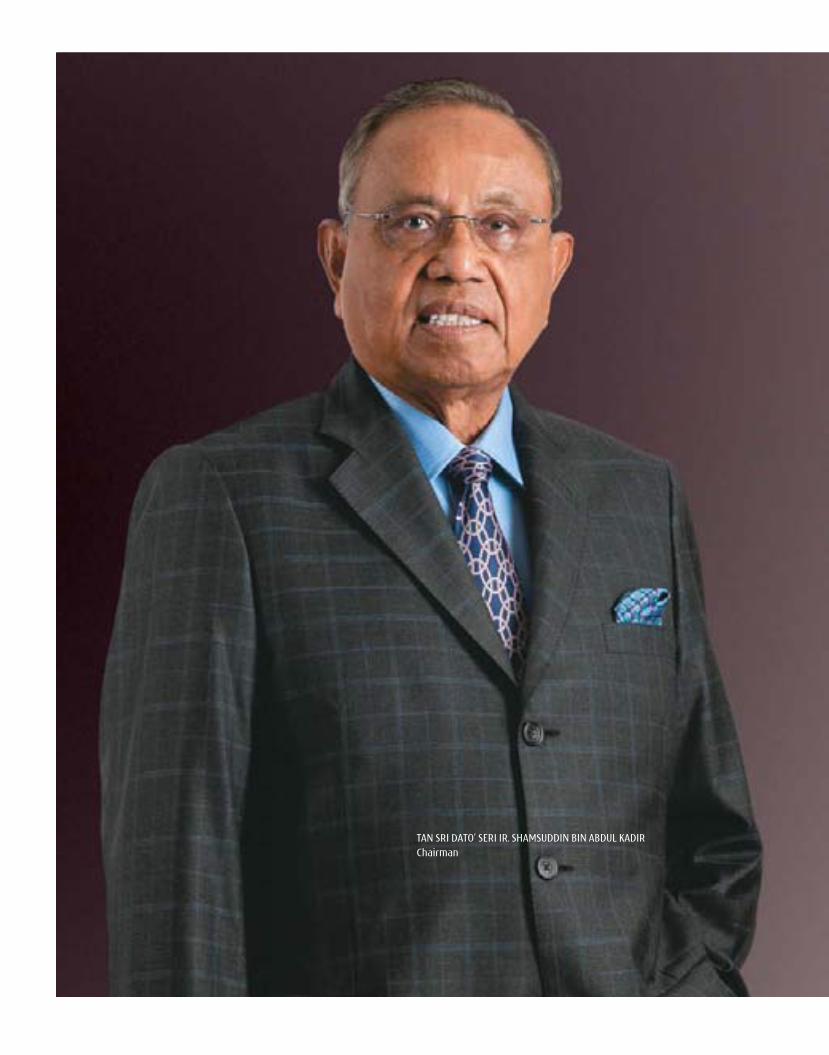
TAN SRI DATO’ SERI IR. SHAMSuDDIN BIN ABDuL KADIRChairman
DATuK SHAHRIL BIN SHAMSuDDINDeputy Chairman
SHAHRIMAN BIN SHAMSuDDINExecutive Director
DATO’ AZLAN BIN HASHIM Non-Independent Non-Executive Director
From left to right:
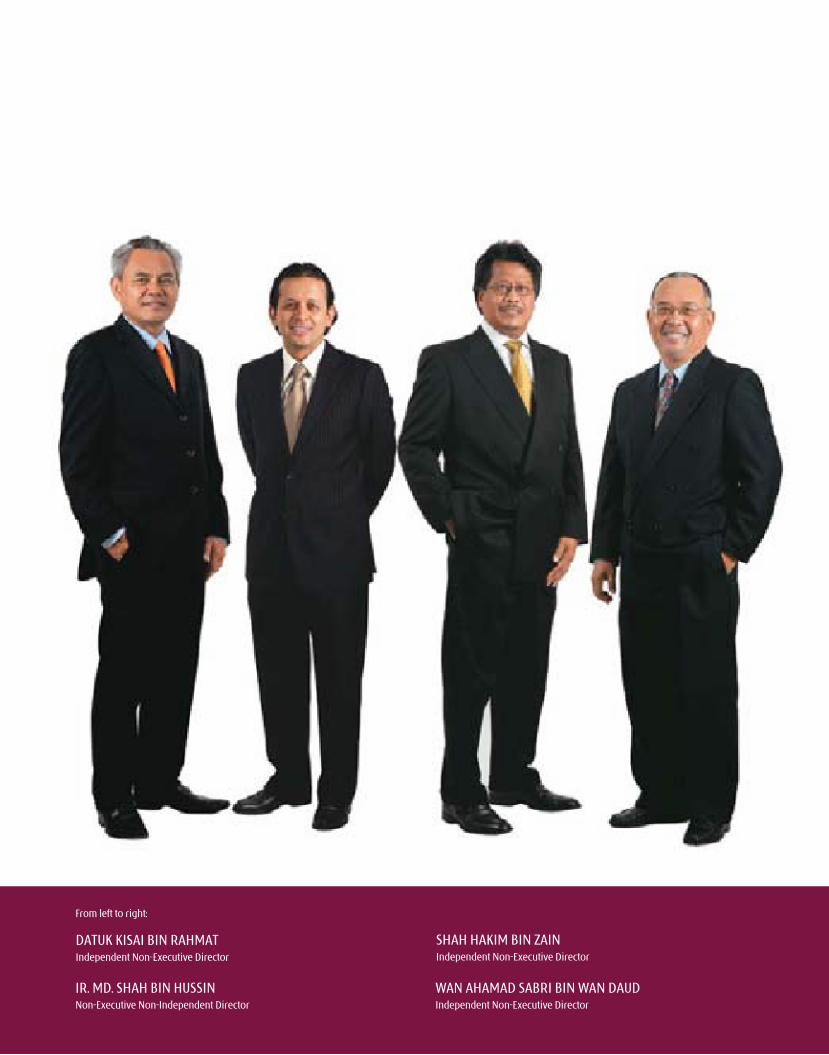
IR. MD. SHAH BIN HuSSIN Non-Executive Non-Independent Director
SHAH HAKIM BIN ZAIN Independent Non-Executive Director
DATuK KISAI BIN RAHMATIndependent Non-Executive Director
WAN AHAMAD SABRI BIN WAN DAuDIndependent Non-Executive Director
From left to right:
14 Sapura Industrial BerhadAnnual Report 2011 DIRECTORS’ PROFILE
15 Sapura Industrial BerhadAnnual Report 2011
TAN SRI DATO’ SERI IR. SHAMSuDDINBIN ABDuL KADIR(Non-Independent Non-Executive Chairman)PSM, SPCM, DPMJ, DPCM, JMN, Hon. F. IEM, F.A. Sc. C.Eng.,D.Sc. (Mgmt Tech) (Hon) (uTM), D.Eng. (Hon) (uSM), DBA (Hon) (uKM), P Eng, MIE (MAL) M.I.E.E. (uK), M.I.MAR.E (uK)
YBhg Tan Sri Dato’ Seri Ir. Shamsuddin bin Abdul Kadir, aged 79, a Malaysian, is the Chairman and Founder of the Sapura Group, which he established in 1975. Well into its 36th year, the Sapura Group has since diversified and currently participates in key industries through three public listed companies. Tan Sri is the Chairman of Sapura Industrial Berhad and Sapura Resources Berhad.
Tan Sri Shamsuddin was first appointed to the Board of Sapura Industrial Berhad on 12 March 1974. He is also the Chairman of the Board Nomination and Remuneration Committee of the Company.
Tan Sri Shamsuddin received his tertiary education from Brighton Technical College in the united Kingdom, after which he held various key positions in Telekom Malaysia. Tan Sri Shamsuddin turned his vision into reality when he accepted a challenge to start a business on a turnkey project offered by Jabatan Telekom, now known as TM. The Sapura Group was born from his passion as an engineer, coupled with a strong spirit of entrepreneurship both of which are apparent in his management philosophy. Tan Sri Shamsuddin has led the Sapura Group into what is now a leading knowledge and technology company in Malaysia, with an ever-increasing global reach.
Tan Sri Shamsuddin’s strong commitment to life-long education led him to co-found the university Tun Hussein Onn Malaysia Foundation where he had served as Chairman of university Tun Hussein Onn Malaysia (uTHM) from 16 April 2001 to 15 April 2009. In recognition of his guidance and leadership at uTHM, Tan Sri Shamsuddin was inaugurated as the first Pro Chancellor of uTHM in June 2009. For his numerous contributions, he has been awarded with Honorary Doctorates by universiti Teknologi Malaysia, universiti Sains Malaysia and universiti Kebangsaan Malaysia. In 2007, university of Brighton, united Kingdom conferred the Honorary Degree of Doctor of Science to Tan Sri Shamsuddin in recognition of his outstanding contribution to engineering development in Malaysia and the development of the Alumni Association of Malaysia. Tan Sri Shamsuddin is also a member of the Majlis of International Islamic university Malaysia (IIuM), in which he is the Representative of The Malaysian Public of Vast Experience with Higher Education or Professional Management.
Tan Sri Shamsuddin contributes his time and effort in sharing his experience and knowledge for various causes. He is a member of the Institution of Engineers Malaysia, a member of the Malaysian Industry-Government Group for High Technology (MIGHT) as well as a senior fellow of Academy of Science Malaysia. In conjunction with uMNO’s 60th Anniversary Celebrations in 2006, Tan Sri Shamsuddin was conferred with the prestigious “Malay Personality of Distinction” award. He was also a recipient of the “Jewels of Muslim World” award conferred by OIC Today Magazine in collaboration with OIC International Business Centre, for his contributions in the development of the Malaysian and muslim world economy.
16 Sapura Industrial BerhadAnnual Report 2011 DIRECTORS’ PROFILE (cont’d)
17 Sapura Industrial BerhadAnnual Report 2011
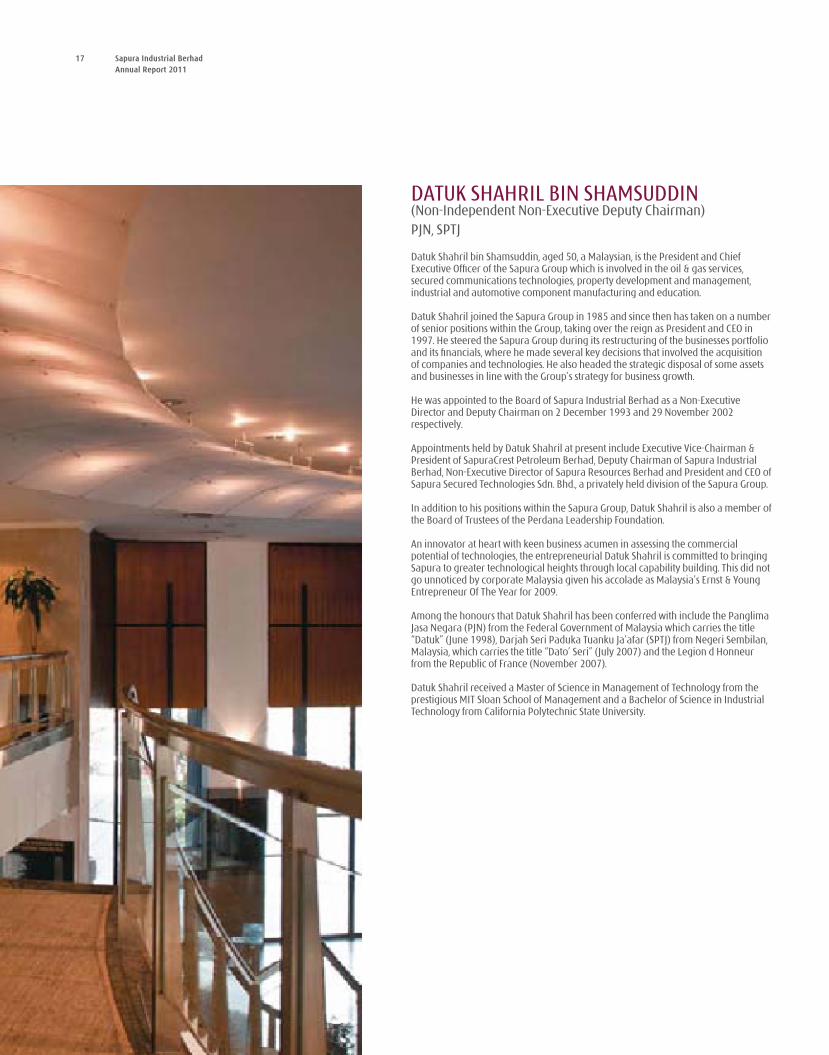
DATuK SHAHRIL BIN SHAMSuDDIN(Non-Independent Non-Executive Deputy Chairman)PJN, SPTJ
Datuk Shahril bin Shamsuddin, aged 50, a Malaysian, is the President and Chief Executive Officer of the Sapura Group which is involved in the oil & gas services, secured communications technologies, property development and management, industrial and automotive component manufacturing and education.
Datuk Shahril joined the Sapura Group in 1985 and since then has taken on a number of senior positions within the Group, taking over the reign as President and CEO in 1997. He steered the Sapura Group during its restructuring of the businesses portfolio and its financials, where he made several key decisions that involved the acquisition of companies and technologies. He also headed the strategic disposal of some assets and businesses in line with the Group’s strategy for business growth.
He was appointed to the Board of Sapura Industrial Berhad as a Non-Executive Director and Deputy Chairman on 2 December 1993 and 29 November 2002 respectively.
Appointments held by Datuk Shahril at present include Executive Vice-Chairman & President of SapuraCrest Petroleum Berhad, Deputy Chairman of Sapura Industrial Berhad, Non-Executive Director of Sapura Resources Berhad and President and CEO of Sapura Secured Technologies Sdn. Bhd., a privately held division of the Sapura Group.
In addition to his positions within the Sapura Group, Datuk Shahril is also a member of the Board of Trustees of the Perdana Leadership Foundation.
An innovator at heart with keen business acumen in assessing the commercial potential of technologies, the entrepreneurial Datuk Shahril is committed to bringing Sapura to greater technological heights through local capability building. This did not go unnoticed by corporate Malaysia given his accolade as Malaysia’s Ernst & Young Entrepreneur Of The Year for 2009.
Among the honours that Datuk Shahril has been conferred with include the Panglima Jasa Negara (PJN) from the Federal Government of Malaysia which carries the title “Datuk” (June 1998), Darjah Seri Paduka Tuanku Ja’afar (SPTJ) from Negeri Sembilan, Malaysia, which carries the title “Dato’ Seri” (July 2007) and the Legion d Honneur from the Republic of France (November 2007).
Datuk Shahril received a Master of Science in Management of Technology from the prestigious MIT Sloan School of Management and a Bachelor of Science in Industrial Technology from California Polytechnic State university.
18 Sapura Industrial BerhadAnnual Report 2011 DIRECTORS’ PROFILE (cont’d)
19 Sapura Industrial BerhadAnnual Report 2011
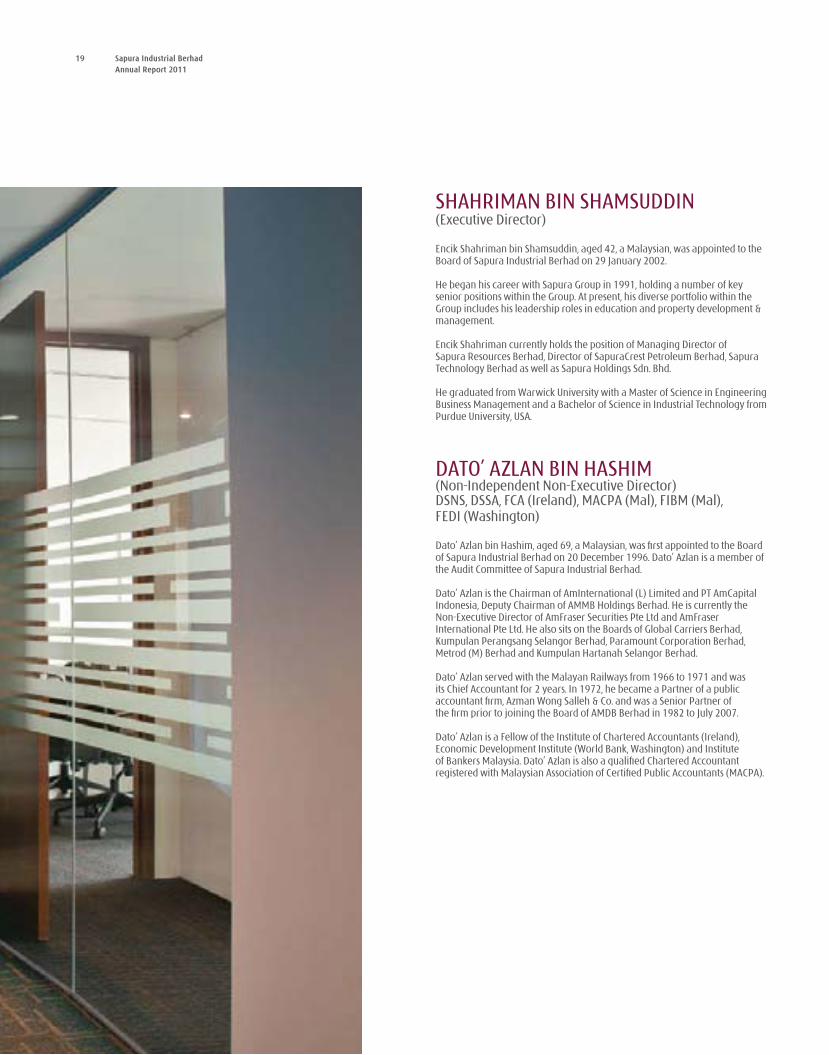
SHAHRIMAN BIN SHAMSuDDIN(Executive Director) Encik Shahriman bin Shamsuddin, aged 42, a Malaysian, was appointed to the Board of Sapura Industrial Berhad on 29 January 2002.
He began his career with Sapura Group in 1991, holding a number of key senior positions within the Group. At present, his diverse portfolio within the Group includes his leadership roles in education and property development & management.
Encik Shahriman currently holds the position of Managing Director of Sapura Resources Berhad, Director of SapuraCrest Petroleum Berhad, Sapura Technology Berhad as well as Sapura Holdings Sdn. Bhd.
He graduated from Warwick university with a Master of Science in Engineering Business Management and a Bachelor of Science in Industrial Technology from Purdue university, uSA.
DATO’ AZLAN BIN HASHIM (Non-Independent Non-Executive Director)DSNS, DSSA, FCA (Ireland), MACPA (Mal), FIBM (Mal), FEDI (Washington)
Dato’ Azlan bin Hashim, aged 69, a Malaysian, was first appointed to the Board of Sapura Industrial Berhad on 20 December 1996. Dato’ Azlan is a member of the Audit Committee of Sapura Industrial Berhad.
Dato’ Azlan is the Chairman of AmInternational (L) Limited and PT AmCapital Indonesia, Deputy Chairman of AMMB Holdings Berhad. He is currently the Non-Executive Director of AmFraser Securities Pte Ltd and AmFraser International Pte Ltd. He also sits on the Boards of Global Carriers Berhad, Kumpulan Perangsang Selangor Berhad, Paramount Corporation Berhad, Metrod (M) Berhad and Kumpulan Hartanah Selangor Berhad.
Dato’ Azlan served with the Malayan Railways from 1966 to 1971 and was its Chief Accountant for 2 years. In 1972, he became a Partner of a public accountant firm, Azman Wong Salleh & Co. and was a Senior Partner of the firm prior to joining the Board of AMDB Berhad in 1982 to July 2007.
Dato’ Azlan is a Fellow of the Institute of Chartered Accountants (Ireland), Economic Development Institute (World Bank, Washington) and Institute of Bankers Malaysia. Dato’ Azlan is also a qualified Chartered Accountant registered with Malaysian Association of Certified Public Accountants (MACPA).
20 Sapura Industrial BerhadAnnual Report 2011 DIRECTORS’ PROFILEDIRECTORS’ PROFILE (cont’d)
21 Sapura Industrial BerhadAnnual Report 2011
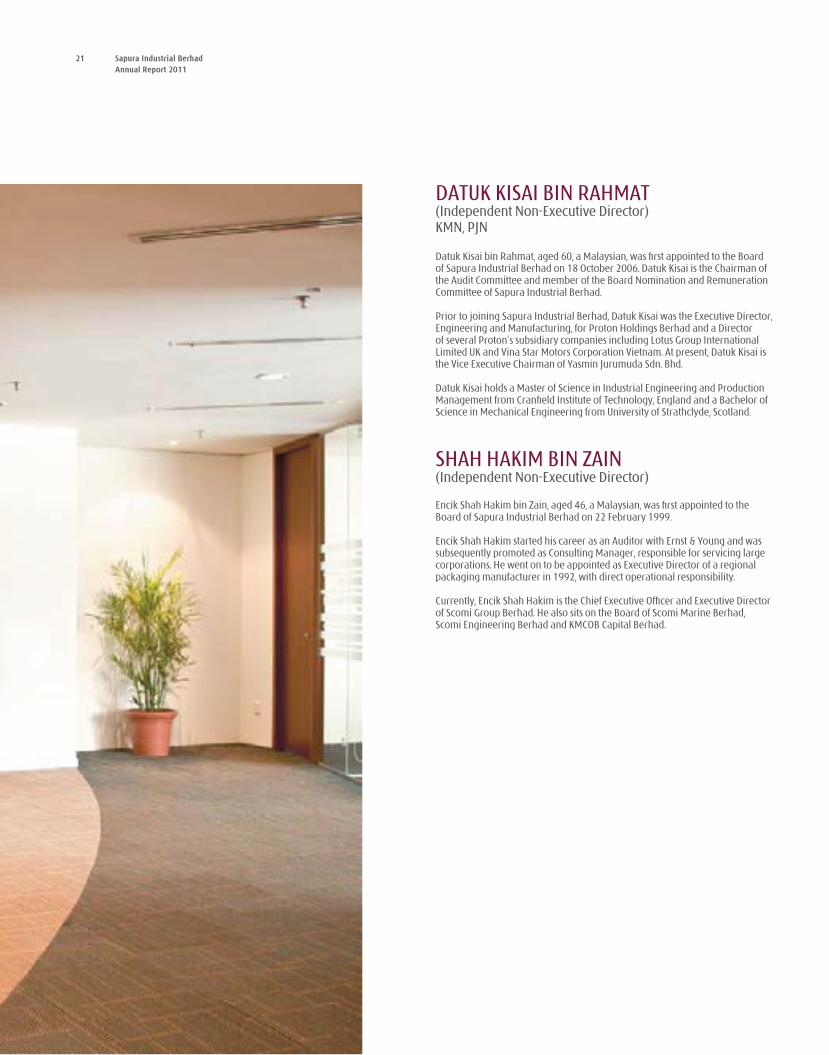
DATuK KISAI BIN RAHMAT(Independent Non-Executive Director) KMN, PJN
Datuk Kisai bin Rahmat, aged 60, a Malaysian, was first appointed to the Board of Sapura Industrial Berhad on 18 October 2006. Datuk Kisai is the Chairman of the Audit Committee and member of the Board Nomination and Remuneration Committee of Sapura Industrial Berhad. Prior to joining Sapura Industrial Berhad, Datuk Kisai was the Executive Director, Engineering and Manufacturing, for Proton Holdings Berhad and a Director of several Proton’s subsidiary companies including Lotus Group International Limited uK and Vina Star Motors Corporation Vietnam. At present, Datuk Kisai is the Vice Executive Chairman of Yasmin Jurumuda Sdn. Bhd.
Datuk Kisai holds a Master of Science in Industrial Engineering and Production Management from Cranfield Institute of Technology, England and a Bachelor of Science in Mechanical Engineering from university of Strathclyde, Scotland.
SHAH HAKIM BIN ZAIN(Independent Non-Executive Director)
Encik Shah Hakim bin Zain, aged 46, a Malaysian, was first appointed to the Board of Sapura Industrial Berhad on 22 February 1999. Encik Shah Hakim started his career as an Auditor with Ernst & Young and was subsequently promoted as Consulting Manager, responsible for servicing large corporations. He went on to be appointed as Executive Director of a regional packaging manufacturer in 1992, with direct operational responsibility.
Currently, Encik Shah Hakim is the Chief Executive Officer and Executive Director of Scomi Group Berhad. He also sits on the Board of Scomi Marine Berhad, Scomi Engineering Berhad and KMCOB Capital Berhad.
22 Sapura Industrial BerhadAnnual Report 2011 DIRECTORS’ PROFILE (cont’d)
23 Sapura Industrial BerhadAnnual Report 2011
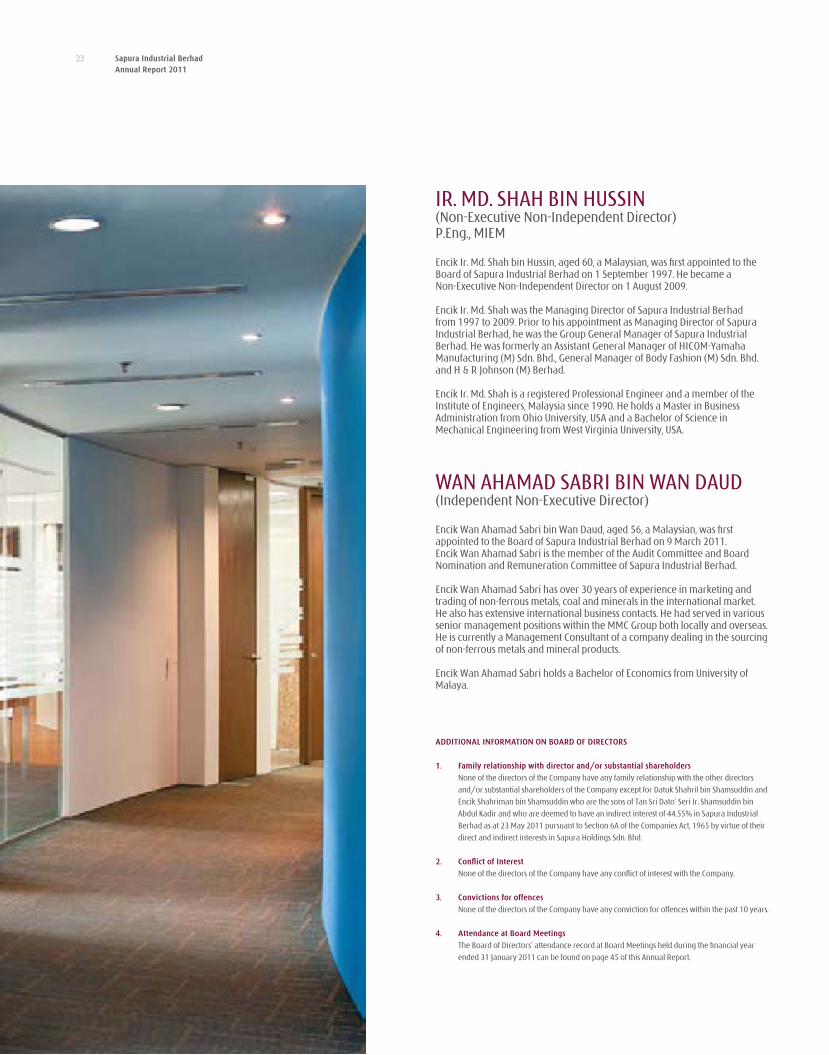
IR. MD. SHAH BIN HuSSIN (Non-Executive Non-Independent Director)P.Eng., MIEM
Encik Ir. Md. Shah bin Hussin, aged 60, a Malaysian, was first appointed to the Board of Sapura Industrial Berhad on 1 September 1997. He became a Non-Executive Non-Independent Director on 1 August 2009.
Encik Ir. Md. Shah was the Managing Director of Sapura Industrial Berhad from 1997 to 2009. Prior to his appointment as Managing Director of Sapura Industrial Berhad, he was the Group General Manager of Sapura Industrial Berhad. He was formerly an Assistant General Manager of HICOM-Yamaha Manufacturing (M) Sdn. Bhd., General Manager of Body Fashion (M) Sdn. Bhd. and H & R Johnson (M) Berhad.
Encik Ir. Md. Shah is a registered Professional Engineer and a member of the Institute of Engineers, Malaysia since 1990. He holds a Master in Business Administration from Ohio university, uSA and a Bachelor of Science in Mechanical Engineering from West Virginia university, uSA.
WAN AHAMAD SABRI BIN WAN DAuD(Independent Non-Executive Director)
Encik Wan Ahamad Sabri bin Wan Daud, aged 56, a Malaysian, was first appointed to the Board of Sapura Industrial Berhad on 9 March 2011. Encik Wan Ahamad Sabri is the member of the Audit Committee and Board Nomination and Remuneration Committee of Sapura Industrial Berhad. Encik Wan Ahamad Sabri has over 30 years of experience in marketing and trading of non-ferrous metals, coal and minerals in the international market. He also has extensive international business contacts. He had served in various senior management positions within the MMC Group both locally and overseas. He is currently a Management Consultant of a company dealing in the sourcing of non-ferrous metals and mineral products.
Encik Wan Ahamad Sabri holds a Bachelor of Economics from university of Malaya.
ADDITIONAL INFORMATION ON BOARD OF DIRECTORS
1. Family relationship with director and/or substantial shareholders None of the directors of the Company have any family relationship with the other directors
and/or substantial shareholders of the Company except for Datuk Shahril bin Shamsuddin and
Encik Shahriman bin Shamsuddin who are the sons of Tan Sri Dato’ Seri Ir. Shamsuddin bin
Abdul Kadir and who are deemed to have an indirect interest of 44.55% in Sapura Industrial
Berhad as at 23 May 2011 pursuant to Section 6A of the Companies Act, 1965 by virtue of their
direct and indirect interests in Sapura Holdings Sdn. Bhd.
2. Conflict of Interest None of the directors of the Company have any conflict of interest with the Company.
3. Convictions for offences None of the directors of the Company have any conviction for offences within the past 10 years.
4. Attendance at Board Meetings The Board of Directors’ attendance record at Board Meetings held during the financial year
ended 31 January 2011 can be found on page 45 of this Annual Report.
23
24 Sapura Industrial BerhadAnnual Report 2011
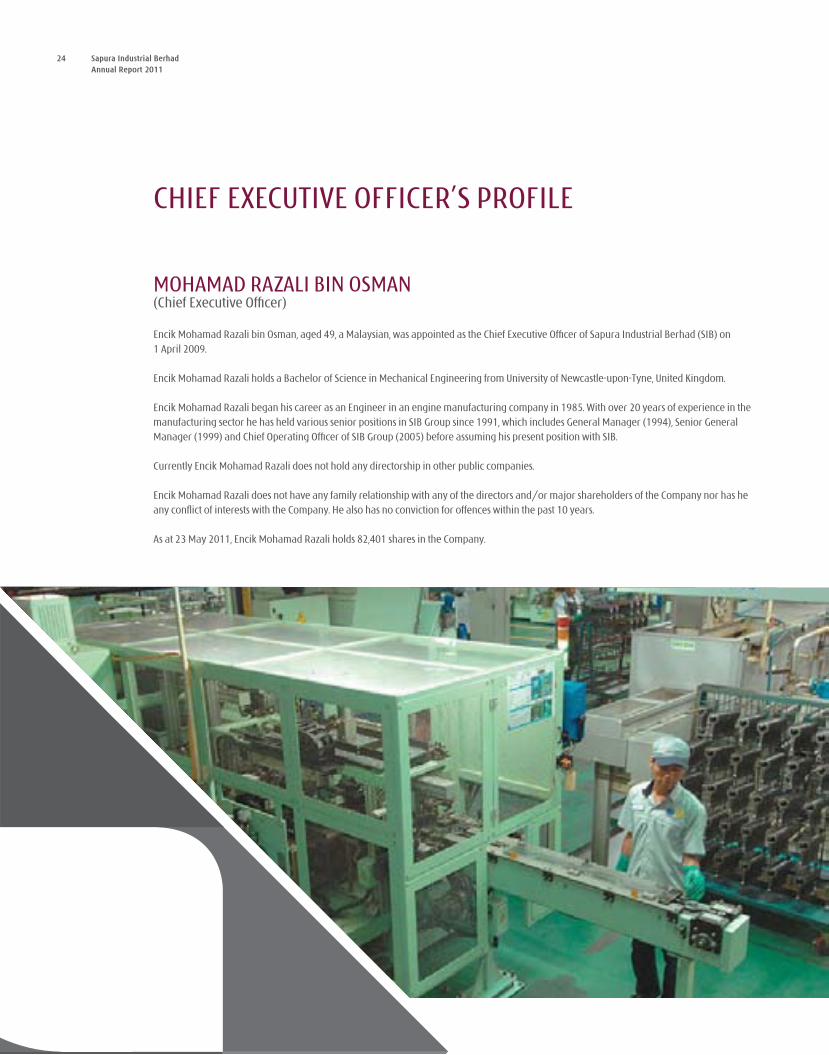
MOHAMAD RAZALI BIN OSMAN (Chief Executive Officer)
Encik Mohamad Razali bin Osman, aged 49, a Malaysian, was appointed as the Chief Executive Officer of Sapura Industrial Berhad (SIB) on 1 April 2009.
Encik Mohamad Razali holds a Bachelor of Science in Mechanical Engineering from university of Newcastle-upon-Tyne, united Kingdom.
Encik Mohamad Razali began his career as an Engineer in an engine manufacturing company in 1985. With over 20 years of experience in the manufacturing sector he has held various senior positions in SIB Group since 1991, which includes General Manager (1994), Senior General Manager (1999) and Chief Operating Officer of SIB Group (2005) before assuming his present position with SIB.
Currently Encik Mohamad Razali does not hold any directorship in other public companies.
Encik Mohamad Razali does not have any family relationship with any of the directors and/or major shareholders of the Company nor has he any conflict of interests with the Company. He also has no conviction for offences within the past 10 years.
As at 23 May 2011, Encik Mohamad Razali holds 82,401 shares in the Company.
CHIEF ExECuTIVE OFFICER’S PROFILE
25 Sapura Industrial BerhadAnnual Report 2011

26 Sapura Industrial BerhadAnnual Report 2011
27 Sapura Industrial BerhadAnnual Report 2011
28 Sapura Industrial BerhadAnnual Report 2011
“Building on Values”TAN SRI DATO’ SERI IR. SHAMSuDDIN BIN ABDuL KADIRChairman
29 Sapura Industrial BerhadAnnual Report 2011
CHAIRMAN’S STATEMENT
Dear Shareholders,Sapura Industrial Berhad (“Sapura Industrial” or “the Group”) has sustained its positive growth momentum during the financial year ended 31 January 2011 (“FY2011”).
We achieved our record results during the year under review on the back of a recovering Malaysian economy which saw the local automobile market experience a significant rebound. This has and will continue to bode well for us as the leading automotive parts and components maker in the country.
Despite the positive business environment, the Group is aware that we cannot rely purely on market trends to fuel our growth especially given the highly competitive nature of our business. Therefore, we took strategic steps to empower our potential in the three core aspects of our business, namely our commercial, technical and operational capabilities during the year under review. With these prudent moves, we have further strengthened the Group’s competitive edge and market position and with the momentum established, we will continue to make progress in growing our business.
On this positive note and on behalf of the Board of Directors, I am pleased to present this Annual Report and the Audited Financial Statements of Sapura Industrial for the financial year ended 31 January 2011.
OPERATING ENVIRONMENT
In 2010, the global economy generally took a turn for the better, charting a record-breaking 14.5% increase in the volume of exports worldwide in 2010. (Source: World Trade Organisation) Nevertheless, there were lingering concerns of a double-dip recession as a result of slower growth in the united States and the precarious state of financial institutions in select European nations.
However, in Asia Pacific the situation could not have been more different. The region rebounded aggressively across the board with robust economic activity. Closer to home, the Malaysian economy experienced a strong resumption of growth in 2010 growing by a remarkable 7.2% led by both the private and public sectors. (Source: Bank Negara Malaysia) Clearly, this is a reflection of how the Government’s pro-active measures to jumpstart the economy during the global economic meltdown has safeguarded the livelihoods of businesses and individuals in our country.
30 Sapura Industrial BerhadAnnual Report 2011 CHAIRMAN’S STATEMENT
The improved economic landscape in Malaysia also created increasing business and consumer confidence. This in turn positively impacted the Malaysian automotive industry. After an extended lull period during the economic downturn, registration of new motor vehicles in Malaysia grew by a considerable 12.7%, hitting 605,156 units in total industry volume (“TIV”) for 2010 compared to the 536,905 sold in 2009. This signifies the highest ever number of units sold surpassing the previous high of 552,316 units in 2005. (Source: Malaysia Automotive Association) The higher number of vehicles sold has correlated directly with increased demand for parts and components, thus benefiting the Group directly.
FINANCIAL PERFORMANCE
The rebounding economy and surging world trade activity had a positive impact on the Group’s fiscal health during the year under review. As such, the Group registered a turnover of RM284.6 million, against RM232.6 million registered the previous year marking a 22% increase in revenue.
For the year under review, the Group registered a record profit after tax of RM20.5 million, this signifies a substantial 153% jump compared to the RM8.1 million recorded in the previous financial year. This performance marks four consecutive years of continuous improvement for the Group. Consequently, the Group’s earnings per share increased to a new record of 28.23 sen, a 154% increase from FY2010 of 11.13 sen.
These marked improvements were mainly due to the increase in vehicle sales volume as national car makers launched new models. This coupled with the additional components we were contracted to supply during the year under review futher boosted our results. In addition, our continuous cost management efforts bore fruit and impacted the Group’s bottom-line positively.
31 Sapura Industrial BerhadAnnual Report 2011
DIVIDENDS As we improve our operational abilities and strengthen our balance sheet, Sapura Industrial is also mindful of the need to enhance shareholder value. An interim tax exempt dividend of 14 sen per ordinary share in respect of FY2011 was paid on 30 December 2010.
On the strength of the Group’s improved financial performance, the Board of Directors is pleased to propose a single tier final dividend of 13.8 sen per ordinary share in respect of FY2011, subject to the approval of shareholders at the forthcoming Annual General Meeting. If approved, this would bring the total dividend for FY2011 to 27.8 sen per ordinary share.
RESEARCH AND DEVELOPMENT (R&D)
To date, the management continues to make headway on its decision to expand the scope and activities of the Group in terms of technological know-how, capabilities and deliverables. As reported previously, Sapura Industrial had invented some RM6 million under its Technology Development plan to upgrade the Group’s technological capabilities in order to meet global standards.
The investment saw the Group enhancing its technical centre which serves to strengthen the design and development capability of the Group. The centre has been armed with relevant technical expertise, machines and software to undertake R&D activities that include designing, development, analysis, prototyping and testing. This allows the Group to test its new designs in a comprehensive manner before being marketed to customers.
In FY2010, a partnership with universiti Malaysia Pahang (“uMP”) led to the signing of an agreement which paved the way for technological collaboration in the areas of R&D, industrial training and capacity building. We carried out collaborative research on automotive product design, manufacturing skills, techniques and procedures with uMP in FY2011.
32 Sapura Industrial BerhadAnnual Report 2011 CHAIRMAN’S STATEMENT (cont’d)
HUMAN CAPITAL
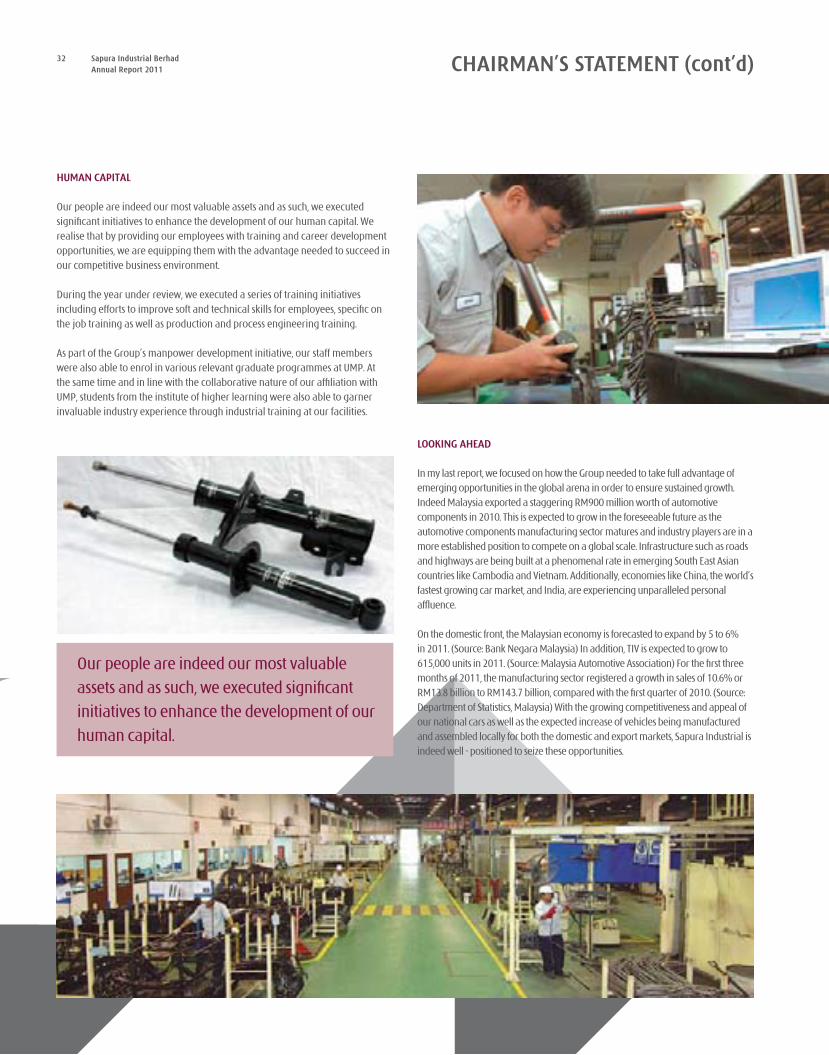
Our people are indeed our most valuable assets and as such, we executed significant initiatives to enhance the development of our human capital. We realise that by providing our employees with training and career development opportunities, we are equipping them with the advantage needed to succeed in our competitive business environment.
During the year under review, we executed a series of training initiatives including efforts to improve soft and technical skills for employees, specific on the job training as well as production and process engineering training.
As part of the Group’s manpower development initiative, our staff members were also able to enrol in various relevant graduate programmes at uMP. At the same time and in line with the collaborative nature of our affiliation with uMP, students from the institute of higher learning were also able to garner invaluable industry experience through industrial training at our facilities.
LOOKING AHEAD
In my last report, we focused on how the Group needed to take full advantage of emerging opportunities in the global arena in order to ensure sustained growth. Indeed Malaysia exported a staggering RM900 million worth of automotive components in 2010. This is expected to grow in the foreseeable future as the automotive components manufacturing sector matures and industry players are in a more established position to compete on a global scale. Infrastructure such as roads and highways are being built at a phenomenal rate in emerging South East Asian countries like Cambodia and Vietnam. Additionally, economies like China, the world’s fastest growing car market, and India, are experiencing unparalleled personal affluence.
On the domestic front, the Malaysian economy is forecasted to expand by 5 to 6% in 2011. (Source: Bank Negara Malaysia) In addition, TIV is expected to grow to 615,000 units in 2011. (Source: Malaysia Automotive Association) For the first three months of 2011, the manufacturing sector registered a growth in sales of 10.6% or RM13.8 billion to RM143.7 billion, compared with the first quarter of 2010. (Source: Department of Statistics, Malaysia) With the growing competitiveness and appeal of our national cars as well as the expected increase of vehicles being manufactured and assembled locally for both the domestic and export markets, Sapura Industrial is indeed well - positioned to seize these opportunities.
Our people are indeed our most valuable
assets and as such, we executed significant
initiatives to enhance the development of our
human capital.
33 Sapura Industrial BerhadAnnual Report 2011
We are focused in our efforts to empower our potential in the domestic and global markets. It is essential that we continue to strive for organic growth by increasing market penetration and obtaining better margins for our services. Consequently, the Group has been focused in improving its potential via strategic investments for its future. Moving forward, the Group will undertake a series of initiatives in line with Sapura Industrial’s Business Strategy to “Be Competitive: Commercially, Technically and Operationally”.
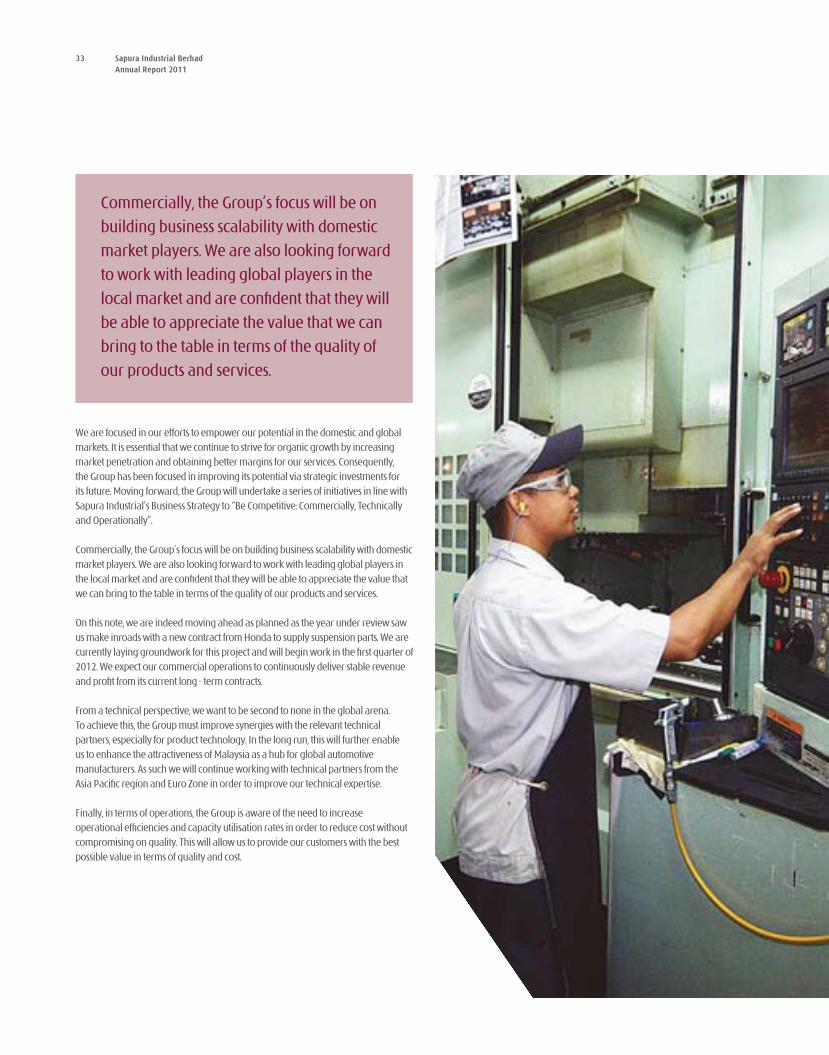
Commercially, the Group’s focus will be on building business scalability with domestic market players. We are also looking forward to work with leading global players in the local market and are confident that they will be able to appreciate the value that we can bring to the table in terms of the quality of our products and services.
On this note, we are indeed moving ahead as planned as the year under review saw us make inroads with a new contract from Honda to supply suspension parts. We are currently laying groundwork for this project and will begin work in the first quarter of 2012. We expect our commercial operations to continuously deliver stable revenue and profit from its current long - term contracts.
From a technical perspective, we want to be second to none in the global arena. To achieve this, the Group must improve synergies with the relevant technical partners, especially for product technology. In the long run, this will further enable us to enhance the attractiveness of Malaysia as a hub for global automotive manufacturers. As such we will continue working with technical partners from the Asia Pacific region and Euro Zone in order to improve our technical expertise.
Finally, in terms of operations, the Group is aware of the need to increase operational efficiencies and capacity utilisation rates in order to reduce cost without compromising on quality. This will allow us to provide our customers with the best possible value in terms of quality and cost.
Commercially, the Group’s focus will be on
building business scalability with domestic
market players. We are also looking forward
to work with leading global players in the
local market and are confident that they will
be able to appreciate the value that we can
bring to the table in terms of the quality of
our products and services.
34 Sapura Industrial BerhadAnnual Report 2011 CHAIRMAN’S STATEMENT (cont’d)
We aim to capitalise on our reputation as an entity synonymous with quality, reliability and service excellence evidenced by our internationally recognised certifications such as TS 16949, ISO 14001 and OHSAS 18001. On this note, the Group is highly conscious of the necessity of investing in our people in terms of improving their knowledge and capability. ultimately it is our staff members who are responsible for the quality of our products and services. Hence, we aim to continue training our staff members through quality improvement initiatives similar to the Malaysia-Japan Automotive Industries Cooperation (MAJAICO) programme which focuses on industrial development and allows our staff members to better understand Japanese manufacturing theory and processes.
As we strive to expand our customer base to include more international players, we expect increased orders from export sales and the rollout of new models from global car makers to improve our capacity utilisation rates to a more competitive and efficient level.
We trust these measures will allow us to strengthen our position on the local front and prepare ourselves for global expansion.
ACKNOWLEDGEMENTS
I am inclined to agree with the saying that excellence is the gradual result of always striving to do better. On this score and on behalf of the Group, I would like to express my sincere appreciation to the management team and our employees for their zealousness and utmost dedication.
We have received unwavering support from our customers, suppliers, financiers, business associates, government agencies and last but not least, our shareholders – a heartfelt thank you to all.
To my fellow Board members, thank you for being a source of wisdom during this past financial year. I would like to take this opportunity to acknowledge the contributions of a fellow Director, Dato’ Mazlin bin Md Junid who has left the Board. His support and input during his time at Sapura Industrial has indeed been invaluable. At the same time, I would like to welcome Wan Ahamad Sabri bin Wan Daud who was appointed as an Independent and Non-Executive Director of the Company on 9 March 2011.
Sapura Industrial’s journey is far from complete with our best years still ahead and I invite you to continue on this journey with us.
TAN SRI DATO’ SERI IR. SHAMSUDDIN BIN ABDUL KADIRChairman
35 Sapura Industrial BerhadAnnual Report 2011
36 Sapura Industrial BerhadAnnual Report 2011
37 Sapura Industrial BerhadAnnual Report 2011
38 Sapura Industrial BerhadAnnual Report 2011
In 2003, Yayasan Shamsuddin Abdul Kadir (YSAK) was established by Sapura
Group’s Chairman and Founder, YBhg Tan Sri Shamsuddin Abdul Kadir. It
became a platform for us to roll out various corporate social responsibility (CSR)
programmes.
This commitment was further strengthened in 2009 when Sapura Community
was launched. With this social club set in motion, we are now able to execute
even more CSR initiatives, all of which are aimed to establish trust and lasting
connections with our surrounding communities as well as to approach CSR as a
family unit. Being a family unit, we are cognisant of the need to look out for one
another and support each other through good times and bad.
Today, as a homegrown entity with global reach, we are keen on expanding
our CSR programmes to empower the potential of the communities we operate
within both locally and internationally. Although our record for CSR is indeed
substantial, we realise that there is always more that can be done.
We believe that we can best enrich lives whether at the workplace or the
communities we operate within based on our three CSR pillars; Education,
Sports Development as well as Community and Nation Building.
We are proud to note that lack of volunteers is something unheard of here
as members of the Sapura family are always keen to participate in voluntary
projects and outreach programmes. Sapura Community organised a blood
donation drive in April 2010 at our headquarters and the event saw many
Sapura employees and senior members of management joining in the spirit of
giving.
Sapura Group is conscious of the importance of spiritual fulfilment, which
is why, come Ramadhan each year, we organise many CSR programmes to
reach out to our communities. With this in mind, we were one of the 34 active
participants of the ‘Sahabat Korporat Tabung Haji’ programme during the
year under review where we extended 100,000 prayer mats in support of the
efforts made by Tabung Haji to alleviate and enhance the experience of Hajj
pilgrims in Malaysia. This is the seventh consecutive year that Sapura Group
has contributed to the programme and we plan to continue supporting Tabung
Haji’s efforts in the years to come.
The holy month of Ramadhan is the perfect time to forge new relationships
and strengthen old ties. In line with this, we held an iftar gathering in August
2010 that saw approximately 600 Muslim and non-Muslim staff members
alike gathered at our headquarters together with 80 orphans for an evening
of fellowship. We also hosted an iftar function for the children of Pusat
Penjagaan Nuri in Setapak. Apart from spending quality time with the
underprivileged children, we also distributed duit raya and donated funds to
facilitate the home’s upgrading work as well as overall maintenance in order
to provide the children with better quality of life. Additionally, the year under
review saw us swinging into action when news of the fire that ravaged the
store room and surau of Rumah Nurul Iman in Manjoi, Ipoh spread, taking it
upon ourselves to sponsor the reconstruction of the affected portion of the
premises.
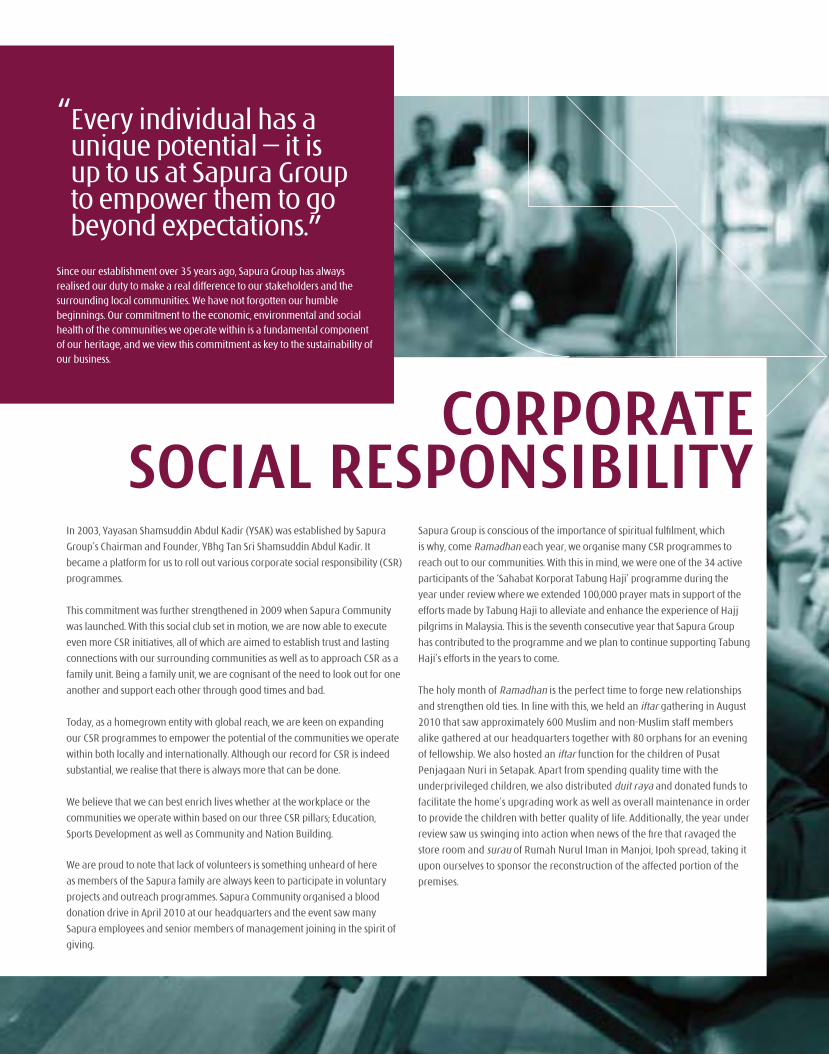
“ Every individual has a unique potential – it is up to us at Sapura Group to empower them to go beyond expectations.”
Since our establishment over 35 years ago, Sapura Group has always realised our duty to make a real difference to our stakeholders and the surrounding local communities. We have not forgotten our humble beginnings. Our commitment to the economic, environmental and social health of the communities we operate within is a fundamental component of our heritage, and we view this commitment as key to the sustainability of our business.
CORPORATE SOCIAL RESPONSIBILITY

39 Sapura Industrial BerhadAnnual Report 2011
40 Sapura Industrial BerhadAnnual Report 2011 CORPORATE SOCIAL RESPONSIBILITY (cont’d)
Every year, we at Sapura Group organise a special umrah trip during Ramadhan
for selected members of the Sapura Community as a way to recognise their hard
work and dedication to the Company. We are honoured to be able to fulfil this
responsibility as a caring corporate citizen, especially to our own community.
This year, 80 Sapura Group members were part of the pilgrimage to Mecca and
Medina to join millions of other Muslims from all over the world.
Hari Raya Aidilfitri is always a time for fun and festivity at Sapura Group. The
year under review saw us hosting a ‘Hari Raya Open House’ for staff and family
members. The celebration was attended by almost 4,500 individuals and was an
excellent opportunity for fellow Sapura Group citizens and their families to bond
in order to strengthen the spirit of camaraderie within the Sapura family.
With the ‘Ipoh Community Centre’ as a flagship programme, special emphasis
is placed on education as we understand the importance of empowering the
potential of the younger generation in order to develop a nation that is globally
competitive. On this premise, the Group is committed to enriching the academic
environment of the country through focused initiatives. We are also mindful that
the opportunity to pursue education in a conducive environment is something
that can be out of reach for many underprivileged students. Thus, during the
year under review, we provided orphans with computer facilities and tuition
classes in order to assist them with their education.
Today, we at Sapura Group continue the journey to improve and nurture a more balanced Sapura Community. We believe in building a close-knit community amongst members of our workforce and foster strong ties with the public, particularly with the less privileged. As such, in the years to come, Sapura Group will endeavour to strive harder to serve our community while creating a conducive environment for the people whom we value – our Big Family.
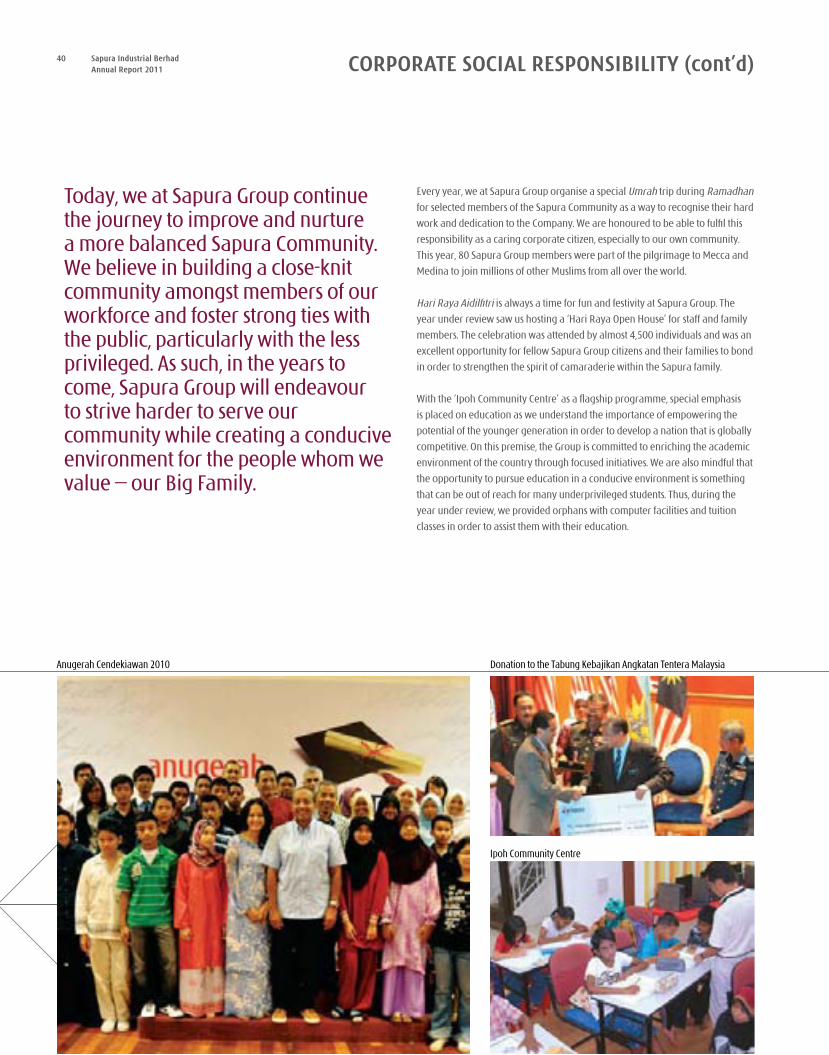
Anugerah Cendekiawan 2010 Donation to the Tabung Kebajikan Angkatan Tentera Malaysia
Ipoh Community Centre
41 Sapura Industrial BerhadAnnual Report 2011
Family always comes first here in Sapura. On this note, and in line with our
commitment to education, we are committed to supporting deserving Sapura
Children, children of our employees, who have demonstrated commendable
scholastic performance. Anugerah Cendekiawan 2010 saw 52 Sapura children
who scored straight A’s in the 2009 uPSR, PMR and SPM examinations being
recognised and awarded for their achievements by the Group. We laud the
children as well as their parents for their hard work and determination in
obtaining such commendable results.
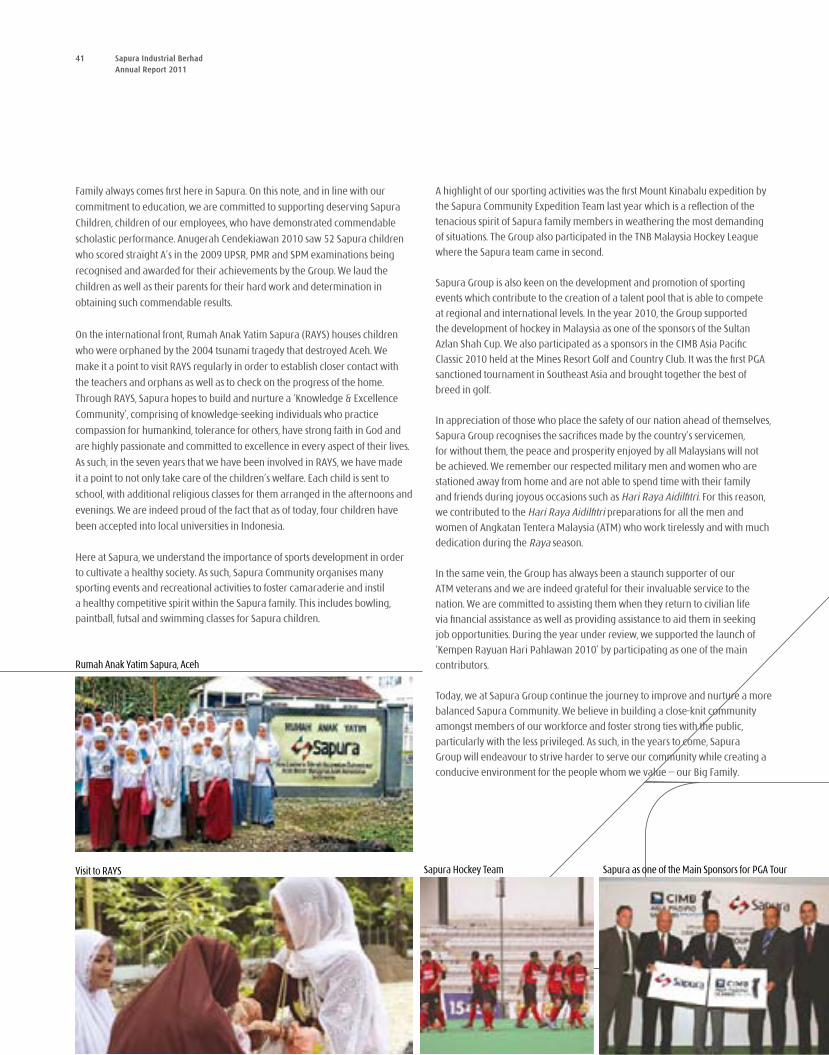
On the international front, Rumah Anak Yatim Sapura (RAYS) houses children
who were orphaned by the 2004 tsunami tragedy that destroyed Aceh. We
make it a point to visit RAYS regularly in order to establish closer contact with
the teachers and orphans as well as to check on the progress of the home.
Through RAYS, Sapura hopes to build and nurture a ‘Knowledge & Excellence
Community’, comprising of knowledge-seeking individuals who practice
compassion for humankind, tolerance for others, have strong faith in God and
are highly passionate and committed to excellence in every aspect of their lives.
As such, in the seven years that we have been involved in RAYS, we have made
it a point to not only take care of the children’s welfare. Each child is sent to
school, with additional religious classes for them arranged in the afternoons and
evenings. We are indeed proud of the fact that as of today, four children have
been accepted into local universities in Indonesia.
Here at Sapura, we understand the importance of sports development in order
to cultivate a healthy society. As such, Sapura Community organises many
sporting events and recreational activities to foster camaraderie and instil
a healthy competitive spirit within the Sapura family. This includes bowling,
paintball, futsal and swimming classes for Sapura children.
A highlight of our sporting activities was the first Mount Kinabalu expedition by
the Sapura Community Expedition Team last year which is a reflection of the
tenacious spirit of Sapura family members in weathering the most demanding
of situations. The Group also participated in the TNB Malaysia Hockey League
where the Sapura team came in second.
Sapura Group is also keen on the development and promotion of sporting
events which contribute to the creation of a talent pool that is able to compete
at regional and international levels. In the year 2010, the Group supported
the development of hockey in Malaysia as one of the sponsors of the Sultan
Azlan Shah Cup. We also participated as a sponsors in the CIMB Asia Pacific
Classic 2010 held at the Mines Resort Golf and Country Club. It was the first PGA
sanctioned tournament in Southeast Asia and brought together the best of
breed in golf.
In appreciation of those who place the safety of our nation ahead of themselves,
Sapura Group recognises the sacrifices made by the country’s servicemen,
for without them, the peace and prosperity enjoyed by all Malaysians will not
be achieved. We remember our respected military men and women who are
stationed away from home and are not able to spend time with their family
and friends during joyous occasions such as Hari Raya Aidilfitri. For this reason,
we contributed to the Hari Raya Aidilfitri preparations for all the men and
women of Angkatan Tentera Malaysia (ATM) who work tirelessly and with much
dedication during the Raya season.
In the same vein, the Group has always been a staunch supporter of our
ATM veterans and we are indeed grateful for their invaluable service to the
nation. We are committed to assisting them when they return to civilian life
via financial assistance as well as providing assistance to aid them in seeking
job opportunities. During the year under review, we supported the launch of
‘Kempen Rayuan Hari Pahlawan 2010’ by participating as one of the main
contributors.
Today, we at Sapura Group continue the journey to improve and nurture a more
balanced Sapura Community. We believe in building a close-knit community
amongst members of our workforce and foster strong ties with the public,
particularly with the less privileged. As such, in the years to come, Sapura
Group will endeavour to strive harder to serve our community while creating a
conducive environment for the people whom we value – our Big Family.
Rumah Anak Yatim Sapura, Aceh
Visit to RAYS Sapura Hockey Team Sapura as one of the Main Sponsors for PGA Tour
42 Sapura Industrial BerhadAnnual Report 2011
43 Sapura Industrial BerhadAnnual Report 2011
44 Sapura Industrial BerhadAnnual Report 2011
The Board recognises that corporate governance is about
commitment to values and ethical conduct and thus, the Board is
fully committed in ensuring that the interests of all stakeholders
are not just safeguarded, but continually enhanced in values. The
stakeholders’ expectations must be assessed and managed, and not
assumed.
The Board is pleased to report to the shareholders on the manner in which the Company has strengthened its application of the principles of corporate governance and adopted the corporate governance best practices laid down in the Malaysian Code on Corporate Governance (the Code).
A. DIRECTORS
The Board The Board is responsible and committed to adopting good corporate governance practices as part
of their continuing obligations. It guides and monitors the affairs of the Group on behalf of the shareholders and retains full and effective control over the Group. The principal responsibilities include the primary responsibilities prescribed under the Code. These cover a review of the strategic direction for the Group, overseeing the business operations of the Group, and evaluating whether these are being properly and effectively managed.
Board Balance The composition of the Company’s current Board of Directors is well balanced, with an effective mix
of executive director and independent non-executive directors. There are one (1) executive director, four (4) non-independent non-executive directors and three (3) independent non-executive directors. The Board is satisfied that the current Board composition fairly reflects the investment of minority shareholders in the Company. A brief profile of the directors is presented on pages 14 to 23 of this Annual Report. The directors with diverse backgrounds provides an effective Board with a mix of industry-specific knowledge and broad business and commercial experience.
The Board in respect of the ratio of independent directors complies with the Main Market Listing Requirements of Bursa Malaysia Securities Berhad (Main Market Listing Requirements) that one third of its Board consists of independent directors. The independent directors are professionals of credibility and repute who demonstrate independence of judgment and objectivity in the Board’s deliberations.
The Chief Executive Officer, who has the general responsibility for running the business on a day-to-day basis, ensuring business excellence and operational efficiency on behalf of the Board. He
is responsible for implementing the policies and decisions of the Board, overseeing the operations as well as coordinating the development and implementation of business and corporate strategies. The Chief Executive Officer is supported by the Senior Management team and Group Functional teams who possessed vast experience, skill and knowledge in the industry.
CORPORATE GOVERNANCE STATEMENT
45 Sapura Industrial BerhadAnnual Report 2011
The independent non-executive directors bring to bear objective and independent judgment to the decision making of the Board and provide a check and balance for the Executive Director/Chief Executive Officer.
The non-executive directors contribute significantly in areas such as policy and strategy, performance monitoring, allocation of resources as well as improving governance and controls. Together with the Chief Executive Officer who has an intimate knowledge of the business, the Board is constituted of individuals who are committed to business integrity and professionalism in all its activities.
Board and Board Committee Meetings The Board ordinarily meets at least four (4) times a year at quarterly intervals, with
additional meetings convened as and when deemed necessary. At each regularly scheduled meeting there is a full financial and business review and discussion including evaluating the performance to date against the annual budget and business plan previously approved by the Board for that year. In the current financial year under review, the Board held six (6) meetings. The details of the attendance of the directors to the Board meetings are as follows:-
No Name of Directors Attendance
1. Tan Sri Dato’ Seri Ir. Shamsuddin bin Abdul Kadir 4
2. Datuk Shahril bin Shamsuddin 6
3. Shahriman bin Shamsuddin 5
4. Dato’ Azlan bin Hashim 5
5. Dato’ Mazlin bin Md Junid (resigned on 19 November 2010) 3
6. Datuk Kisai bin Rahmat 6
7. Shah Hakim bin Zain 4
8. Ir. Md. Shah bin Hussin 5
9. Wan Ahamad Sabri bin Wan Daud (appointed on 9 March 2011) –
46 Sapura Industrial BerhadAnnual Report 2011
To facilitate effective discharge of responsibilities, dedicated Board Committees were established guided by clear terms of reference with Directors who have committed time and effort as members. The Board Committees are chaired by non-executive directors who exercise skillful leadership with in-depth knowledge of the relevant industry.
Audit Committee• The primary objective of the Audit Committee is to assist the Board of Directors in discharging
its responsibilities relating to financial accounting and reporting matters. In compliance with the Main Market Listing Requirements and the Code, the Audit Committee comprises three (3) directors, a majority of whom are independent non-executive directors:
Chairman : Datuk Kisai bin Rahmat (Senior Independent Non-Executive Director)
Members : Dato’ Mazlin bin Md Junid (Independent Non-Executive Director) (resigned on 19 November 2010)
Dato’ Azlan bin Hashim (Non-Independent Non-Executive Director)
Encik Wan Ahamad Sabri bin Wan Daud (Independent Non-Executive Director) (appointed on 9 March 2011)
The terms of reference and the report of Audit Committee are set out on pages 50 to 52. The Audit Committee held five (5) meetings during the financial year.
Board Nomination and Remuneration Committee• The Board Nomination and Remuneration Committee (BNRC) which was set up by the Board, is
made up of a majority of Independent Non-Executive Directors.
Currently, the BNRC comprised wholly non-executive directors.
Chairman : Tan Sri Dato’ Seri Ir. Shamsuddin bin Abdul Kadir (Non-Independent Non-Executive Director)
Members : Datuk Kisai bin Rahmat (Senior Independent Non-Executive Director)
Dato’ Mazlin bin Md Junid (Independent Non-Executive Director) (resigned on 19 November 2010)
Encik Wan Ahamad Sabri bin Wan Daud (Independent Non-Executive Director) (appointed on 9 March 2011)
This composition of only non-executive directors in the Committee ensures that any decisions made are impartial and in the best interest of the Company without any element of fear or favour.
The BNRC held one (1) meeting during the financial year.
The proceedings of and resolutions passed at each Board and Board Committee meeting are minuted and kept in the statutory register at the registered office of the Company. In the event of potential conflict of interest, the directors in such a position will make a declaration to that effect as soon as practicable. The directors concerned will then abstain from any decision making process in which they are interested.
CORPORATE GOVERNANCE STATEMENT (cont’d)
47 Sapura Industrial BerhadAnnual Report 2011
Supply of Information The Board has unrestricted access to timely and accurate information, necessary in the furtherance of
their duties. The Company Secretary ensures that all Board meetings are furnished with proper agendas. Board papers which include reports on group performance and major operational, financial, strategic and regulatory matters, are circulated to all the directors not less than seven (7) days prior to the meeting, to allow the directors to have sufficient time to review the Board papers. In most instances, senior management of the Company as well as external advisors are invited to be in attendance at Board meetings to provide insight and to furnish clarification on issues that may be raised by the Board.
Directors also have full and unrestricted access to the advice and services of the Company Secretary who ensures compliance with current laws, rules and regulations.
Independent Professional Advice There is a formal procedure sanctioned by the Board of Directors, whether as a full board or in their
individual capacity to take independent professional advice at the Group’s expense, where necessary and in furtherance of their duties.
Appointment to the Board The proposed appointment of new Board members are reviewed and assessed by the BNRC. Thereafter the
BNRC submits its recommendation on the proposed appointment to the Board for approval. The BNRC’s primary role is to review the required mix of skills and experience of the directors on the Board, and determine the appropriate Board balance and size of non-executive directors. It will establish procedures and processes towards an annual assessment of the effectiveness of the Board as a whole, the committees of the Board and for assessing the contribution of each individual director. The Board is satisfied that the current composition of the Board brings the required mix of skills and experience required for the Board to function effectively.
Directors’ Training The Board acknowledges that its directors must keep abreast on various issues having relevance to the
constantly changing environment within which the business of the Group operates and enhance their business acumen and skills to meet challenging commercial risks.
The Board endeavours to provide continuous training and development to its current and new directors, by ensuring that the Directors participate in a full and tailored training and induction programme. During the financial year under review, members of the Board and Management team had attended the following
‘in-house’ training programmes:
Leadership And Talent Management• Corruption And Its Prevention• Conflict Resolution & Negotiation Skills•
Re-election The existing Company’s Articles of Association provides that all directors appointed by the Board are subject
to election by the shareholders at their first annual general meeting and thereafter shall retire from office by rotation at least once in each three years, but shall be eligible for re-election at each Annual General Meeting.
48 Sapura Industrial BerhadAnnual Report 2011
B. DIRECTORS’ REMUNERATION
Level and make-up of Remuneration The BNRC is responsible for evaluating and recommending to the Board the level and make-up of the
remuneration of the Executive Director and Chief Executive Officer, ensuring that they commensurate with the scope of responsibilities held in order to attract and retain the persons of necessary caliber, experience and quality needed to lead the Company successfully.
Remuneration Procedure During the financial year, the remuneration package for the Executive Director and Chief Executive
Officer were recommended by the BNRC and approved by the Board. Remuneration of the Non-Executive Directors is determined by the Board.
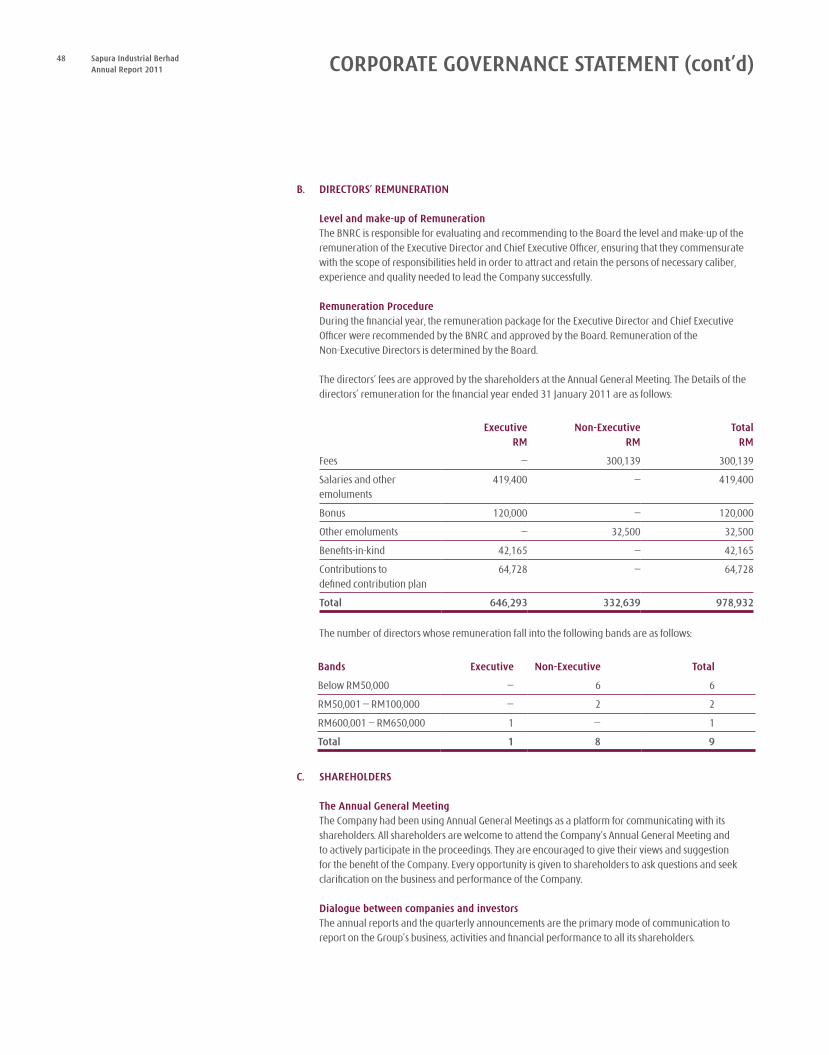
The directors’ fees are approved by the shareholders at the Annual General Meeting. The Details of the directors’ remuneration for the financial year ended 31 January 2011 are as follows:
ExecutiveRM
Non-ExecutiveRM
TotalRM
Fees – 300,139 300,139
Salaries and other emoluments
419,400 – 419,400
Bonus 120,000 – 120,000
Other emoluments – 32,500 32,500
Benefits-in-kind 42,165 – 42,165
Contributions to defined contribution plan
64,728 – 64,728
Total 646,293 332,639 978,932
The number of directors whose remuneration fall into the following bands are as follows:
Bands Executive Non-Executive Total
Below RM50,000 – 6 6
RM50,001 – RM100,000 – 2 2
RM600,001 – RM650,000 1 – 1
Total 1 8 9
C. SHAREHOLDERS
The Annual General Meeting The Company had been using Annual General Meetings as a platform for communicating with its
shareholders. All shareholders are welcome to attend the Company’s Annual General Meeting and to actively participate in the proceedings. They are encouraged to give their views and suggestion for the benefit of the Company. Every opportunity is given to shareholders to ask questions and seek clarification on the business and performance of the Company.
Dialogue between companies and investors The annual reports and the quarterly announcements are the primary mode of communication to
report on the Group’s business, activities and financial performance to all its shareholders.
CORPORATE GOVERNANCE STATEMENT (cont’d)
49 Sapura Industrial BerhadAnnual Report 2011
The key elements of the Company’s dialogue with its shareholders is the opportunity to gather views of and answer questions from both private and institutional shareholders on all issues relevant to the Company at the Annual General Meeting. At the Annual General Meeting, the shareholders are encouraged to ask questions both about the resolutions being proposed or about the Group’s operations in general.
The Company has established a website at www.sapuraindustrial.com.my where shareholders and stakeholders can access for information regarding Sapura Industrial Berhad Group.
In addition to the above, the Board has identified Datuk Kisai bin Rahmat as the Senior Independent Non-Executive Director to whom concerns from the shareholders can be conveyed.
D. ACCOUNTABILITY AND AUDIT
Financial Reporting The Board aims to provide and present a balanced and meaningful assessment of the Group’s financial
performance and prospects at the end of the financial year, primarily through the annual financial statements, quarterly announcement of results to shareholders as well as the Chairman’s statement and review of operations in the annual report. The Board is assisted by the Audit Committee to oversee the Group’s financial reporting processes and the quality of its financial reporting.
Internal Control The Board acknowledges its overall responsibility for maintaining a sound system of internal control to
safeguard shareholders’ investment and Group assets. The Statement on Internal Control is presented on page 53 of the Annual Report providing an overview of the state of internal control within the Group.
Relationship with Auditors The Board, through the Board Audit Committee, maintains a formal and transparent professional
relationship with both the Group internal and external auditors.
The function of the Audit Committee in relation to the external auditors and the number of meetings held since the previous financial year end as well as the attendance record of each member is shown in the Audit Committee Report on pages 50 to 52 of the Annual Report.
The membership of the Audit Committee, the terms of reference and a summary of the activities of the committee are presented in the Audit Committee Report on pages 50 to 52 of the Annual Report.
Directors’ Responsibility Statement The Directors are required by the Companies Act, 1965 to ensure that financial statements prepared for
each financial year give a true and fair view of the state of the affairs of the Company and the Group as at the end of the financial year and of the results and cash flow of the Group for the financial year.
COMPLIANCE WITH THE BEST PRACTICES
The Group has adopted various steps to set out principles and best practice to ensure compliance with the Best Practices of the Code during the financial year.
Statement made in accordance with a resolution of the Board of Directors dated 25 May 2011.
50 Sapura Industrial BerhadAnnual Report 2011
AUDIT COMMITTEE REPORT
For The Financial Year Ended 31 January 2011
The members of the Audit Committee of Sapura Industrial Berhad are pleased to present
their report for the financial year ended 31 January 2011.
MEMBERSHIP
The present members of the Audit Committee comprise:
Datuk Kisai bin Rahmat, ChairmanIndependent Non-Executive Director
Dato’ Azlan bin Hashim, MemberNon-Independent Non-Executive Director
Dato Mazlin bin Md Junid, MemberIndependent Non-Executive Director(resigned on 19 November 2010)
Wan Ahamad Sabri bin Wan Daud, MemberIndependent Non-Executive Director(appointed on 9 March 2011)
TERMS OF REFERENCE
Size and CompositionThe Board shall by resolution appoint members of the Audit Committee, which shall comprise at least three (3) non-executive directors, the majority of whom shall be independent directors as defined under the Main Market Listing Requirements of Bursa Malaysia Securities Berhad (Bursa Malaysia). At least one member of the Committee is an accountant and fulfils requirements of the Bursa Malaysia.
The Committee shall elect a chairperson from among its members who is not an executive director or employee of the Company or any related corporation.
In the event of an Independent Non-Executive member of the Committee ceases to be a member resulting in the number of Independent Non-Executive members falls below the minimum number required, the Board of Directors shall within three (3) months of the event appoint such number of new Independent Non-Executive members to the Committee to make up the minimum number.
Term of MembershipMembers of the Committee shall be appointed for an initial term of three (3) years after which they will be reappointed on such terms as may be determined by the Board of Directors.
AuthorityThe Committee is authorised by the Board to investigate any activity within its terms of reference. It is authorised to seek information it requires from any employee and all employees are directed to co-operate with any request made by the Committee.
AccessThe Committee shall have unlimited access to all information and documents relevant to its activities, to the Internal and External Auditors, and to Senior Management of the Company and its subsidiaries. The Committee is also authorised to take such independent professional and legal advice, as it considers necessary.
MeetingsThe Audit Committee shall hold at least four (4) regular meetings per financial year, and such additional meetings as the chairperson shall decide in order to fulfil its duties and if requested to do so by any Committee member, the Management or the Internal or External Auditors. The Committee may invite any person to be in attendance to assist it in its deliberations. A quorum shall consist of a majority of Independent Non-Executive Committee members and shall not be less than two (2).
The Company Secretary or any person appointed by the Committee for this purpose shall act as Secretary of the Committee.
Duties and Responsibilities1. Review the adequacy and effectiveness of risk management,
internal control and governance system instituted in the Group.
2. Discuss with the External Auditors before the audit commences, the nature and scope of the audit.
3. Review with the External Auditors: (a) the audit plan; (b) the evaluation of the system of internal accounting
control; and (c) the audit report on the financial statement.
4. Review of the assistance given by the Company’s officers to the External Auditors.
51 Sapura Industrial BerhadAnnual Report 2011
5. Review the adequacy of the scope, functions and resources of the internal audit function and that it has the necessary authority to carry out its work.
6. Review the internal audit programme, processes, the results of the internal audit programme, processes or investigation undertaken and whether or not appropriate action is taken on the recommendations of the internal audit function.
7. Review of the quarterly results and year end financial statements and the press release relating to the financial matters of importance with the Management and the External Auditors prior to them being approved by the Board of Directors, focusing particularly on:
(a) changes in or implementation of major accounting policy and practices;
(b) significant and unusual events; and (c) compliance with applicable approved accounting standards and
other legal and regulatory requirements.
8. Review of any related party transaction and conflict of interest situation that may arise within the Company and the Group including any transaction, procedure or course of conduct that raises questions of management integrity.
9. Consider any matters the External Auditors may wish to bring to the attention of the directors or shareholders.
10. Consider the major findings of internal investigations and management’s response.
11. Review of any significant transactions which are not a normal part of the Company’s business.
12. To recommend to the Board the appointment and reappointment of the External Auditors and any question of their resignation or dismissal.
13. Such other responsibilities as may be agreed to by the Audit Committee and the Board of Directors.
52 Sapura Industrial BerhadAnnual Report 2011 AUDIT COMMITTEE REPORT (cont’d)
For The Financial Year Ended 31 January 2011
MEETINGS HELD FOR THE FINANCIAL YEAR ENDED 31 JANUARY 2011
The Audit Committee held five (5) meetings during the financial year ended 31 January 2011 with the Head of Internal Audit and the Group Financial Controller cum Company Secretary in attendance. The Chief Executive Officer, External Auditors and the Head of the Auditee Company were also invited to brief the Audit Committee on issues tabled for discussion.
Audit Committee Meeting AttendanceThere were five (5) meetings held during the financial year ended 31 January 2011 and the details of attendance are as follows:-
Name of Audit Committee Members Attendance Datuk Kisai bin Rahmat 5
Dato’ Mazlin bin Md Junid (resigned on 19 November 2010) 5
Dato’ Azlan bin Hashim 3
Wan Ahamad Sabri bin Wan Daud (appointed on 9 March 2011) –
SUMMARY OF ACTIVITIES OF THE AUDIT COMMITTEE FOR THE FINANCIAL YEAR ENDED 31 JANUARY 2011
Appraisal of the internal audit plan was made by the Audit Committee to confirm the annual audit of the Group. The Audit Committee also reviewed and appraised the audit reports by the Internal Auditors, the various internal control systems in place and the financial statements of the Group. Significant issues arising from the annual audit by the External Auditors were also considered. The Audit Committee held separate meetings with the External Auditors, excluding the attendance of the Management, to discuss any problems and reservations. The Audit Committee reviewed the quarterly and year end financial statements to recommend to the Board for approval to announce to Bursa Malaysia. At the conclusion of each meeting, recommendations were made for Management to improve on internal controls, procedures and systems of the Group, wherever appropriate.
The Audit Committee monitored the implementation of the audit recommendations in the subsequent meetings to obtain assurances that all key risks and control concerns have been fully addressed.
INTERNAL AUDIT FUNCTION
The Audit Committee is supported by an in-house Internal Audit Department in the discharge of its duties and responsibilities. The Department provides independent and objective assurance on the adequacy and effectiveness of the risk management, internal control and governance processes.
The Internal Audit Department reviewed and evaluated the adequacy and effectiveness of the internal control system to anticipate any potential risks and recommended improvements, where necessary. The Department also assessed:
(a) the Group’s compliance to its established policies and procedures, guidelines and statutory requirements;
(b) reliability and integrity of financial and operational information;
(c) safeguarding of assets; and(d) operational effectiveness and efficiency.
The Management was required to explain any purported lack of compliance pursuant to the audit reports issued. The audit reports, incorporating relevant action plans agreed with the Management, were circulated to the respective Senior Management, Business units Head, Group Financial Controller and were reviewed by the Audit Committee.
The Internal Audit Department also conducted several special assignments and investigations requested by Management. Validation of controls based on the key risk profile identified under the Enterprise - Wide Risk Management framework were also conducted in all subsidiaries to ensure those controls are in place and adequate. The resulting report was forwarded to the Management and Audit Committee for recommendations.
A follow-up audit review was also conducted to monitor and ensure that all audit recommendations have been effectively implemented.
There were no areas of the internal audit function which were outsourced. The total cost incurred for the internal audit function of the Group for the financial year was RM407,019.
Datuk Kisai bin RahmatChairmanAudit Committee
53 Sapura Industrial BerhadAnnual Report 2011
STATEMENT ON INTERNAL CONTROL
RESPONSIBILITY
The Board of Directors (“the Board”) of Sapura Industrial Berhad acknowledges responsibility for maintaining a sound system of internal control for the Group and for reviewing its adequacy and integrity so as to safeguard shareholders’ investment and the assets of the Group whilst the management’s role is to implement Board policies on risk and control.
However, due to inherent limitation, the Board recognises that the system of internal control is designed to manage rather than eliminate the risk of failure to achieve business objectives and can only provide reasonable and not absolute assurance against material misstatement or loss.
KEY INTERNAL CONTROL PROCESS
In pursuing its responsibility, the Board has an ongoing process for identifying, evaluating and managing the significant risks faced by the Group, which has been in place for the financial year under review and up to the date of approval of the Annual Report and Financial Statements. This process is regularly reviewed by the Board through its Audit Committee and is in accordance with the guidelines on Statement on Internal Controls: Guidance for Directors of Public Listed Companies.
The Audit Committee assists the Board in reviewing the adequacy and integrity of the system of internal controls of the Group. The Audit Committee is assisted by the Internal Audit Department which carries out regular and systematic review of the systems of internal control of the Group and also the extent of compliance with the Group’s operating policies and procedures.
The Internal Audit Department carries out internal control reviews on the financial and operating activities of the Group based on an annual plan that was presented and approved by the Audit Committee.
An Enterprise - Wide Risk Management framework through the application of the Corporate Risk Scorecard (CRS) has been established for Sapura Industrial Berhad. The risk assessment and findings were identified through a combination of interviews and a facilitated workshop. The process used in the interviews and workshop provided a structured approach in identifying, prioritising and managing the risks. The risks and controls are reviewed semi annually under the Group’s activities.
SYSTEM OF INTERNAL CONTROLS
The key elements of the framework of the internal control system of the Group are as follows:
All major decisions require the approval of the Board and are only made •after appropriate in-depth analysis. The Board meets regularly on a quarterly basis, and review the financial and operational performance of the Group.
All Departments and Divisions of the Group have clearly documented •Policies and Procedures incorporating control and scope of responsibilities. These are regularly updated on practical needs and industry best practice.
A manual called the Limit of Authority (“LoA”) is used throughout the •Group and set out the authority limits on area of corporate, operation, financial and human resource. The LoA prescribes limits of authority and prohibit unfettered power within the various levels of management and Group members. The LoA may be reviewed by the Board upon the recommendation of management, to ensure its provisions are effective in managing risk and is practical for implementation.
The Internal Audit Department independently reviews the control •processes implemented by management and reports its findings and recommendations to the Audit Committee for presentation to the Board.
The Audit Committee, on behalf of the Board, regularly reviews and holds •discussion with management on the action taken on internal control issues identified in various reports prepared by the Internal Audit Department, the external auditors and the management.
An Annual Budget and Business Plan is prepared and adopted by the •Board to facilitate the Group in its business and financial performance. The Board reviews and monitors the achievements of the Group’s performance covering each business unit’s performance on a quarterly basis.
Weekly Group Management Committee Meeting attended by Senior •Management Team chaired by the Chief Executive Officer to deliberate on business, financial and operational issues which include reviewing and approving all key business strategic measures and policies. Progress status of any internal control measures recommended to the business units during the course of internal audit was also reviewed.
A monthly Operational Performance Meeting attended by respective •Business unit Heads and chaired by the Chief Executive Officer to review operational performance and progress of tasks undertaken.
At each operating company level, a monthly company Management •Meeting, chaired by the Business unit Head and attended by all Department Heads to deliberate on operational issues and performance of the company.
REVIEW OF THE STATEMENT BY EXTERNAL AUDITORS
The external auditors have reviewed this Statement on Internal Control for the inclusion in the annual report of the Group for the financial year ended 31 January 2011 and reported to the Board that nothing has come to their attention that causes them to believe that this statement is inconsistent with their understanding of the process adopted by the Board in reviewing the adequacy and integrity of the system of internal controls.
Statement made in accordance with a resolution of the Board of Directors dated 25 May 2011.
54 Sapura Industrial BerhadAnnual Report 2011
ADDITIONAL COMPLIANCE INFORMATIONPursuant to Paragraph 9.25 of the Main Market Listing Requirements of Bursa Malaysia
1. MATERIAL CONTRACTS
There were no material contracts entered into by the Company and/or its subsidiary companies involving the Company’s directors and/o r major shareholders’ interests either still subsisting at the end of financial year, or which were entered into since the end of the previous financial year.
2. MATERIAL CONTRACTS RELATED TO LOAN
There were no material contracts related to loans entered into by the Company and/or its subsidiary companies involving the Company’s directors and/or major shareholders’ interests during the financial year under review.
3. RECURRENT RELATED PARTY TRANSACTIONS ENTERED INTO DURING FINANCIAL YEAR ENDED 31 JANUARY 2011 PURSUANT TO SHAREHOLDERS’ MANDATE
Shareholders’ mandate was not required to be procured for recurrent related party transactions entered into during financial year ended 31 January 2011.
4. SHARE BUY-BACKS
There were no share buy-back exercises undertaken by the Company during the financial year under review.
5. OPTIONS, WARRANTS OR CONVERTIBLE SECURITIES
The Company has not issued any options, warrants or convertible securities during the financial year under review.
6. AMERICAN DEPOSITORY RECEIPT (ADR) OR GLOBAL DEPOSITORY RECEIPT (GDR)
There were no ADR or GDR programmes sponsored by the Company during the financial year under review.
7. NON-AUDIT FEES
Apart from the annual audit fees, there were non-audit fees amounting to Ringgit Malaysia Five Thousand (RM5,000) paid to Messrs Ernst & Young during the financial year under review.
8. PROFIT ESTIMATION, FORECAST OR PROJECTION
There were no profit estimation, forecast or projection made or released by the Company during the financial year under review.
9. PROFIT GUARANTEES
There were no profit guarantees given by the Company during the financial year under review.
10. REVALUATION POLICY ON LANDED PROPERTIES
There was no revaluation policy of landed properties undertaken by the Company or any of its subsidiaries during the financial year under review.
11. IMPOSITION OF SANCTIONS AND/OR PENALTIES
There were no sanctions and/or penalties imposed on the Company and/or its subsidiaries, Directors or Management arising from any significant breach of rules/guidelines/legislations by any of the regulatory authorities.
12. VARIATION IN RESULTS
There was no variation in results (differing by 10% or more) from unaudited results announced.
55 Sapura Industrial BerhadAnnual Report 2011
STATEMENT OF DIRECTORS’ RESPONSIBILITY IN RESPECT OF THE AUDITED FINANCIAL STATEMENTS
Pursuant to Paragraph 15.26(a) of the Main Market Listing Requirements of Bursa Malaysia
The Directors are required by law to prepare financial statements for each financial year in accordance with the applicable approved accounting standards in Malaysia and give a true and fair view of the state of affairs of the Group and of the Company at the end of the financial year and of the results and the cash flows of the Group and of the Company for the financial year.
In preparing the financial statements of the Group and of the Company, the Directors have adopted appropriate accounting policies and applied them consistently and prudently. The Directors have also ensured that those applicable accounting standards have been followed and confirmed that the financial statements have been prepared on a going concern basis.
The Directors are responsible for ensuring that the Company keeps accounting records which disclose with reasonable accuracy the financial position of the Group and of the Company and which enable them to ensure that the financial statements are in compliance with the provisions of the Companies Act, 1965.
The Directors are also responsible for taking such steps that are reasonably open to them to safeguard the assets of the Group and to prevent and detect fraud and other irregularities.
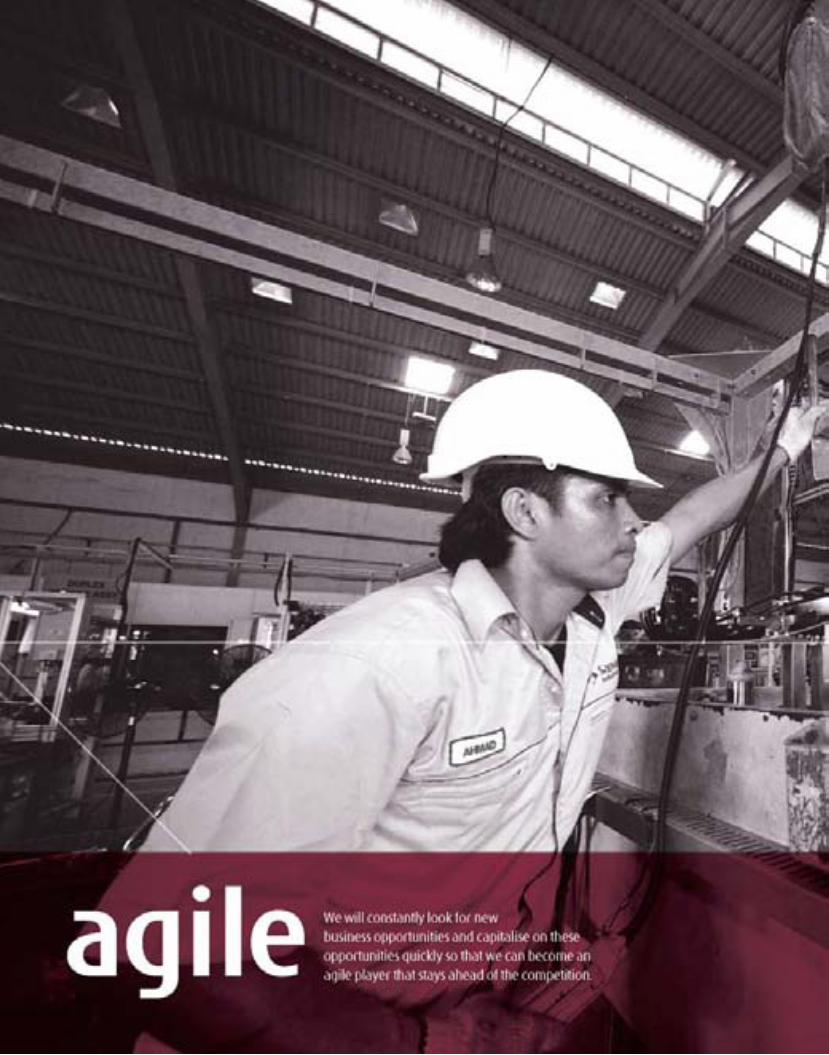
56 Sapura Industrial BerhadAnnual Report 2011
57 Sapura Industrial BerhadAnnual Report 2011

FINANCIAL STATEMENTSDirectors’ Report 60 – 63
Statement by Directors 64
Statutory Declaration 64
Independent Auditors’ Report 65
Statements of Comprehensive Income 66
Statements of Financial Position 67 – 68
Consolidated Statement of Changes in Equity 69
Company Statement of Changes in Equity 70
Statements of Cash Flows 71 – 72
Notes to the Financial Statements 73 – 127
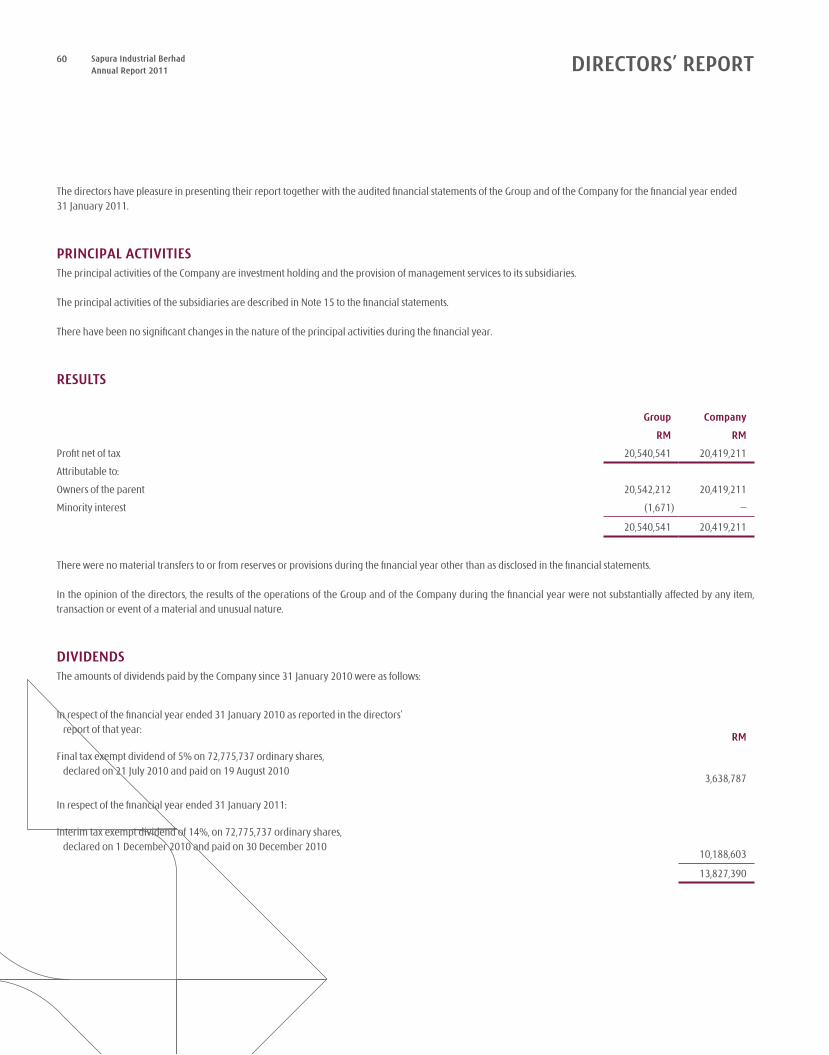
60 Sapura Industrial BerhadAnnual Report 2011
The directors have pleasure in presenting their report together with the audited financial statements of the Group and of the Company for the financial year ended 31 January 2011.
PRINCIPAL ACTIVITIESThe principal activities of the Company are investment holding and the provision of management services to its subsidiaries.
The principal activities of the subsidiaries are described in Note 15 to the financial statements.
There have been no significant changes in the nature of the principal activities during the financial year.
RESULTS
Group Company
RM RM
Profit net of tax 20,540,541 20,419,211
Attributable to:
Owners of the parent 20,542,212 20,419,211
Minority interest (1,671) –
20,540,541 20,419,211
There were no material transfers to or from reserves or provisions during the financial year other than as disclosed in the financial statements.
In the opinion of the directors, the results of the operations of the Group and of the Company during the financial year were not substantially affected by any item, transaction or event of a material and unusual nature.
DIVIDENDSThe amounts of dividends paid by the Company since 31 January 2010 were as follows:
In respect of the financial year ended 31 January 2010 as reported in the directors’ report of that year:
RM
Final tax exempt dividend of 5% on 72,775,737 ordinary shares, declared on 21 July 2010 and paid on 19 August 2010
3,638,787
In respect of the financial year ended 31 January 2011:
Interim tax exempt dividend of 14%, on 72,775,737 ordinary shares, declared on 1 December 2010 and paid on 30 December 2010
10,188,603
13,827,390
DIRECTORS’ REPORT
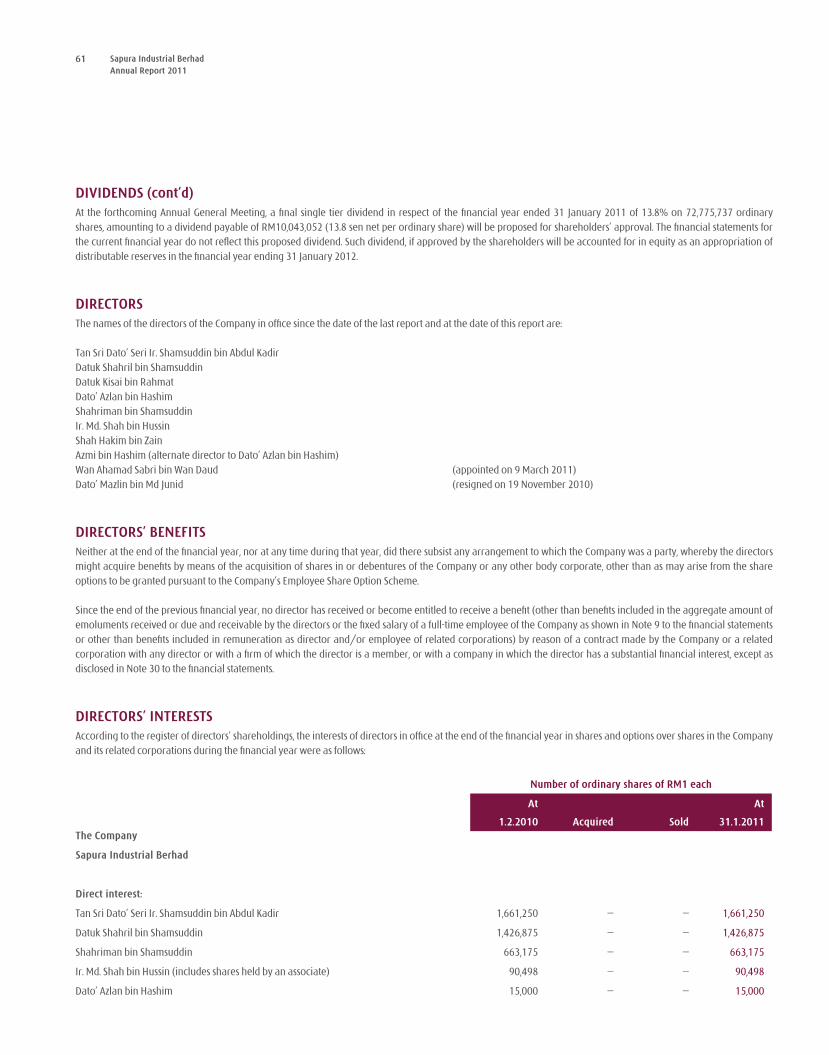
61 Sapura Industrial BerhadAnnual Report 2011
DIVIDENDS (cont’d)At the forthcoming Annual General Meeting, a final single tier dividend in respect of the financial year ended 31 January 2011 of 13.8% on 72,775,737 ordinary shares, amounting to a dividend payable of RM10,043,052 (13.8 sen net per ordinary share) will be proposed for shareholders’ approval. The financial statements for the current financial year do not reflect this proposed dividend. Such dividend, if approved by the shareholders will be accounted for in equity as an appropriation of distributable reserves in the financial year ending 31 January 2012.
DIRECTORSThe names of the directors of the Company in office since the date of the last report and at the date of this report are:
Tan Sri Dato’ Seri Ir. Shamsuddin bin Abdul KadirDatuk Shahril bin ShamsuddinDatuk Kisai bin RahmatDato’ Azlan bin HashimShahriman bin ShamsuddinIr. Md. Shah bin HussinShah Hakim bin ZainAzmi bin Hashim (alternate director to Dato’ Azlan bin Hashim)Wan Ahamad Sabri bin Wan Daud (appointed on 9 March 2011)Dato’ Mazlin bin Md Junid (resigned on 19 November 2010)
DIRECTORS’ BENEFITSNeither at the end of the financial year, nor at any time during that year, did there subsist any arrangement to which the Company was a party, whereby the directors might acquire benefits by means of the acquisition of shares in or debentures of the Company or any other body corporate, other than as may arise from the share options to be granted pursuant to the Company’s Employee Share Option Scheme.
Since the end of the previous financial year, no director has received or become entitled to receive a benefit (other than benefits included in the aggregate amount of emoluments received or due and receivable by the directors or the fixed salary of a full-time employee of the Company as shown in Note 9 to the financial statements or other than benefits included in remuneration as director and/or employee of related corporations) by reason of a contract made by the Company or a related corporation with any director or with a firm of which the director is a member, or with a company in which the director has a substantial financial interest, except as disclosed in Note 30 to the financial statements.
DIRECTORS’ INTERESTSAccording to the register of directors’ shareholdings, the interests of directors in office at the end of the financial year in shares and options over shares in the Company and its related corporations during the financial year were as follows:
Number of ordinary shares of RM1 each
At
1.2.2010 Acquired Sold
At
31.1.2011The Company
Sapura Industrial Berhad
Direct interest:
Tan Sri Dato’ Seri Ir. Shamsuddin bin Abdul Kadir 1,661,250 – – 1,661,250
Datuk Shahril bin Shamsuddin 1,426,875 – – 1,426,875
Shahriman bin Shamsuddin 663,175 – – 663,175
Ir. Md. Shah bin Hussin (includes shares held by an associate) 90,498 – – 90,498
Dato’ Azlan bin Hashim 15,000 – – 15,000
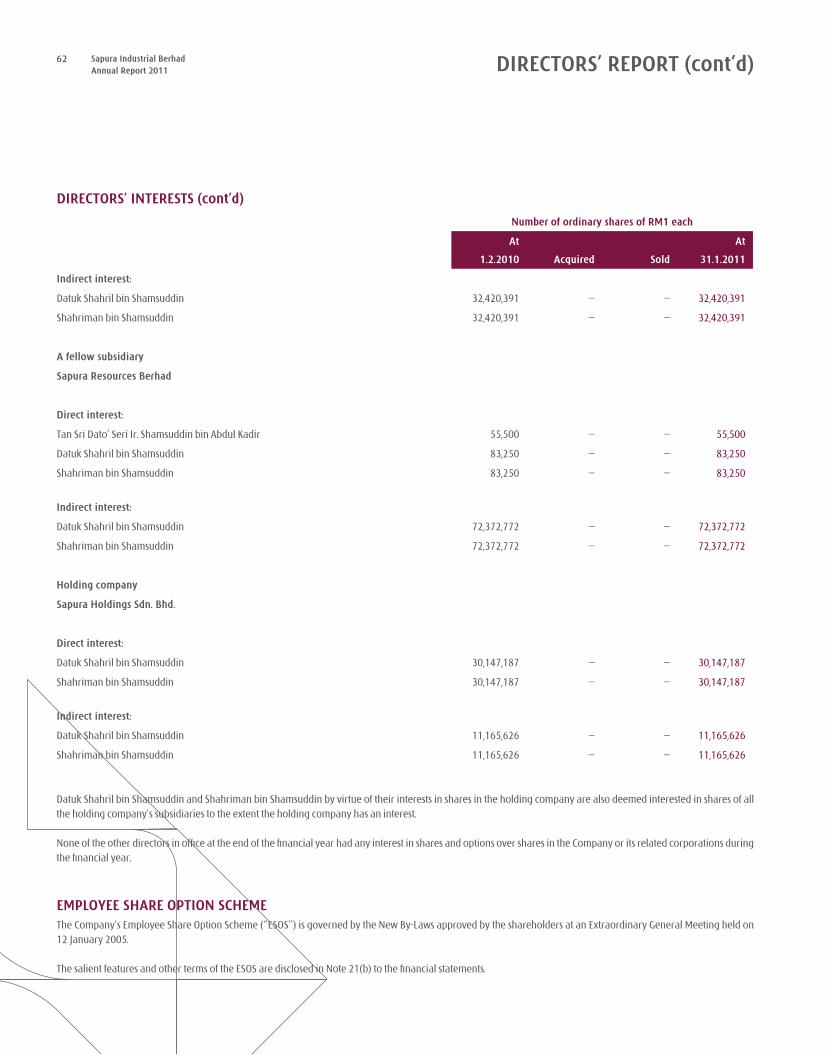
62 Sapura Industrial BerhadAnnual Report 2011 DIRECTORS’ REPORT (cont’d)
DIRECTORS’ INTERESTS (cont’d)
Number of ordinary shares of RM1 each
At
1.2.2010 Acquired Sold
At
31.1.2011
Indirect interest:
Datuk Shahril bin Shamsuddin 32,420,391 – – 32,420,391
Shahriman bin Shamsuddin 32,420,391 – – 32,420,391
A fellow subsidiary
Sapura Resources Berhad
Direct interest:
Tan Sri Dato’ Seri Ir. Shamsuddin bin Abdul Kadir 55,500 – – 55,500
Datuk Shahril bin Shamsuddin 83,250 – – 83,250
Shahriman bin Shamsuddin 83,250 – – 83,250
Indirect interest:
Datuk Shahril bin Shamsuddin 72,372,772 – – 72,372,772
Shahriman bin Shamsuddin 72,372,772 – – 72,372,772
Holding company
Sapura Holdings Sdn. Bhd.
Direct interest:
Datuk Shahril bin Shamsuddin 30,147,187 – – 30,147,187
Shahriman bin Shamsuddin 30,147,187 – – 30,147,187
Indirect interest:
Datuk Shahril bin Shamsuddin 11,165,626 – – 11,165,626
Shahriman bin Shamsuddin 11,165,626 – – 11,165,626
Datuk Shahril bin Shamsuddin and Shahriman bin Shamsuddin by virtue of their interests in shares in the holding company are also deemed interested in shares of all the holding company’s subsidiaries to the extent the holding company has an interest.
None of the other directors in office at the end of the financial year had any interest in shares and options over shares in the Company or its related corporations during the financial year.
EMPLOYEE SHARE OPTION SCHEME The Company’s Employee Share Option Scheme (‘’ESOS’’) is governed by the New By-Laws approved by the shareholders at an Extraordinary General Meeting held on 12 January 2005.
The salient features and other terms of the ESOS are disclosed in Note 21(b) to the financial statements.
63 Sapura Industrial BerhadAnnual Report 2011
OTHER STATUTORY INFORMATION(a) Before the statements of comprehensive income and statements of financial position of the Group and of the Company were made out, the directors took reasonable
steps:
(i) to ascertain that proper action had been taken in relation to the writing off of bad debts and the making of provision for doubtful debts and satisfied themselves that all known bad debts have been written off and that adequate provision had been made for doubtful debts; and
(ii) to ensure that any current assets which were unlikely to realise their values as shown in the accounting records in the ordinary course of business had been written down to an amount which they might be expected so to realise.
(b) At the date of this report, the directors are not aware of any circumstances which would render:
(i) the amount written off for bad debts or the amount of the provision for doubtful debts in the financial statements of the Group and of the Company inadequate to any substantial extent; and
(ii) the values attributed to the current assets in the financial statements of the Group and of the Company misleading.
(c) At the date of this report, the directors are not aware of any circumstances which have arisen which would render adherence to the existing method of valuation of assets or liabilities of the Group and of the Company misleading or inappropriate.
(d) At the date of this report, the directors are not aware of any circumstances not otherwise dealt with in this report or financial statements of the Group and of the Company which would render any amount stated in the financial statements misleading.
(e) As at the date of this report, there does not exist:
(i) any charge on the assets of the Group or of the Company which has arisen since the end of the financial year which secures the liabilities of any other person; or
(ii) any contingent liability of the Group or of the Company which has arisen since the end of the financial year.
(f) In the opinion of the directors:
(i) no contingent or other liability has become enforceable or is likely to become enforceable within the period of twelve months after the end of the financial year which will or may affect the abilities of the Group or of the Company to meet their obligations when they fall due; and
(ii) no item, transaction or event of a material and unusual nature has arisen in the interval between the end of the financial year and the date of this report which is likely to affect substantially the results of the operations of the Group or of the Company for the financial year in which this report is made.
AUDITORSThe auditors, Ernst & Young, have expressed their willingness to continue in office.
Signed on behalf of the Board in accordance with a resolution of the directors dated on 25 May 2011.
Datuk Kisai bin Rahmat Ir. Md. Shah bin Hussin
64 Sapura Industrial BerhadAnnual Report 2011 STATEMENT BY DIRECTORS
PuRSuANT TO SECTION 169(15) OF THE COMPANIES ACT, 1965
We, Datuk Kisai bin Rahmat and Ir. Md. Shah bin Hussin, being two of the directors of Sapura Industrial Berhad, do hereby state that, in the opinion of the directors, the accompanying financial statements set out on pages 66 to 126 are drawn up in accordance with Financial Reporting Standards and the Companies Act, 1965 in Malaysia so as to give a true and fair view of the financial position of the Group and of the Company as at 31 January 2011 and of their financial performance and cash flows for the year then ended.
The information set out in Note 34 on page 127 to the financial statements have been prepared in accordance with the Guidance on Special Matter No. 1, Determination of Realised and unrealised Profits or Losses in the Context of Disclosure Pursuant to Bursa Malaysia Securities Berhad Listing Requirements, issued by the Malaysian Institute of Accountants.
Signed on behalf of the Board in accordance with a resolution of the directors dated 25 May 2011.
Datuk Kisai bin Rahmat Ir. Md. Shah bin Hussin
STATUTORY DECLARATIONPuRSuANT TO SECTION 169(16) OF THE COMPANIES ACT, 1965
I, Liyana Lee bte Abdullah, being the officer primarily responsible for the financial management of Sapura Industrial Berhad, do solemnly and sincerely declare that the accompanying financial statements set out on pages 66 to 127 are in my opinion correct, and I make this solemn declaration conscientiously believing the same to be true and by virtue of the provisions of the Statutory Declarations Act, 1960.
Subscribed and solemnlydeclared by the abovenamedLiyana Lee bte Abdullah atKajang in Selangor Darul Ehsanon 25 May 2011 Liyana Lee bte Abdullah
Before me,
65 Sapura Industrial BerhadAnnual Report 2011 INDEPENDENT AUDITORS’ REPORT
TO THE MEMBERS OF SAPuRA INDuSTRIAL BERHAD (INCORPORATED IN MALAYSIA)
Report on the financial statementsWe have audited the financial statements of Sapura Industrial Berhad, which comprise the statements of financial position as at 31 January 2011 of the Group and of the Company, and the statements of comprehensive income, statements of changes in equity and statements of cash flows of the Group and of the Company for the year then ended, and a summary of significant accounting policies and other explanatory notes, as set out on pages 66 to 126.
Directors’ responsibility for the financial statementsThe directors of the Company are responsible for the preparation and fair presentation of these financial statements in accordance with Financial Reporting Standards and the Companies Act, 1965 in Malaysia. This responsibility includes: designing, implementing and maintaining internal control relevant to the preparation and fair presentation of financial statements that are free from material misstatement, whether due to fraud or error; selecting and applying appropriate accounting policies; and making accounting estimates that are reasonable in the circumstances.
Auditors’ responsibilityOur responsibility is to express an opinion on these financial statements based on our audit. We conducted our audit in accordance with approved standards on auditing in Malaysia. Those standards require that we comply with ethical requirements and plan and perform the audit to obtain reasonable assurance whether the financial statements are free from material misstatement.
An audit involves performing procedures to obtain audit evidence about the amounts and disclosures in the financial statements. The procedures selected depend on our judgment, including the assessment of risks of material misstatement of the financial statements, whether due to fraud or error. In making those risk assessments, we consider internal control relevant to the entity’s preparation and fair presentation of the financial statements in order to design audit procedures that are appropriate in the circumstances, but not for the purpose of expressing an opinion on the effectiveness of the entity’s internal control. An audit also includes evaluating the appropriateness of the accounting policies used and the reasonableness of accounting estimates made by the directors, as well as evaluating the overall presentation of the financial statements.
We believe that the audit evidence we have obtained is sufficient and appropriate to provide a basis for our audit opinion.
OpinionIn our opinion, the financial statements have been properly drawn up in accordance with Financial Reporting Standards and the Companies Act, 1965 in Malaysia so as to give a true and fair view of the financial position of the Group and of the Company as at 31 January 2011 and of their financial performance and cash flows for the year then ended.
Report on other legal and regulatory requirementsIn accordance with the requirements of the Companies Act, 1965 in Malaysia, we also report the following:(a) In our opinion, the accounting and other records and the registers required by the Act to be kept by the Company and its subsidiaries have been properly kept in
accordance with the provisions of the Act.(b) We are satisfied that the financial statements of the subsidiaries that have been consolidated with the financial statements of the Company are in form and
content appropriate and proper for the purposes of the preparation of the consolidated financial statements and we have received satisfactory information and explanations required by us for those purposes.
(c) The auditors’ reports on the financial statements of the subsidiaries were not subject to any qualification and did not include any comment required to be made under Section 174(3) of the Act.
Other mattersThe supplementary information set out in Note 34 on page 127 is disclosed to meet the requirement of Bursa Malaysia Securities Berhad. The directors are responsible for the preparation of the supplementary information in accordance with Guidance on Special Matter No. 1, Determination of Realised and unrealised Profits or Losses in the Context of Disclosure Pursuant to Bursa Malaysia Securities Berhad Listing Requirements, as issued by the Malaysian Institute of Accountants (“MIA Guidance”) and the directive of Bursa Malaysia Securities Berhad. In our opinion, the supplementary information is prepared, in all material respects, in accordance with the MIA Guidance and the directive of Bursa Malaysia Securities Berhad.
This report is made solely to the members of the Company, as a body, in accordance with Section 174 of the Companies Act, 1965 in Malaysia and for no other purpose. We do not assume responsibility to any other person for the content of this report.
Ernst & Young AF: 0039 Chartered Accountants
Kuala Lumpur, Malaysia25 May 2011
Ismed Darwis BahatiarNo. 2921/04/12(J)Chartered Accountant
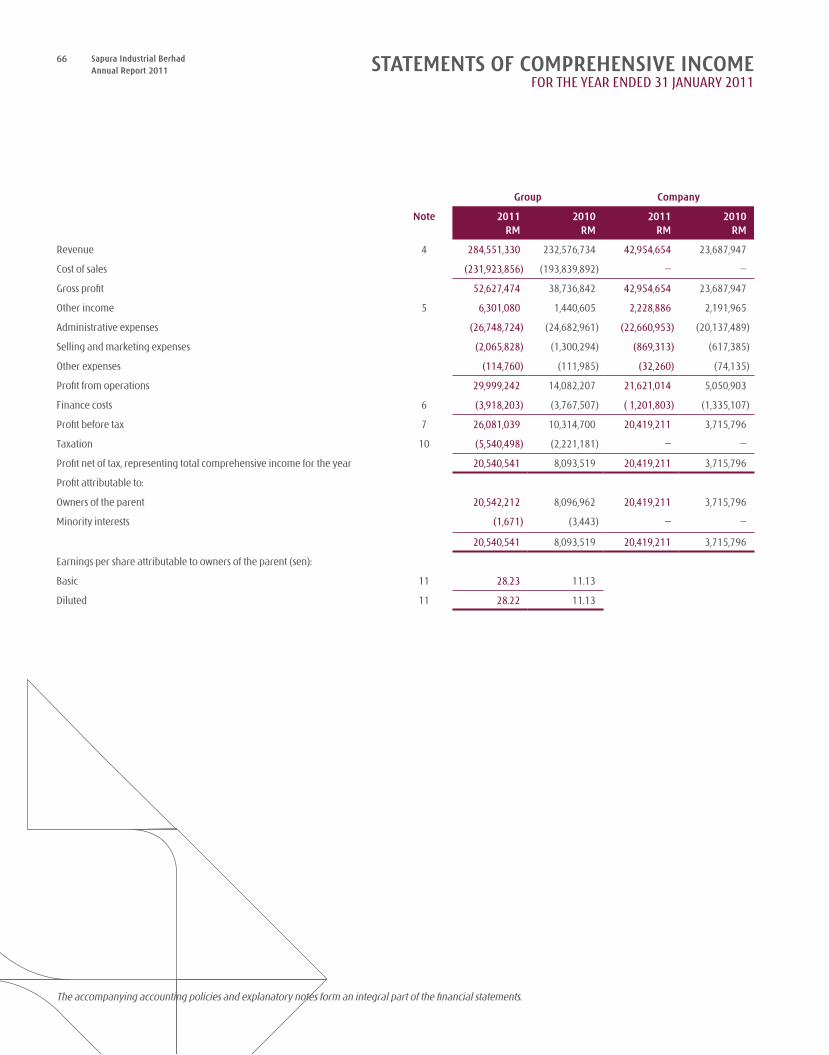
66 Sapura Industrial BerhadAnnual Report 2011
Group Company
Note 2011 2010 2011 2010RM RM RM RM
Revenue 4 284,551,330 232,576,734 42,954,654 23,687,947
Cost of sales (231,923,856) (193,839,892) – –
Gross profit 52,627,474 38,736,842 42,954,654 23,687,947
Other income 5 6,301,080 1,440,605 2,228,886 2,191,965
Administrative expenses (26,748,724) (24,682,961) (22,660,953) (20,137,489)
Selling and marketing expenses (2,065,828) (1,300,294) (869,313) (617,385)
Other expenses (114,760) (111,985) (32,260) (74,135)
Profit from operations 29,999,242 14,082,207 21,621,014 5,050,903
Finance costs 6 (3,918,203) (3,767,507) ( 1,201,803) (1,335,107)
Profit before tax 7 26,081,039 10,314,700 20,419,211 3,715,796
Taxation 10 (5,540,498) (2,221,181) – –
Profit net of tax, representing total comprehensive income for the year 20,540,541 8,093,519 20,419,211 3,715,796
Profit attributable to:
Owners of the parent 20,542,212 8,096,962 20,419,211 3,715,796
Minority interests (1,671) (3,443) – –
20,540,541 8,093,519 20,419,211 3,715,796
Earnings per share attributable to owners of the parent (sen):
Basic 11 28.23 11.13
Diluted 11 28.22 11.13
The accompanying accounting policies and explanatory notes form an integral part of the financial statements.
STATEMENTS OF COMPREHENSIVE INCOMEFOR THE YEAR ENDED 31 JANuARY 2011
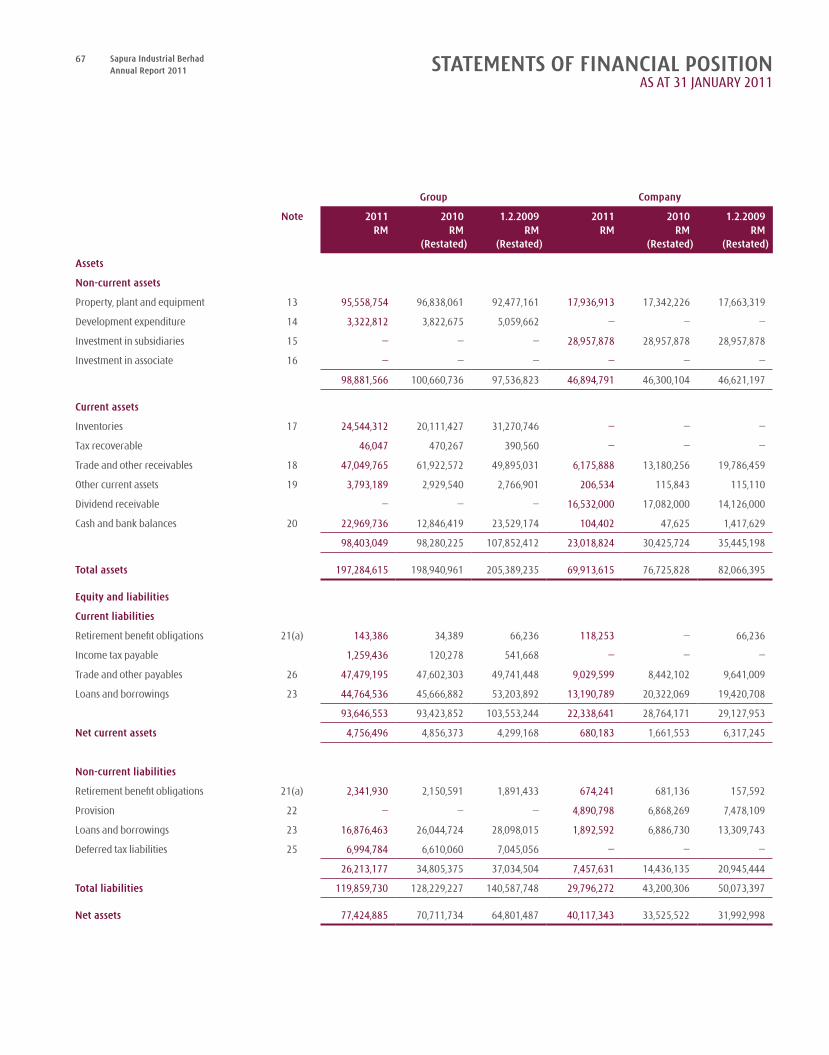
67 Sapura Industrial BerhadAnnual Report 2011 STATEMENTS OF FINANCIAL POSITION
AS AT 31 JANuARY 2011
Group Company
Note 2011 2010 1.2.2009 2011 2010 1.2.2009RM RM RM RM RM RM
(Restated) (Restated) (Restated) (Restated)
Assets
Non-current assets
Property, plant and equipment 13 95,558,754 96,838,061 92,477,161 17,936,913 17,342,226 17,663,319
Development expenditure 14 3,322,812 3,822,675 5,059,662 – – –
Investment in subsidiaries 15 – – – 28,957,878 28,957,878 28,957,878
Investment in associate 16 – – – – – –
98,881,566 100,660,736 97,536,823 46,894,791 46,300,104 46,621,197
Current assets
Inventories 17 24,544,312 20,111,427 31,270,746 – – –
Tax recoverable 46,047 470,267 390,560 – – –
Trade and other receivables 18 47,049,765 61,922,572 49,895,031 6,175,888 13,180,256 19,786,459
Other current assets 19 3,793,189 2,929,540 2,766,901 206,534 115,843 115,110
Dividend receivable – – – 16,532,000 17,082,000 14,126,000
Cash and bank balances 20 22,969,736 12,846,419 23,529,174 104,402 47,625 1,417,629
98,403,049 98,280,225 107,852,412 23,018,824 30,425,724 35,445,198
Total assets 197,284,615 198,940,961 205,389,235 69,913,615 76,725,828 82,066,395
Equity and liabilities
Current liabilities
Retirement benefit obligations 21(a) 143,386 34,389 66,236 118,253 – 66,236
Income tax payable 1,259,436 120,278 541,668 – – –
Trade and other payables 26 47,479,195 47,602,303 49,741,448 9,029,599 8,442,102 9,641,009
Loans and borrowings 23 44,764,536 45,666,882 53,203,892 13,190,789 20,322,069 19,420,708
93,646,553 93,423,852 103,553,244 22,338,641 28,764,171 29,127,953
Net current assets 4,756,496 4,856,373 4,299,168 680,183 1,661,553 6,317,245
Non-current liabilities
Retirement benefit obligations 21(a) 2,341,930 2,150,591 1,891,433 674,241 681,136 157,592
Provision 22 – – – 4,890,798 6,868,269 7,478,109
Loans and borrowings 23 16,876,463 26,044,724 28,098,015 1,892,592 6,886,730 13,309,743
Deferred tax liabilities 25 6,994,784 6,610,060 7,045,056 – – –
26,213,177 34,805,375 37,034,504 7,457,631 14,436,135 20,945,444
Total liabilities 119,859,730 128,229,227 140,587,748 29,796,272 43,200,306 50,073,397
Net assets 77,424,885 70,711,734 64,801,487 40,117,343 33,525,522 31,992,998
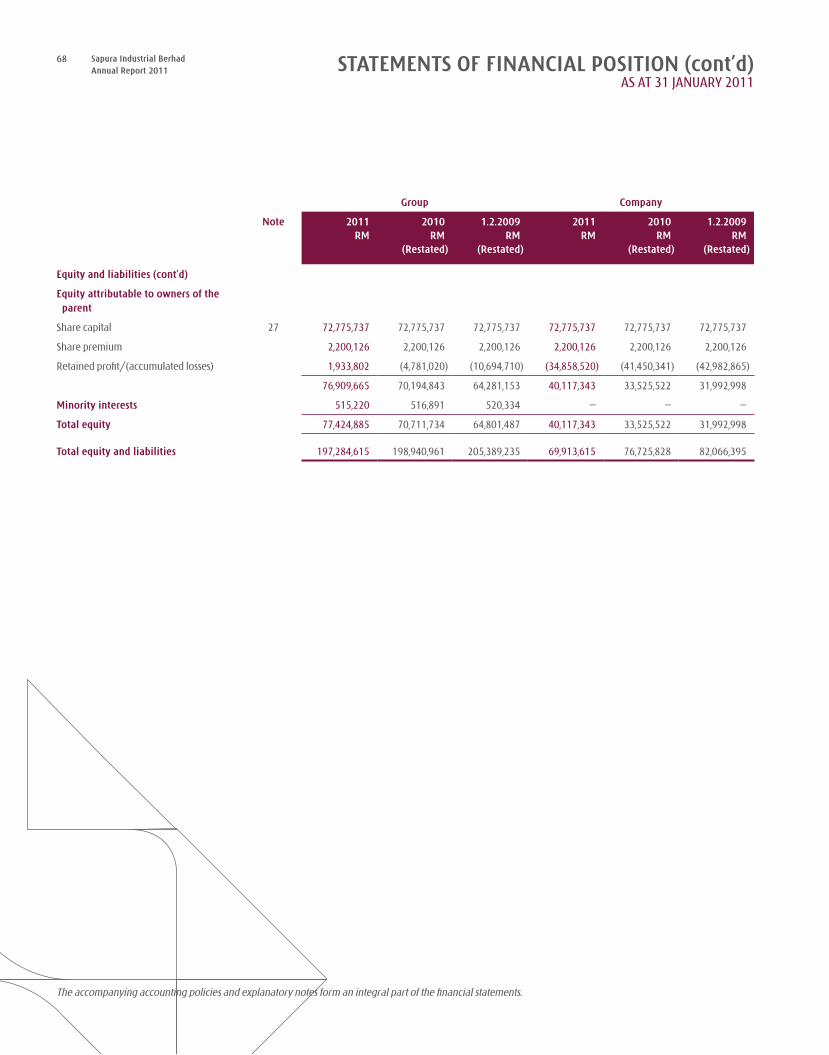
68 Sapura Industrial BerhadAnnual Report 2011
Group Company
Note 2011 2010 1.2.2009 2011 2010 1.2.2009RM RM RM RM RM RM
(Restated) (Restated) (Restated) (Restated)
Equity and liabilities (cont’d)
Equity attributable to owners of the parent
Share capital 27 72,775,737 72,775,737 72,775,737 72,775,737 72,775,737 72,775,737
Share premium 2,200,126 2,200,126 2,200,126 2,200,126 2,200,126 2,200,126
Retained profit/(accumulated losses) 1,933,802 (4,781,020) (10,694,710) (34,858,520) (41,450,341) (42,982,865)
76,909,665 70,194,843 64,281,153 40,117,343 33,525,522 31,992,998
Minority interests 515,220 516,891 520,334 – – –
Total equity 77,424,885 70,711,734 64,801,487 40,117,343 33,525,522 31,992,998
Total equity and liabilities 197,284,615 198,940,961 205,389,235 69,913,615 76,725,828 82,066,395
The accompanying accounting policies and explanatory notes form an integral part of the financial statements.
STATEMENTS OF FINANCIAL POSITION (cont’d)AS AT 31 JANuARY 2011
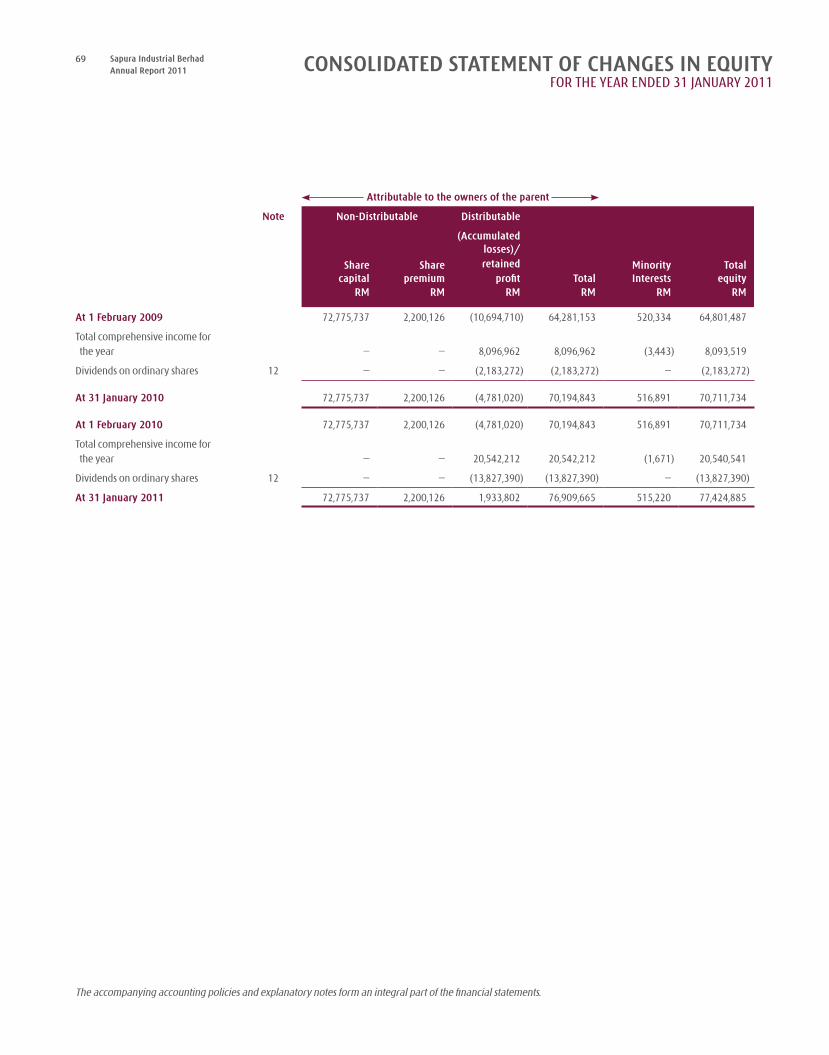
69 Sapura Industrial BerhadAnnual Report 2011
The accompanying accounting policies and explanatory notes form an integral part of the financial statements.
Attributable to the owners of the parent
Note Non-Distributable Distributable
Sharecapital
Sharepremium
(Accumulatedlosses)/retained
profit TotalMinorityInterests
Totalequity
RM RM RM RM RM RM
At 1 February 2009 72,775,737 2,200,126 (10,694,710) 64,281,153 520,334 64,801,487
Total comprehensive income for the year – – 8,096,962 8,096,962 (3,443) 8,093,519
Dividends on ordinary shares 12 – – (2,183,272) (2,183,272) – (2,183,272)
At 31 January 2010 72,775,737 2,200,126 (4,781,020) 70,194,843 516,891 70,711,734
At 1 February 2010 72,775,737 2,200,126 (4,781,020) 70,194,843 516,891 70,711,734
Total comprehensive income for the year – – 20,542,212 20,542,212 (1,671) 20,540,541
Dividends on ordinary shares 12 – – (13,827,390) (13,827,390) – (13,827,390)
At 31 January 2011 72,775,737 2,200,126 1,933,802 76,909,665 515,220 77,424,885
CONSOLIDATED STATEMENT OF CHANGES IN EqUITYFOR THE YEAR ENDED 31 JANuARY 2011
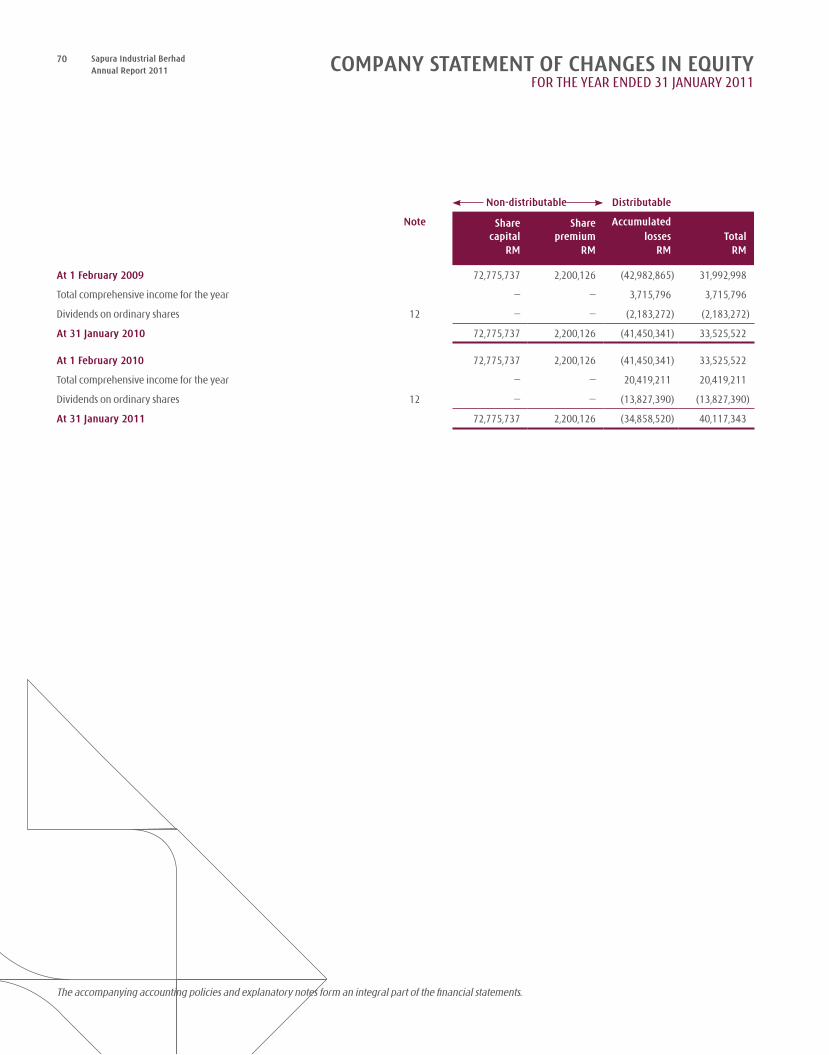
70 Sapura Industrial BerhadAnnual Report 2011
Non-distributable Distributable
Note Sharecapital
Sharepremium
Accumulatedlosses Total
RM RM RM RM
At 1 February 2009 72,775,737 2,200,126 (42,982,865) 31,992,998
Total comprehensive income for the year – – 3,715,796 3,715,796
Dividends on ordinary shares 12 – – (2,183,272) (2,183,272)
At 31 January 2010 72,775,737 2,200,126 (41,450,341) 33,525,522
At 1 February 2010 72,775,737 2,200,126 (41,450,341) 33,525,522
Total comprehensive income for the year – – 20,419,211 20,419,211
Dividends on ordinary shares 12 – – (13,827,390) (13,827,390)
At 31 January 2011 72,775,737 2,200,126 (34,858,520) 40,117,343
COMPANY STATEMENT OF CHANGES IN EqUITYFOR THE YEAR ENDED 31 JANuARY 2011
The accompanying accounting policies and explanatory notes form an integral part of the financial statements.
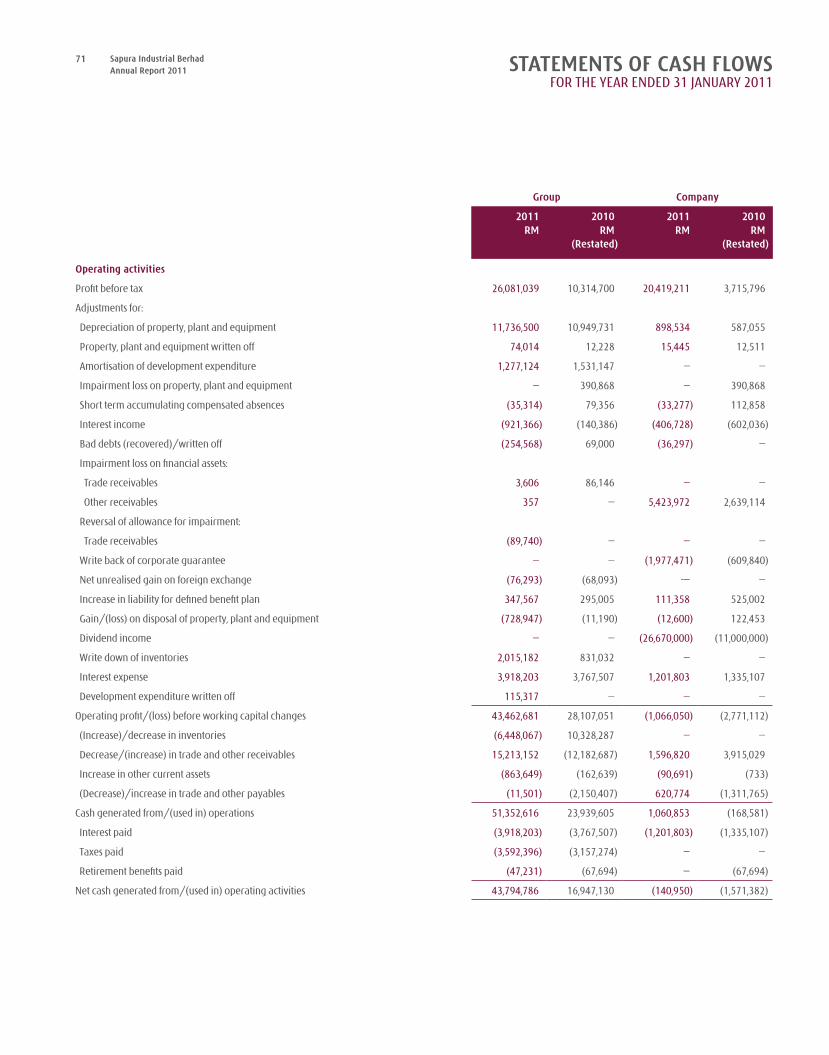
71 Sapura Industrial BerhadAnnual Report 2011 STATEMENTS OF CASH FLOWS
FOR THE YEAR ENDED 31 JANuARY 2011
Group Company
2011 2010 2011 2010RM RM RM RM
(Restated) (Restated)
Operating activities
Profit before tax 26,081,039 10,314,700 20,419,211 3,715,796
Adjustments for:
Depreciation of property, plant and equipment 11,736,500 10,949,731 898,534 587,055
Property, plant and equipment written off 74,014 12,228 15,445 12,511
Amortisation of development expenditure 1,277,124 1,531,147 – –
Impairment loss on property, plant and equipment – 390,868 – 390,868
Short term accumulating compensated absences (35,314) 79,356 (33,277) 112,858
Interest income (921,366) (140,386) (406,728) (602,036)
Bad debts (recovered)/written off (254,568) 69,000 (36,297) –
Impairment loss on financial assets:
Trade receivables 3,606 86,146 – –
Other receivables 357 – 5,423,972 2,639,114
Reversal of allowance for impairment:
Trade receivables (89,740) – – –
Write back of corporate guarantee – – (1,977,471) (609,840)
Net unrealised gain on foreign exchange (76,293) (68,093) -– –
Increase in liability for defined benefit plan 347,567 295,005 111,358 525,002
Gain/(loss) on disposal of property, plant and equipment (728,947) (11,190) (12,600) 122,453
Dividend income – – (26,670,000) (11,000,000)
Write down of inventories 2,015,182 831,032 – –
Interest expense 3,918,203 3,767,507 1,201,803 1,335,107
Development expenditure written off 115,317 – – –
Operating profit/(loss) before working capital changes 43,462,681 28,107,051 (1,066,050) (2,771,112)
(Increase)/decrease in inventories (6,448,067) 10,328,287 – –
Decrease/(increase) in trade and other receivables 15,213,152 (12,182,687) 1,596,820 3,915,029
Increase in other current assets (863,649) (162,639) (90,691) (733)
(Decrease)/increase in trade and other payables (11,501) (2,150,407) 620,774 (1,311,765)
Cash generated from/(used in) operations 51,352,616 23,939,605 1,060,853 (168,581)
Interest paid (3,918,203) (3,767,507) (1,201,803) (1,335,107)
Taxes paid (3,592,396) (3,157,274) – –
Retirement benefits paid (47,231) (67,694) – (67,694)
Net cash generated from/(used in) operating activities 43,794,786 16,947,130 (140,950) (1,571,382)
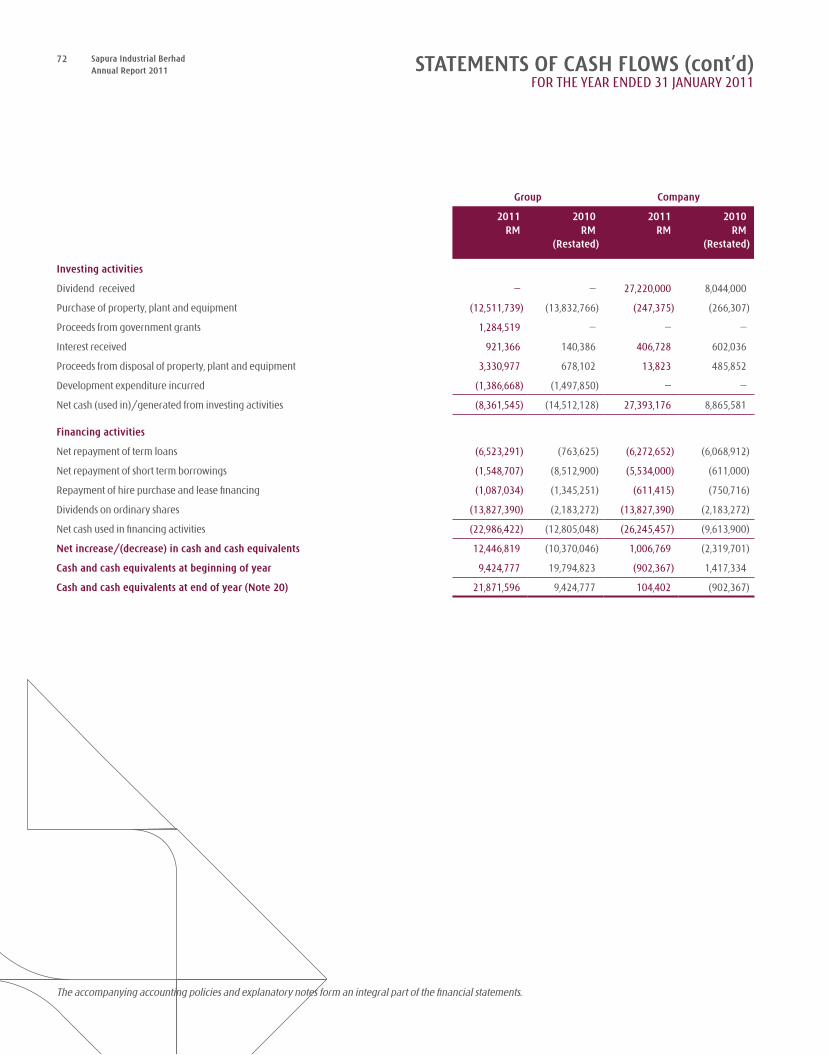
72 Sapura Industrial BerhadAnnual Report 2011 STATEMENTS OF CASH FLOWS (cont’d)
FOR THE YEAR ENDED 31 JANuARY 2011
Group Company
2011 2010 2011 2010RM RM RM RM
(Restated) (Restated)
Investing activities
Dividend received – – 27,220,000 8,044,000
Purchase of property, plant and equipment (12,511,739) (13,832,766) (247,375) (266,307)
Proceeds from government grants 1,284,519 – – –
Interest received 921,366 140,386 406,728 602,036
Proceeds from disposal of property, plant and equipment 3,330,977 678,102 13,823 485,852
Development expenditure incurred (1,386,668) (1,497,850) – –
Net cash (used in)/generated from investing activities (8,361,545) (14,512,128) 27,393,176 8,865,581
Financing activities
Net repayment of term loans (6,523,291) (763,625) (6,272,652) (6,068,912)
Net repayment of short term borrowings (1,548,707) (8,512,900) (5,534,000) (611,000)
Repayment of hire purchase and lease financing (1,087,034) (1,345,251) (611,415) (750,716)
Dividends on ordinary shares (13,827,390) (2,183,272) (13,827,390) (2,183,272)
Net cash used in financing activities (22,986,422) (12,805,048) (26,245,457) (9,613,900)
Net increase/(decrease) in cash and cash equivalents 12,446,819 (10,370,046) 1,006,769 (2,319,701)
Cash and cash equivalents at beginning of year 9,424,777 19,794,823 (902,367) 1,417,334
Cash and cash equivalents at end of year (Note 20) 21,871,596 9,424,777 104,402 (902,367)
The accompanying accounting policies and explanatory notes form an integral part of the financial statements.
73 Sapura Industrial BerhadAnnual Report 2011
1. CORPORATE INFORMATION Sapura Industrial Berhad (“the Company”) is a public limited liability company incorporated and domiciled in Malaysia, and is listed on the Bursa Malaysia
Securities Berhad (“Bursa Malaysia”). The registered office of the Company is located at Lot 2 & 4, Jalan P/11 Seksyen 10, Kawasan Perindustrian Bangi, 43650 Bandar Baru Bangi, Selangor.
The holding company is Sapura Holdings Sdn. Bhd., a company incorporated in Malaysia.
The principal activities of the Company are investment holding and the provision of management services to its subsidiaries. The principal activities of the subsidiaries are disclosed in Note 15.
There have been no significant changes in the nature of the principal activities during the financial year.
2. SIGNIFICANT ACCOUNTING POLICIES
2.1 Basis of preparation
The financial statements comply with the provisions of the Companies Act, 1965 and applicable Financial Reporting Standards (“FRS”) in Malaysia. At the beginning of the current financial year, the Group and the Company adopted new and revised FRS which are mandatory for financial periods beginning on or after 1 January 2010 as described fully in Note 2.2.
The financial statements of the Group and of the Company have been prepared under the historical cost basis except as disclosed in the accounting policies below.
The financial statements are presented in Ringgit Malaysia (“RM”) except when otherwise indicated.
2.2 Changes in accounting policies
The accounting policies adopted are consistent with those of the previous financial year except as follows:
On 1 February 2010, the Group and the Company adopted the following new and amended FRS and IC Interpretations mandatory for annual financial periods beginning on or after 1 January 2010.
FRS 7 Financial Instruments: DisclosuresFRS 8 Operating SegmentsFRS 101 Presentation of Financial Statements (Revised)FRS 123 Borrowing CostsFRS 139 Financial Instruments: Recognition and MeasurementAmendments to FRS 1 First-time Adoption of Financial Reporting Standards and FRS 127 Consolidated and Separate Financial Statements: Cost of and Investment in a Subsidiary, Jointly Controlled Entity or
AssociateAmendments to FRS 2 Share-based Payment – Vesting Conditions and CancellationsAmendments to FRS 132 Financial Instruments: PresentationAmendments to FRS 139 Financial Instruments: Recognition and Measurement, FRS 7 Financial Instruments: Disclosures and IC Interpretation 9 Reassessment of Embedded DerivativesImprovements to FRS issued in 2009IC Interpretation 9 Reassessment of Embedded DerivativesIC Interpretation 10 Interim Financial Reporting and ImpairmentIC Interpretation 11 FRS 2 – Group and Treasury Share TransactionsIC Interpretation 13 Customer Loyalty ProgrammesIC Interpretation 14 FRS 119 – The Limit on a Defined Benefit Asset, Minimum Funding Requirements and their Interaction
FRS 4 Insurance Contracts and TR i-3 Presentation of Financial Statements of Islamic Financial Institutions will also be effective for annual periods beginning on or after 1 January 2010. These FRS are, however, not applicable to the Group or the Company.
NOTES TO THE FINANCIAL STATEMENTS31 JANuARY 2011
74 Sapura Industrial BerhadAnnual Report 2011 NOTES TO THE FINANCIAL STATEMENTS
31 JANuARY 2011
2. SIGNIFICANT ACCOUNTING POLICIES (cont’d)
2.2 Changes in accounting policies (cont’d)
Adoption of the above standards and interpretations did not have any effect on the financial performance or position of the Group and the Company except for those discussed below:
FRS 7 Financial Instruments: Disclosures
Prior to 1 February 2010, information about financial instruments was disclosed in accordance with the requirements of FRS 132 Financial Instruments: Disclosure and Presentation. FRS 7 introduces new disclosures to improve the information about financial instruments. It requires the disclosure of qualitative and quantitative information about exposure to risks arising from financial instruments, including specified minimum disclosures about credit risk, liquidity risk and market risk, including sensitivity analysis to market risk.
The Group and the Company have applied FRS 7 prospectively in accordance with the transitional provisions. Hence, the new disclosures have not been applied to the comparatives. The new disclosures are included throughout the Group’s and the Company’s financial statements for the year ended 31 January 2011.
FRS 8 Operating Segments
FRS 8, which replaces FRS 114 Segment Reporting, specifies how an entity should report information about its operating segments, based on information about the components of the entity that is available to the chief operating decision maker for the purposes of allocating resources to the segments and assessing their performance. The Standard also requires the disclosure of information about the products and services provided by the segments, the geographical areas in which the Group operates, and revenue from the Group’s major customers. The Group concluded that the reportable operating segments determined in accordance with FRS 8 are the same as the business segments previously identified under FRS 114. The Group has adopted FRS 8 retrospectively. These revised disclosures, including the related revised comparative information, are shown in Note 33 to the financial statements.
FRS 101 Presentation of Financial Statements (Revised)
The revised FRS 101 introduces changes in the presentation and disclosures of financial statements. The revised Standard separates owner and non-owner changes in equity. The statement of changes in equity includes only details of transactions with owners, with all non-owner changes in equity presented as a single line. The Standard also introduces the statement of comprehensive income, with all items of income and expense recognised in profit or loss, together with all other items of income and expense recognised directly in equity, either in one single statement, or in two linked statements. The Group and the Company have elected to present this statement as one single statement.
In addition, a statement of financial position is required at the beginning of the earliest comparative period following a change in accounting policy, the correction of an error or the classification of items in the financial statements.
The revised FRS 101 also requires the Group to make new disclosures to enable users of the financial statements to evaluate the Group’s objectives, policies and processes for managing capital (see Note 32).
The revised FRS 101 was adopted retrospectively by the Group and the Company.
Amendments to FRS 117 Leases
Prior to 1 January 2010, all leases of land and buildings where the title is not expected to pass to the lessee by the end of the lease term and the lessee normally does not receive substantially all the risks and rewards incidental to ownership were classified by the Group as operating lease and where necessary, the minimum lease payments or the up-front payments made were allocated between the land and the buildings elements in proportion to the relative fair values for leasehold interests in the land element and buildings element of the lease at the inception of the lease. The up-front payment represented prepaid lease payments and were amortised on a straight-line basis over the lease term.
The amendments to FRS 117 Leases clarify that leases of land and buildings are classified as operating or finance leases in the same way as leases of other assets. They also clarify that the present value of the residual value of the property in a lease with a term of several decades would be negligible and hence, accounting for the land element as a finance lease in such circumstances would be consistent with the economic position of the lessee. The adoption of the amendments to FRS 117 has resulted in certain unexpired land leases to be reclassified as finance leases. The Group has applied this change in accounting policy retrospectively and certain comparatives have been restated. The following are effects to the consolidated statement of financial positions as at 31 January 2011 arising from the above change in accounting policy:
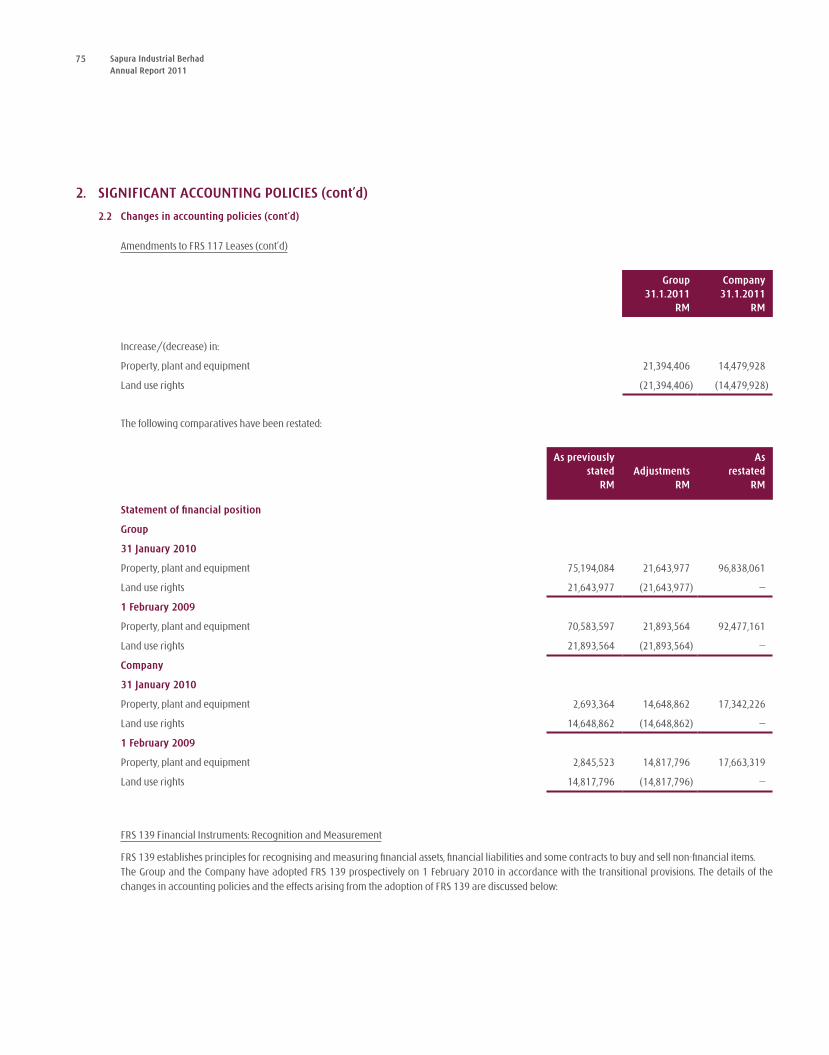
75 Sapura Industrial BerhadAnnual Report 2011
2. SIGNIFICANT ACCOUNTING POLICIES (cont’d)
2.2 Changes in accounting policies (cont’d)
Amendments to FRS 117 Leases (cont’d)
Group Company31.1.2011 31.1.2011
RM RM
Increase/(decrease) in:
Property, plant and equipment 21,394,406 14,479,928
Land use rights (21,394,406) (14,479,928)
The following comparatives have been restated:
As previously Asstated Adjustments restated
RM RM RM
Statement of financial position
Group
31 January 2010
Property, plant and equipment 75,194,084 21,643,977 96,838,061
Land use rights 21,643,977 (21,643,977) –
1 February 2009
Property, plant and equipment 70,583,597 21,893,564 92,477,161
Land use rights 21,893,564 (21,893,564) –
Company
31 January 2010
Property, plant and equipment 2,693,364 14,648,862 17,342,226
Land use rights 14,648,862 (14,648,862) –
1 February 2009
Property, plant and equipment 2,845,523 14,817,796 17,663,319
Land use rights 14,817,796 (14,817,796) –
FRS 139 Financial Instruments: Recognition and Measurement
FRS 139 establishes principles for recognising and measuring financial assets, financial liabilities and some contracts to buy and sell non-financial items. The Group and the Company have adopted FRS 139 prospectively on 1 February 2010 in accordance with the transitional provisions. The details of the
changes in accounting policies and the effects arising from the adoption of FRS 139 are discussed below:
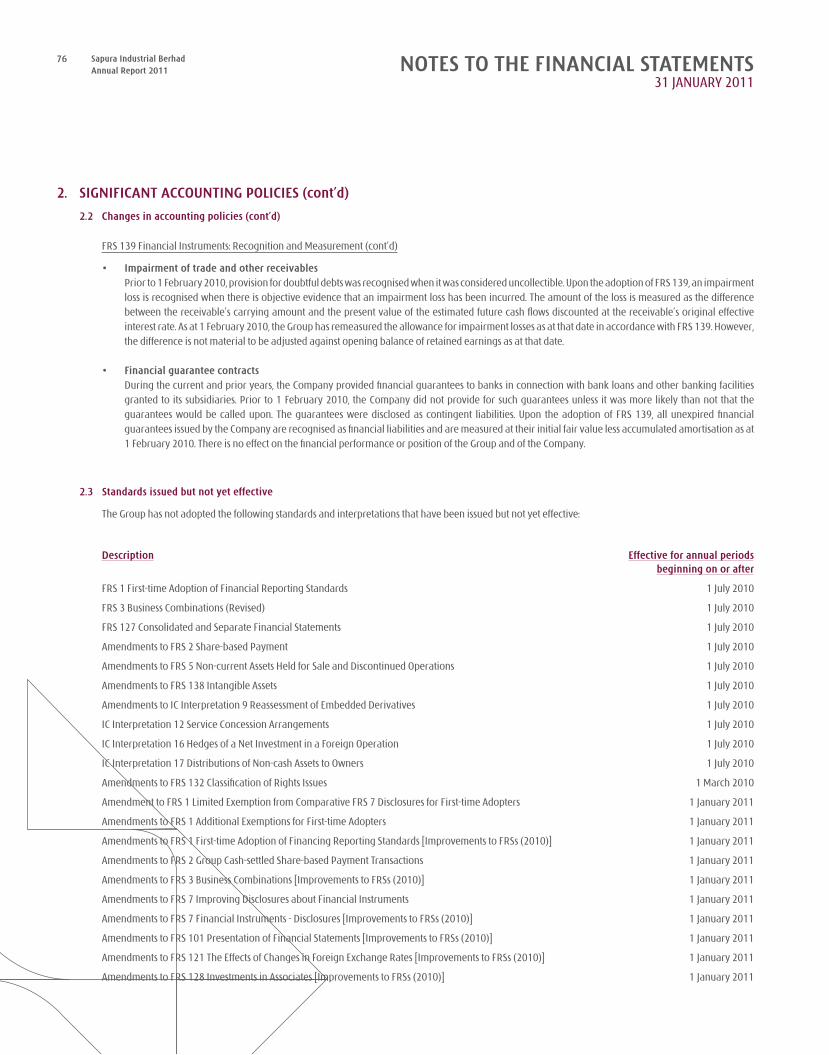
76 Sapura Industrial BerhadAnnual Report 2011 NOTES TO THE FINANCIAL STATEMENTS
31 JANuARY 2011
2. SIGNIFICANT ACCOUNTING POLICIES (cont’d)
2.2 Changes in accounting policies (cont’d)
FRS 139 Financial Instruments: Recognition and Measurement (cont’d)
Impairment of trade and other receivables• Prior to 1 February 2010, provision for doubtful debts was recognised when it was considered uncollectible. upon the adoption of FRS 139, an impairment
loss is recognised when there is objective evidence that an impairment loss has been incurred. The amount of the loss is measured as the difference between the receivable’s carrying amount and the present value of the estimated future cash flows discounted at the receivable’s original effective interest rate. As at 1 February 2010, the Group has remeasured the allowance for impairment losses as at that date in accordance with FRS 139. However, the difference is not material to be adjusted against opening balance of retained earnings as at that date.
Financial guarantee contracts• During the current and prior years, the Company provided financial guarantees to banks in connection with bank loans and other banking facilities
granted to its subsidiaries. Prior to 1 February 2010, the Company did not provide for such guarantees unless it was more likely than not that the guarantees would be called upon. The guarantees were disclosed as contingent liabilities. upon the adoption of FRS 139, all unexpired financial guarantees issued by the Company are recognised as financial liabilities and are measured at their initial fair value less accumulated amortisation as at 1 February 2010. There is no effect on the financial performance or position of the Group and of the Company.
2.3 Standards issued but not yet effective
The Group has not adopted the following standards and interpretations that have been issued but not yet effective:
Description Effective for annual periodsbeginning on or after
FRS 1 First-time Adoption of Financial Reporting Standards 1 July 2010
FRS 3 Business Combinations (Revised) 1 July 2010
FRS 127 Consolidated and Separate Financial Statements 1 July 2010
Amendments to FRS 2 Share-based Payment 1 July 2010
Amendments to FRS 5 Non-current Assets Held for Sale and Discontinued Operations 1 July 2010
Amendments to FRS 138 Intangible Assets 1 July 2010
Amendments to IC Interpretation 9 Reassessment of Embedded Derivatives 1 July 2010
IC Interpretation 12 Service Concession Arrangements 1 July 2010
IC Interpretation 16 Hedges of a Net Investment in a Foreign Operation 1 July 2010
IC Interpretation 17 Distributions of Non-cash Assets to Owners 1 July 2010
Amendments to FRS 132 Classification of Rights Issues 1 March 2010
Amendment to FRS 1 Limited Exemption from Comparative FRS 7 Disclosures for First-time Adopters 1 January 2011
Amendments to FRS 1 Additional Exemptions for First-time Adopters 1 January 2011
Amendments to FRS 1 First-time Adoption of Financing Reporting Standards [Improvements to FRSs (2010)] 1 January 2011
Amendments to FRS 2 Group Cash-settled Share-based Payment Transactions 1 January 2011
Amendments to FRS 3 Business Combinations [Improvements to FRSs (2010)] 1 January 2011
Amendments to FRS 7 Improving Disclosures about Financial Instruments 1 January 2011
Amendments to FRS 7 Financial Instruments - Disclosures [Improvements to FRSs (2010)] 1 January 2011
Amendments to FRS 101 Presentation of Financial Statements [Improvements to FRSs (2010)] 1 January 2011
Amendments to FRS 121 The Effects of Changes in Foreign Exchange Rates [Improvements to FRSs (2010)] 1 January 2011
Amendments to FRS 128 Investments in Associates [Improvements to FRSs (2010)] 1 January 2011
77 Sapura Industrial BerhadAnnual Report 2011
Description Effective for annual periodsbeginning on or after
Amendments to FRS 131 Interests in Joint Ventures [Improvements to FRSs (2010)] 1 January 2011
Amendments to FRS 132 Financial Instruments Presentation [Improvements to FRSs (2010)] 1 January 2011
Amendments to FRS 134 Interim Financial Reporting [Improvements to FRSs (2010)] 1 January 2011
Amendments to FRS 139 Financial Instruments: Recognition and Measurement [Improvements to FRSs (2010)] 1 January 2011
Amendments to IC Interpretation 13 Customer Loyalty Programme [Improvements to FRSs (2010)] 1 January 2011
Amendments to IC Interpretation 14 Prepayments of a Minimum Funding Requirement 1 July 2011
IC Interpretation 4 Determining whether an Arrangement contains a Lease 1 January 2011
IC Interpretation 18 Transfers of Assets from Customers 1 January 2011
IC Interpretation 19 Extinguishing Financial Liabilities with Equity Instruments 1 July 2011
FRS 124 Related Party Disclosures (revised) 1 January 2012
IC Interpretation 15 Agreements for the Construction of Real Estate 1 January 2012
Except for the changes in accounting policies arising from the adoption of the revised FRS 3 and the amendments to FRS 127, as well as the new disclosures required under the amendments to FRS 7, the directors expect that the adoption of the standards and interpretations above will have no material impact on the financial statements in the period of initial application. The nature of the impending changes in accounting policy on adoption of the revised FRS 3 and the amendments to FRS 127 are described below.
Revised FRS 3 Business Combinations and Amendments to FRS 127 Consolidated and Separate Financial Statements
The revised standards are effective for annual periods beginning on or after 1 July 2010. The revised FRS 3 introduces a number of changes in the accounting for business combinations occurring after 1 July 2010. These changes will impact the amount of goodwill recognised, the reported results in the period that an acquisition occurs, and future reported results. The amendments to FRS 127 require that a change in the ownership interest of a subsidiary (without loss of control) is accounted for as an equity transaction. Therefore, such transactions will no longer give rise to goodwill, nor will they give rise to a gain or loss. Furthermore, the amended standard changes the accounting for losses incurred by the subsidiary as well as the loss of control of a subsidiary. Other consequential amendments have been made to FRS 107 Statement of Cash Flows, FRS 112 Income Taxes, FRS 121 The Effects of Changes in Foreign Exchange Rates, FRS 128 Investments in Associates and FRS 131 Interests in Joint Ventures. The changes from revised FRS 3 and amendments to FRS 127 will affect future acquisitions or loss of control and transactions with minority interests. The standards may be early adopted. However, the Group does not intend to early adopt.
2.4 Basis of consolidation
The consolidated financial statements comprise the financial statements of the Company and its subsidiaries as at the reporting date. The financial statements of the subsidiaries used in the preparation of the consolidated financial statements are prepared for the same reporting date as the Company. Consistent accounting policies are applied to like transactions and events in similar circumstances.
All intra-group balances, income and expenses and unrealised gains and losses resulting from intra-group transactions are eliminated in full.
2. SIGNIFICANT ACCOUNTING POLICIES (cont’d)
2.3 Standards issued but not yet effective (cont’d)
78 Sapura Industrial BerhadAnnual Report 2011 NOTES TO THE FINANCIAL STATEMENTS
31 JANuARY 2011
2. SIGNIFICANT ACCOUNTING POLICIES (cont’d)
2.4 Basis of consolidation (cont’d)
Acquisitions of subsidiaries are accounted for by applying the purchase method. Identifiable assets acquired and liabilities and contingent liabilities assumed in a business combination are measured initially at their fair values at the acquisition date. Adjustments to those fair values relating to previously held interests are treated as a revaluation and recognised in other comprehensive income. The cost of a business combination is measured as the aggregate of the fair values, at the date of exchange, of the assets given, liabilities incurred or assumed, and equity instruments issued, plus any costs directly attributable to the business combination. Any excess of the cost of business combination over the Group’s share in the net fair value of the acquired subsidiary’s identifiable assets, liabilities and contingent liabilities is recorded as goodwill on the statement of financial position. Any excess of the Group’s share in the net fair value of the acquired subsidiary’s identifiable assets, liabilities and contingent liabilities over the cost of business combination is recognised as income in profit or loss on the date of acquisition. When the Group acquires a business, embedded derivatives separated from the host contract by the acquiree are reassessed on acquisition unless the business combination results in a change in the terms of the contract that significantly modifies the cash flows that would otherwise be required under the contract.
Subsidiaries are consolidated from the date of acquisition, being the date on which the Group obtains control, and continue to be consolidated until the date that such control ceases.
2.5 Transactions with minority interests
Minority interests represent the portion of profit or loss and net assets in subsidiaries not held by the Group and are presented separately in profit or loss of the Group and within equity in the consolidated statement of financial position, separately from parent shareholders’ equity. Transactions with minority interests are accounted for using the entity concept method, whereby, transactions with minority interests are accounted for as transactions with owners. On acquisition of minority interests, the difference between the consideration and book value of the share of the net assets acquired is recognised directly in equity. Gain or loss on disposal to minority interests is recognised directly in equity.
2.6 Foreign currency
(a) Functional and presentation currency
The individual financial statements of each entity in the Group are measured using the currency of the primary economic environment in which the entity operates (“the functional currency”). The consolidated financial statements are presented in Ringgit Malaysia, which is also the Company’s functional currency.
(b) Foreign currency transactions
Transactions in foreign currencies are measured in the respective functional currencies of the Company and its subsidiaries and are recorded on initial recognition in the functional currencies at exchange rates approximating those ruling at the transaction dates. Monetary assets and liabilities denominated in foreign currencies are translated at the rate of exchange ruling at the reporting date. Non-monetary items denominated in foreign currencies that are measured at historical cost are translated using the exchange rates as at the dates of the initial transactions. Non-monetary items denominated in foreign currencies measured at fair value are translated using the exchange rates at the date when the fair value was determined.
Exchange differences arising on the settlement of monetary items or on translating monetary items at the reporting date are recognised in profit or loss except for exchange differences arising on monetary items that form part of the Group’s net investment in foreign operations, which are recognised initially in other comprehensive income and accumulated under foreign currency translation reserve in equity. The foreign currency translation reserve is reclassified from equity to profit or loss of the Group on disposal of the foreign operation.
Exchange differences arising on the translation of non-monetary items carried at fair value are included in profit or loss for the period except for the differences arising on the translation of non-monetary items in respect of which gains and losses are recognised directly in equity. Exchange differences arising from such non-monetary items are also recognised directly in equity.
79 Sapura Industrial BerhadAnnual Report 2011
2. SIGNIFICANT ACCOUNTING POLICIES (cont’d)
2.7 Property, plant and equipment and depreciation
All items of property, plant and equipment are initially recorded at cost. The cost of an item of property, plant and equipment is recognised as an asset if, and only if, it is probable that future economic benefits associated with the item will flow to the Group and the cost of the item can be measured reliably.
Subsequent to recognition, property, plant and equipment are stated at cost less accumulated depreciation and accumulated impairment losses. When significant parts of property, plant and equipment are required to be replaced in intervals, the Group recognises such parts as individual assets with specific useful lives and depreciation, respectively. Likewise, when a major inspection is performed, its cost is recognised in the carrying amount of the property, plant and equipment as a replacement if the recognition criteria are satisfied. All other repair and maintenance costs are recognised in profit or loss as incurred.
Leasehold lands are depreciated over the period of the respective leases of 99 years. Depreciation is computed on a straight-line basis over the estimated useful lives of the assets as follows:
Buildings 2%
Plant, machinery, electrical installation, factory equipment and application tools 10% to 33%
Furniture, fixtures, office equipment, renovations, computers and motor vehicles 8% to 25% The carrying values of property, plant and equipment are reviewed for impairment when events or changes in circumstances indicate that the carrying value
may not be recoverable.
The residual value, useful life and depreciation method are reviewed at each financial year end, and adjusted prospectively, if appropriate.
An item of property, plant and equipment is derecognised upon disposal or when no future economic benefits are expected from its use or disposal. Any gain or loss on derecognition of the asset is included in the profit or loss in the year the asset is derecognised.
2.8 Intangible assets
(a) Goodwill
Goodwill is initially measured at cost. Following initial recognition, goodwill is measured at cost less accumulated impairment losses.
For the purpose of impairment testing, goodwill acquired is allocated, from the acquisition date, to each of the Group’s cash-generating units that are expected to benefit from the synergies of the combination.
The cash-generating unit to which goodwill has been allocated is tested for impairment annually and whenever there is an indication that the cash-generating unit may be impaired, by comparing the carrying amount of the cash-generating unit, including the allocated goodwill, with the recoverable amount of the cash-generating unit. Where the recoverable amount of the cash-generating unit is less than the carrying amount, an impairment loss is recognised in the profit or loss. Impairment losses recognised for goodwill are not reversed in subsequent periods.
Where goodwill forms part of a cash-generating unit and part of the operation within that cash-generating unit is disposed of, the goodwill associated with the operation disposed of is included in the carrying amount of the operation when determining the gain or loss on disposal of the operation. Goodwill disposed of in this circumstance is measured based on the relative fair values of the operations disposed of and the portion of the cash-generating unit retained.
Goodwill and fair value adjustments arising on the acquisition of foreign operation on or after 1 January 2006 are treated as assets and liabilities of the foreign operations and are recorded in the functional currency of the foreign operations and translated in accordance with the accounting policy set out in Note 2.6.
Goodwill and fair value adjustments which arose on acquisitions of foreign operation before 1 January 2006 are deemed to be assets and liabilities of the Company and are recorded in RM at the rates prevailing at the date of acquisition.
80 Sapura Industrial BerhadAnnual Report 2011 NOTES TO THE FINANCIAL STATEMENTS
31 JANuARY 2011
2. SIGNIFICANT ACCOUNTING POLICIES (cont’d)
2.8 Intangible assets (cont’d)
(b) Other intangible assets
Intangible assets acquired separately are measured initially at cost. The cost of intangible assets acquired in a business combination is their fair value as at the date of acquisition. Following initial acquisition, intangible assets are measured at cost less any accumulated amortisation and accumulated impairment losses.
Intangible assets with finite useful lives are amortised over the estimated useful lives and assessed for impairment whenever there is an indication that the intangible asset may be impaired. The amortisation period and the amortisation method are reviewed at least at each financial year-end. Changes in the expected useful life or the expected pattern of consumption of future economic benefits embodied in the asset is accounted for by changing the amortisation period or method, as appropriate, and are treated as changes in accounting estimates. The amortisation expense on intangible assets with finite lives is recognised in profit or loss.
Intangible assets with indefinite useful lives or not yet available for use are tested for impairment annually, or more frequently if the events and circumstances indicate that the carrying value may be impaired either individually or at the cash-generating unit level. Such intangible assets are not amortised. The useful life of an intangible asset with an indefinite useful life is reviewed annually to determine whether the useful life assessment continues to be supportable. If not, the change in useful life from indefinite to finite is made on a prospective basis.
Gains or losses arising from derecognition of an intangible asset are measured as the difference between the net disposal proceeds and the carrying amount of the asset and are recognised in profit or loss when the asset is derecognised.
Research and development costs
Research costs are expensed as incurred. Deferred development costs arising from development expenditures on an individual project are recognised when the Group can demonstrate the technical feasibility of completing the intangible asset so that it will be available for use or sale, its intention to complete and its ability to use or sell the asset, how the asset will generate future economic benefits, the availability of resources to complete and the ability to measure reliably the expenditures during development. Deferred development costs have a finite useful life and are amortised over the period of expected sales from the related project (not exceeding five years) on a straight line basis.
2.9 Impairment of non-financial assets
The Group assesses at each reporting date whether there is an indication that an asset may be impaired. If any such indication exists, or when an annual impairment assessment for an asset is required, the Group makes an estimate of the asset’s recoverable amount.
An asset’s recoverable amount is the higher of an asset’s fair value less costs to sell and its value in use. For the purpose of assessing impairment, assets are
grouped at the lowest levels for which there are separately identifiable cash flows (cash-generating units (“CGu”)).
In assessing value in use, the estimated future cash flows expected to be generated by the asset are discounted to their present value using a pre-tax discount rate that reflects current market assessments of the time value of money and the risks specific to the asset. Where the carrying amount of an asset exceeds its recoverable amount, the asset is written down to its recoverable amount. Impairment losses recognised in respect of a CGu or groups of CGus are allocated first to reduce the carrying amount of any goodwill allocated to those units or groups of units and then, to reduce the carrying amount of the other assets in the unit or groups of units on a pro-rata basis.
Impairment losses are recognised in profit or loss except for assets that are previously revalued where the revaluation was taken to other comprehensive income. In this case the impairment is also recognised in other comprehensive income up to the amount of any previous revaluation.
81 Sapura Industrial BerhadAnnual Report 2011
2. SIGNIFICANT ACCOUNTING POLICIES (cont’d)
2.9 Impairment of non-financial assets (cont’d)
An assessment is made at each reporting date as to whether there is any indication that previously recognised impairment losses may no longer exist or may have decreased. A previously recognised impairment loss is reversed only if there has been a change in the estimates used to determine the asset’s recoverable amount since the last impairment loss was recognised. If that is the case, the carrying amount of the asset is increased to its recoverable amount. That increase cannot exceed the carrying amount that would have been determined, net of depreciation, had no impairment loss been recognised previously. Such reversal is recognised in profit or loss unless the asset is measured at revalued amount, in which case the reversal is treated as a revaluation increase. Impairment loss on goodwill is not reversed in a subsequent period.
2.10 Subsidiaries
A subsidiary is an entity over which the Group has the power to govern the financial and operating policies so as to obtain benefits from its activities.
In the Company’s separate financial statements, investments in subsidiaries are accounted for at cost less impairment losses.
2.11 Associates
An associate is an entity, not being a subsidiary or a joint venture, in which the Group has significant influence. An associate is equity accounted for from the date the Group obtains significant influence until the date the Group ceases to have significant influence over the associate.
The Group’s investments in associates are accounted for using the equity method. under the equity method, the investment in associates is measured in the statement of financial position at cost plus post-acquisition changes in the Group’s share of net assets of the associates. Goodwill relating to associates is included in the carrying amount of the investment. Any excess of the Group’s share of the net fair value of the associate’s identifiable assets, liabilities and contingent liabilities over the cost of the investment is excluded from the carrying amount of the investment and is instead included as income in the determination of the Group’s share of the associate’s profit or loss for the period in which the investment is acquired.
When the Group’s share of losses in an associate equals or exceeds its interest in the associate, the Group does not recognise further losses, unless it has incurred obligations or made payments on behalf of the associate.
After application of the equity method, the Group determines whether it is necessary to recognise an additional impairment loss on the Group’s investment in its associates. The Group determines at each reporting date whether there is any objective evidence that the investment in the associate is impaired. If this is the case, the Group calculates the amount of impairment as the difference between the recoverable amount of the associate and its carrying value and recognises the amount in profit or loss.
The financial statements of the associates are prepared as of the same reporting date as the Company. Where necessary, adjustments are made to bring the accounting policies in line with those of the Group.
In the Company’s separate financial statements, investment in associates are stated at cost less impairment losses. On disposal of such investments, the difference between net disposal proceeds and their carrying amounts is included in profit or loss.
2.12 Financial assets
Financial assets are recognised in the statements of financial position when, and only when, the Group and the Company become a party to the contractual provisions of the financial instrument.
When financial assets are recognised initially, they are measured at fair value, plus, in the case of financial assets not at fair value through profit or loss, directly attributable transaction costs.
82 Sapura Industrial BerhadAnnual Report 2011 NOTES TO THE FINANCIAL STATEMENTS
31 JANuARY 2011
2. SIGNIFICANT ACCOUNTING POLICIES (cont’d)
2.12 Financial assets (cont’d)
The Group and the Company determine the classification of their financial assets at initial recognition, and the categories include financial assets at fair value through profit or loss, loans and receivables, held-to-maturity investments and available-for-sale financial assets.
(a) Financial assets at fair value through profit or loss Financial assets are classified as financial assets at fair value through profit or loss if they are held for trading or are designated as such upon initial
recognition. Financial assets held for trading are derivatives (including separated embedded derivatives) or financial assets acquired principally for the purpose of selling in the near term.
Subsequent to initial recognition, financial assets at fair value through profit or loss are measured at fair value. Any gains or losses arising from changes in fair value are recognised in profit or loss. Net gains or net losses on financial assets at fair value through profit or loss do not include exchange differences, interest and dividend income. Exchange differences, interest and dividend income on financial assets at fair value through profit or loss are recognised separately in profit or loss as part of other losses or other income.
Financial assets at fair value through profit or loss could be presented as current or non-current. Financial assets that is held primarily for trading purposes are presented as current whereas financial assets that is not held primarily for trading purposes are presented as current or non-current based on the settlement date.
The Group and the Company have not designated any financial assets as at fair value through profit or loss.
(b) Loans and receivables Financial assets with fixed or determinable payments that are not quoted in an active market are classified as loans and receivables.
Subsequent to initial recognition, loans and receivables are measured at amortised cost using the effective interest method. Gains and losses are recognised in profit or loss when the loans and receivables are derecognised or impaired, and through the amortisation process.
Loans and receivables are classified as current assets, except for those having maturity dates later than 12 months after the reporting date which are classified as non-current.
(c) Held-to-maturity investments Financial assets with fixed or determinable payments and fixed maturity are classified as held-to-maturity when the Group has the positive intention and
ability to hold the investment to maturity.
Subsequent to initial recognition, held-to-maturity investments are measured at amortised cost using the effective interest method. Gains and losses are recognised in profit or loss when the held-to-maturity investments are derecognised or impaired, and through the amortisation process.
Held-to-maturity investments are classified as non-current assets, except for those having maturity within 12 months after the reporting date which are classified as current.
The Group and the Company have not designated any financial assets as held-to-maturity investments.
(d) Available-for-sale financial assets Available-for-sale financial assets are financial assets that are designated as available for sale or are not classified in any of the three preceding
categories.
After initial recognition, available-for-sale financial assets are measured at fair value. Any gains or losses from changes in fair value of the financial assets are recognised in other comprehensive income, except that impairment losses, foreign exchange gains and losses on monetary instruments and interest calculated using the effective interest method are recognised in profit or loss. The cumulative gain or loss previously recognised in other comprehensive income is reclassified from equity to profit or loss as a reclassification adjustment when the financial asset is derecognised. Interest income calculated using the effective interest method is recognised in profit or loss. Dividends on an available-for-sale equity instrument are recognised in profit or loss when the Group’s and the Company’s right to receive payment is established.
83 Sapura Industrial BerhadAnnual Report 2011
2. SIGNIFICANT ACCOUNTING POLICIES (cont’d)
2.12 Financial assets (cont’d)
(d) Available-for-sale financial assets (cont’d) Investments in equity instruments whose fair value cannot be reliably measured are measured at cost less impairment loss.
Available-for-sale financial assets are classified as non-current assets unless they are expected to be realised within 12 months after the reporting date.
The Group and the Company have not designated any financial assets as available-for-sale.
A financial asset is derecognised when the contractual right to receive cash flows from the asset has expired. On derecognition of a financial asset in its entirety, the difference between the carrying amount and the sum of the consideration received and any cumulative gain or loss that had been recognised in other comprehensive income is recognised in profit or loss.
Regular way purchases or sales are purchases or sales of financial assets that require delivery of assets within the period generally established by regulation or convention in the marketplace concerned. All regular way purchases and sales of financial assets are recognised or derecognised on the trade date, the date that the Group and the Company commit to purchase or sell the asset.
2.13 Impairment of financial assets
The Group and the Company assess at each reporting date whether there is any objective evidence that a financial asset is impaired.(a) Trade and other receivables and other financial assets carried at amortised cost To determine whether there is objective evidence that an impairment loss on financial assets has been incurred, the Group and the Company consider
factors such as the probability of insolvency or significant financial difficulties of the debtor and default or significant delay in payments. For certain categories of financial assets, such as trade receivables, receivables that are assessed not to be impaired individually are subsequently assessed for impairment on a collective basis based on similar risk characteristics. Objective evidence of impairment for a portfolio of receivables could include the Group’s and the Company’s past experience of collecting payments, an increase in the number of delayed payments in the portfolio past the average credit period and observable changes in national or local economic conditions that correlate with default on receivables.
If any such evidence exists, the amount of impairment loss is measured as the difference between the asset’s carrying amount and the present value of estimated future cash flows discounted at the financial asset’s original effective interest rate. The impairment loss is recognised in profit or loss.
The carrying amount of the financial asset is reduced by the impairment loss directly for all financial assets with the exception of trade receivables,
where the carrying amount is reduced through the use of an allowance account. When a trade receivable becomes uncollectible, it is written off against the allowance account.
If in a subsequent period, the amount of the impairment loss decreases and the decrease can be related objectively to an event occurring after the
impairment was recognised, the previously recognised impairment loss is reversed to the extent that the carrying amount of the asset does not exceed its amortised cost at the reversal date. The amount of reversal is recognised in profit or loss.
2.14 Cash and cash equivalents
Cash and cash equivalents comprise cash at bank and on hand, demand deposits, and short-term, highly liquid investments that are readily convertible to known amount of cash and which are subject to an insignificant risk of changes in value. These also include bank overdrafts that form an integral part of the Group’s cash management.
84 Sapura Industrial BerhadAnnual Report 2011 NOTES TO THE FINANCIAL STATEMENTS
31 JANuARY 2011
2. SIGNIFICANT ACCOUNTING POLICIES (cont’d)
2.15 Inventories
Inventories are stated at the lower of cost and net realisable value. Costs incurred in bringing the inventories to their present location and condition are accounted for as follows:
– Raw materials, spares and tools and consumables: purchase costs on a weighted average basis. – Finished goods and work-in-progress: costs of direct materials and labour and a proportion of manufacturing overheads based on normal operating
capacity. These costs are assigned on a weighted average basis.
Net realisable value is the estimated selling price in the ordinary course of business less estimated costs of completion and the estimated costs necessary to make the sale.
2.16 Provisions
Provisions are recognised when the Group has a present obligation (legal or constructive) as a result of a past event, it is probable that an outflow of economic resources will be required to settle the obligation and the amount of the obligation can be estimated reliably.
Provisions are reviewed at each reporting date and adjusted to reflect the current best estimate. If it is no longer probable that an outflow of economic resources will be required to settle the obligation, the provision is reversed. If the effect of the time value of money is material, provisions are discounted using a current pre tax rate that reflects, where appropriate, the risks specific to the liability. When discounting is used, the increase in the provision due to the passage of time is recognised as a finance cost.
2.17 Government grants
Government grants are recognised at their fair value where there is reasonable assurance that the grant will be received and all conditions attached will be met. Where the grant relates to an asset, the fair value is recognised as deferred capital grant in the statement of financial position and is amortised to profit or loss over the expected useful life of the relevant asset by equal annual installments.
Alternatively, government grants related to an asset may be presented in the statement of financial position by deducting the grants in arriving at the carrying amount of the asset.
2.18 Financial liabilities
Financial liabilities are classified according to the substance of the contractual arrangements entered into and the definitions of a financial liability.
Financial liabilities, within the scope of FRS 139, are recognised in the statement of financial position when, and only when, the Group and the Company become a party to the contractual provisions of the financial instrument. Financial liabilities are classified as either financial liabilities at fair value through profit or loss or other financial liabilities.
(a) Financial liabilities at fair value through profit or loss
Financial liabilities at fair value through profit or loss include financial liabilities held for trading and financial liabilities designated upon initial recognition at fair value through profit or loss.
Financial liabilities held for trading include derivatives entered into by the Group and the Company that do not meet the hedge accounting criteria. Derivative liabilities are initially measured at fair value and subsequently stated at fair value, with any resultant gains or losses recognised in profit or loss. Net gains or losses on derivatives include exchange differences.
The Group and the Company have not designated any financial liabilities as at fair value through profit or loss.
85 Sapura Industrial BerhadAnnual Report 2011
2. SIGNIFICANT ACCOUNTING POLICIES (cont’d)
2.18 Financial liabilities (cont’d)
(b) Other financial liabilities The Group’s and the Company’s other financial liabilities include trade payables, other payables and loans and borrowings.
Trade and other payables are recognised initially at fair value plus directly attributable transaction costs and subsequently measured at amortised cost using the effective interest method.
Loans and borrowings are recognised initially at fair value, net of transaction costs incurred, and subsequently measured at amortised cost using the effective interest method. Borrowings are classified as current liabilities unless the Group has an unconditional right to defer settlement of the liability for at least 12 months after the reporting date.
For other financial liabilities, gains and losses are recognised in profit or loss when the liabilities are derecognised, and through the amortisation process.
A financial liability is derecognised when the obligation under the liability is extinguished. When an existing financial liability is replaced by another from the same lender on substantially different terms, or the terms of an existing liability are substantially modified, such an exchange or modification is treated as a derecognition of the original liability and the recognition of a new liability, and the difference in the respective carrying amounts is recognised in profit or loss.
2.19 Financial guarantee contracts
A financial guarantee contract is a contract that requires the issuer to make specified payments to reimburse the holder for a loss it incurs because a specified debtor fails to make payment when due.
Financial guarantee contracts are recognised initially as a liability at fair value, net of transaction costs. Subsequent to initial recognition, financial guarantee contracts are recognised as income in profit or loss over the period of the guarantee. If the debtor fails to make payment relating to financial guarantee contract when it is due and the Group, as the issuer, is required to reimburse the holder for the associated loss, the liability is measured at the higher of the best estimate of the expenditure required to settle the present obligation at the reporting date and the amount initially recognised less cumulative amortisation.
2.20 Borrowing costs
Borrowing costs are capitalised as part of the cost of a qualifying asset if they are directly attributable to the acquisition, construction or production of that asset. Capitalisation of borrowing costs commences when the activities to prepare the asset for its intended use or sale are in progress and the expenditures and borrowing costs are incurred. Borrowing costs are capitalised until the assets are substantially completed for their intended use or sale.
All other borrowing costs are recognised in profit or loss in the period they are incurred. Borrowing costs consist of interest and other costs that the Group and the Company incurred in connection with the borrowing of funds.
2.21 Employee benefits
(a) Short term benefits Wages, salaries, bonuses and social security contributions are recognised as an expense in the year in which the associated services are rendered by
employees. Short term accumulating compensated absences such as paid annual leave are recognised when services are rendered by employees that increase their entitlement to future compensated absences. Short term non-accumulating compensated absences such as sick leave are recognised when the absences occur.
86 Sapura Industrial BerhadAnnual Report 2011 NOTES TO THE FINANCIAL STATEMENTS
31 JANuARY 2011
2. SIGNIFICANT ACCOUNTING POLICIES (cont’d)
2.21 Employee benefits (cont’d)
(b) Defined contribution plans
The Group participates in the national pension schemes as defined by the laws of the countries in which it has operations. The Malaysian companies in the Group make contributions to the Employees Provident Fund in Malaysia, a defined contribution pension scheme. Contributions to defined contribution pension schemes are recognised as an expense in the period in which the related service is performed.
(c) Defined benefit plan
The Group operates an unfunded, defined benefit Retirement Benefit Scheme (“the Scheme”) for its eligible employees. The Group’s obligation under the Scheme, calculated using the Projected unit Credit Method, is determined based on actuarial computations by independent actuaries, through which the amount of benefit that employees have earned in return for their service in the current and prior years is estimated. That benefit is discounted in order to determine its present value. Actuarial gains and losses are recognised as income or expense over the expected average remaining working lives of the participating employees when the cumulative unrecognised actuarial gains or losses for the Scheme exceed 10% of the higher of the present value of the defined benefit obligation and the fair value of plan assets. Past service costs are recognised immediately to the extent that the benefits are already vested, and otherwise are amortised on a straight-line basis over the average period until the amended benefits become vested.
The amount recognised in the statements of financial position represents the present value of the defined benefit obligations adjusted for unrecognised actuarial gains and losses and unrecognised past service costs, and reduced by the fair value of plan assets. Any asset resulting from this calculation is limited to the net total of any unrecognised actuarial losses and past service costs, and the present value of any economic benefits in the form of refunds or reductions in future contributions to the plan.
(d) Employee share option plans
Employees of the Group receive remuneration in the form of share options as consideration for services rendered. The cost of these equity-settled transactions with employees is measured by reference to the fair value of the options at the date on which the options are granted. This cost is recognised in profit or loss, with a corresponding increase in the employee share option reserve over the vesting period. The cumulative expense recognised at each reporting date until the vesting date reflects the extent to which the number of options that will ultimately vest. The charge or credit to profit or loss for a period represents the movement in cumulative expense recognised at the beginning and end of that period.
No expense is recognised for options that do not ultimately vest, except for options where vesting is conditional upon a market or non-vesting condition, which are treated as vested irrespective of whether or not the market or non-vesting condition is satisfied, provided that all other performance and/or service conditions are satisfied. The employee share option reserve is transferred to retained earnings upon expiry of the share options. When the options are exercised, the employee share option reserve is transferred to share premium.
2.22 Leases
(a) As lessee
Finance leases, which transfer to the Group substantially all the risks and rewards incidental to ownership of the leased item, are capitalised at the inception of the lease at the fair value of the leased asset or, if lower, at the present value of the minimum lease payments. Any initial direct costs are also added to the amount capitalised. Lease payments are apportioned between the finance charges and reduction of the lease liability so as to achieve a constant rate of interest on the remaining balance of the liability. Finance charges are charged to profit or loss. Contingent rents, if any, are charged as expenses in the periods in which they are incurred.
Leased assets are depreciated over the estimated useful life of the asset. However, if there is no reasonable certainty that the Group will obtain ownership by the end of the lease term, the asset is depreciated over the shorter of the estimated useful life and the lease term.
Operating lease payments are recognised as an expense in profit or loss on a straight-line basis over the lease term. The aggregate benefit of incentives provided by the lessor is recognised as a reduction of rental expense over the lease term on a straight-line basis.
(b) As lessor
Leases where the Group retains substantially all the risks and rewards of ownership of the asset are classified as operating leases. Initial direct costs incurred in negotiating an operating lease are added to the carrying amount of the leased asset and recognised over the lease term on the same bases as rental income. The accounting policy for rental income is set out in Note 2.23 (e).
87 Sapura Industrial BerhadAnnual Report 2011
2. SIGNIFICANT ACCOUNTING POLICIES (cont’d)
2.23 Revenue
Revenue is recognised to the extent that it is probable that the economic benefits will flow to the Group and the revenue can be reliably measured. Revenue is measured at the fair value of consideration received or receivable.
(a) Sale of goods
Revenue from sale of goods is recognised upon the transfer of significant risk and rewards of ownership of the goods to the customer. Revenue is not recognised to the extent where there are significant uncertainties regarding recovery of the consideration due, associated costs or the possible return of goods.
(b) Interest income
Interest income is recognised using the effective interest method.
(c) Management fees
Management fees are recognised when services are rendered.
(d) Dividend income
Dividend income is recognised when the Group’s right to receive payment is established.
(e) Rental income
Rental income is accounted for on a straight-line basis over the lease terms. The aggregate costs of incentives provided to lessees are recognised as a reduction of rental income over the lease term on a straight-line basis.
2.24 Income taxes
(a) Current tax
Current tax assets and liabilities are measured at the amount expected to be recovered from or paid to the taxation authorities. The tax rates and tax laws used to compute the amount are those that are enacted or substantively enacted by the reporting date.
Current taxes are recognised in profit or loss except to the extent that the tax relates to items recognised outside profit or loss, either in other comprehensive
income or directly in equity.
(b) Deferred tax
Deferred tax is provided using the liability method on temporary differences at the reporting date between the tax bases of assets and liabilities and their carrying amounts for financial reporting purposes.
Deferred tax liabilities are recognised for all temporary differences, except:
– where the deferred tax liability arises from the initial recognition of goodwill or of an asset or liability in a transaction that is not a business combination and, at the time of the transaction, affects neither the accounting profit nor taxable profit or loss; and
– in respect of taxable temporary differences associated with investments in subsidiaries, associates and interests in joint ventures, where the timing of the reversal of the temporary differences can be controlled and it is probable that the temporary differences will not reverse in the foreseeable future.
Deferred tax assets are recognised for all deductible temporary differences, carry forward of unused tax credits and unused tax losses, to the extent that it is probable that taxable profit will be available against which the deductible temporary differences, and the carry forward of unused tax credits and unused tax losses can be utilised except:
– where the deferred tax asset relating to the deductible temporary difference arises from the initial recognition of an asset or liability in a transaction that is not a business combination and, at the time of the transaction, affects neither the accounting profit nor taxable profit or loss; and
88 Sapura Industrial BerhadAnnual Report 2011 NOTES TO THE FINANCIAL STATEMENTS
31 JANuARY 2011
2. SIGNIFICANT ACCOUNTING POLICIES (cont’d)
2.24 Income taxes (cont’d)
(b) Deferred tax (cont’d)
– in respect of deductible temporary differences associated with investments in subsidiaries, associates and interests in joint ventures, deferred tax assets are recognised only to the extent that it is probable that the temporary differences will reverse in the foreseeable future and taxable profit will be available against which the temporary differences can be utilised.
The carrying amount of deferred tax assets is reviewed at each reporting date and reduced to the extent that it is no longer probable that sufficient taxable profit will be available to allow all or part of the deferred tax asset to be utilised. unrecognised deferred tax assets are reassessed at each reporting date and are recognised to the extent that it has become probable that future taxable profit will allow the deferred tax assets to be utilised.
Deferred tax assets and liabilities are measured at the tax rates that are expected to apply to the year when the asset is realised or the liability is settled, based on tax rates and tax laws that have been enacted or substantively enacted at the reporting date.
Deferred tax relating to items recognised outside profit or loss is recognised outside profit or loss. Deferred tax items are recognised in correlation to the underlying transaction either in other comprehensive income or directly in equity and deferred tax arising from a business combination is adjusted against goodwill on acquisition.
Deferred tax assets and deferred tax liabilities are offset, if a legally enforceable right exists to set off current tax assets against current tax liabilities and the deferred taxes relate to the same taxable entity and the same taxation authority.
2.25 Segment reporting
For management purposes, the Group is organised into operating segments based on their products and services which are independently managed by the respective segment managers responsible for the performance of the respective segments under their charge. The segment managers report directly to the management of the Company who regularly review the segment results in order to allocate resources to the segments and to assess the segment performance. Additional disclosures on each of these segments are shown in Note 33, including the factors used to identify the reportable segments and the measurement basis of segment information.
2.26 Share capital and share issuance expenses
An equity instrument is any contract that evidences a residual interest in the assets of the Group and of the Company after deducting all of its liabilities. Ordinary shares are equity instruments.
Ordinary shares are recorded at the proceeds received, net of directly attributable incremental transaction costs. Ordinary shares are classified as equity. Dividends on ordinary shares are recognised in equity in the period in which they are declared.
2.27 Contingencies
A contingent liability or asset is a possible obligation or asset that arises from past events and whose existence will be confirmed only by the occurrence or non-occurrence of uncertain future event(s) not wholly within the control of the Group.
Contingent liabilities and assets are not recognised in the statement of financial position of the Group.
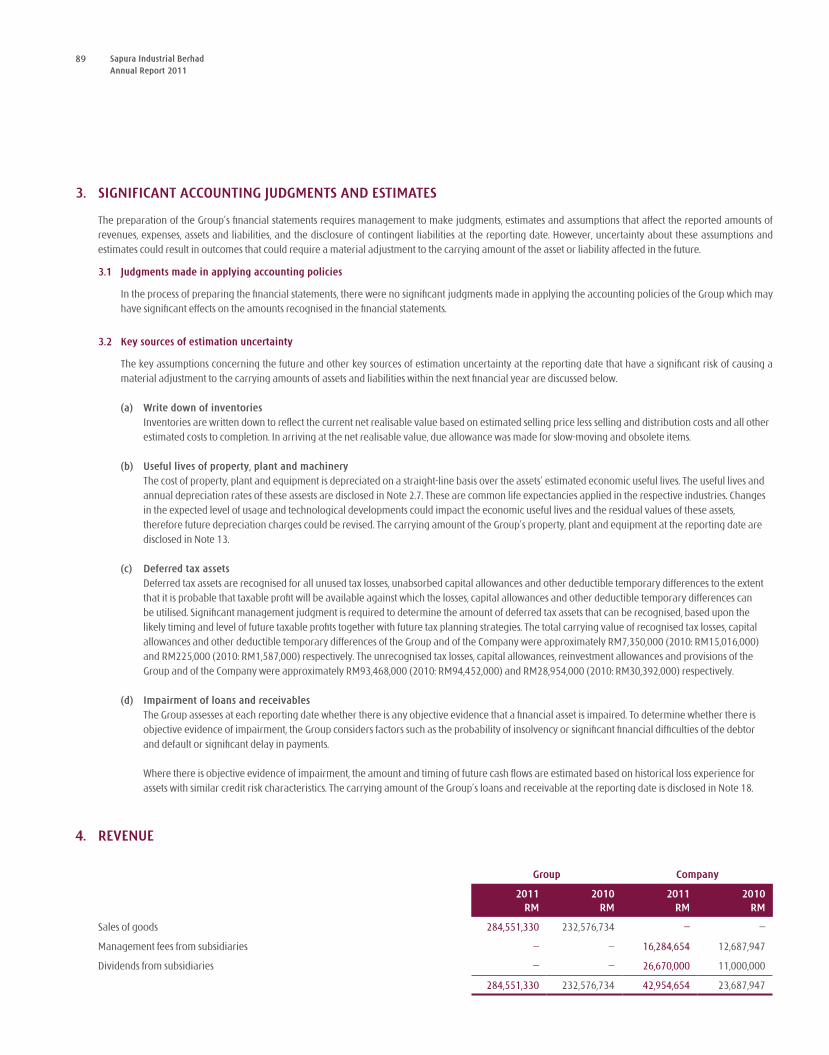
89 Sapura Industrial BerhadAnnual Report 2011
3. SIGNIFICANT ACCOUNTING JUDGMENTS AND ESTIMATES
The preparation of the Group’s financial statements requires management to make judgments, estimates and assumptions that affect the reported amounts of revenues, expenses, assets and liabilities, and the disclosure of contingent liabilities at the reporting date. However, uncertainty about these assumptions and estimates could result in outcomes that could require a material adjustment to the carrying amount of the asset or liability affected in the future.
3.1 Judgments made in applying accounting policies
In the process of preparing the financial statements, there were no significant judgments made in applying the accounting policies of the Group which may have significant effects on the amounts recognised in the financial statements.
3.2 Key sources of estimation uncertainty
The key assumptions concerning the future and other key sources of estimation uncertainty at the reporting date that have a significant risk of causing a material adjustment to the carrying amounts of assets and liabilities within the next financial year are discussed below.
(a) Write down of inventories Inventories are written down to reflect the current net realisable value based on estimated selling price less selling and distribution costs and all other
estimated costs to completion. In arriving at the net realisable value, due allowance was made for slow-moving and obsolete items.
(b) Useful lives of property, plant and machinery The cost of property, plant and equipment is depreciated on a straight-line basis over the assets’ estimated economic useful lives. The useful lives and
annual depreciation rates of these assests are disclosed in Note 2.7. These are common life expectancies applied in the respective industries. Changes in the expected level of usage and technological developments could impact the economic useful lives and the residual values of these assets, therefore future depreciation charges could be revised. The carrying amount of the Group’s property, plant and equipment at the reporting date are disclosed in Note 13.
(c) Deferred tax assets Deferred tax assets are recognised for all unused tax losses, unabsorbed capital allowances and other deductible temporary differences to the extent
that it is probable that taxable profit will be available against which the losses, capital allowances and other deductible temporary differences can be utilised. Significant management judgment is required to determine the amount of deferred tax assets that can be recognised, based upon the likely timing and level of future taxable profits together with future tax planning strategies. The total carrying value of recognised tax losses, capital allowances and other deductible temporary differences of the Group and of the Company were approximately RM7,350,000 (2010: RM15,016,000) and RM225,000 (2010: RM1,587,000) respectively. The unrecognised tax losses, capital allowances, reinvestment allowances and provisions of the Group and of the Company were approximately RM93,468,000 (2010: RM94,452,000) and RM28,954,000 (2010: RM30,392,000) respectively.
(d) Impairment of loans and receivables The Group assesses at each reporting date whether there is any objective evidence that a financial asset is impaired. To determine whether there is
objective evidence of impairment, the Group considers factors such as the probability of insolvency or significant financial difficulties of the debtor and default or significant delay in payments.
Where there is objective evidence of impairment, the amount and timing of future cash flows are estimated based on historical loss experience for assets with similar credit risk characteristics. The carrying amount of the Group’s loans and receivable at the reporting date is disclosed in Note 18.
4. REVENUE
Group Company
2011 2010 2011 2010RM RM RM RM
Sales of goods 284,551,330 232,576,734 – –
Management fees from subsidiaries – – 16,284,654 12,687,947
Dividends from subsidiaries – – 26,670,000 11,000,000
284,551,330 232,576,734 42,954,654 23,687,947
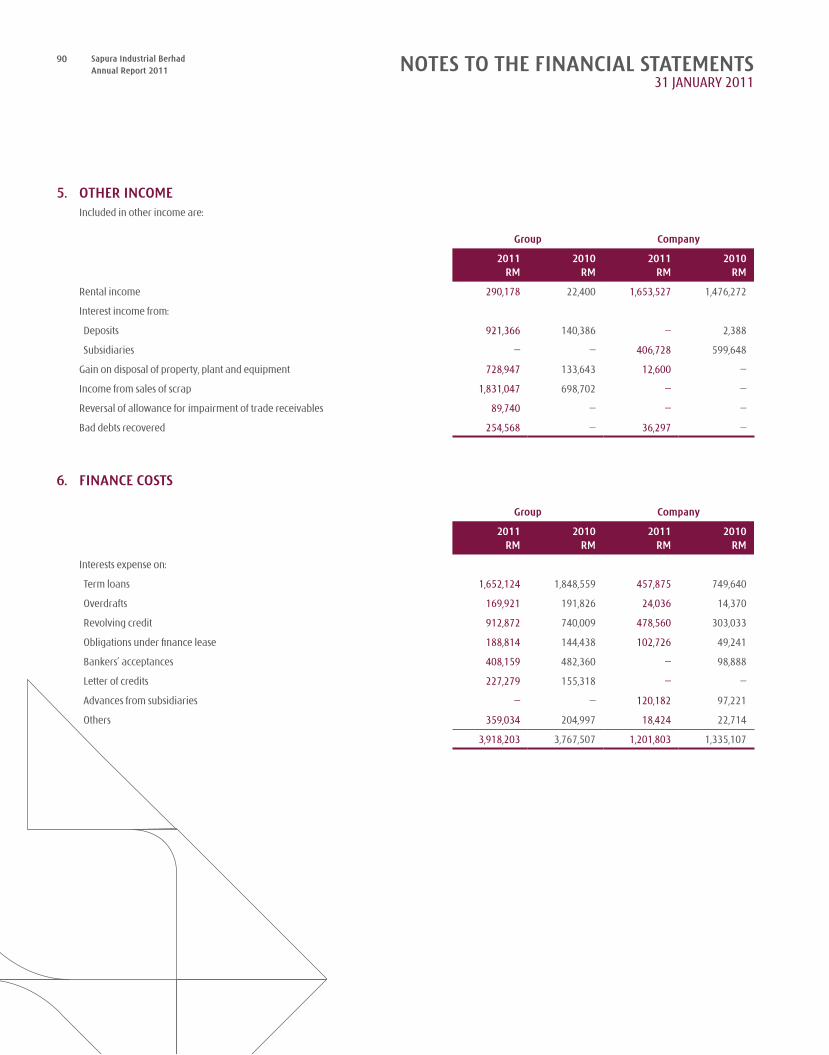
90 Sapura Industrial BerhadAnnual Report 2011 NOTES TO THE FINANCIAL STATEMENTS
31 JANuARY 2011
5. OTHER INCOME Included in other income are:
Group Company
2011 2010 2011 2010RM RM RM RM
Rental income 290,178 22,400 1,653,527 1,476,272
Interest income from:
Deposits 921,366 140,386 – 2,388
Subsidiaries – – 406,728 599,648
Gain on disposal of property, plant and equipment 728,947 133,643 12,600 –
Income from sales of scrap 1,831,047 698,702 – –
Reversal of allowance for impairment of trade receivables 89,740 – – –
Bad debts recovered 254,568 – 36,297 –
6. FINANCE COSTS
Group Company
2011 2010 2011 2010RM RM RM RM
Interests expense on:
Term loans 1,652,124 1,848,559 457,875 749,640
Overdrafts 169,921 191,826 24,036 14,370
Revolving credit 912,872 740,009 478,560 303,033
Obligations under finance lease 188,814 144,438 102,726 49,241
Bankers’ acceptances 408,159 482,360 – 98,888
Letter of credits 227,279 155,318 – –
Advances from subsidiaries – – 120,182 97,221
Others 359,034 204,997 18,424 22,714
3,918,203 3,767,507 1,201,803 1,335,107
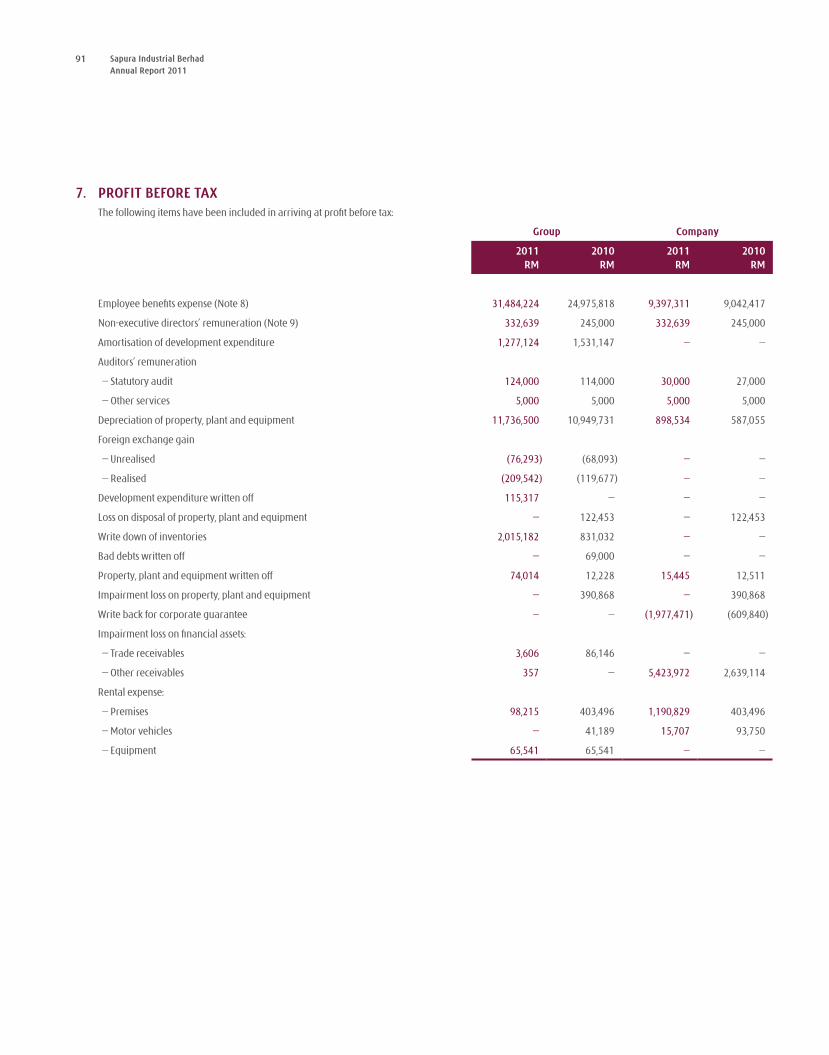
91 Sapura Industrial BerhadAnnual Report 2011
7. PROFIT BEFORE TAXThe following items have been included in arriving at profit before tax:
Group Company
2011 2010 2011 2010RM RM RM RM
Employee benefits expense (Note 8) 31,484,224 24,975,818 9,397,311 9,042,417
Non-executive directors’ remuneration (Note 9) 332,639 245,000 332,639 245,000
Amortisation of development expenditure 1,277,124 1,531,147 – –
Auditors’ remuneration
– Statutory audit 124,000 114,000 30,000 27,000
– Other services 5,000 5,000 5,000 5,000
Depreciation of property, plant and equipment 11,736,500 10,949,731 898,534 587,055
Foreign exchange gain
– unrealised (76,293) (68,093) – –
– Realised (209,542) (119,677) – –
Development expenditure written off 115,317 – – –
Loss on disposal of property, plant and equipment – 122,453 – 122,453
Write down of inventories 2,015,182 831,032 – –
Bad debts written off – 69,000 – –
Property, plant and equipment written off 74,014 12,228 15,445 12,511
Impairment loss on property, plant and equipment – 390,868 – 390,868
Write back for corporate guarantee – – (1,977,471) (609,840)
Impairment loss on financial assets:
– Trade receivables 3,606 86,146 – –
– Other receivables 357 – 5,423,972 2,639,114
Rental expense:
– Premises 98,215 403,496 1,190,829 403,496
– Motor vehicles – 41,189 15,707 93,750
– Equipment 65,541 65,541 – –
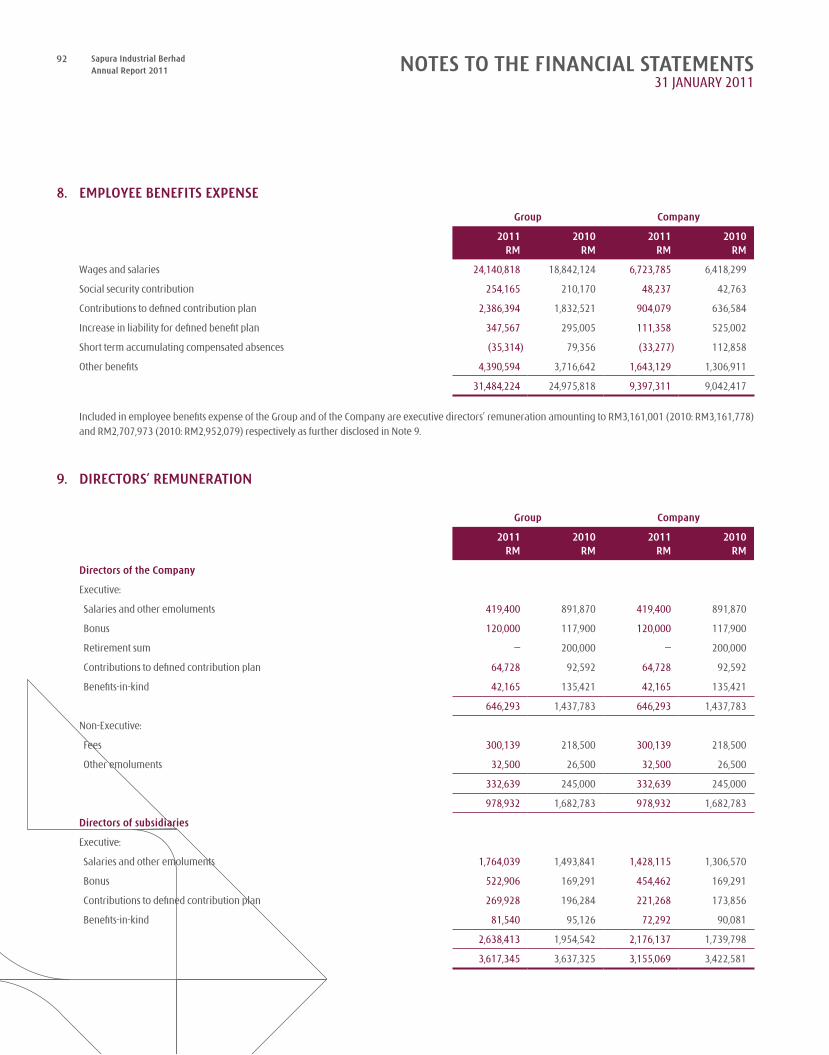
92 Sapura Industrial BerhadAnnual Report 2011 NOTES TO THE FINANCIAL STATEMENTS
31 JANuARY 2011
8. EMPLOYEE BENEFITS EXPENSE
Group Company
2011 2010 2011 2010RM RM RM RM
Wages and salaries 24,140,818 18,842,124 6,723,785 6,418,299
Social security contribution 254,165 210,170 48,237 42,763
Contributions to defined contribution plan 2,386,394 1,832,521 904,079 636,584
Increase in liability for defined benefit plan 347,567 295,005 111,358 525,002
Short term accumulating compensated absences (35,314) 79,356 (33,277) 112,858
Other benefits 4,390,594 3,716,642 1,643,129 1,306,911
31,484,224 24,975,818 9,397,311 9,042,417
Included in employee benefits expense of the Group and of the Company are executive directors’ remuneration amounting to RM3,161,001 (2010: RM3,161,778) and RM2,707,973 (2010: RM2,952,079) respectively as further disclosed in Note 9.
9. DIRECTORS’ REMUNERATION
Group Company
2011 2010 2011 2010RM RM RM RM
Directors of the Company
Executive:
Salaries and other emoluments 419,400 891,870 419,400 891,870
Bonus 120,000 117,900 120,000 117,900
Retirement sum – 200,000 – 200,000
Contributions to defined contribution plan 64,728 92,592 64,728 92,592
Benefits-in-kind 42,165 135,421 42,165 135,421
646,293 1,437,783 646,293 1,437,783
Non-Executive:
Fees 300,139 218,500 300,139 218,500
Other emoluments 32,500 26,500 32,500 26,500
332,639 245,000 332,639 245,000
978,932 1,682,783 978,932 1,682,783
Directors of subsidiaries
Executive:
Salaries and other emoluments 1,764,039 1,493,841 1,428,115 1,306,570
Bonus 522,906 169,291 454,462 169,291
Contributions to defined contribution plan 269,928 196,284 221,268 173,856
Benefits-in-kind 81,540 95,126 72,292 90,081
2,638,413 1,954,542 2,176,137 1,739,798
3,617,345 3,637,325 3,155,069 3,422,581
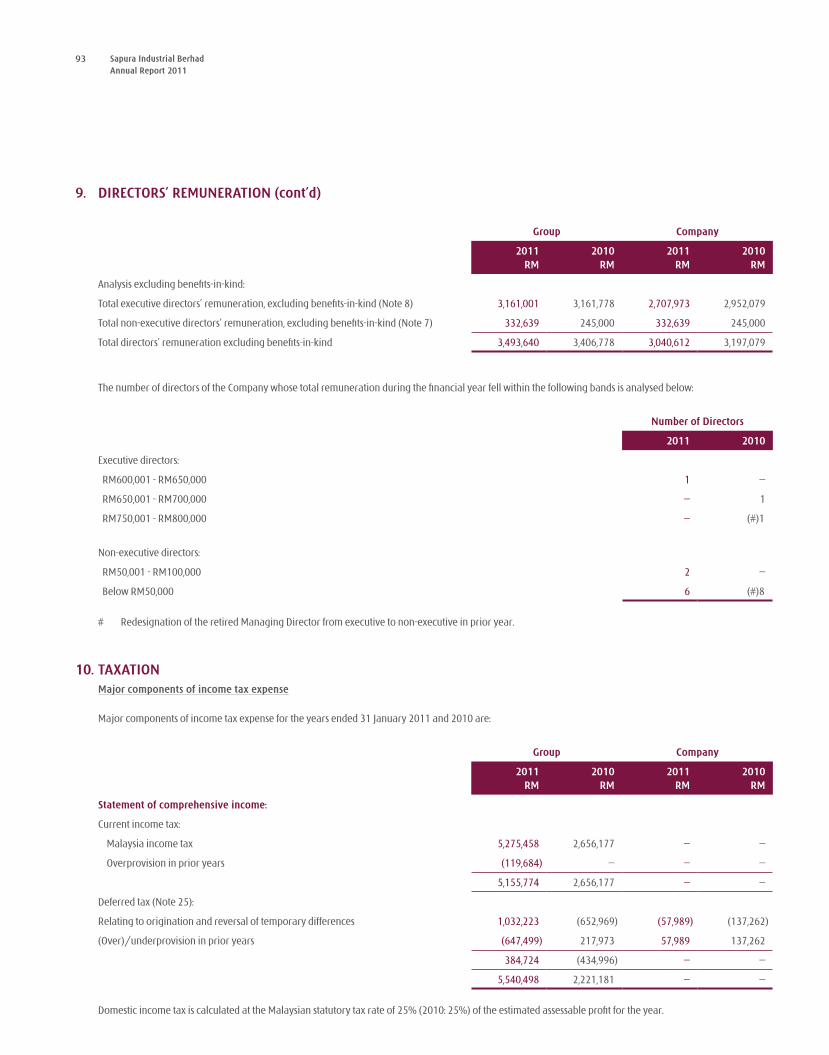
93 Sapura Industrial BerhadAnnual Report 2011
9. DIRECTORS’ REMUNERATION (cont’d)
Group Company
2011 2010 2011 2010RM RM RM RM
Analysis excluding benefits-in-kind:
Total executive directors’ remuneration, excluding benefits-in-kind (Note 8) 3,161,001 3,161,778 2,707,973 2,952,079
Total non-executive directors’ remuneration, excluding benefits-in-kind (Note 7) 332,639 245,000 332,639 245,000
Total directors’ remuneration excluding benefits-in-kind 3,493,640 3,406,778 3,040,612 3,197,079
The number of directors of the Company whose total remuneration during the financial year fell within the following bands is analysed below:
Number of Directors
2011 2010
Executive directors:
RM600,001 - RM650,000 1 –
RM650,001 - RM700,000 – 1
RM750,001 - RM800,000 – (#)1
Non-executive directors:
RM50,001 - RM100,000 2 –
Below RM50,000 6 (#)8
# Redesignation of the retired Managing Director from executive to non-executive in prior year.
10. TAXATION Major components of income tax expense
Major components of income tax expense for the years ended 31 January 2011 and 2010 are:
Group Company
2011 2010 2011 2010RM RM RM RM
Statement of comprehensive income:
Current income tax:
Malaysia income tax 5,275,458 2,656,177 – –
Overprovision in prior years (119,684) – – –
5,155,774 2,656,177 – –
Deferred tax (Note 25):
Relating to origination and reversal of temporary differences 1,032,223 (652,969) (57,989) (137,262)
(Over)/underprovision in prior years (647,499) 217,973 57,989 137,262
384,724 (434,996) – –
5,540,498 2,221,181 – –
Domestic income tax is calculated at the Malaysian statutory tax rate of 25% (2010: 25%) of the estimated assessable profit for the year.
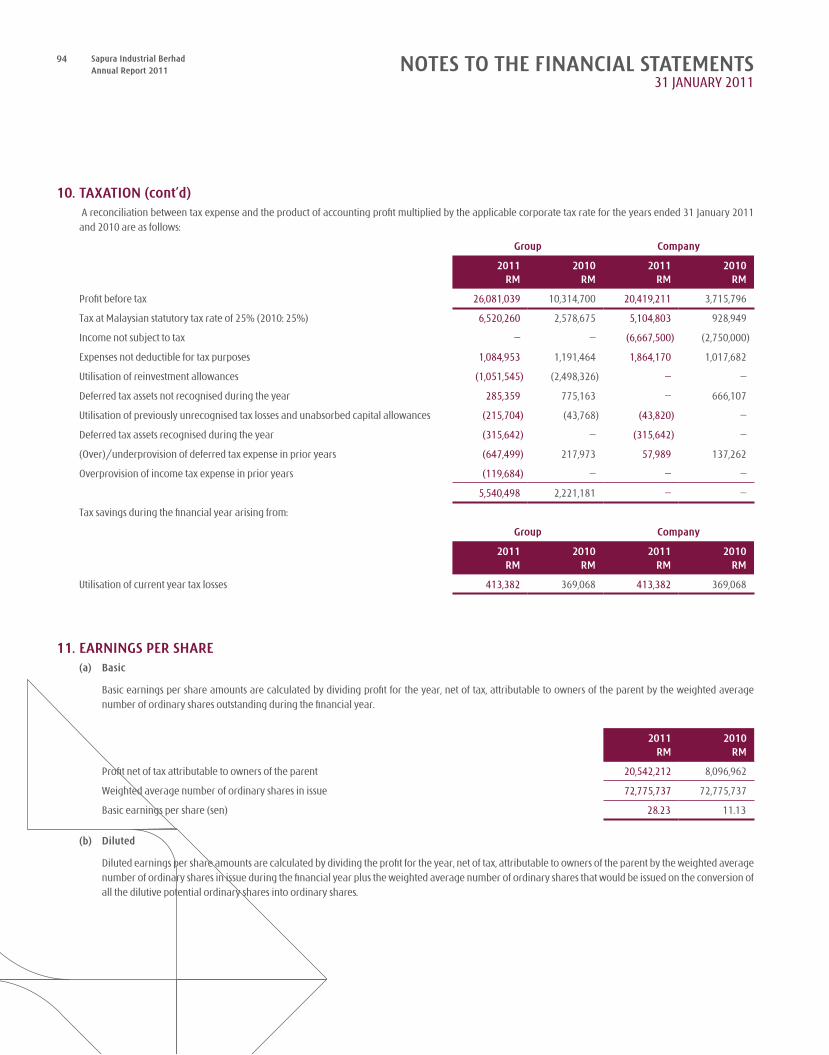
94 Sapura Industrial BerhadAnnual Report 2011 NOTES TO THE FINANCIAL STATEMENTS
31 JANuARY 2011
10. TAXATION (cont’d) A reconciliation between tax expense and the product of accounting profit multiplied by the applicable corporate tax rate for the years ended 31 January 2011
and 2010 are as follows:
Group Company
2011 2010 2011 2010RM RM RM RM
Profit before tax 26,081,039 10,314,700 20,419,211 3,715,796
Tax at Malaysian statutory tax rate of 25% (2010: 25%) 6,520,260 2,578,675 5,104,803 928,949
Income not subject to tax – – (6,667,500) (2,750,000)
Expenses not deductible for tax purposes 1,084,953 1,191,464 1,864,170 1,017,682
utilisation of reinvestment allowances (1,051,545) (2,498,326) – –
Deferred tax assets not recognised during the year 285,359 775,163 – 666,107
utilisation of previously unrecognised tax losses and unabsorbed capital allowances (215,704) (43,768) (43,820) –
Deferred tax assets recognised during the year (315,642) – (315,642) –
(Over)/underprovision of deferred tax expense in prior years (647,499) 217,973 57,989 137,262
Overprovision of income tax expense in prior years (119,684) – – –
5,540,498 2,221,181 – –
Tax savings during the financial year arising from:
Group Company
2011 2010 2011 2010RM RM RM RM
utilisation of current year tax losses 413,382 369,068 413,382 369,068
11. EARNINGS PER SHARE (a) Basic
Basic earnings per share amounts are calculated by dividing profit for the year, net of tax, attributable to owners of the parent by the weighted average number of ordinary shares outstanding during the financial year.
2011 2010RM RM
Profit net of tax attributable to owners of the parent 20,542,212 8,096,962
Weighted average number of ordinary shares in issue 72,775,737 72,775,737
Basic earnings per share (sen) 28.23 11.13
(b) Diluted
Diluted earnings per share amounts are calculated by dividing the profit for the year, net of tax, attributable to owners of the parent by the weighted average number of ordinary shares in issue during the financial year plus the weighted average number of ordinary shares that would be issued on the conversion of all the dilutive potential ordinary shares into ordinary shares.
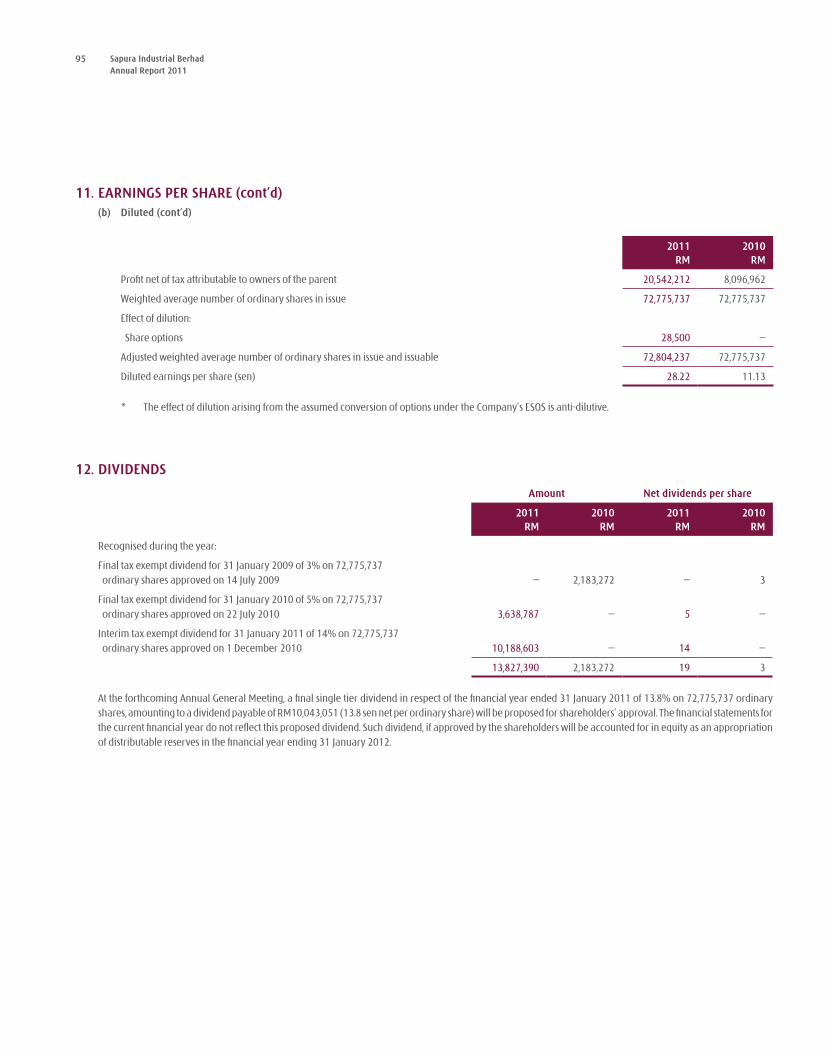
95 Sapura Industrial BerhadAnnual Report 2011
11. EARNINGS PER SHARE (cont’d)(b) Diluted (cont’d)
2011 2010RM RM
Profit net of tax attributable to owners of the parent 20,542,212 8,096,962
Weighted average number of ordinary shares in issue 72,775,737 72,775,737
Effect of dilution:
Share options 28,500 –
Adjusted weighted average number of ordinary shares in issue and issuable 72,804,237 72,775,737
Diluted earnings per share (sen) 28.22 11.13
* The effect of dilution arising from the assumed conversion of options under the Company’s ESOS is anti-dilutive.
12. DIVIDENDS
Amount Net dividends per share
2011 2010 2011 2010RM RM RM RM
Recognised during the year:
Final tax exempt dividend for 31 January 2009 of 3% on 72,775,737 ordinary shares approved on 14 July 2009 – 2,183,272 – 3
Final tax exempt dividend for 31 January 2010 of 5% on 72,775,737 ordinary shares approved on 22 July 2010 3,638,787 – 5 –
Interim tax exempt dividend for 31 January 2011 of 14% on 72,775,737 ordinary shares approved on 1 December 2010 10,188,603 – 14 –
13,827,390 2,183,272 19 3
At the forthcoming Annual General Meeting, a final single tier dividend in respect of the financial year ended 31 January 2011 of 13.8% on 72,775,737 ordinary
shares, amounting to a dividend payable of RM10,043,051 (13.8 sen net per ordinary share) will be proposed for shareholders’ approval. The financial statements for the current financial year do not reflect this proposed dividend. Such dividend, if approved by the shareholders will be accounted for in equity as an appropriation of distributable reserves in the financial year ending 31 January 2012.
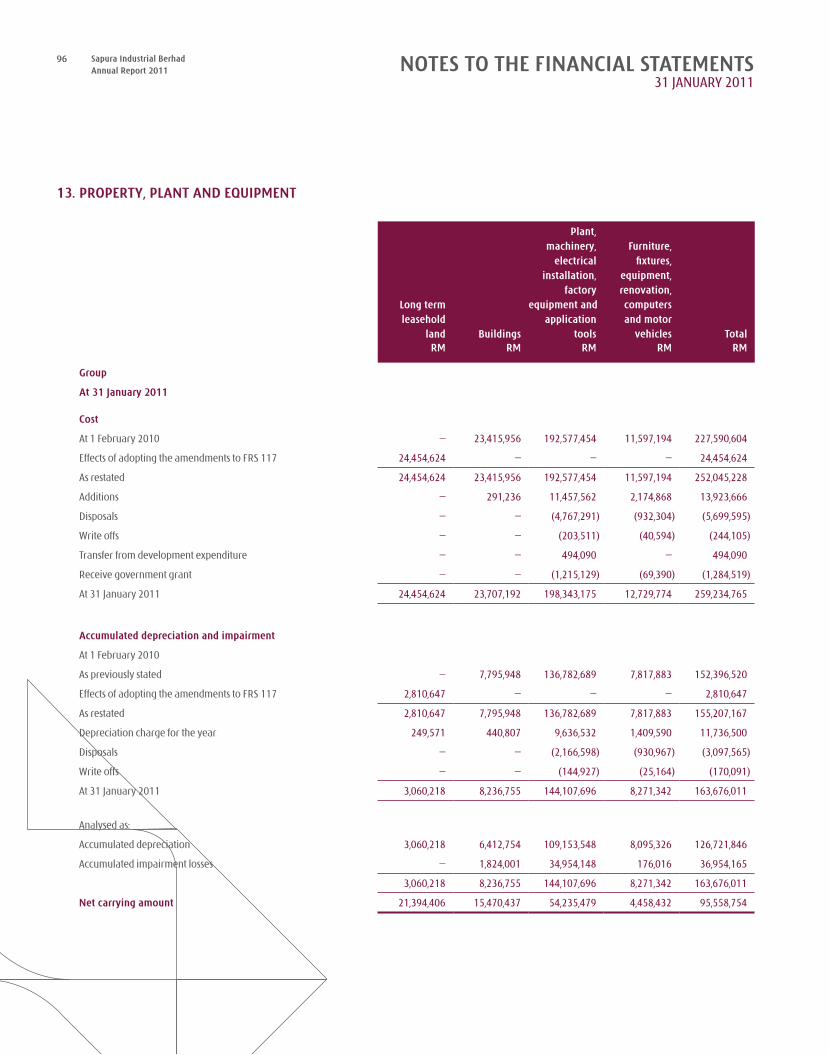
96 Sapura Industrial BerhadAnnual Report 2011 NOTES TO THE FINANCIAL STATEMENTS
31 JANuARY 2011
13. PROPERTY, PLANT AND EqUIPMENT
Long term leasehold
land Buildings
Plant,machinery,
electricalinstallation,
factoryequipment and
applicationtools
Furniture,fixtures,
equipment,renovation,computersand motor
vehicles TotalRM RM RM RM RM
Group
At 31 January 2011
Cost
At 1 February 2010 – 23,415,956 192,577,454 11,597,194 227,590,604
Effects of adopting the amendments to FRS 117 24,454,624 – – – 24,454,624
As restated 24,454,624 23,415,956 192,577,454 11,597,194 252,045,228
Additions – 291,236 11,457,562 2,174,868 13,923,666
Disposals – – (4,767,291) (932,304) (5,699,595)
Write offs – – (203,511) (40,594) (244,105)
Transfer from development expenditure – – 494,090 – 494,090
Receive government grant – – (1,215,129) (69,390) (1,284,519)
At 31 January 2011 24,454,624 23,707,192 198,343,175 12,729,774 259,234,765
Accumulated depreciation and impairment
At 1 February 2010
As previously stated – 7,795,948 136,782,689 7,817,883 152,396,520
Effects of adopting the amendments to FRS 117 2,810,647 – – – 2,810,647
As restated 2,810,647 7,795,948 136,782,689 7,817,883 155,207,167
Depreciation charge for the year 249,571 440,807 9,636,532 1,409,590 11,736,500
Disposals – – (2,166,598) (930,967) (3,097,565)
Write offs – – (144,927) (25,164) (170,091)
At 31 January 2011 3,060,218 8,236,755 144,107,696 8,271,342 163,676,011
Analysed as:
Accumulated depreciation 3,060,218 6,412,754 109,153,548 8,095,326 126,721,846
Accumulated impairment losses – 1,824,001 34,954,148 176,016 36,954,165
3,060,218 8,236,755 144,107,696 8,271,342 163,676,011
Net carrying amount 21,394,406 15,470,437 54,235,479 4,458,432 95,558,754
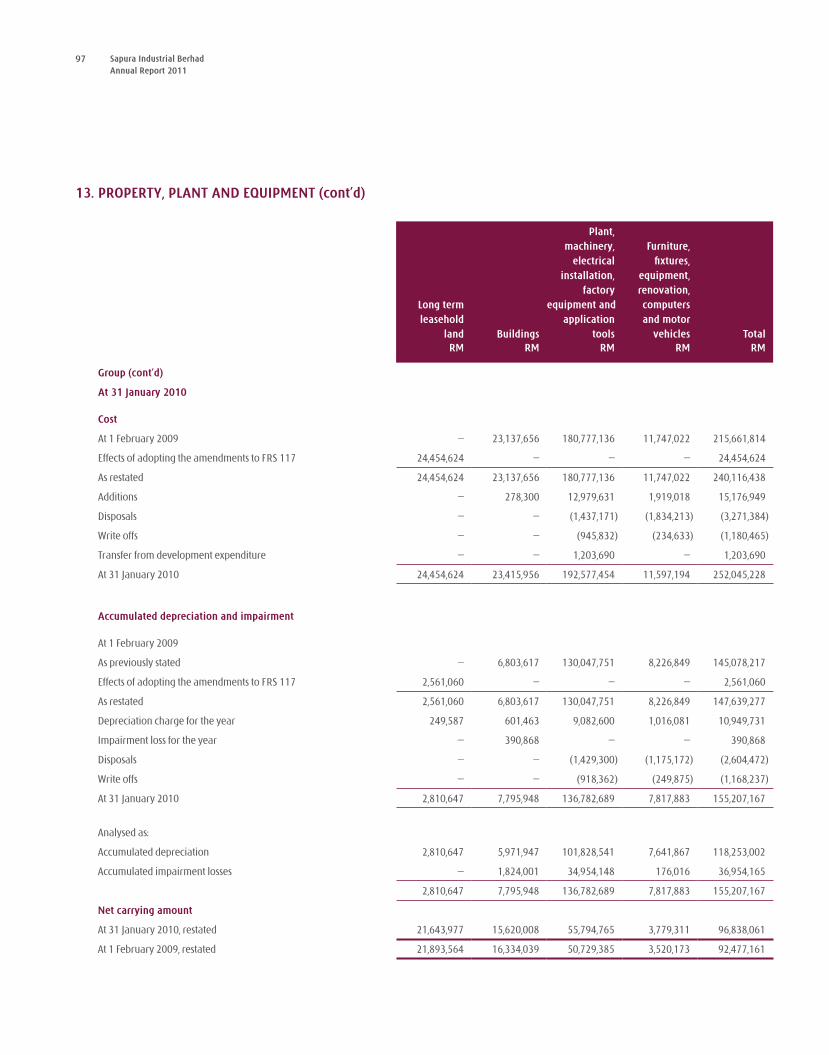
97 Sapura Industrial BerhadAnnual Report 2011
13. PROPERTY, PLANT AND EqUIPMENT (cont’d)
Long term leasehold
land Buildings
Plant,machinery,
electricalinstallation,
factoryequipment and
applicationtools
Furniture,fixtures,
equipment,renovation,computersand motor
vehicles TotalRM RM RM RM RM
Group (cont’d)
At 31 January 2010
Cost
At 1 February 2009 – 23,137,656 180,777,136 11,747,022 215,661,814
Effects of adopting the amendments to FRS 117 24,454,624 – – – 24,454,624
As restated 24,454,624 23,137,656 180,777,136 11,747,022 240,116,438
Additions – 278,300 12,979,631 1,919,018 15,176,949
Disposals – – (1,437,171) (1,834,213) (3,271,384)
Write offs – – (945,832) (234,633) (1,180,465)
Transfer from development expenditure – – 1,203,690 – 1,203,690
At 31 January 2010 24,454,624 23,415,956 192,577,454 11,597,194 252,045,228
Accumulated depreciation and impairment
At 1 February 2009
As previously stated – 6,803,617 130,047,751 8,226,849 145,078,217
Effects of adopting the amendments to FRS 117 2,561,060 – – – 2,561,060
As restated 2,561,060 6,803,617 130,047,751 8,226,849 147,639,277
Depreciation charge for the year 249,587 601,463 9,082,600 1,016,081 10,949,731
Impairment loss for the year – 390,868 – – 390,868
Disposals – – (1,429,300) (1,175,172) (2,604,472)
Write offs – – (918,362) (249,875) (1,168,237)
At 31 January 2010 2,810,647 7,795,948 136,782,689 7,817,883 155,207,167
Analysed as:
Accumulated depreciation 2,810,647 5,971,947 101,828,541 7,641,867 118,253,002
Accumulated impairment losses – 1,824,001 34,954,148 176,016 36,954,165
2,810,647 7,795,948 136,782,689 7,817,883 155,207,167
Net carrying amount
At 31 January 2010, restated 21,643,977 15,620,008 55,794,765 3,779,311 96,838,061
At 1 February 2009, restated 21,893,564 16,334,039 50,729,385 3,520,173 92,477,161

98 Sapura Industrial BerhadAnnual Report 2011 NOTES TO THE FINANCIAL STATEMENTS
31 JANuARY 2011
13. PROPERTY, PLANT AND EqUIPMENT (cont’d)
Long term leasehold
land Building
Plant,machinery,
andfactory
equipment
Furniture,fixtures,
equipment,renovation,computersand motor
vehicles TotalRM RM RM RM RM
Company
At 31 January 2011
Cost
At 1 February 2010 – 2,265,637 73,532 3,317,996 5,657,165
Effects of adopting the amendments to FRS 117 16,571,044 – – – 16,571,044
As restated 16,571,044 2,265,637 73,532 3,317,996 22,228,209
Additions – – – 1,490,016 1,490,016
Transfer from subsidiaries – – – 26,514 26,514
Disposals – – – (76,008) (76,008)
Write offs – – – (16,175) (16,175)
At 31 January 2011 16,571,044 2,265,637 73,532 4,742,343 23,652,556
Accumulated depreciation and impairment
At 1 February 2010:
As previously stated – 1,035,482 45,253 1,883,066 2,963,801
Effects of adopting the amendments to FRS 117 1,922,182 – – – 1,922,182
As restated 1,922,182 1,035,482 45,253 1,883,066 4,885,983
Charge for the year 168,934 45,314 10,302 673,984 898,534
Transfer from subsidiaries – – – 6,641 6,641
Disposals – – – (74,785) (74,785)
Write offs – – – (730) (730)
At 31 January 2011 2,091,116 1,080,796 55,555 2,488,176 5,715,643
Analysed as:
Accumulated depreciation 2,091,116 689,928 55,555 2,488,176 5,324,775
Accumulated impairment loss – 390,868 – – 390,868
2,091,116 1,080,796 55,555 2,488,176 5,715,643
Net carrying amount 14,479,928 1,184,841 17,977 2,254,167 17,936,913

99 Sapura Industrial BerhadAnnual Report 2011
13. PROPERTY, PLANT AND EqUIPMENT (cont’d)
Long term leasehold
land Building
Plant,machinery,
andfactory
equipment
Furniture,fixtures,
equipment,renovation,computersand motor
vehicles TotalRM RM RM RM RM
Company (cont’d)
At 31 January 2010
Cost
At 1 February 2009 – 2,265,637 73,532 3,236,031 5,575,200
Effects of adopting the amendments to FRS 117 16,571,044 – – – 16,571,044
As restated 16,571,044 2,265,637 73,532 3,236,031 22,146,244
Additions – – – 1,225,586 1,225,586
Transfer from subsidiaries – – – 178,994 178,994
Disposals – – – (1,187,353) (1,187,353)
Write offs – – – (135,262) (135,262)
At 31 January 2010 16,571,044 2,265,637 73,532 3,317,996 22,228,209
Accumulated depreciation
At 1 February 2009 – 599,300 34,951 2,095,426 2,729,677
Effects of adopting the amendments to FRS 117 1,753,248 – – – 1,753,248
As restated 1,753,248 599,300 34,951 2,095,426 4,482,925
Charge for the year 168,934 45,314 10,302 362,505 587,055
Transfer from subsidiaries – – – 126,934 126,934
Impairment loss for the year – 390,868 – – 390,868
Disposals – – – (579,048) (579,048)
Write offs – – – (122,751) (122,751)
At 31 January 2010 1,922,182 1,035,482 45,253 1,883,066 4,885,983
Net carrying amount
At 31 January 2010, restated 14,648,862 1,230,155 28,279 1,434,930 17,342,226
At 1 February 2009, restated 14,817,796 1,666,337 38,581 1,140,605 17,663,319
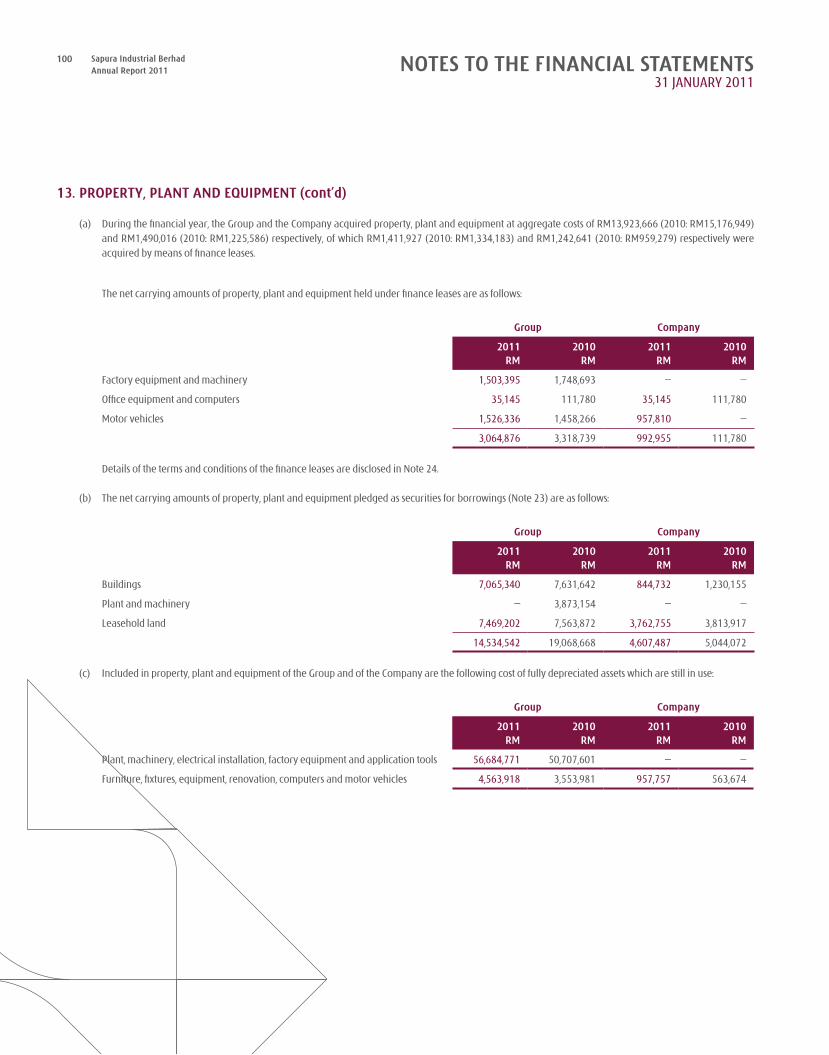
100 Sapura Industrial BerhadAnnual Report 2011 NOTES TO THE FINANCIAL STATEMENTS
31 JANuARY 2011
13. PROPERTY, PLANT AND EqUIPMENT (cont’d)
(a) During the financial year, the Group and the Company acquired property, plant and equipment at aggregate costs of RM13,923,666 (2010: RM15,176,949) and RM1,490,016 (2010: RM1,225,586) respectively, of which RM1,411,927 (2010: RM1,334,183) and RM1,242,641 (2010: RM959,279) respectively were acquired by means of finance leases.
The net carrying amounts of property, plant and equipment held under finance leases are as follows:
Group Company
2011 2010 2011 2010RM RM RM RM
Factory equipment and machinery 1,503,395 1,748,693 – –
Office equipment and computers 35,145 111,780 35,145 111,780
Motor vehicles 1,526,336 1,458,266 957,810 –
3,064,876 3,318,739 992,955 111,780
Details of the terms and conditions of the finance leases are disclosed in Note 24.
(b) The net carrying amounts of property, plant and equipment pledged as securities for borrowings (Note 23) are as follows:
Group Company
2011 2010 2011 2010RM RM RM RM
Buildings 7,065,340 7,631,642 844,732 1,230,155
Plant and machinery – 3,873,154 – –
Leasehold land 7,469,202 7,563,872 3,762,755 3,813,917
14,534,542 19,068,668 4,607,487 5,044,072
(c) Included in property, plant and equipment of the Group and of the Company are the following cost of fully depreciated assets which are still in use:
Group Company
2011 2010 2011 2010RM RM RM RM
Plant, machinery, electrical installation, factory equipment and application tools 56,684,771 50,707,601 – –
Furniture, fixtures, equipment, renovation, computers and motor vehicles 4,563,918 3,553,981 957,757 563,674
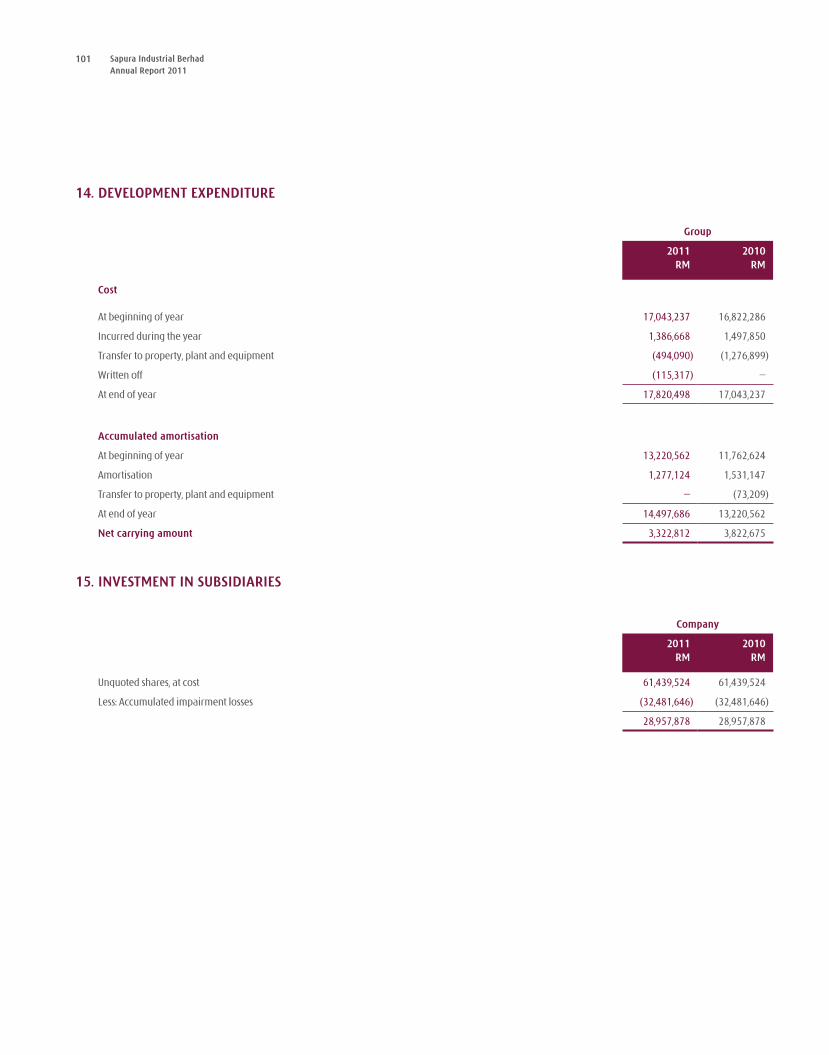
101 Sapura Industrial BerhadAnnual Report 2011
14. DEVELOPMENT EXPENDITURE
Group
2011 2010RM RM
Cost
At beginning of year 17,043,237 16,822,286
Incurred during the year 1,386,668 1,497,850
Transfer to property, plant and equipment (494,090) (1,276,899)
Written off (115,317) –
At end of year 17,820,498 17,043,237
Accumulated amortisation
At beginning of year 13,220,562 11,762,624
Amortisation 1,277,124 1,531,147
Transfer to property, plant and equipment – (73,209)
At end of year 14,497,686 13,220,562
Net carrying amount 3,322,812 3,822,675
15. INVESTMENT IN SUBSIDIARIES
Company
2011 2010RM RM
unquoted shares, at cost 61,439,524 61,439,524
Less: Accumulated impairment losses (32,481,646) (32,481,646)
28,957,878 28,957,878
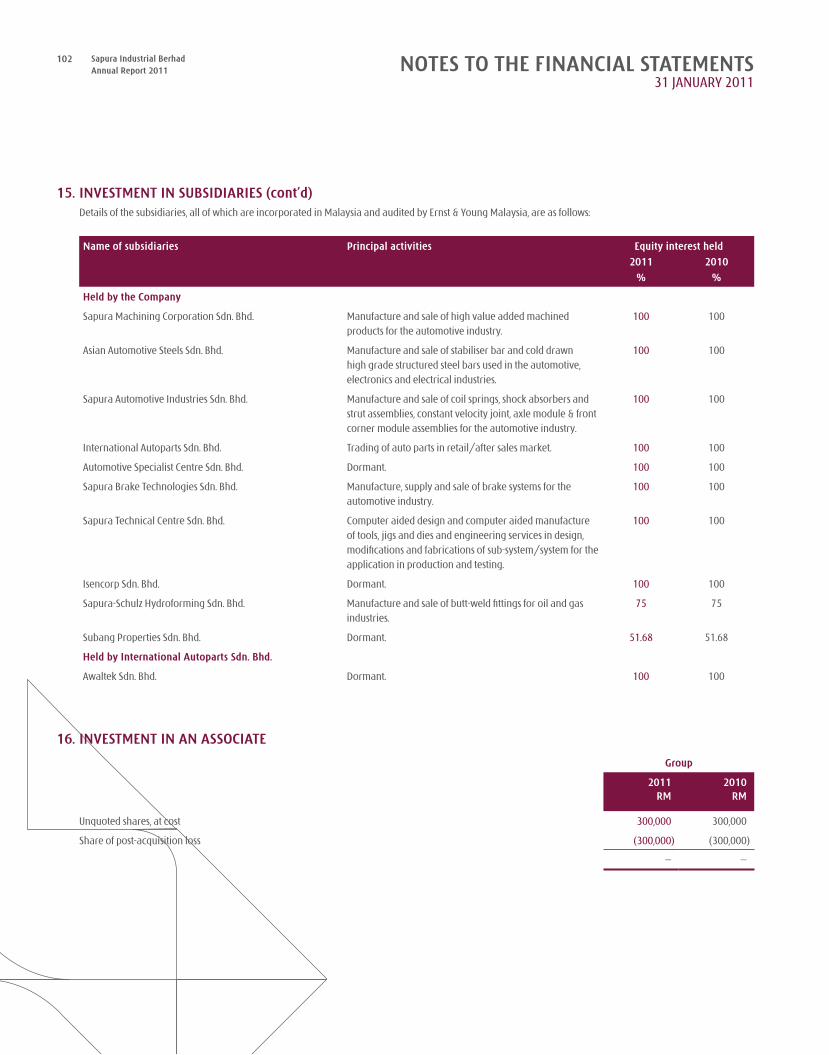
102 Sapura Industrial BerhadAnnual Report 2011 NOTES TO THE FINANCIAL STATEMENTS
31 JANuARY 2011
15. INVESTMENT IN SUBSIDIARIES (cont’d)Details of the subsidiaries, all of which are incorporated in Malaysia and audited by Ernst & Young Malaysia, are as follows:
Name of subsidiaries Principal activities Equity interest held
2011 2010
% %
Held by the Company
Sapura Machining Corporation Sdn. Bhd. Manufacture and sale of high value added machined products for the automotive industry.
100 100
Asian Automotive Steels Sdn. Bhd. Manufacture and sale of stabiliser bar and cold drawn high grade structured steel bars used in the automotive, electronics and electrical industries.
100 100
Sapura Automotive Industries Sdn. Bhd. Manufacture and sale of coil springs, shock absorbers and strut assemblies, constant velocity joint, axle module & front corner module assemblies for the automotive industry.
100 100
International Autoparts Sdn. Bhd. Trading of auto parts in retail/after sales market. 100 100
Automotive Specialist Centre Sdn. Bhd. Dormant. 100 100
Sapura Brake Technologies Sdn. Bhd. Manufacture, supply and sale of brake systems for the automotive industry.
100 100
Sapura Technical Centre Sdn. Bhd. Computer aided design and computer aided manufacture of tools, jigs and dies and engineering services in design, modifications and fabrications of sub-system/system for the application in production and testing.
100 100
Isencorp Sdn. Bhd. Dormant. 100 100
Sapura-Schulz Hydroforming Sdn. Bhd. Manufacture and sale of butt-weld fittings for oil and gas industries.
75 75
Subang Properties Sdn. Bhd. Dormant. 51.68 51.68
Held by International Autoparts Sdn. Bhd.
Awaltek Sdn. Bhd. Dormant. 100 100
16. INVESTMENT IN AN ASSOCIATE
Group
2011 2010RM RM
unquoted shares, at cost 300,000 300,000
Share of post-acquisition loss (300,000) (300,000)
– –
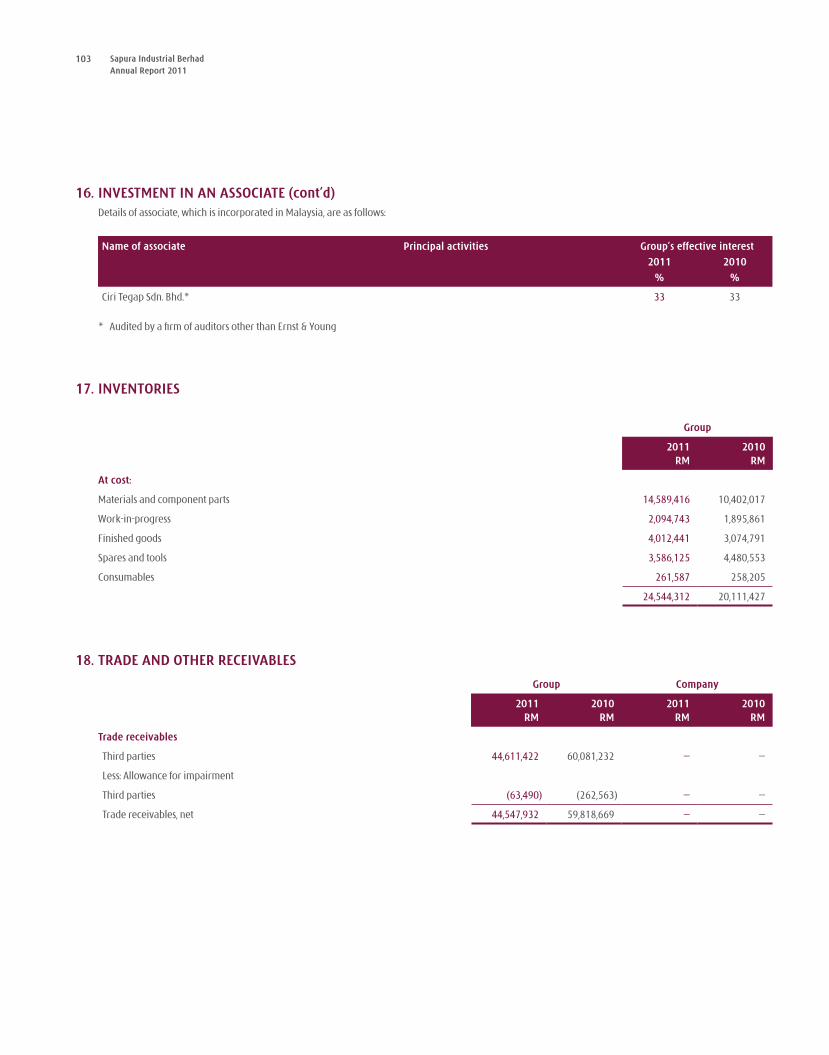
103 Sapura Industrial BerhadAnnual Report 2011
16. INVESTMENT IN AN ASSOCIATE (cont’d)Details of associate, which is incorporated in Malaysia, are as follows:
Name of associate Principal activities Group’s effective interest
2011 2010
% %
Ciri Tegap Sdn. Bhd.* 33 33
* Audited by a firm of auditors other than Ernst & Young
17. INVENTORIES
Group
2011 2010RM RM
At cost:
Materials and component parts 14,589,416 10,402,017
Work-in-progress 2,094,743 1,895,861
Finished goods 4,012,441 3,074,791
Spares and tools 3,586,125 4,480,553
Consumables 261,587 258,205
24,544,312 20,111,427
18. TRADE AND OTHER RECEIVABLES
Group Company
2011 2010 2011 2010RM RM RM RM
Trade receivables
Third parties 44,611,422 60,081,232 – –
Less: Allowance for impairment
Third parties (63,490) (262,563) – –
Trade receivables, net 44,547,932 59,818,669 – –
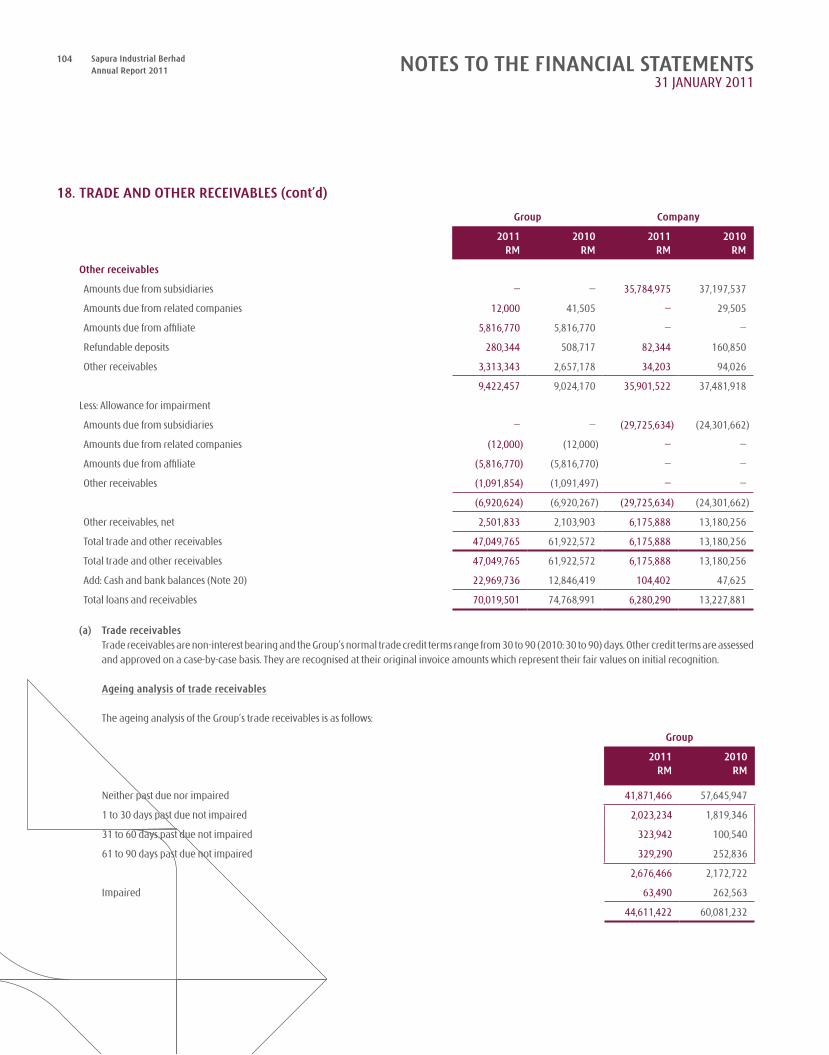
104 Sapura Industrial BerhadAnnual Report 2011 NOTES TO THE FINANCIAL STATEMENTS
31 JANuARY 2011
18. TRADE AND OTHER RECEIVABLES (cont’d)
Group Company
2011 2010 2011 2010RM RM RM RM
Other receivables
Amounts due from subsidiaries – – 35,784,975 37,197,537
Amounts due from related companies 12,000 41,505 – 29,505
Amounts due from affiliate 5,816,770 5,816,770 – –
Refundable deposits 280,344 508,717 82,344 160,850
Other receivables 3,313,343 2,657,178 34,203 94,026
9,422,457 9,024,170 35,901,522 37,481,918
Less: Allowance for impairment
Amounts due from subsidiaries – – (29,725,634) (24,301,662)
Amounts due from related companies (12,000) (12,000) – –
Amounts due from affiliate (5,816,770) (5,816,770) – –
Other receivables (1,091,854) (1,091,497) – –
(6,920,624) (6,920,267) (29,725,634) (24,301,662)
Other receivables, net 2,501,833 2,103,903 6,175,888 13,180,256
Total trade and other receivables 47,049,765 61,922,572 6,175,888 13,180,256
Total trade and other receivables 47,049,765 61,922,572 6,175,888 13,180,256
Add: Cash and bank balances (Note 20) 22,969,736 12,846,419 104,402 47,625
Total loans and receivables 70,019,501 74,768,991 6,280,290 13,227,881
(a) Trade receivables Trade receivables are non-interest bearing and the Group’s normal trade credit terms range from 30 to 90 (2010: 30 to 90) days. Other credit terms are assessed
and approved on a case-by-case basis. They are recognised at their original invoice amounts which represent their fair values on initial recognition.
Ageing analysis of trade receivables
The ageing analysis of the Group’s trade receivables is as follows:
Group
2011 2010RM RM
Neither past due nor impaired 41,871,466 57,645,947
1 to 30 days past due not impaired 2,023,234 1,819,346
31 to 60 days past due not impaired 323,942 100,540
61 to 90 days past due not impaired 329,290 252,836
2,676,466 2,172,722
Impaired 63,490 262,563
44,611,422 60,081,232
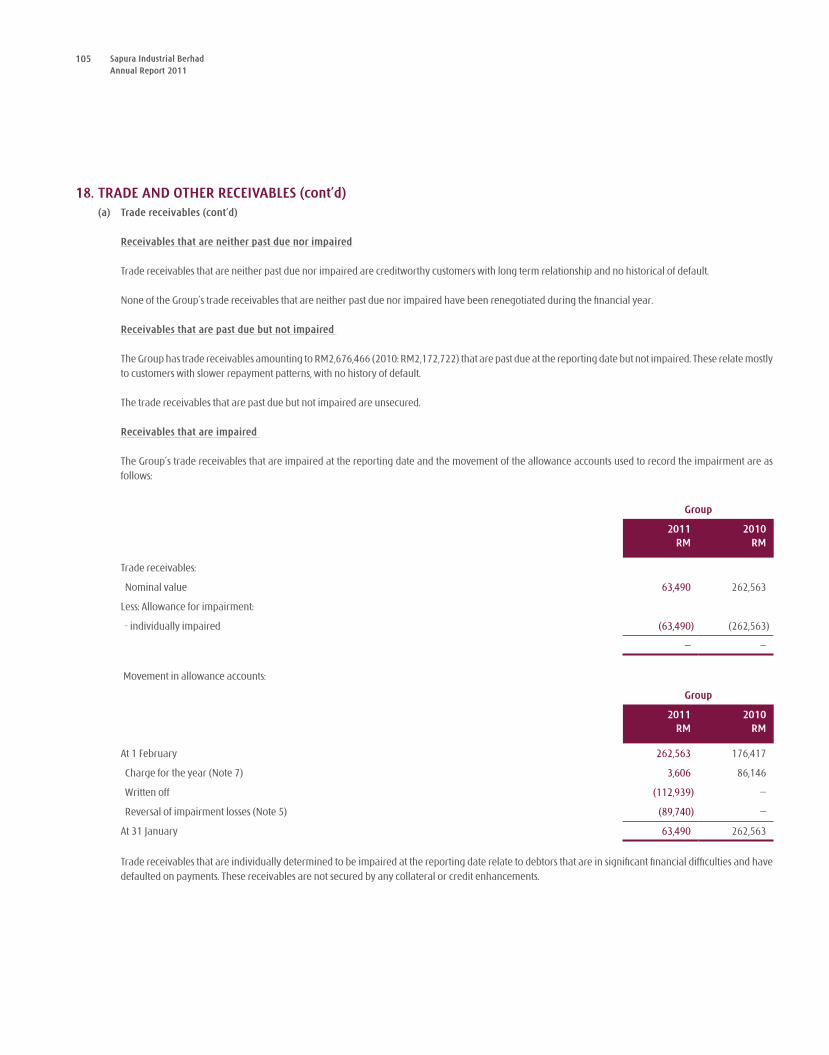
105 Sapura Industrial BerhadAnnual Report 2011
18. TRADE AND OTHER RECEIVABLES (cont’d) (a) Trade receivables (cont’d)
Receivables that are neither past due nor impaired
Trade receivables that are neither past due nor impaired are creditworthy customers with long term relationship and no historical of default.
None of the Group’s trade receivables that are neither past due nor impaired have been renegotiated during the financial year.
Receivables that are past due but not impaired
The Group has trade receivables amounting to RM2,676,466 (2010: RM2,172,722) that are past due at the reporting date but not impaired. These relate mostly to customers with slower repayment patterns, with no history of default.
The trade receivables that are past due but not impaired are unsecured.
Receivables that are impaired
The Group’s trade receivables that are impaired at the reporting date and the movement of the allowance accounts used to record the impairment are as follows:
Group
2011 2010RM RM
Trade receivables:
Nominal value 63,490 262,563
Less: Allowance for impairment:
- individually impaired (63,490) (262,563)
– –
Movement in allowance accounts:
Group
2011 2010RM RM
At 1 February 262,563 176,417
Charge for the year (Note 7) 3,606 86,146
Written off (112,939) –
Reversal of impairment losses (Note 5) (89,740) –
At 31 January 63,490 262,563
Trade receivables that are individually determined to be impaired at the reporting date relate to debtors that are in significant financial difficulties and have defaulted on payments. These receivables are not secured by any collateral or credit enhancements.
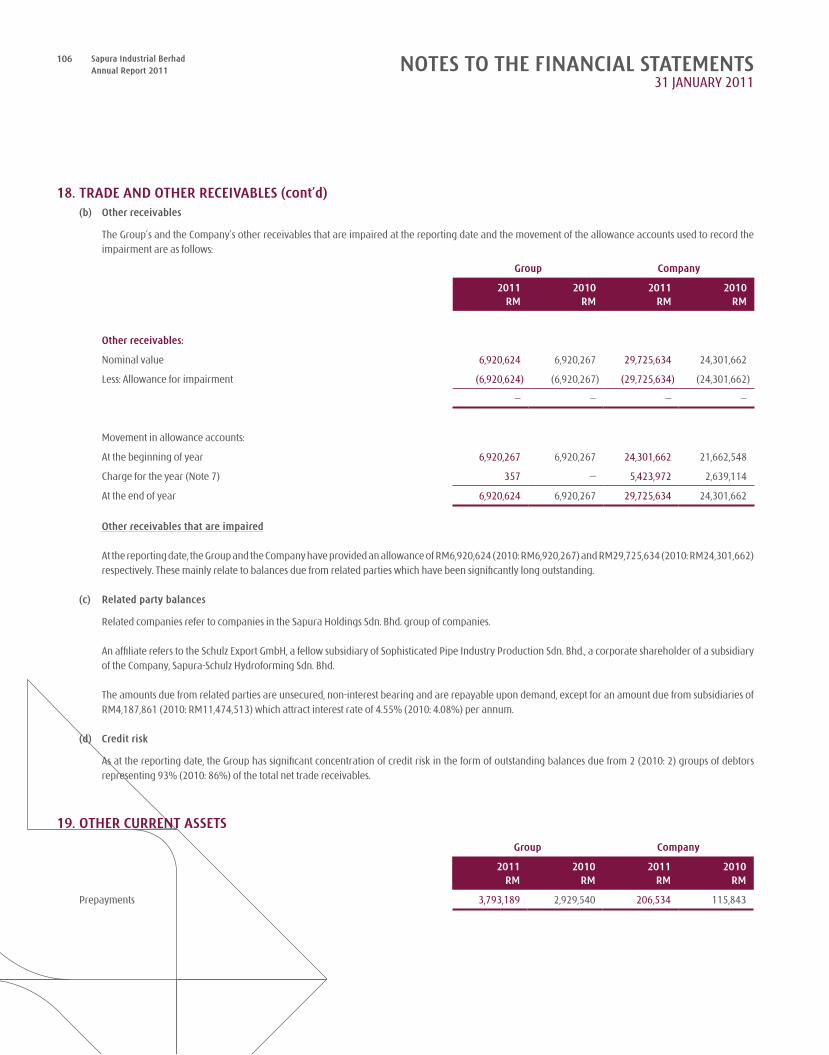
106 Sapura Industrial BerhadAnnual Report 2011 NOTES TO THE FINANCIAL STATEMENTS
31 JANuARY 2011
18. TRADE AND OTHER RECEIVABLES (cont’d)(b) Other receivables
The Group’s and the Company’s other receivables that are impaired at the reporting date and the movement of the allowance accounts used to record the impairment are as follows:
Group Company
2011 2010 2011 2010RM RM RM RM
Other receivables:
Nominal value 6,920,624 6,920,267 29,725,634 24,301,662
Less: Allowance for impairment (6,920,624) (6,920,267) (29,725,634) (24,301,662)
– – – –
Movement in allowance accounts:
At the beginning of year 6,920,267 6,920,267 24,301,662 21,662,548
Charge for the year (Note 7) 357 – 5,423,972 2,639,114
At the end of year 6,920,624 6,920,267 29,725,634 24,301,662
Other receivables that are impaired
At the reporting date, the Group and the Company have provided an allowance of RM6,920,624 (2010: RM6,920,267) and RM29,725,634 (2010: RM24,301,662) respectively. These mainly relate to balances due from related parties which have been significantly long outstanding.
(c) Related party balances
Related companies refer to companies in the Sapura Holdings Sdn. Bhd. group of companies.
An affiliate refers to the Schulz Export GmbH, a fellow subsidiary of Sophisticated Pipe Industry Production Sdn. Bhd., a corporate shareholder of a subsidiary of the Company, Sapura-Schulz Hydroforming Sdn. Bhd.
The amounts due from related parties are unsecured, non-interest bearing and are repayable upon demand, except for an amount due from subsidiaries of RM4,187,861 (2010: RM11,474,513) which attract interest rate of 4.55% (2010: 4.08%) per annum.
(d) Credit risk
As at the reporting date, the Group has significant concentration of credit risk in the form of outstanding balances due from 2 (2010: 2) groups of debtors representing 93% (2010: 86%) of the total net trade receivables.
19. OTHER CURRENT ASSETS
Group Company
2011 2010 2011 2010RM RM RM RM
Prepayments 3,793,189 2,929,540 206,534 115,843
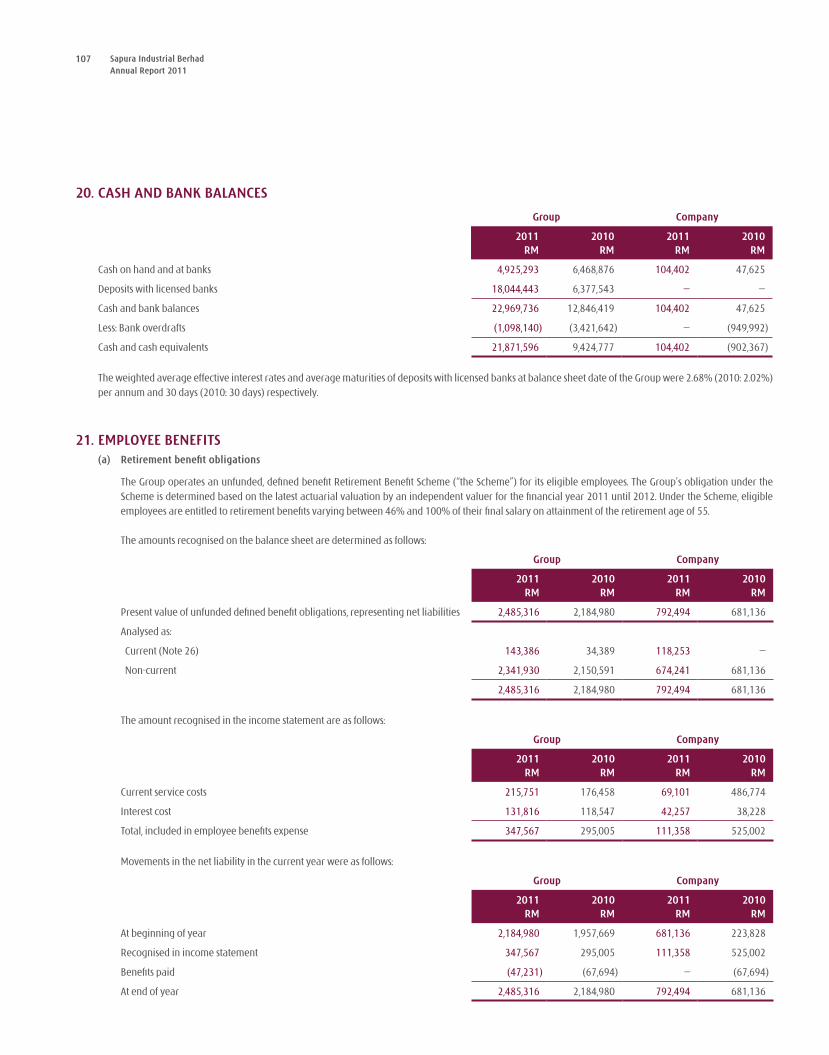
107 Sapura Industrial BerhadAnnual Report 2011
20. CASH AND BANK BALANCES
Group Company
2011 2010 2011 2010RM RM RM RM
Cash on hand and at banks 4,925,293 6,468,876 104,402 47,625
Deposits with licensed banks 18,044,443 6,377,543 – –
Cash and bank balances 22,969,736 12,846,419 104,402 47,625
Less: Bank overdrafts (1,098,140) (3,421,642) – (949,992)
Cash and cash equivalents 21,871,596 9,424,777 104,402 (902,367)
The weighted average effective interest rates and average maturities of deposits with licensed banks at balance sheet date of the Group were 2.68% (2010: 2.02%) per annum and 30 days (2010: 30 days) respectively.
21. EMPLOYEE BENEFITS (a) Retirement benefit obligations
The Group operates an unfunded, defined benefit Retirement Benefit Scheme (“the Scheme”) for its eligible employees. The Group’s obligation under the Scheme is determined based on the latest actuarial valuation by an independent valuer for the financial year 2011 until 2012. under the Scheme, eligible employees are entitled to retirement benefits varying between 46% and 100% of their final salary on attainment of the retirement age of 55.
The amounts recognised on the balance sheet are determined as follows:
Group Company
2011 2010 2011 2010RM RM RM RM
Present value of unfunded defined benefit obligations, representing net liabilities 2,485,316 2,184,980 792,494 681,136
Analysed as:
Current (Note 26) 143,386 34,389 118,253 –
Non-current 2,341,930 2,150,591 674,241 681,136
2,485,316 2,184,980 792,494 681,136
The amount recognised in the income statement are as follows:
Group Company
2011 2010 2011 2010RM RM RM RM
Current service costs 215,751 176,458 69,101 486,774
Interest cost 131,816 118,547 42,257 38,228
Total, included in employee benefits expense 347,567 295,005 111,358 525,002
Movements in the net liability in the current year were as follows:
Group Company
2011 2010 2011 2010RM RM RM RM
At beginning of year 2,184,980 1,957,669 681,136 223,828
Recognised in income statement 347,567 295,005 111,358 525,002
Benefits paid (47,231) (67,694) – (67,694)
At end of year 2,485,316 2,184,980 792,494 681,136
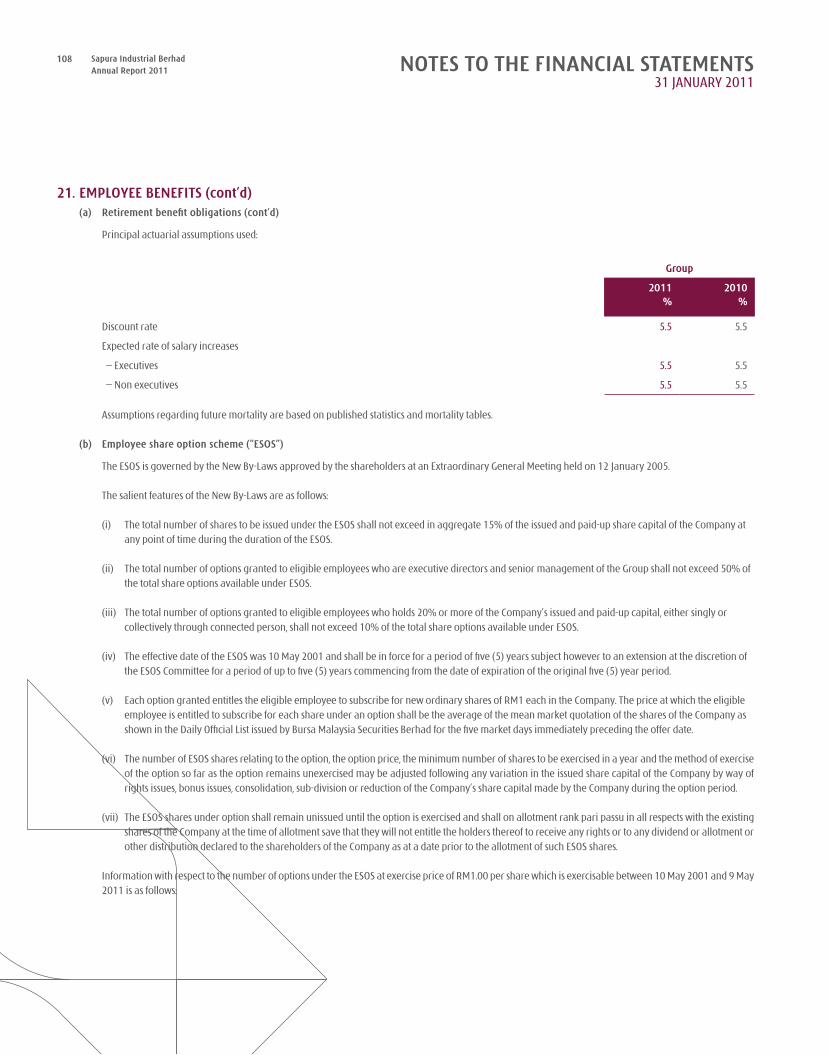
108 Sapura Industrial BerhadAnnual Report 2011 NOTES TO THE FINANCIAL STATEMENTS
31 JANuARY 2011
21. EMPLOYEE BENEFITS (cont’d) (a) Retirement benefit obligations (cont’d)
Principal actuarial assumptions used:
Group
2011 2010% %
Discount rate 5.5 5.5
Expected rate of salary increases
– Executives 5.5 5.5
– Non executives 5.5 5.5
Assumptions regarding future mortality are based on published statistics and mortality tables.
(b) Employee share option scheme (“ESOS”)
The ESOS is governed by the New By-Laws approved by the shareholders at an Extraordinary General Meeting held on 12 January 2005.
The salient features of the New By-Laws are as follows:
(i) The total number of shares to be issued under the ESOS shall not exceed in aggregate 15% of the issued and paid-up share capital of the Company at any point of time during the duration of the ESOS.
(ii) The total number of options granted to eligible employees who are executive directors and senior management of the Group shall not exceed 50% of the total share options available under ESOS.
(iii) The total number of options granted to eligible employees who holds 20% or more of the Company’s issued and paid-up capital, either singly or collectively through connected person, shall not exceed 10% of the total share options available under ESOS.
(iv) The effective date of the ESOS was 10 May 2001 and shall be in force for a period of five (5) years subject however to an extension at the discretion of the ESOS Committee for a period of up to five (5) years commencing from the date of expiration of the original five (5) year period.
(v) Each option granted entitles the eligible employee to subscribe for new ordinary shares of RM1 each in the Company. The price at which the eligible employee is entitled to subscribe for each share under an option shall be the average of the mean market quotation of the shares of the Company as shown in the Daily Official List issued by Bursa Malaysia Securities Berhad for the five market days immediately preceding the offer date.
(vi) The number of ESOS shares relating to the option, the option price, the minimum number of shares to be exercised in a year and the method of exercise of the option so far as the option remains unexercised may be adjusted following any variation in the issued share capital of the Company by way of rights issues, bonus issues, consolidation, sub-division or reduction of the Company’s share capital made by the Company during the option period.
(vii) The ESOS shares under option shall remain unissued until the option is exercised and shall on allotment rank pari passu in all respects with the existing shares of the Company at the time of allotment save that they will not entitle the holders thereof to receive any rights or to any dividend or allotment or other distribution declared to the shareholders of the Company as at a date prior to the allotment of such ESOS shares.
Information with respect to the number of options under the ESOS at exercise price of RM1.00 per share which is exercisable between 10 May 2001 and 9 May 2011 is as follows:
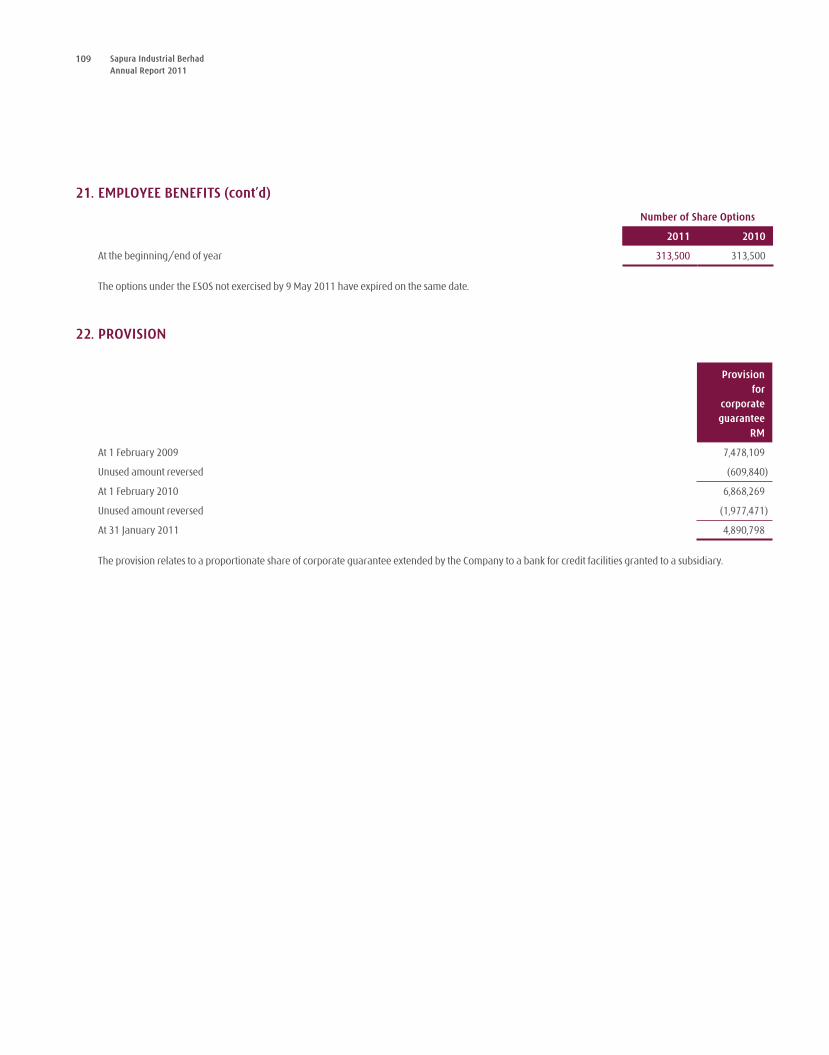
109 Sapura Industrial BerhadAnnual Report 2011
21. EMPLOYEE BENEFITS (cont’d)
Number of Share Options
2011 2010
At the beginning/end of year 313,500 313,500
The options under the ESOS not exercised by 9 May 2011 have expired on the same date.
22. PROVISION
Provision for
corporate guarantee
RM
At 1 February 2009 7,478,109
unused amount reversed (609,840)
At 1 February 2010 6,868,269
unused amount reversed (1,977,471)
At 31 January 2011 4,890,798
The provision relates to a proportionate share of corporate guarantee extended by the Company to a bank for credit facilities granted to a subsidiary.
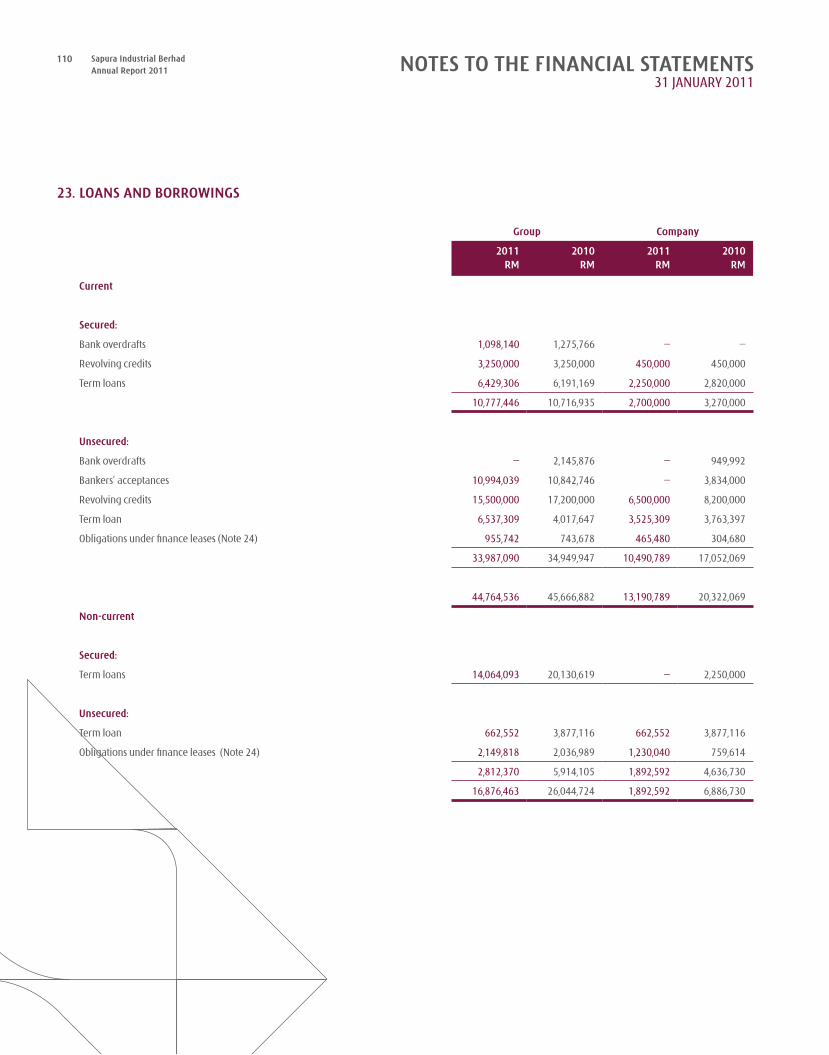
110 Sapura Industrial BerhadAnnual Report 2011 NOTES TO THE FINANCIAL STATEMENTS
31 JANuARY 2011
23. LOANS AND BORROWINGS
Group Company
2011 2010 2011 2010RM RM RM RM
Current
Secured:
Bank overdrafts 1,098,140 1,275,766 – –
Revolving credits 3,250,000 3,250,000 450,000 450,000
Term loans 6,429,306 6,191,169 2,250,000 2,820,000
10,777,446 10,716,935 2,700,000 3,270,000
Unsecured:
Bank overdrafts – 2,145,876 – 949,992
Bankers’ acceptances 10,994,039 10,842,746 – 3,834,000
Revolving credits 15,500,000 17,200,000 6,500,000 8,200,000
Term loan 6,537,309 4,017,647 3,525,309 3,763,397
Obligations under finance leases (Note 24) 955,742 743,678 465,480 304,680
33,987,090 34,949,947 10,490,789 17,052,069
44,764,536 45,666,882 13,190,789 20,322,069
Non-current
Secured:
Term loans 14,064,093 20,130,619 – 2,250,000
Unsecured:
Term loan 662,552 3,877,116 662,552 3,877,116
Obligations under finance leases (Note 24) 2,149,818 2,036,989 1,230,040 759,614
2,812,370 5,914,105 1,892,592 4,636,730
16,876,463 26,044,724 1,892,592 6,886,730
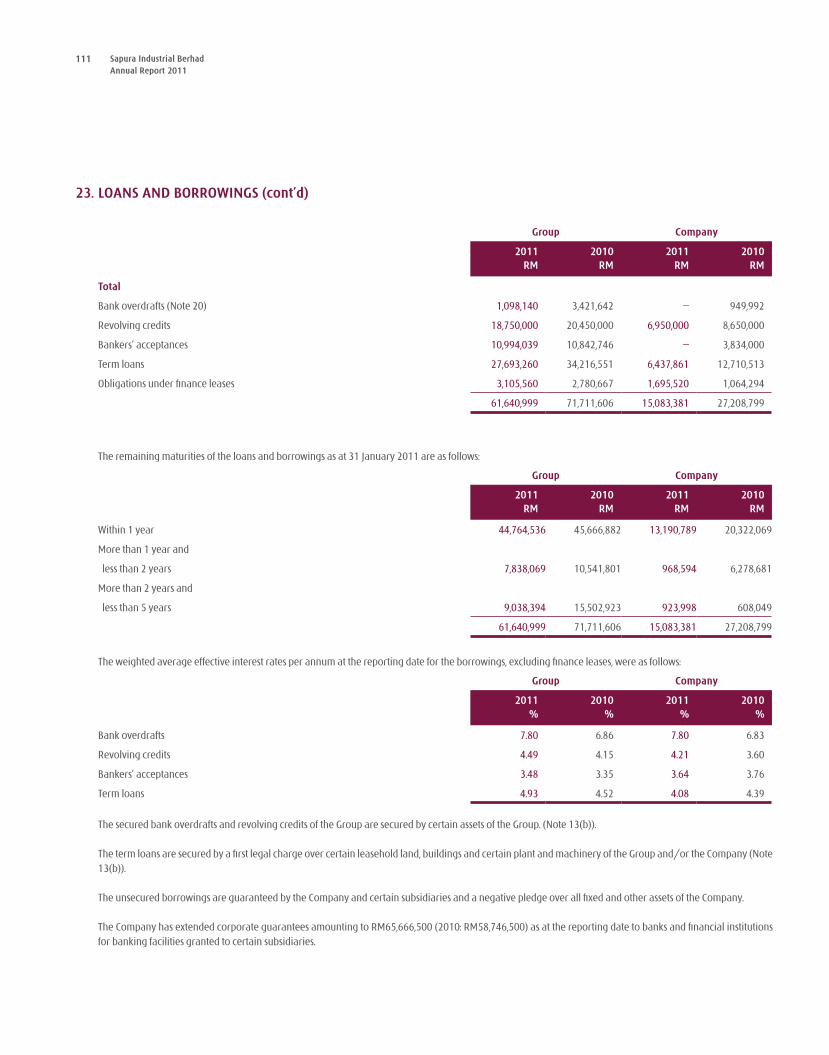
111 Sapura Industrial BerhadAnnual Report 2011
23. LOANS AND BORROWINGS (cont’d)
Group Company
2011 2010 2011 2010RM RM RM RM
Total
Bank overdrafts (Note 20) 1,098,140 3,421,642 – 949,992
Revolving credits 18,750,000 20,450,000 6,950,000 8,650,000
Bankers’ acceptances 10,994,039 10,842,746 – 3,834,000
Term loans 27,693,260 34,216,551 6,437,861 12,710,513
Obligations under finance leases 3,105,560 2,780,667 1,695,520 1,064,294
61,640,999 71,711,606 15,083,381 27,208,799
The remaining maturities of the loans and borrowings as at 31 January 2011 are as follows:
Group Company
2011 2010 2011 2010RM RM RM RM
Within 1 year 44,764,536 45,666,882 13,190,789 20,322,069
More than 1 year and
less than 2 years 7,838,069 10,541,801 968,594 6,278,681
More than 2 years and
less than 5 years 9,038,394 15,502,923 923,998 608,049
61,640,999 71,711,606 15,083,381 27,208,799
The weighted average effective interest rates per annum at the reporting date for the borrowings, excluding finance leases, were as follows:
Group Company
2011 2010 2011 2010% % % %
Bank overdrafts 7.80 6.86 7.80 6.83
Revolving credits 4.49 4.15 4.21 3.60
Bankers’ acceptances 3.48 3.35 3.64 3.76
Term loans 4.93 4.52 4.08 4.39
The secured bank overdrafts and revolving credits of the Group are secured by certain assets of the Group. (Note 13(b)).
The term loans are secured by a first legal charge over certain leasehold land, buildings and certain plant and machinery of the Group and/or the Company (Note 13(b)).
The unsecured borrowings are guaranteed by the Company and certain subsidiaries and a negative pledge over all fixed and other assets of the Company.
The Company has extended corporate guarantees amounting to RM65,666,500 (2010: RM58,746,500) as at the reporting date to banks and financial institutions for banking facilities granted to certain subsidiaries.
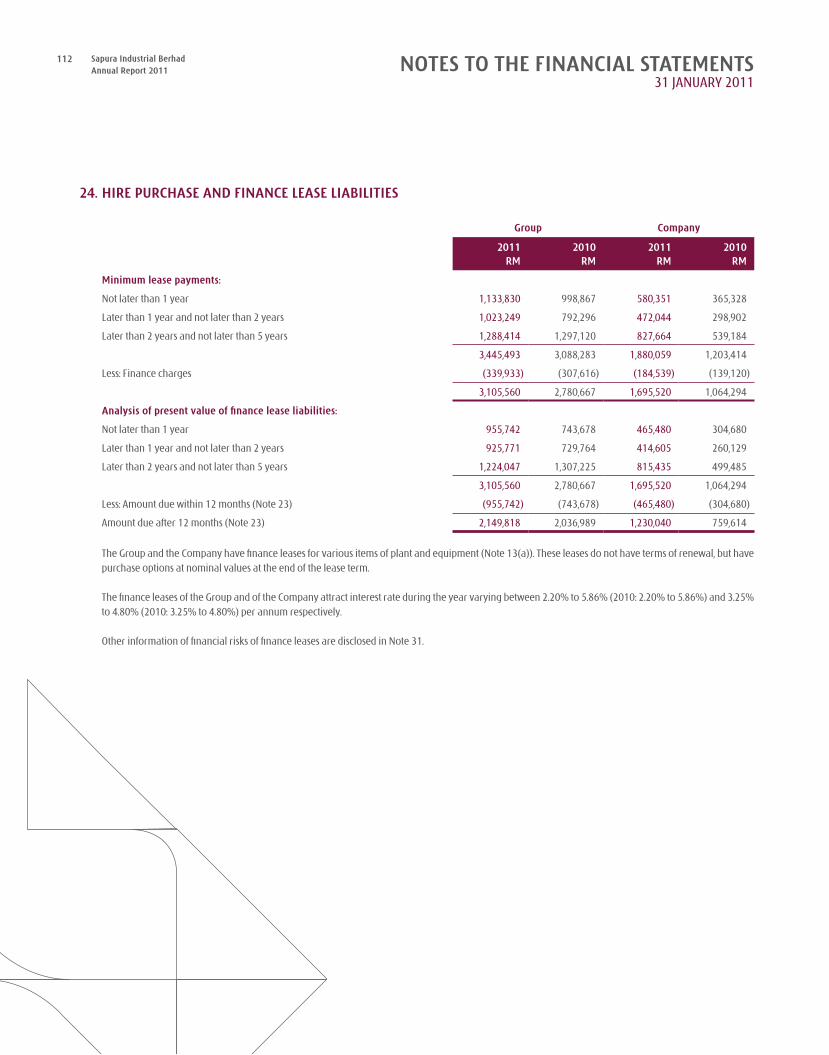
112 Sapura Industrial BerhadAnnual Report 2011 NOTES TO THE FINANCIAL STATEMENTS
31 JANuARY 2011
24. HIRE PURCHASE AND FINANCE LEASE LIABILITIES
Group Company
2011 2010 2011 2010RM RM RM RM
Minimum lease payments:
Not later than 1 year 1,133,830 998,867 580,351 365,328
Later than 1 year and not later than 2 years 1,023,249 792,296 472,044 298,902
Later than 2 years and not later than 5 years 1,288,414 1,297,120 827,664 539,184
3,445,493 3,088,283 1,880,059 1,203,414
Less: Finance charges (339,933) (307,616) (184,539) (139,120)
3,105,560 2,780,667 1,695,520 1,064,294
Analysis of present value of finance lease liabilities:
Not later than 1 year 955,742 743,678 465,480 304,680
Later than 1 year and not later than 2 years 925,771 729,764 414,605 260,129
Later than 2 years and not later than 5 years 1,224,047 1,307,225 815,435 499,485
3,105,560 2,780,667 1,695,520 1,064,294
Less: Amount due within 12 months (Note 23) (955,742) (743,678) (465,480) (304,680)
Amount due after 12 months (Note 23) 2,149,818 2,036,989 1,230,040 759,614
The Group and the Company have finance leases for various items of plant and equipment (Note 13(a)). These leases do not have terms of renewal, but have purchase options at nominal values at the end of the lease term.
The finance leases of the Group and of the Company attract interest rate during the year varying between 2.20% to 5.86% (2010: 2.20% to 5.86%) and 3.25%
to 4.80% (2010: 3.25% to 4.80%) per annum respectively.
Other information of financial risks of finance leases are disclosed in Note 31.
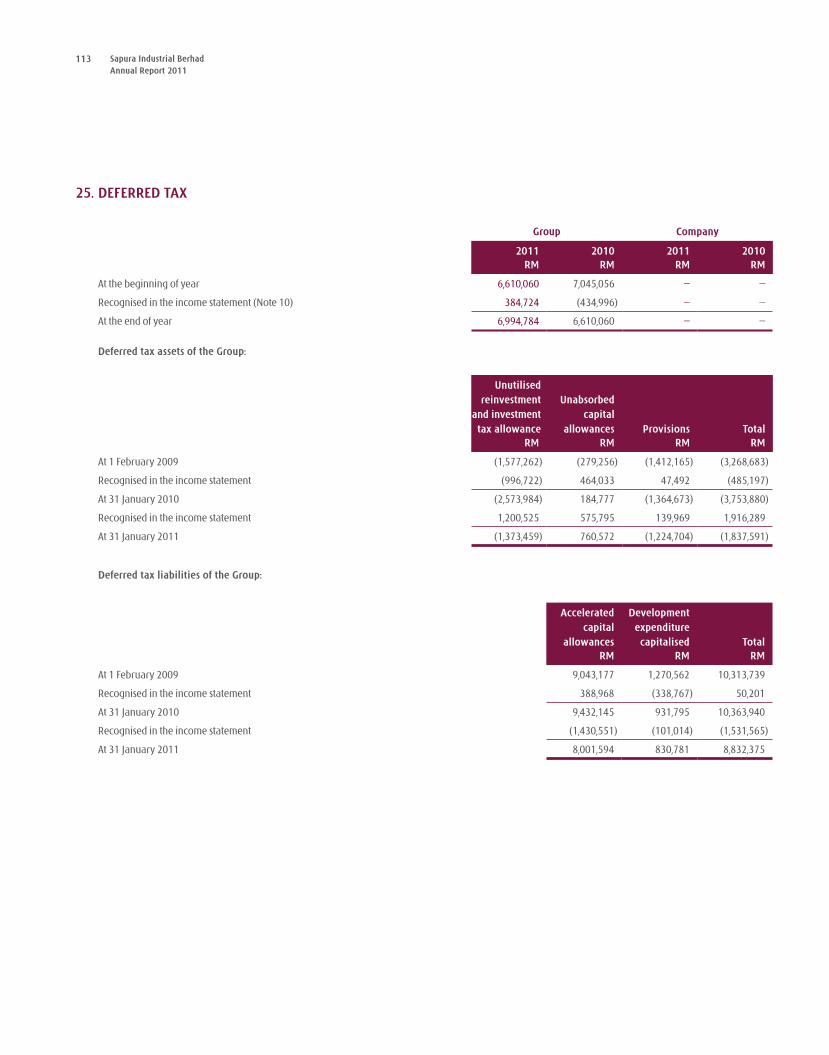
113 Sapura Industrial BerhadAnnual Report 2011
25. DEFERRED TAX
Group Company
2011 2010 2011 2010RM RM RM RM
At the beginning of year 6,610,060 7,045,056 – –
Recognised in the income statement (Note 10) 384,724 (434,996) – –
At the end of year 6,994,784 6,610,060 – –
Deferred tax assets of the Group:
Unutilised reinvestment
and investment tax allowance
Unabsorbed capital
allowances Provisions TotalRM RM RM RM
At 1 February 2009 (1,577,262) (279,256) (1,412,165) (3,268,683)
Recognised in the income statement (996,722) 464,033 47,492 (485,197)
At 31 January 2010 (2,573,984) 184,777 (1,364,673) (3,753,880)
Recognised in the income statement 1,200,525 575,795 139,969 1,916,289
At 31 January 2011 (1,373,459) 760,572 (1,224,704) (1,837,591)
Deferred tax liabilities of the Group:
Accelerated capital
allowances
Development expenditure capitalised Total
RM RM RM
At 1 February 2009 9,043,177 1,270,562 10,313,739
Recognised in the income statement 388,968 (338,767) 50,201
At 31 January 2010 9,432,145 931,795 10,363,940
Recognised in the income statement (1,430,551) (101,014) (1,531,565)
At 31 January 2011 8,001,594 830,781 8,832,375
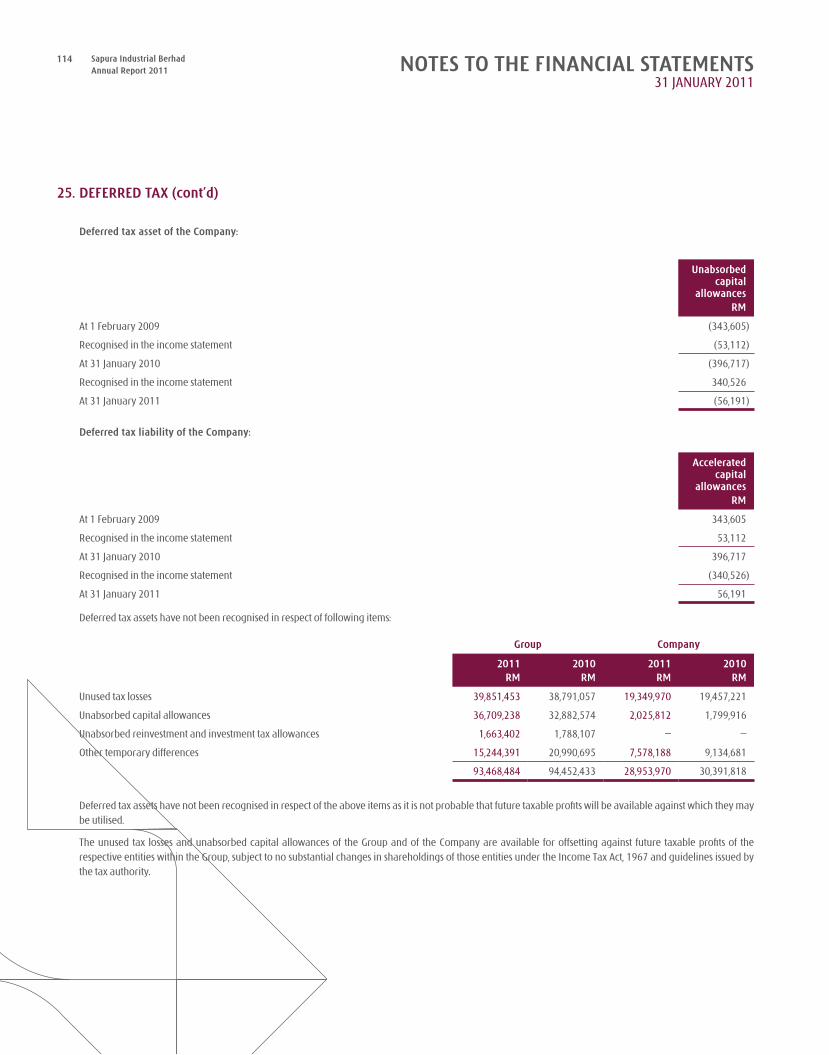
114 Sapura Industrial BerhadAnnual Report 2011 NOTES TO THE FINANCIAL STATEMENTS
31 JANuARY 2011
25. DEFERRED TAX (cont’d)
Deferred tax asset of the Company:
Unabsorbedcapital
allowancesRM
At 1 February 2009 (343,605)
Recognised in the income statement (53,112)
At 31 January 2010 (396,717)
Recognised in the income statement 340,526
At 31 January 2011 (56,191)
Deferred tax liability of the Company:
Acceleratedcapital
allowancesRM
At 1 February 2009 343,605
Recognised in the income statement 53,112
At 31 January 2010 396,717
Recognised in the income statement (340,526)
At 31 January 2011 56,191
Deferred tax assets have not been recognised in respect of following items:
Group Company
2011 2010 2011 2010RM RM RM RM
unused tax losses 39,851,453 38,791,057 19,349,970 19,457,221
unabsorbed capital allowances 36,709,238 32,882,574 2,025,812 1,799,916
unabsorbed reinvestment and investment tax allowances 1,663,402 1,788,107 – –
Other temporary differences 15,244,391 20,990,695 7,578,188 9,134,681
93,468,484 94,452,433 28,953,970 30,391,818
Deferred tax assets have not been recognised in respect of the above items as it is not probable that future taxable profits will be available against which they may be utilised.
The unused tax losses and unabsorbed capital allowances of the Group and of the Company are available for offsetting against future taxable profits of the respective entities within the Group, subject to no substantial changes in shareholdings of those entities under the Income Tax Act, 1967 and guidelines issued by the tax authority.
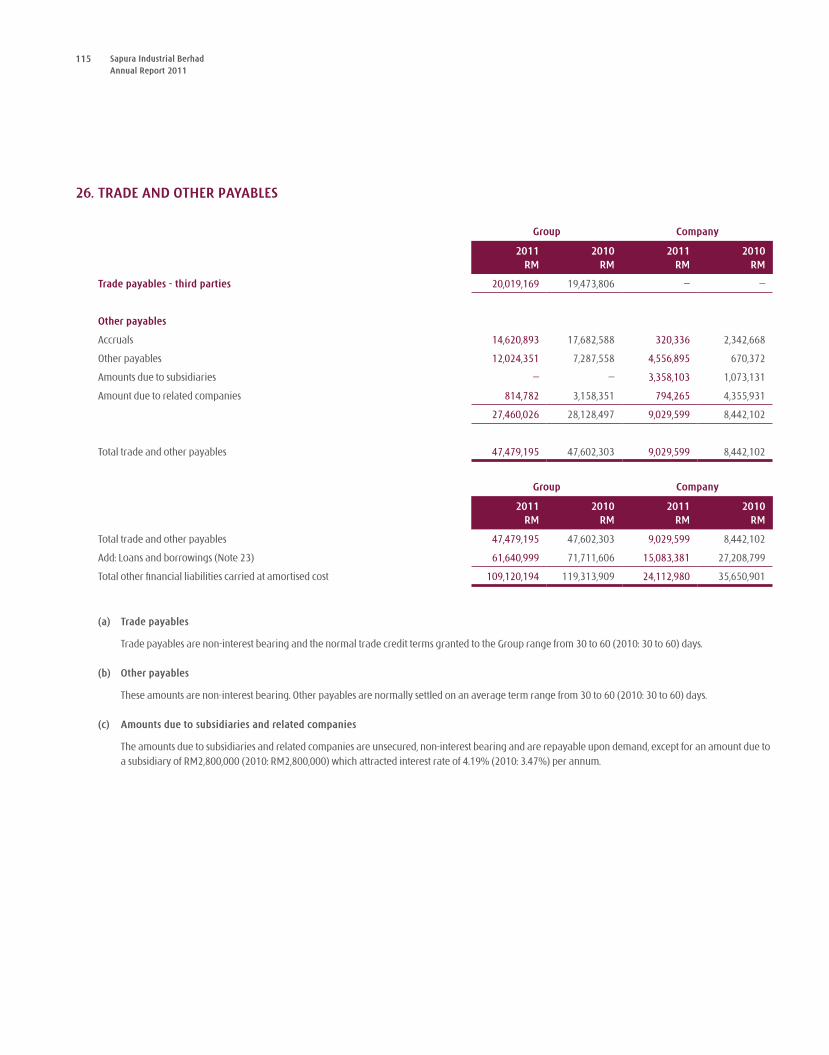
115 Sapura Industrial BerhadAnnual Report 2011
26. TRADE AND OTHER PAYABLES
Group Company
2011 2010 2011 2010RM RM RM RM
Trade payables - third parties 20,019,169 19,473,806 – –
Other payables
Accruals 14,620,893 17,682,588 320,336 2,342,668
Other payables 12,024,351 7,287,558 4,556,895 670,372
Amounts due to subsidiaries – – 3,358,103 1,073,131
Amount due to related companies 814,782 3,158,351 794,265 4,355,931
27,460,026 28,128,497 9,029,599 8,442,102
Total trade and other payables 47,479,195 47,602,303 9,029,599 8,442,102
Group Company
2011 2010 2011 2010RM RM RM RM
Total trade and other payables 47,479,195 47,602,303 9,029,599 8,442,102
Add: Loans and borrowings (Note 23) 61,640,999 71,711,606 15,083,381 27,208,799
Total other financial liabilities carried at amortised cost 109,120,194 119,313,909 24,112,980 35,650,901
(a) Trade payables
Trade payables are non-interest bearing and the normal trade credit terms granted to the Group range from 30 to 60 (2010: 30 to 60) days.
(b) Other payables
These amounts are non-interest bearing. Other payables are normally settled on an average term range from 30 to 60 (2010: 30 to 60) days.
(c) Amounts due to subsidiaries and related companies
The amounts due to subsidiaries and related companies are unsecured, non-interest bearing and are repayable upon demand, except for an amount due to a subsidiary of RM2,800,000 (2010: RM2,800,000) which attracted interest rate of 4.19% (2010: 3.47%) per annum.
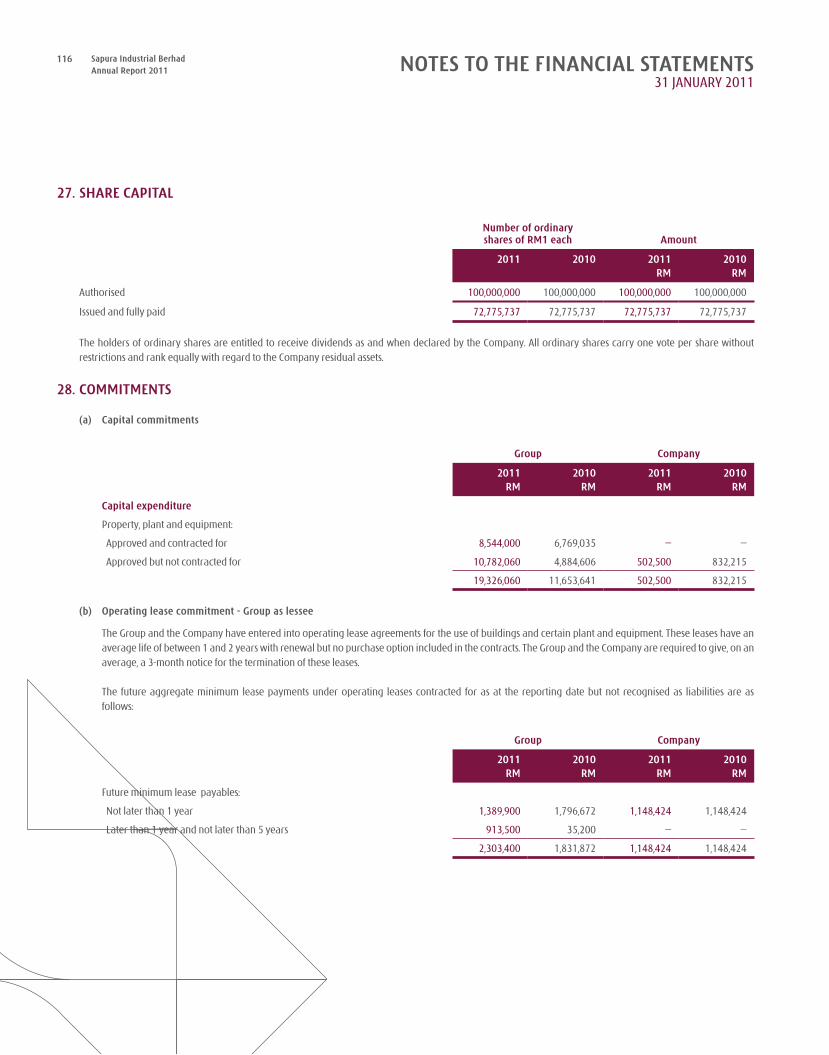
116 Sapura Industrial BerhadAnnual Report 2011 NOTES TO THE FINANCIAL STATEMENTS
31 JANuARY 2011
27. SHARE CAPITAL
Number of ordinaryshares of RM1 each Amount
2011 2010 2011 2010RM RM
Authorised 100,000,000 100,000,000 100,000,000 100,000,000
Issued and fully paid 72,775,737 72,775,737 72,775,737 72,775,737
The holders of ordinary shares are entitled to receive dividends as and when declared by the Company. All ordinary shares carry one vote per share without restrictions and rank equally with regard to the Company residual assets.
28. COMMITMENTS
(a) Capital commitments
Group Company
2011 2010 2011 2010RM RM RM RM
Capital expenditure
Property, plant and equipment:
Approved and contracted for 8,544,000 6,769,035 – –
Approved but not contracted for 10,782,060 4,884,606 502,500 832,215
19,326,060 11,653,641 502,500 832,215
(b) Operating lease commitment - Group as lessee
The Group and the Company have entered into operating lease agreements for the use of buildings and certain plant and equipment. These leases have an average life of between 1 and 2 years with renewal but no purchase option included in the contracts. The Group and the Company are required to give, on an average, a 3-month notice for the termination of these leases.
The future aggregate minimum lease payments under operating leases contracted for as at the reporting date but not recognised as liabilities are as follows:
Group Company
2011 2010 2011 2010RM RM RM RM
Future minimum lease payables:
Not later than 1 year 1,389,900 1,796,672 1,148,424 1,148,424
Later than 1 year and not later than 5 years 913,500 35,200 – –
2,303,400 1,831,872 1,148,424 1,148,424
117 Sapura Industrial BerhadAnnual Report 2011
29. CONTINGENT LIABILITIES
(a) On 20 November 2007, Schulz Export GmbH (“Schulz Export”), a fellow subsidiary of Sophisticated Pipe Industry Production Sdn. Bhd. (formerly known as Schulz (Manufacturing) Sdn. Bhd.) (“SPIP”), a corporate shareholder of Sapura-Schulz Hydroforming Sdn. Bhd. (“Sapura-Schulz”), through Schulz Export’s solicitors filed a Statement of Claim (which was amended on 13 January 2010 and re-amended on 6 February 2010) against Sapura-Schulz, a 75% subsidiary of Sapura Industrial Berhad (“the Company” or “SIB”) for breach of a Business Operations Agreement (“BOA”) dated 3 April 2004 and a License Agreement dated 3 April 2004 (“LA”) entered into between Sapura-Schulz and Schulz Export, for inter alia:
(i) EuR500,377 for loss of profits;
(ii) EuR424,168 and uSD43,109 for rectification works; and
(iii) Anti-dumping cost amounting to uSD140,000.
(b) On 20 November 2007, SPIP, a 25% shareholder in Sapura-Schulz, through SPIP’s solicitors filed a Statement of Claim against SIB for breach of a Shareholders Agreement (“SA”) dated 3 April 2004 entered into between SIB and SPIP, for inter alia:
(i) RM26,000,000; and
(ii) damages for breach of fiduciary duties.
The SA, BOA and LA were executed along with an Asset Sale Agreement dated 13 October 2003 (together with two supplemental agreements dated 14 November 2003 and 3 April 2004 respectively) (“ASA”) between Sapura-Schulz and SPIP and an Assignment Agreement dated 23 June 2005 between Wilh Schulz Gmbh (“Wilh Schulz”), Schulz Export, SPIP and Sapura-Schulz (“AA”) (collectively referred to “the Agreements”) which all stem from a Heads of Agreement (“HOA”) dated 3 July 2003 entered into between SIB and Wilh Schulz setting out the understanding between the parties with regard to the joint venture between Wilh Schulz and SIB.
In order to inter alia enable SIB to bring all claims arising under the Agreements and under the HOA against inter alia Wilh Schulz and Wolfgang Leonhard Schulz (the alter ego of Wilh Schulz) and to confer jurisdiction on the arbitrator to hear all related matters under the above two arbitration proceedings, the arbitrator directed that SIB, Sapura-Schulz, Wilh Schulz, Schulz Export, SPIP and Wolfgang Leonhard Schulz executed an Ad Hoc Arbitration Agreement (“Ad Hoc Agreement”) on 22 February 2008.
These two arbitration proceedings are by consent heard together by one arbitrator and various directions were given by the arbitrator on 1 October 2007 whereupon these matters were fixed for hearing from 12 January 2009 to 23 January 2009.
On 29 May 2008, SIB and Sapura-Schulz, through their solicitors, filed their respective defences and the following counterclaims to these matters:
(i) Sapura-Schulz counterclaimed against Schulz Export for breach of contract for RM5,838,956 and general damages of RM97,034,078; and
(ii) SIB counterclaimed against SPIP for breach of contract for RM24,000,000 and general damages of RM91,988,862.
On 12 January 2009, the Claimant’s solicitors submitted their request to amend Schulz Export’s previous claim against Sapura-Schulz for rectification works from uSD40,771 to uSD43,108 and to include an additional claim by Schulz Export against Sapura-Schulz for anti-dumping cost amounting to uSD140,000. SIB’s solicitors objected to the inclusion of the additional claim. The Arbitrator allowed the amendments after hearing submissions by both counsels and Sapura-Schulz is given liberty to amend its Defence and Counterclaim on such claims by Schulz Export.
This matter was partly heard from 12 January 2009 to 15 January 2009 and was then scheduled to be reheard from 20 to 28 July 2009. The hearing dates on 16 to 23 January 2009, 20, 21, 27 and 28 July 2009 were vacated by the Arbitrator.
Following the conclusion of the hearing from 22 to 24 July 2009, SIB filed their Written Submissions dated 30 October 2009 and the Written Submissions In Reply dated 20 November 2009. The Claimants also served their Written Submissions dated 2 November 2009 and Written Submissions In Reply dated 20 November 2009.
These arbitration matters were then fixed for hearing of oral submissions on 25 and 26 November 2009 and the hearing was concluded.
SIB now awaits the arbitrator’s decision of these arbitration.
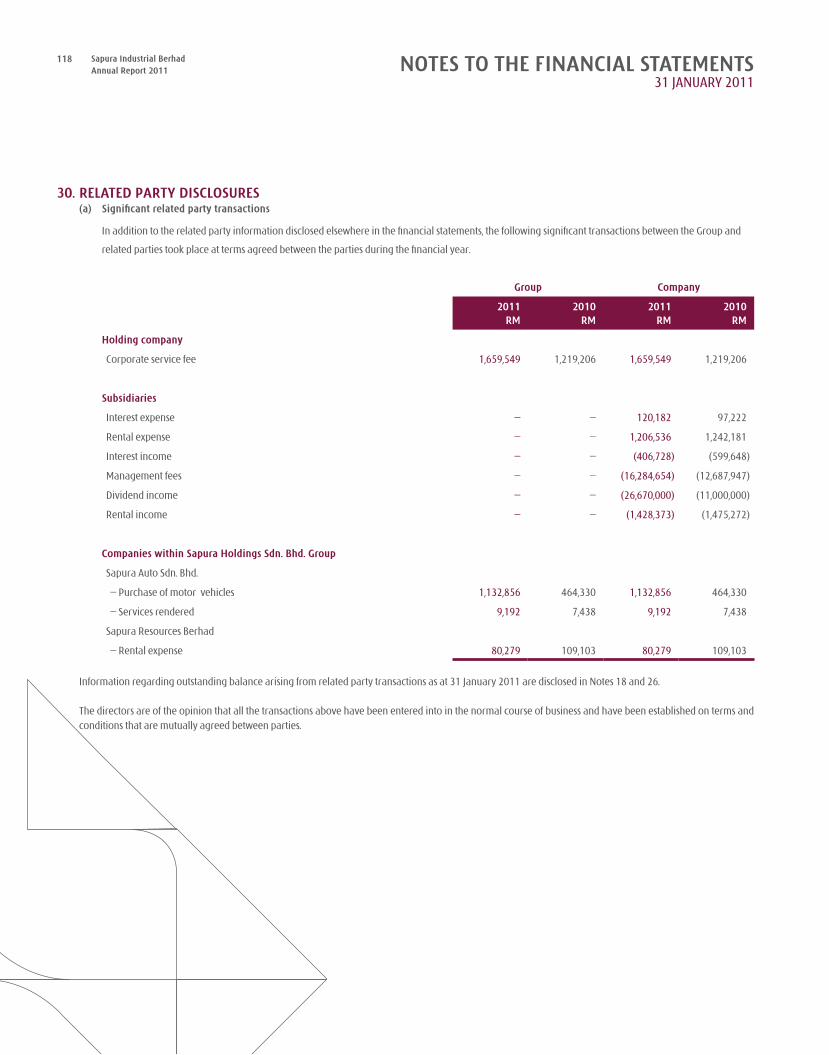
118 Sapura Industrial BerhadAnnual Report 2011 NOTES TO THE FINANCIAL STATEMENTS
31 JANuARY 2011
30. RELATED PARTY DISCLOSURES (a) Significant related party transactions
In addition to the related party information disclosed elsewhere in the financial statements, the following significant transactions between the Group and
related parties took place at terms agreed between the parties during the financial year.
Group Company
2011 2010 2011 2010RM RM RM RM
Holding company
Corporate service fee 1,659,549 1,219,206 1,659,549 1,219,206
Subsidiaries
Interest expense – – 120,182 97,222
Rental expense – – 1,206,536 1,242,181
Interest income – – (406,728) (599,648)
Management fees – – (16,284,654) (12,687,947)
Dividend income – – (26,670,000) (11,000,000)
Rental income – – (1,428,373) (1,475,272)
Companies within Sapura Holdings Sdn. Bhd. Group
Sapura Auto Sdn. Bhd.
– Purchase of motor vehicles 1,132,856 464,330 1,132,856 464,330
– Services rendered 9,192 7,438 9,192 7,438
Sapura Resources Berhad
– Rental expense 80,279 109,103 80,279 109,103
Information regarding outstanding balance arising from related party transactions as at 31 January 2011 are disclosed in Notes 18 and 26.
The directors are of the opinion that all the transactions above have been entered into in the normal course of business and have been established on terms and conditions that are mutually agreed between parties.
119 Sapura Industrial BerhadAnnual Report 2011
30. RELATED PARTY DISCLOSURES (cont’d)(b) Compensation of key management personnel
The remuneration of members of key management during the year excluding directors was as follows:
Group Company
2011 2010 2011 2010RM RM RM RM
Wages and salaries 843,639 819,046 843,638 692,550
Contributions to defined contribution plan 101,436 98,700 101,436 83,400
Benefits-in-kind 24,834 23,749 24,834 21,170
969,909 941,495 969,908 797,120
The remuneration of directors are disclosed in Note 9.
31. FINANCIAL INSTRUMENTS(a) Financial risk management objectives and policies
The Group’s financial risk management policy seeks to ensure that adequate financial resources are available for the development of the Group’s businesses whilst managing its interest rate risk (both fair value and cash flow), foreign currency risk, liquidity risk and credit risk. It is, and has been throughout the year under review, the Group’s policy that no trading in derivative financial instruments shall be undertaken.
(b) Interest rate risk
The Group’s primary interest rate risk relates to interest-bearing debts as the Group had no substantial long term interest-bearing assets as at 31 January 2011. The investment in financial assets are mainly short term in nature and they are not held for speculative purposes but have been mostly placed in fixed deposits or occasionally, in short term commercial papers which yield better returns than cash at bank.
The Group manages its interest rate exposure by maintaining a prudent mix of fixed and floating rate borrowings. The Group actively reviews its debt portfolio, taking into account the investment holding period and nature of its assets. This strategy allows it to capitalise on cheaper funding in a low interest rate environment and achieve a certain level of protection against rate hikes.
The information on maturity dates and effective interest rates of financial assets and liabilities are disclosed in their respective notes. Sensitivity analysis for interest rate risk
At the reporting date, if interest rates had been 25 basis points lower/higher, with all other variables held constant, the Group’s profit net of tax and total equity would have been RM80,031 higher/lower, arising mainly as a result of lower/higher interest expense on floating loans and borrowings.
If interest rates had been 25 basis points lower/higher, with all other variables held constant, the Company’s profit net of tax and total equity would have been RM22,500 higher/lower, arising mainly as a result of lower/higher interest expense on floating rate loans and borrowings and advances from related parties, and higher/lower interest income from floating rate advances to related parties.
The assumed movement in basis points for interest rate sensitivity analysis is based on the currently observable market environment.
(c) Foreign exchange risk
The Group is exposed to various currencies, mainly united States Dollar (“uSD”), Thai Baht (“THB”), Japanese Yen (“JPY”), Euro (“Euro”), Sterling Pound (“SP”) and Hong Kong Dollar (“HKD”). Foreign currencies denominated assets and liabilities together with expected cash flows from highly probable purchases and sales give rise to foreign exchange exposures.
Foreign exchange exposures in transactional currencies other than functional currency of the Group are kept to an acceptable level.
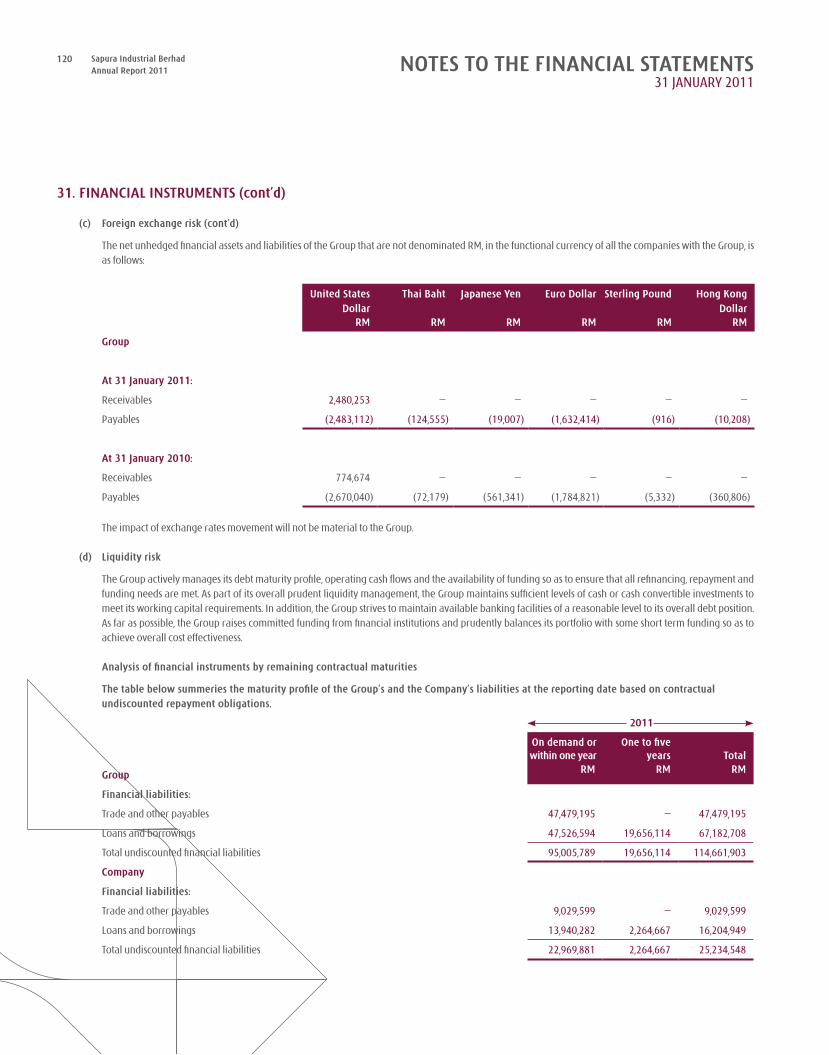
120 Sapura Industrial BerhadAnnual Report 2011 NOTES TO THE FINANCIAL STATEMENTS
31 JANuARY 2011
31. FINANCIAL INSTRUMENTS (cont’d)
(c) Foreign exchange risk (cont’d)
The net unhedged financial assets and liabilities of the Group that are not denominated RM, in the functional currency of all the companies with the Group, is as follows:
United States Dollar
Thai Baht Japanese Yen Euro Dollar Sterling Pound Hong Kong Dollar
RM RM RM RM RM RM
Group
At 31 January 2011:
Receivables 2,480,253 – – – – –
Payables (2,483,112) (124,555) (19,007) (1,632,414) (916) (10,208)
At 31 January 2010:
Receivables 774,674 – – – – –
Payables (2,670,040) (72,179) (561,341) (1,784,821) (5,332) (360,806)
The impact of exchange rates movement will not be material to the Group. (d) Liquidity risk
The Group actively manages its debt maturity profile, operating cash flows and the availability of funding so as to ensure that all refinancing, repayment and funding needs are met. As part of its overall prudent liquidity management, the Group maintains sufficient levels of cash or cash convertible investments to meet its working capital requirements. In addition, the Group strives to maintain available banking facilities of a reasonable level to its overall debt position. As far as possible, the Group raises committed funding from financial institutions and prudently balances its portfolio with some short term funding so as to achieve overall cost effectiveness.
Analysis of financial instruments by remaining contractual maturities
The table below summeries the maturity profile of the Group’s and the Company’s liabilities at the reporting date based on contractual undiscounted repayment obligations.
2011
On demand orwithin one year
One to fiveyears Total
Group RM RM RM
Financial liabilities:
Trade and other payables 47,479,195 – 47,479,195
Loans and borrowings 47,526,594 19,656,114 67,182,708
Total undiscounted financial liabilities 95,005,789 19,656,114 114,661,903
Company
Financial liabilities:
Trade and other payables 9,029,599 – 9,029,599
Loans and borrowings 13,940,282 2,264,667 16,204,949
Total undiscounted financial liabilities 22,969,881 2,264,667 25,234,548
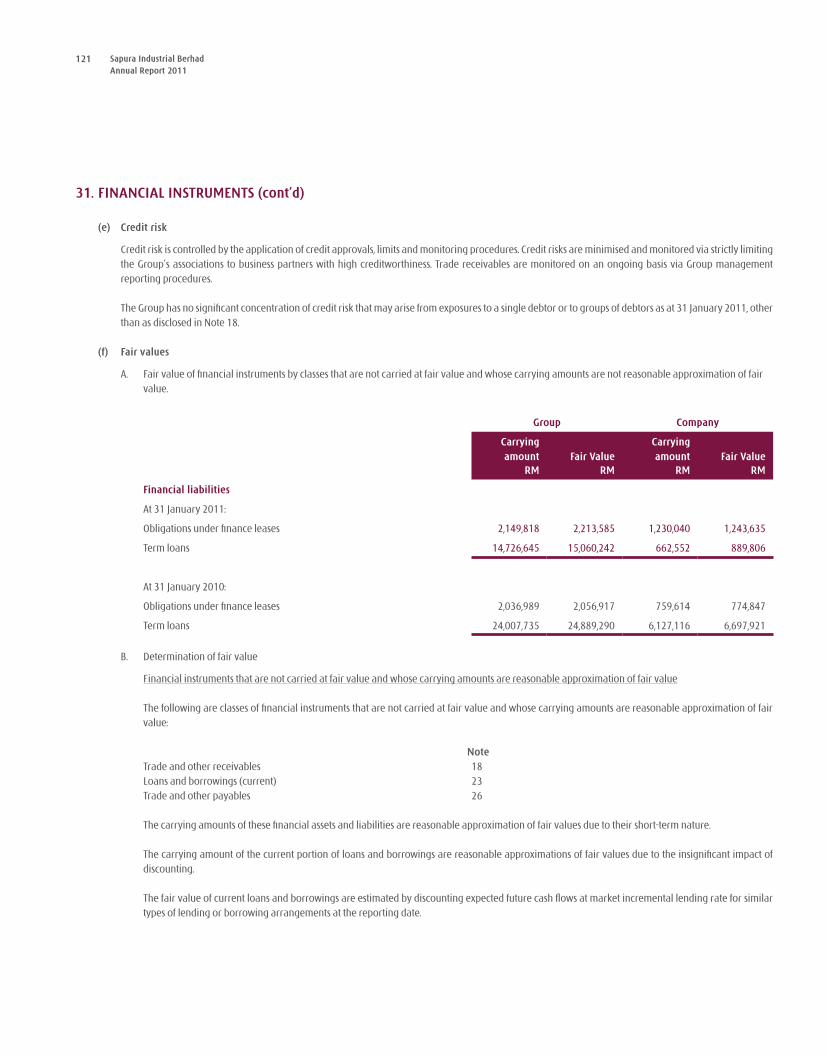
121 Sapura Industrial BerhadAnnual Report 2011
31. FINANCIAL INSTRUMENTS (cont’d)
(e) Credit risk
Credit risk is controlled by the application of credit approvals, limits and monitoring procedures. Credit risks are minimised and monitored via strictly limiting the Group’s associations to business partners with high creditworthiness. Trade receivables are monitored on an ongoing basis via Group management reporting procedures.
The Group has no significant concentration of credit risk that may arise from exposures to a single debtor or to groups of debtors as at 31 January 2011, other than as disclosed in Note 18.
(f) Fair values
A. Fair value of financial instruments by classes that are not carried at fair value and whose carrying amounts are not reasonable approximation of fair value.
Group Company
Carrying amount Fair Value
Carrying amount Fair Value
RM RM RM RM
Financial liabilities
At 31 January 2011:
Obligations under finance leases 2,149,818 2,213,585 1,230,040 1,243,635
Term loans 14,726,645 15,060,242 662,552 889,806
At 31 January 2010:
Obligations under finance leases 2,036,989 2,056,917 759,614 774,847
Term loans 24,007,735 24,889,290 6,127,116 6,697,921
B. Determination of fair value
Financial instruments that are not carried at fair value and whose carrying amounts are reasonable approximation of fair value
The following are classes of financial instruments that are not carried at fair value and whose carrying amounts are reasonable approximation of fair value:
Note Trade and other receivables 18 Loans and borrowings (current) 23 Trade and other payables 26
The carrying amounts of these financial assets and liabilities are reasonable approximation of fair values due to their short-term nature.
The carrying amount of the current portion of loans and borrowings are reasonable approximations of fair values due to the insignificant impact of discounting.
The fair value of current loans and borrowings are estimated by discounting expected future cash flows at market incremental lending rate for similar types of lending or borrowing arrangements at the reporting date.
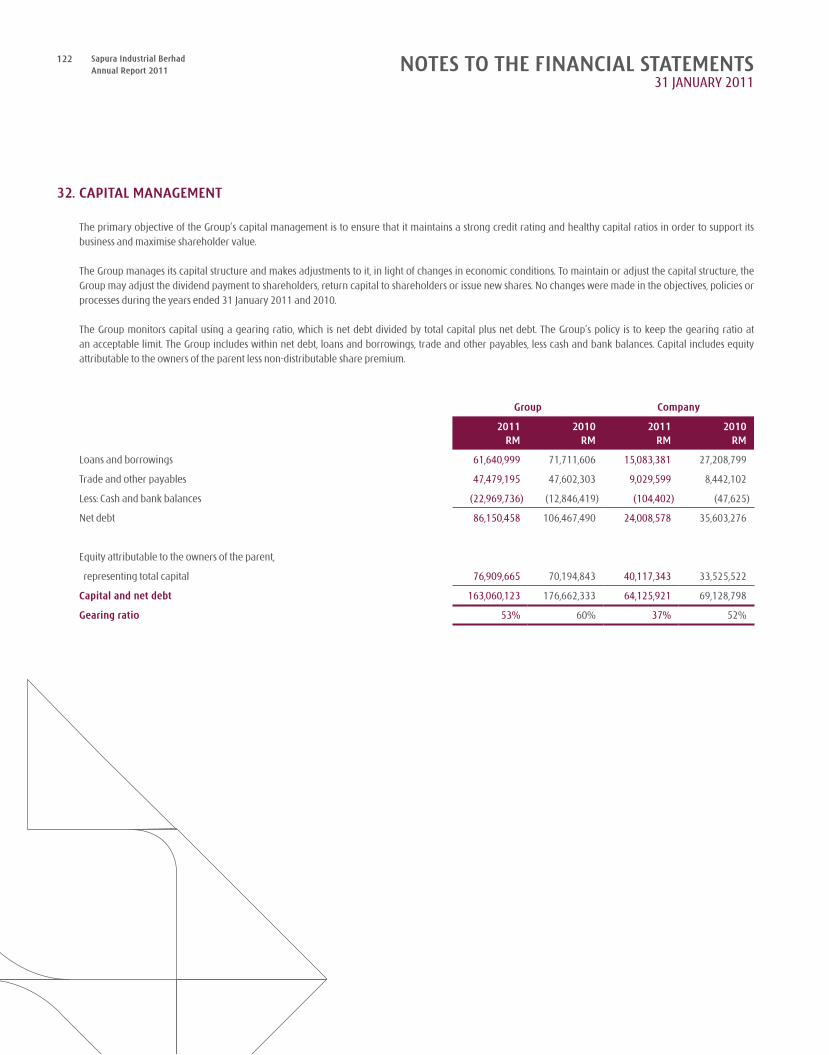
122 Sapura Industrial BerhadAnnual Report 2011 NOTES TO THE FINANCIAL STATEMENTS
31 JANuARY 2011
32. CAPITAL MANAGEMENT
The primary objective of the Group’s capital management is to ensure that it maintains a strong credit rating and healthy capital ratios in order to support its business and maximise shareholder value.
The Group manages its capital structure and makes adjustments to it, in light of changes in economic conditions. To maintain or adjust the capital structure, the Group may adjust the dividend payment to shareholders, return capital to shareholders or issue new shares. No changes were made in the objectives, policies or processes during the years ended 31 January 2011 and 2010.
The Group monitors capital using a gearing ratio, which is net debt divided by total capital plus net debt. The Group’s policy is to keep the gearing ratio at an acceptable limit. The Group includes within net debt, loans and borrowings, trade and other payables, less cash and bank balances. Capital includes equity attributable to the owners of the parent less non-distributable share premium.
Group Company
2011 2010 2011 2010RM RM RM RM
Loans and borrowings 61,640,999 71,711,606 15,083,381 27,208,799
Trade and other payables 47,479,195 47,602,303 9,029,599 8,442,102
Less: Cash and bank balances (22,969,736) (12,846,419) (104,402) (47,625)
Net debt 86,150,458 106,467,490 24,008,578 35,603,276
Equity attributable to the owners of the parent,
representing total capital 76,909,665 70,194,843 40,117,343 33,525,522
Capital and net debt 163,060,123 176,662,333 64,125,921 69,128,798
Gearing ratio 53% 60% 37% 52%
123 Sapura Industrial BerhadAnnual Report 2011
33. SEGMENT INFORMATION(a) Business segments:
The Group is organised into three major business segments:
(i) Manufacturing - the manufacture and supply of products for the automotive, electronics and electrical industries and manufacture of butt-weld fittings for oil and gas industries;
(ii) Investment holding - the holding of investments and provision of management services to subsidiaries; and
(iii) Others - trading of autoparts in retail and after sales market, providing computer aided design and manufacture of sub-systems and systems for applications in production and testing and other dormant companies.
(b) Geographical segments:
The Group’s operations are carried out solely in Malaysia.
(c) Allocation basis
Segment results, assets and liabilities include items directly attributable to a segment as well as those that can be allocated on a reasonable basis. unallocated items comprise mainly corporate assets, liabilities and expenses.
Transfer prices between business segments are set on an arm’s length basis in a manner similar to transactions with third parties. Segment revenue, expenses and results include transfers between business segments. These transfers are eliminated on consolidation.
(d) Information on a major customers
Included in the manufacturing segment are two major customers contributing RM193,991,056 and RM68,548,841 of revenue in the current financial year.
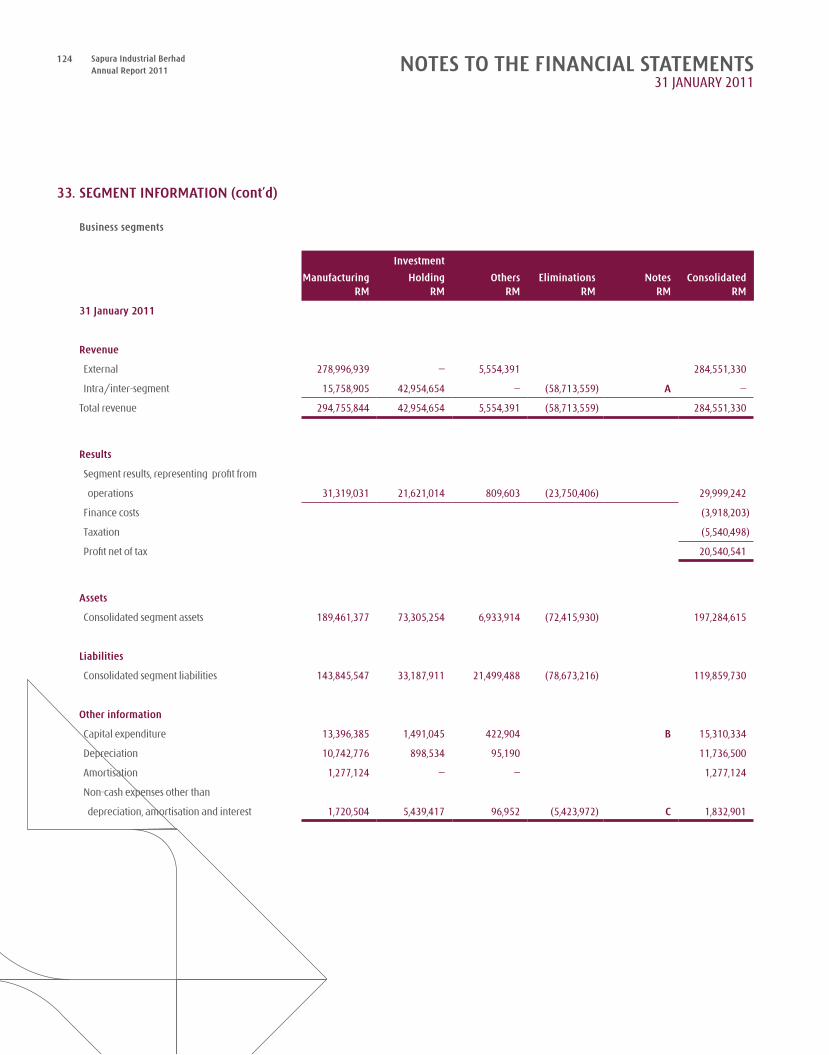
124 Sapura Industrial BerhadAnnual Report 2011 NOTES TO THE FINANCIAL STATEMENTS
31 JANuARY 2011
33. SEGMENT INFORMATION (cont’d)
Business segments
Manufacturing
Investment
Holding Others Eliminations Notes ConsolidatedRM RM RM RM RM RM
31 January 2011
Revenue
External 278,996,939 – 5,554,391 284,551,330
Intra/inter-segment 15,758,905 42,954,654 – (58,713,559) A –
Total revenue 294,755,844 42,954,654 5,554,391 (58,713,559) 284,551,330
Results
Segment results, representing profit from
operations 31,319,031 21,621,014 809,603 (23,750,406) 29,999,242
Finance costs (3,918,203)
Taxation (5,540,498)
Profit net of tax 20,540,541
Assets
Consolidated segment assets 189,461,377 73,305,254 6,933,914 (72,415,930) 197,284,615
Liabilities
Consolidated segment liabilities 143,845,547 33,187,911 21,499,488 (78,673,216) 119,859,730
Other information
Capital expenditure 13,396,385 1,491,045 422,904 B 15,310,334
Depreciation 10,742,776 898,534 95,190 11,736,500
Amortisation 1,277,124 – – 1,277,124
Non-cash expenses other than
depreciation, amortisation and interest 1,720,504 5,439,417 96,952 (5,423,972) C 1,832,901
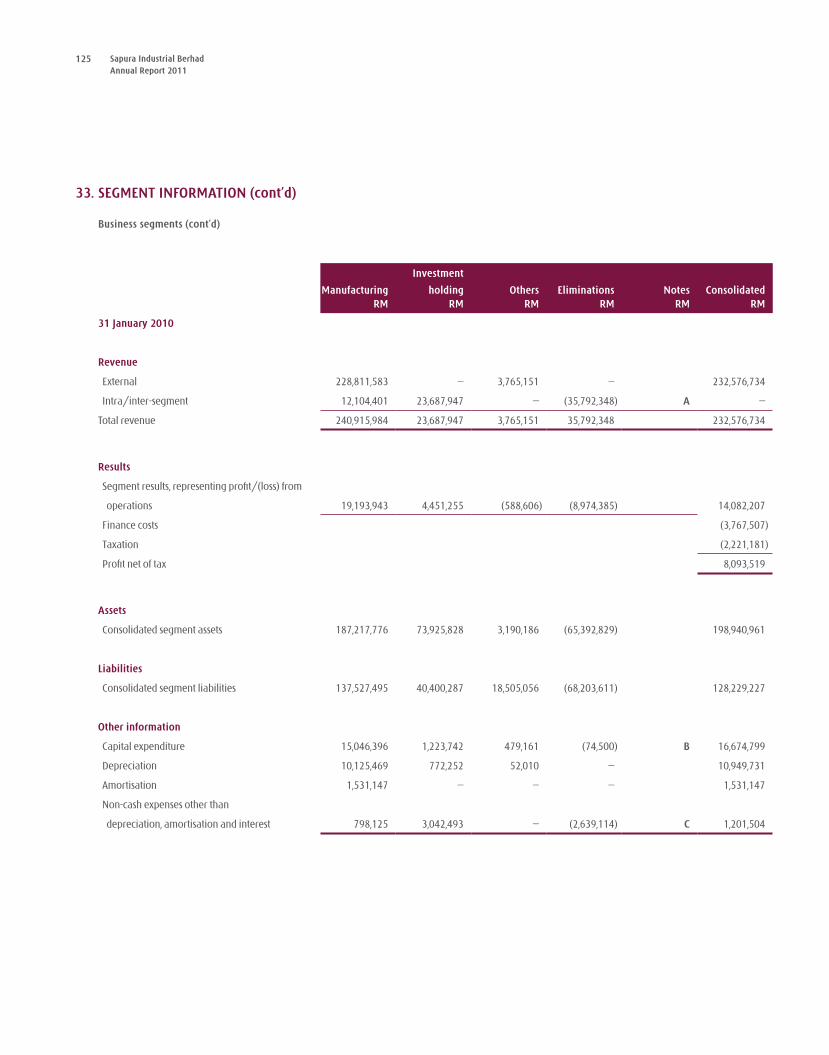
125 Sapura Industrial BerhadAnnual Report 2011
33. SEGMENT INFORMATION (cont’d)
Business segments (cont’d)
Manufacturing
Investment
holding Others Eliminations Notes ConsolidatedRM RM RM RM RM RM
31 January 2010
Revenue
External 228,811,583 – 3,765,151 – 232,576,734
Intra/inter-segment 12,104,401 23,687,947 – (35,792,348) A –
Total revenue 240,915,984 23,687,947 3,765,151 35,792,348 232,576,734
Results
Segment results, representing profit/(loss) from
operations 19,193,943 4,451,255 (588,606) (8,974,385) 14,082,207
Finance costs (3,767,507)
Taxation (2,221,181)
Profit net of tax 8,093,519
Assets
Consolidated segment assets 187,217,776 73,925,828 3,190,186 (65,392,829) 198,940,961
Liabilities
Consolidated segment liabilities 137,527,495 40,400,287 18,505,056 (68,203,611) 128,229,227
Other information
Capital expenditure 15,046,396 1,223,742 479,161 (74,500) B 16,674,799
Depreciation 10,125,469 772,252 52,010 – 10,949,731
Amortisation 1,531,147 – – – 1,531,147
Non-cash expenses other than
depreciation, amortisation and interest 798,125 3,042,493 – (2,639,114) C 1,201,504
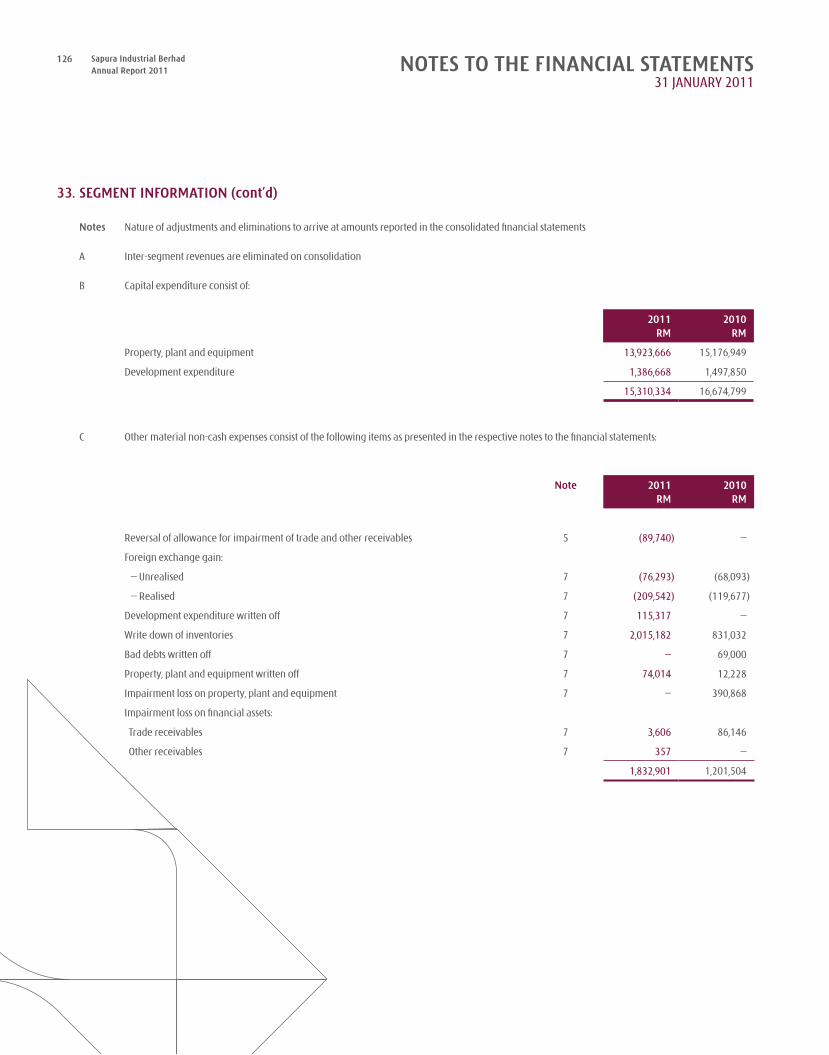
126 Sapura Industrial BerhadAnnual Report 2011 NOTES TO THE FINANCIAL STATEMENTS
31 JANuARY 2011
33. SEGMENT INFORMATION (cont’d)
Notes Nature of adjustments and eliminations to arrive at amounts reported in the consolidated financial statements
A Inter-segment revenues are eliminated on consolidation
B Capital expenditure consist of:
2011 2010 RM RM
Property, plant and equipment 13,923,666 15,176,949
Development expenditure 1,386,668 1,497,850
15,310,334 16,674,799
C Other material non-cash expenses consist of the following items as presented in the respective notes to the financial statements:
Note 2011 2010 RM RM
Reversal of allowance for impairment of trade and other receivables 5 (89,740) –
Foreign exchange gain:
– unrealised 7 (76,293) (68,093)
– Realised 7 (209,542) (119,677)
Development expenditure written off 7 115,317 –
Write down of inventories 7 2,015,182 831,032
Bad debts written off 7 – 69,000
Property, plant and equipment written off 7 74,014 12,228
Impairment loss on property, plant and equipment 7 – 390,868
Impairment loss on financial assets:
Trade receivables 7 3,606 86,146
Other receivables 7 357 –
1,832,901 1,201,504
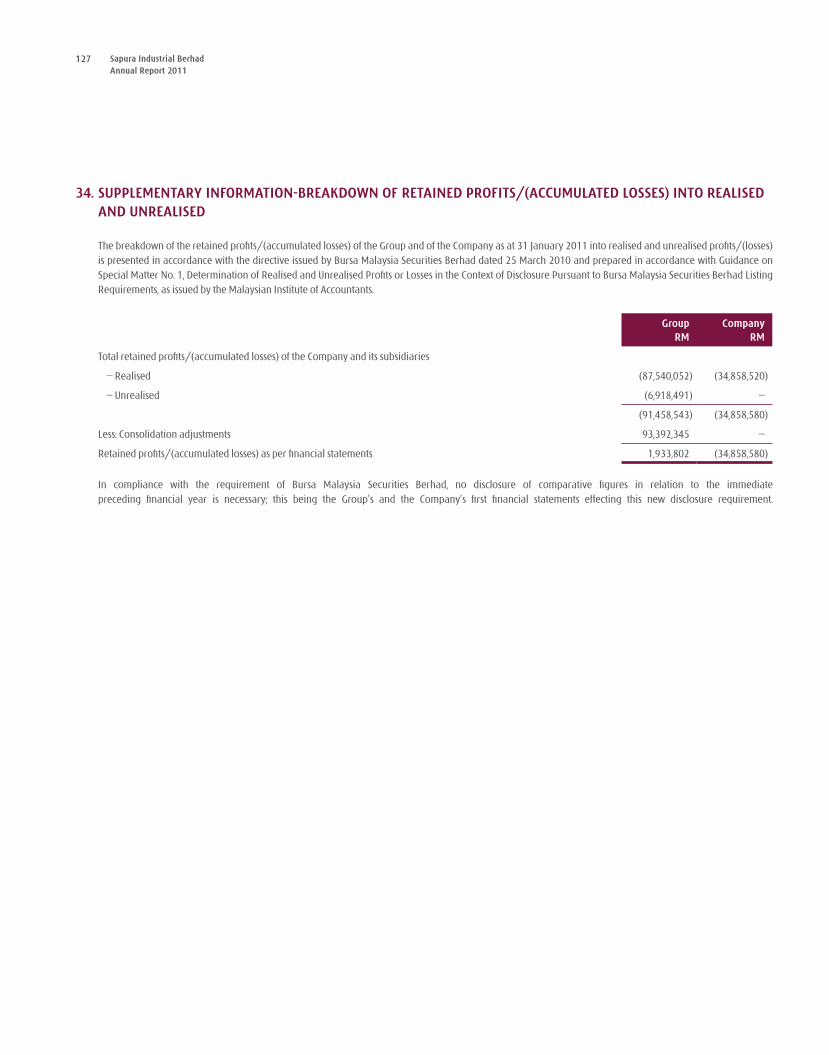
127 Sapura Industrial BerhadAnnual Report 2011
34. SUPPLEMENTARY INFORMATION-BREAKDOWN OF RETAINED PROFITS/(ACCUMULATED LOSSES) INTO REALISED AND UNREALISED
The breakdown of the retained profits/(accumulated losses) of the Group and of the Company as at 31 January 2011 into realised and unrealised profits/(losses) is presented in accordance with the directive issued by Bursa Malaysia Securities Berhad dated 25 March 2010 and prepared in accordance with Guidance on Special Matter No. 1, Determination of Realised and unrealised Profits or Losses in the Context of Disclosure Pursuant to Bursa Malaysia Securities Berhad Listing Requirements, as issued by the Malaysian Institute of Accountants.
Group Company RM RM
Total retained profits/(accumulated losses) of the Company and its subsidiaries
– Realised (87,540,052) (34,858,520)
– unrealised (6,918,491) –
(91,458,543) (34,858,580)
Less: Consolidation adjustments 93,392,345 –
Retained profits/(accumulated losses) as per financial statements 1,933,802 (34,858,580)
In compliance with the requirement of Bursa Malaysia Securities Berhad, no disclosure of comparative figures in relation to the immediate preceding financial year is necessary; this being the Group’s and the Company’s first financial statements effecting this new disclosure requirement.
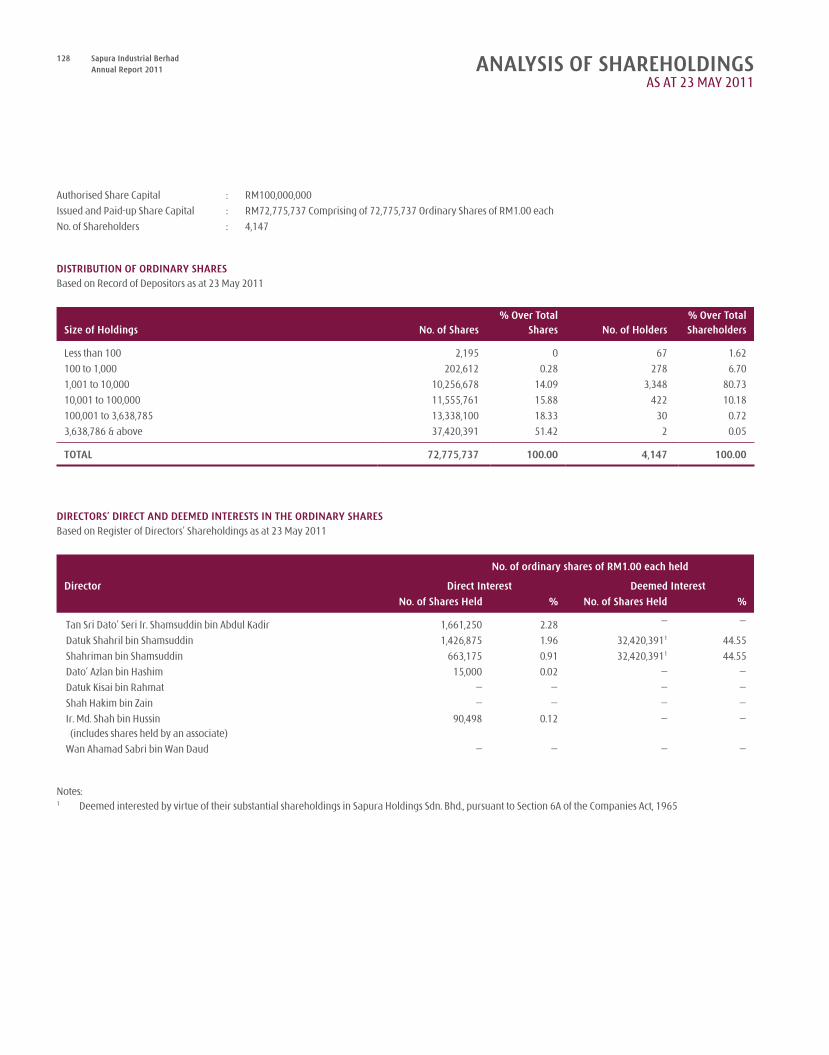
128 Sapura Industrial BerhadAnnual Report 2011 ANALYSIS OF SHAREHOLDINGS
AS AT 23 MAY 2011
Authorised Share Capital : RM100,000,000
Issued and Paid-up Share Capital : RM72,775,737 Comprising of 72,775,737 Ordinary Shares of RM1.00 each
No. of Shareholders : 4,147
DISTRIBUTION OF ORDINARY SHARESBased on Record of Depositors as at 23 May 2011
Size of Holdings No. of Shares% Over Total
Shares No. of Holders% Over TotalShareholders
Less than 100 2,195 0 67 1.62
100 to 1,000 202,612 0.28 278 6.70
1,001 to 10,000 10,256,678 14.09 3,348 80.73
10,001 to 100,000 11,555,761 15.88 422 10.18
100,001 to 3,638,785 13,338,100 18.33 30 0.72
3,638,786 & above 37,420,391 51.42 2 0.05
TOTAL 72,775,737 100.00 4,147 100.00
DIRECTORS’ DIRECT AND DEEMED INTERESTS IN THE ORDINARY SHARESBased on Register of Directors’ Shareholdings as at 23 May 2011
No. of ordinary shares of RM1.00 each held
Director Direct Interest Deemed Interest
No. of Shares Held % No. of Shares Held %
Tan Sri Dato’ Seri Ir. Shamsuddin bin Abdul Kadir 1,661,250 2.28 – –
Datuk Shahril bin Shamsuddin 1,426,875 1.96 32,420,3911 44.55
Shahriman bin Shamsuddin 663,175 0.91 32,420,3911 44.55
Dato’ Azlan bin Hashim 15,000 0.02 – –
Datuk Kisai bin Rahmat – – – –
Shah Hakim bin Zain – – – –
Ir. Md. Shah bin Hussin (includes shares held by an associate)
90,498 0.12 – –
Wan Ahamad Sabri bin Wan Daud – – – –
Notes:1 Deemed interested by virtue of their substantial shareholdings in Sapura Holdings Sdn. Bhd., pursuant to Section 6A of the Companies Act, 1965
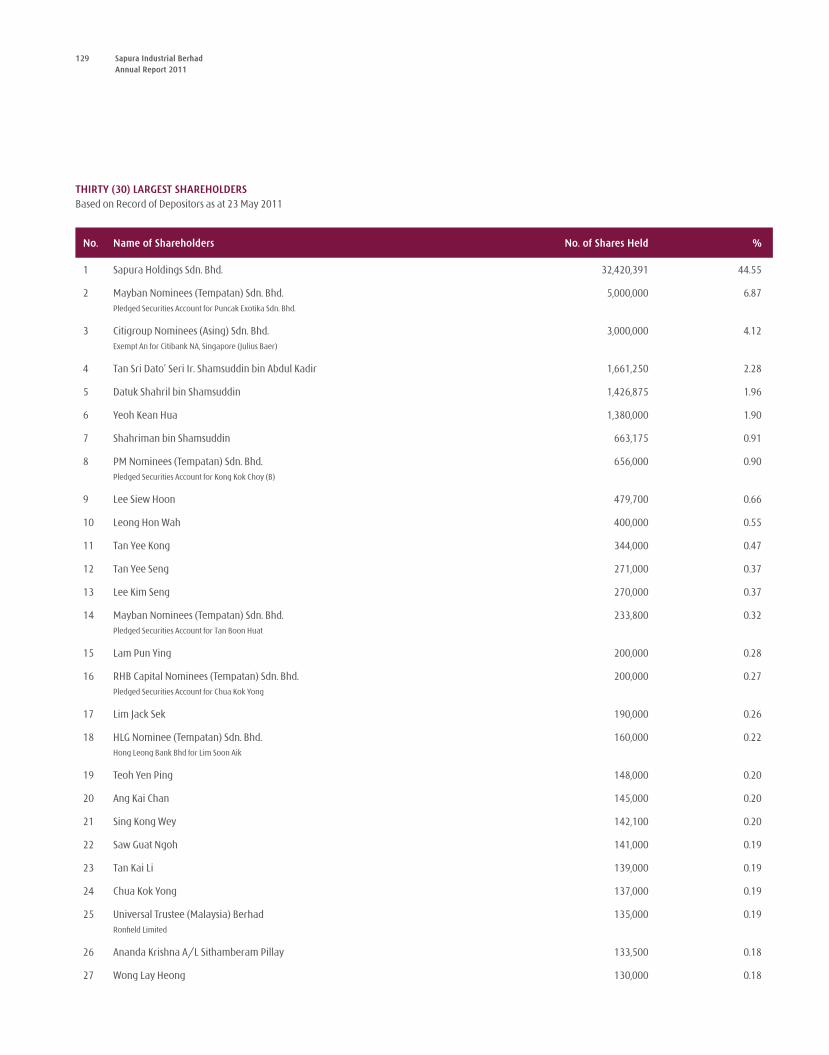
129 Sapura Industrial BerhadAnnual Report 2011
THIRTY (30) LARGEST SHAREHOLDERSBased on Record of Depositors as at 23 May 2011
No. Name of Shareholders No. of Shares Held %
1 Sapura Holdings Sdn. Bhd. 32,420,391 44.55
2 Mayban Nominees (Tempatan) Sdn. Bhd.Pledged Securities Account for Puncak Exotika Sdn. Bhd.
5,000,000 6.87
3 Citigroup Nominees (Asing) Sdn. Bhd.Exempt An for Citibank NA, Singapore (Julius Baer)
3,000,000 4.12
4 Tan Sri Dato’ Seri Ir. Shamsuddin bin Abdul Kadir 1,661,250 2.28
5 Datuk Shahril bin Shamsuddin 1,426,875 1.96
6 Yeoh Kean Hua 1,380,000 1.90
7 Shahriman bin Shamsuddin 663,175 0.91
8 PM Nominees (Tempatan) Sdn. Bhd.Pledged Securities Account for Kong Kok Choy (B)
656,000 0.90
9 Lee Siew Hoon 479,700 0.66
10 Leong Hon Wah 400,000 0.55
11 Tan Yee Kong 344,000 0.47
12 Tan Yee Seng 271,000 0.37
13 Lee Kim Seng 270,000 0.37
14 Mayban Nominees (Tempatan) Sdn. Bhd.Pledged Securities Account for Tan Boon Huat
233,800 0.32
15 Lam Pun Ying 200,000 0.28
16 RHB Capital Nominees (Tempatan) Sdn. Bhd.Pledged Securities Account for Chua Kok Yong
200,000 0.27
17 Lim Jack Sek 190,000 0.26
18 HLG Nominee (Tempatan) Sdn. Bhd.Hong Leong Bank Bhd for Lim Soon Aik
160,000 0.22
19 Teoh Yen Ping 148,000 0.20
20 Ang Kai Chan 145,000 0.20
21 Sing Kong Wey 142,100 0.20
22 Saw Guat Ngoh 141,000 0.19
23 Tan Kai Li 139,000 0.19
24 Chua Kok Yong 137,000 0.19
25 universal Trustee (Malaysia) BerhadRonfield Limited
135,000 0.19
26 Ananda Krishna A/L Sithamberam Pillay 133,500 0.18
27 Wong Lay Heong 130,000 0.18
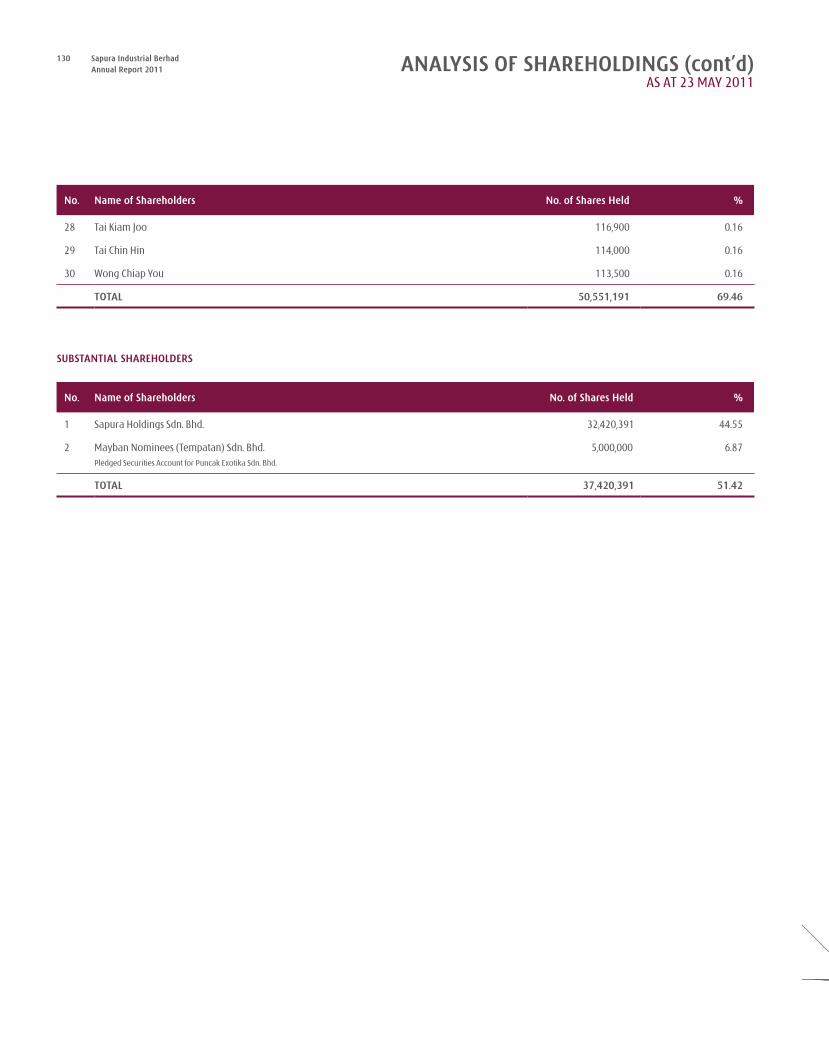
130 Sapura Industrial BerhadAnnual Report 2011
No. Name of Shareholders No. of Shares Held %
28 Tai Kiam Joo 116,900 0.16
29 Tai Chin Hin 114,000 0.16
30 Wong Chiap You 113,500 0.16
TOTAL 50,551,191 69.46
SUBSTANTIAL SHAREHOLDERS
No. Name of Shareholders No. of Shares Held %
1 Sapura Holdings Sdn. Bhd. 32,420,391 44.55
2 Mayban Nominees (Tempatan) Sdn. Bhd.Pledged Securities Account for Puncak Exotika Sdn. Bhd.
5,000,000 6.87
TOTAL 37,420,391 51.42
ANALYSIS OF SHAREHOLDINGS (cont’d)AS AT 23 MAY 2011
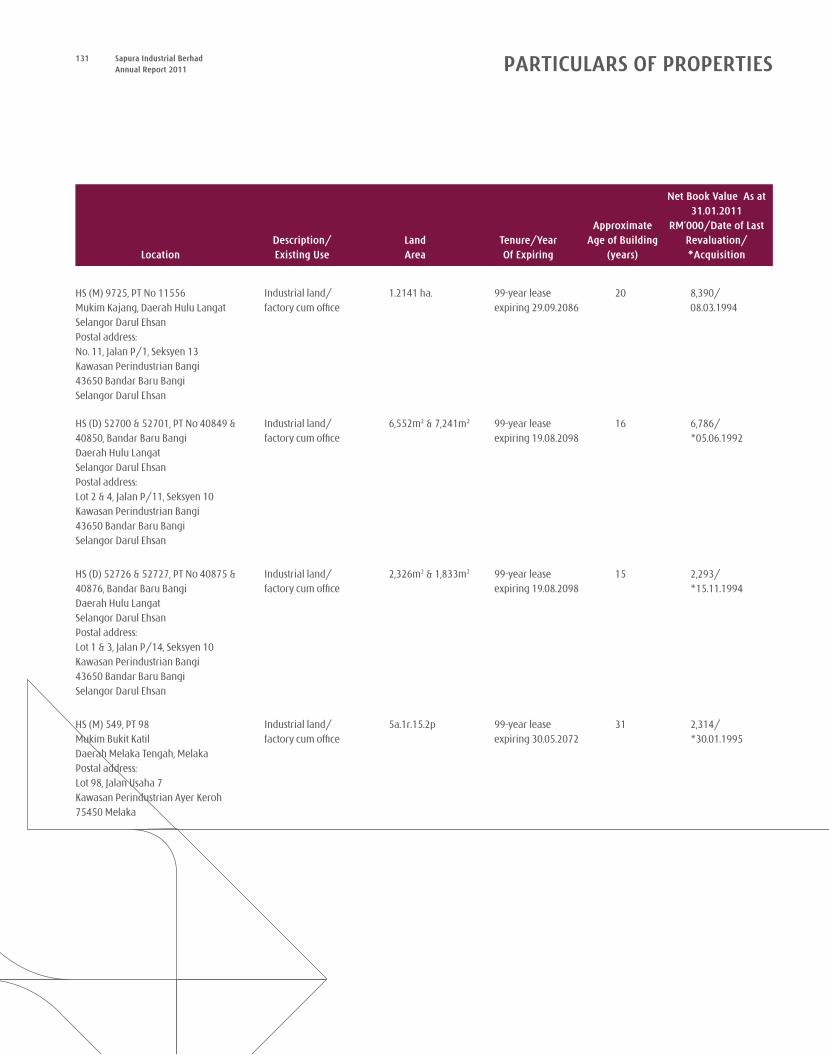
131 Sapura Industrial BerhadAnnual Report 2011 PARTICULARS OF PROPERTIES
LocationDescription/Existing Use
LandArea
Tenure/Year Of Expiring
ApproximateAge of Building
(years)
Net Book Value As at 31.01.2011
RM’000/Date of Last Revaluation/*Acquisition
HS (M) 9725, PT No 11556Mukim Kajang, Daerah Hulu Langat Selangor Darul EhsanPostal address: No. 11, Jalan P/1, Seksyen 13 Kawasan Perindustrian Bangi43650 Bandar Baru Bangi Selangor Darul Ehsan
Industrial land/factory cum office
1.2141 ha. 99-year lease expiring 29.09.2086
20 8,390/08.03.1994
HS (D) 52700 & 52701, PT No 40849 & 40850, Bandar Baru BangiDaerah Hulu Langat Selangor Darul EhsanPostal address: Lot 2 & 4, Jalan P/11, Seksyen 10 Kawasan Perindustrian Bangi43650 Bandar Baru Bangi Selangor Darul Ehsan
Industrial land/factory cum office
6,552m2 & 7,241m2 99-year lease expiring 19.08.2098
16 6,786/ *05.06.1992
HS (D) 52726 & 52727, PT No 40875 & 40876, Bandar Baru Bangi Daerah Hulu LangatSelangor Darul EhsanPostal address: Lot 1 & 3, Jalan P/14, Seksyen 10Kawasan Perindustrian Bangi43650 Bandar Baru BangiSelangor Darul Ehsan
Industrial land/factory cum office
2,326m2 & 1,833m2 99-year lease expiring 19.08.2098
15 2,293/ *15.11.1994
HS (M) 549, PT 98Mukim Bukit KatilDaerah Melaka Tengah, Melaka Postal address: Lot 98, Jalan usaha 7Kawasan Perindustrian Ayer Keroh 75450 Melaka
Industrial land/factory cum office
5a.1r.15.2p 99-year lease expiring 30.05.2072
31 2,314/ *30.01.1995
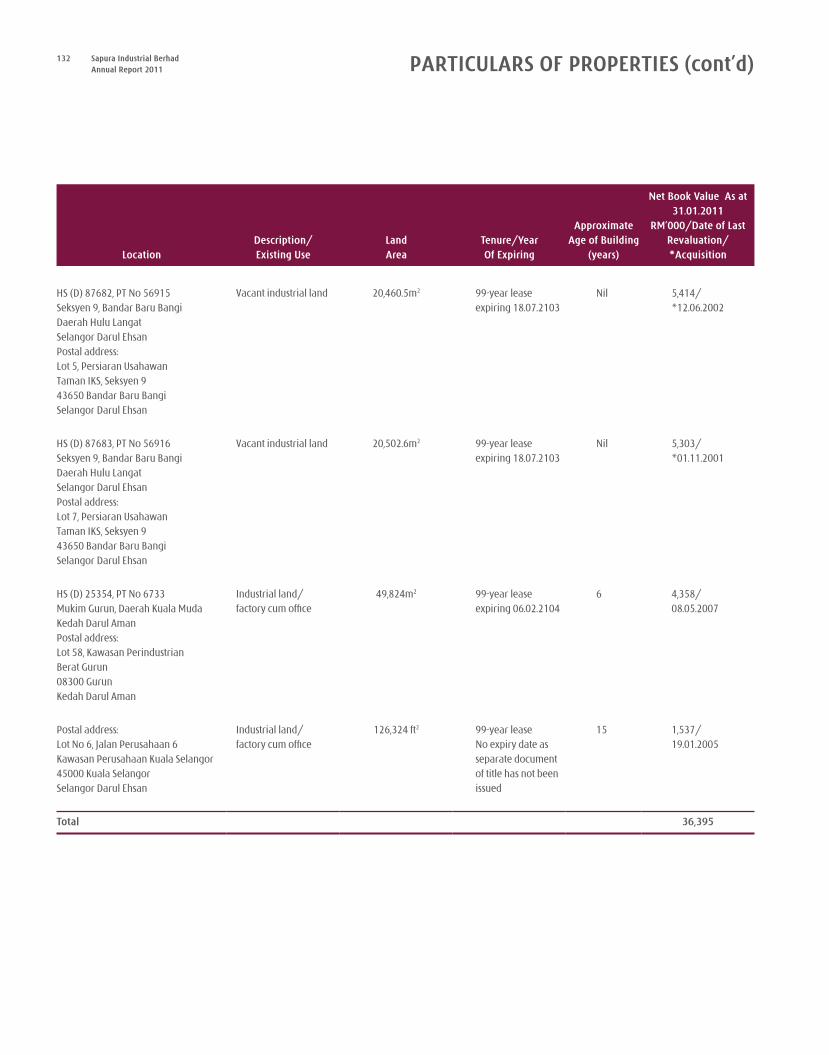
132 Sapura Industrial BerhadAnnual Report 2011
LocationDescription/Existing Use
LandArea
Tenure/Year Of Expiring
ApproximateAge of Building
(years)
Net Book Value As at 31.01.2011
RM’000/Date of Last Revaluation/*Acquisition
HS (D) 87682, PT No 56915 Seksyen 9, Bandar Baru Bangi Daerah Hulu LangatSelangor Darul EhsanPostal address:Lot 5, Persiaran usahawanTaman IKS, Seksyen 943650 Bandar Baru BangiSelangor Darul Ehsan
Vacant industrial land 20,460.5m2 99-year lease expiring 18.07.2103
Nil 5,414/*12.06.2002
HS (D) 87683, PT No 56916 Seksyen 9, Bandar Baru Bangi Daerah Hulu LangatSelangor Darul EhsanPostal address:Lot 7, Persiaran usahawanTaman IKS, Seksyen 943650 Bandar Baru BangiSelangor Darul Ehsan
Vacant industrial land 20,502.6m2 99-year lease expiring 18.07.2103
Nil 5,303/*01.11.2001
HS (D) 25354, PT No 6733Mukim Gurun, Daerah Kuala Muda Kedah Darul AmanPostal address: Lot 58, Kawasan PerindustrianBerat Gurun08300 Gurun Kedah Darul Aman
Industrial land/factory cum office
49,824m2 99-year lease expiring 06.02.2104
6 4,358/08.05.2007
Postal address:Lot No 6, Jalan Perusahaan 6 Kawasan Perusahaan Kuala Selangor 45000 Kuala SelangorSelangor Darul Ehsan
Industrial land/factory cum office
126,324 ft2 99-year lease No expiry date as separate document of title has not been issued
15 1,537/19.01.2005
Total 36,395
PARTICULARS OF PROPERTIES (cont’d)
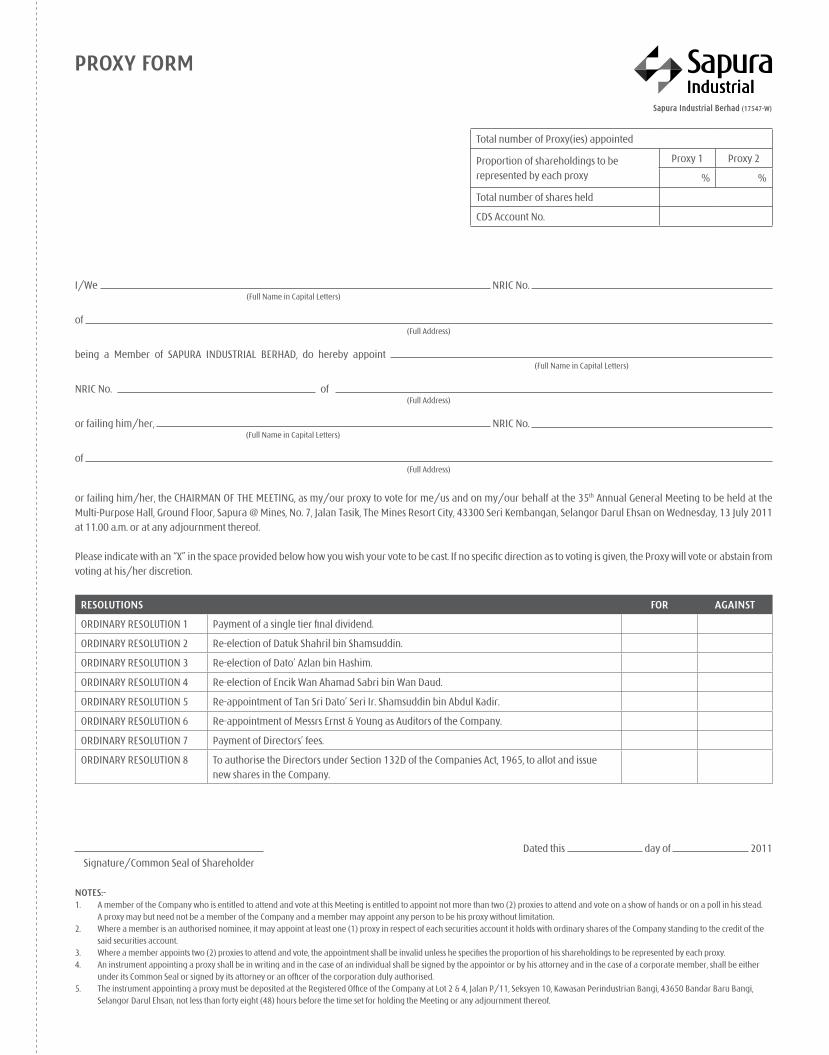
PROXY FORM
Total number of Proxy(ies) appointed
Proportion of shareholdings to be represented by each proxy
Proxy 1 Proxy 2
% %
Total number of shares held
CDS Account No.
I/We NRIC No. (Full Name in Capital Letters)
of (Full Address)
being a Member of SAPuRA INDuSTRIAL BERHAD, do hereby appoint (Full Name in Capital Letters)
NRIC No. of (Full Address)
or failing him/her, NRIC No. (Full Name in Capital Letters)
of (Full Address)
or failing him/her, the CHAIRMAN OF THE MEETING, as my/our proxy to vote for me/us and on my/our behalf at the 35th Annual General Meeting to be held at the Multi-Purpose Hall, Ground Floor, Sapura @ Mines, No. 7, Jalan Tasik, The Mines Resort City, 43300 Seri Kembangan, Selangor Darul Ehsan on Wednesday, 13 July 2011 at 11.00 a.m. or at any adjournment thereof.
Please indicate with an “x” in the space provided below how you wish your vote to be cast. If no specific direction as to voting is given, the Proxy will vote or abstain from voting at his/her discretion.
RESOLUTIONS FOR AGAINST
ORDINARY RESOLuTION 1 Payment of a single tier final dividend.
ORDINARY RESOLuTION 2 Re-election of Datuk Shahril bin Shamsuddin.
ORDINARY RESOLuTION 3 Re-election of Dato’ Azlan bin Hashim.
ORDINARY RESOLuTION 4 Re-election of Encik Wan Ahamad Sabri bin Wan Daud.
ORDINARY RESOLuTION 5 Re-appointment of Tan Sri Dato’ Seri Ir. Shamsuddin bin Abdul Kadir.
ORDINARY RESOLuTION 6 Re-appointment of Messrs Ernst & Young as Auditors of the Company.
ORDINARY RESOLuTION 7 Payment of Directors’ fees.
ORDINARY RESOLuTION 8 To authorise the Directors under Section 132D of the Companies Act, 1965, to allot and issue new shares in the Company.
Dated this day of 2011 Signature/Common Seal of Shareholder
NOTES:-1. A member of the Company who is entitled to attend and vote at this Meeting is entitled to appoint not more than two (2) proxies to attend and vote on a show of hands or on a poll in his stead. A proxy may but need not be a member of the Company and a member may appoint any person to be his proxy without limitation.2. Where a member is an authorised nominee, it may appoint at least one (1) proxy in respect of each securities account it holds with ordinary shares of the Company standing to the credit of the
said securities account.3. Where a member appoints two (2) proxies to attend and vote, the appointment shall be invalid unless he specifies the proportion of his shareholdings to be represented by each proxy.4. An instrument appointing a proxy shall be in writing and in the case of an individual shall be signed by the appointor or by his attorney and in the case of a corporate member, shall be either
under its Common Seal or signed by its attorney or an officer of the corporation duly authorised.5. The instrument appointing a proxy must be deposited at the Registered Office of the Company at Lot 2 & 4, Jalan P/11, Seksyen 10, Kawasan Perindustrian Bangi, 43650 Bandar Baru Bangi,
Selangor Darul Ehsan, not less than forty eight (48) hours before the time set for holding the Meeting or any adjournment thereof.
Sapura Industrial Berhad (17547-W)Sapura Industrial Berhad (17547-W)
(Incorporated in Malaysia)
The Company Secretary
Sapura Industrial Berhad (17547-W)Lot 2 & 4, Jalan P/11, Seksyen 10
Kawasan Perindustrian Bangi43650 Bandar Baru Bangi
Selangor Darul Ehsan
FOLD HERE
FOLD HERE
STAMP