activity levels of po in the coastal area of kapar...
TRANSCRIPT
Sains Malaysiana 41(7)(2012): 815–828
Activity Levels of 210Po in the Coastal Area of Kapar, Malaysia, Close to a Coal-Fired Power Plant
(Aras Aktiviti 210Po di Kawasan Pantai Kapar, Malaysia yang Berhampiran Stesen Jana Elektrik Arang Batu)
ASNOR AZRIN SABUTI & CHE ABD RAHIM MOHAMED*
ABSTRACT
The activity concentration of 210Po from six different samples consisting of raw charcoal, surface sediment, rainwater (suspended solids (SSrw) and dissolved phase (Drw) and estuarine water (suspended solids (SSew) and dissolved phase (Dew)), were analyzed. The activity concentration of 210Po in solid samples was between 7.63 ± 0.67 and 744.28 ± 21.12 Bqkg-1 and in dissolved samples varied between 0.34 ± 0.03 and 86.33 ± 6.51 mBqL-1. On average, 210Po activity in SSrw sample was the highest, at nearly three times its original form (charcoal). SSew and surface sediment samples were similarly distributed between 15th March and 1st August samplings, but were relatively lower than charcoal and SSrw samples. The natural meteorological variability also enhanced 210Po distribution and dispersion to a few kilometers from the coal-fired power plant.
Keywords: 210Po; coal-fired power plant; meteorological variability; solid and dissolved samples
ABSTRAK
Kepekatan aktiviti 210Po daripada enam sampel yang berbeza merangkumi arang batu mentah, permukaan sedimen, air hujan (pepejal terampai (SSrw) dan fasa terlarut (Drw)) dan air estuari (pepejal terampai (SSew) dan fasa terlarut (Dew)) telah dianalisis di dalam kajian ini. Kepekatan aktiviti 210Po di dalam sampel pepejal berada dalam julat 7.63 ± 0.67 dan 744.28 ± 21.12 Bqkg-1. Manakala pada sampel terlarut pula beubah-ubah di antara 0.34 ± 0.03 dan 86.33 ± 6.51 mBqL-1. Secara purata, aktiviti 210Po di dalam sampel SSrw adalah yang tertinggi, hampir tiga kali ganda daripada bentuk asalnya (arang batu). Sampel SSew dan permukaan sedimen mempunyai taburan yang sekata di antara persampelan antara 15 Mac dan 1 Ogos, namun secara relatifnya adalah rendah berbanding sampel-sampel arang batu dan SSew. Pengedaran dan penumpukan juga berbeza-beza bergantung kepada variasi iklim di lokasi kajian. Kajian ini menunjukkan penumpukan 210Po di kawasan kajian kelihatan tinggi semasa monsun barat daya berbanding monsun timur laut, yang disebabkan oleh keadaan meteorologi masing-masing. Seterusnya, perubahan meteorologi secara semula jadi juga meningkatkan taburan dan edaran 210Po kepada beberapa kilometer daripada stesen janaelektrik arang batu tersebut.
Kata kunci: 210Po; perubahan meteorologi; polonium; sampel pepejal dan terlarut; stesen janakuasa arang batu
INTRODUCTION
210Po is a non-conservative radionuclide with a physical half life of 138.4 days. This radionuclide is also an intermediate member of the naturally occurring 238U decay series and is recognized as a tracer for natural processes in the atmosphere and marine environment (Al-Masri et al. 2006; Skwarzec & Fabisiak 2007). 210Po is a particle-reactive radionuclide and tends to associate with particulate phases (Yang & Lin 1992). It also has a potential use as a tracer of particle/water transport and particulate scavenging (Swarzenski et al. 1999). In the marine environment, the radioactive disequilibrium of 210Po and 210Pb is likely to be the result of the preferential uptake of polonium by planktonic organisms and other biogenic particulate material (Skwarzec & Fabisiak 2007). Therefore, the behavior of 210Po is closely associated
with zooplankton metabolic activity and the density of zooplankton in surface waters (Skwarzek et al. 2003; Tateda et al. 2003). Research on radioactivity in the environment has been of great importance over the last decades. This research itself is very significant as a scientific basis for legislative measures, which in turn leads to a reduction in the industrial and agricultural impact of radioactivity on the environment. The effect of radioactive exposure on humans has been well-documented in the chemistry composition. The enhancement of radioactivity can be contributed to by both natural and human activities (anthropogenic). Natural processes are mainly derived from cosmic-ray interactions and radioactive decay of radon products, which emanate from continental surfaces into the atmosphere (Baskaran & Shaw 2001; Papastefanou 2006; Poet et al. 1972). In
816
contrast, the human threats originate from a multitude of sources, such as: mining, waste management problems, an increase in the number of power plants, underground testing of bombs and nuclear weapons. All of these are very harmful to mankind (Flues et al. 2002; Garland & Wakeford 2007; Papastefanou 1996). One of the sources of radioactivity and non-combustible trace elements in the environment originates from the use of coal as a fuel source for the generation of electricity. This is the reason why radionuclides are concentrated in the ash and dispersed to the atmosphere and surrounding environment. The U.S Geological Survey (USGS) noted the radioactive significance of coal and fly ash in 1997 (USGS 1997). Based on Beck and Miller’s (1980) report, the mean ash content in US coal was found to contain the specific activity of natural radionuclide to an average of 7.5 times of the coal, that is, 167 Bqkg-1 for 238U and each of its decay products (including 210Po). In fact, each of its coal-fired power plants managed to enhance the natural radioactivity to an average of five to seven times (Beck & Miller 1980; Flues et al. 2002; Papastefanou 1996). Previous reports also concluded that some of the more volatile trace elements are preferentially re-condensed in smaller particles (Beck & Miller 1980; Swarzenski et al. 1999). The enrichment of radioactivity was dominated in fly ash relative to bottom ash, and particularly in the smaller fly ash particles, which are less efficiently removed by the emission control equipment. The radioactivity emissions enhancement from coal-fired power plants has become a major issue among environmental scientists over the past decades. The research previously undertaken monitored the quantity fly ash, in relation to radioactivity, released into the atmosphere, where the efficiency of the plant’s emissions control equipment is noted as a variable influential factor (electrostatic precipitators). Fundamentally, much research has been conducted to assess the total amount of ash (mainly bottom ash) generated by the plants, which was dependent on the type and amount of coal burned. Beck and Miller (1980) concluded that a typical modern 1000 MW plant would consume approximately 2.3 × 10⁹ kg year-1 of coal and produce around 3 × 10⁸ kg year-1 of ash. In addition, Papastefanou (1996) also found that about 11 672 MBq of 226Ra per year are discharged into the environment from four different coal-fired power plants in Greece, totaling 3.62 GW of electrical energy. In order to address the above questions and predict the mobility of radioactive elements during the coal fuel-cycle, it is necessary to determine the concentration, distribution and form of radioactive elements in both coal and fly ash. The purpose of this study was to determine the changes of 210Po activity in the Kapar coastal area which is located in close proximity to a coal-fired power plant. It should be noted that the study of radioactivity monitoring from an industrial or power plant in a coastal area has rarely been undertaken in Malaysia.
METHODS
SITE DESCRIPTION
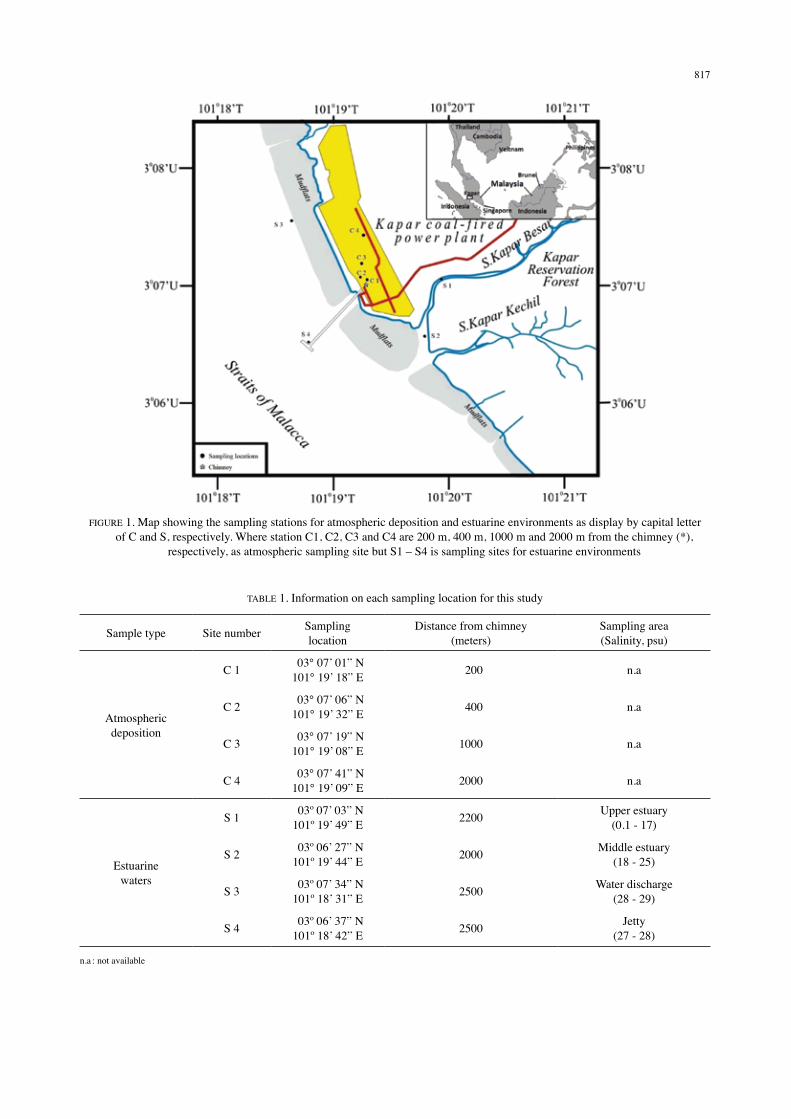
The study was carried out in a coal-fired power plant facility and its surrounding area. These areas are located in Kapar, Malaysia (Figure 1). The coal-fired power plant, named Sultan Salahuddin Abdul Aziz Power Plant (SSAAPP), situated in the Kapar region, has been operating since 1985. This power plant has a capacity of 2420 MW per year, consuming 2.5 × 10⁹ kg of raw charcoal annually. SSAAPP is the biggest power plant in Malaysia, contributing 23% of the electricity demand of the country. It uses three different fuels to generate power; whereby charcoal is the main fuel and natural gas and medium fuel oils are used as additional sources. The raw charcoal is primarily imported from Australia, Indonesia, South Africa and China although a small quantity originates from Sarawak, Malaysia. The power plant is equipped with modern ESP (Electrostatic Precipitators) and its efficiency is over 99.2% (TNB Generation 2003). Table 1 and Figure 1 show the details of the sample collections. Kapar is located 56 km from Kuala Lumpur and is only a few kilometers away from Port Klang. Their coast of Kapar is characterized by a semi-diurnal tidal area with humid tropical weather. This location is predominantly surrounded by mudflats with mangrove forests growing along the shorelines. The eastern and southern part of the study area, are locations which are heavily occupied by oil palm plantations, manufacturing industries, residential areas and shipping ports.
SAMPLE COLLECTION AND INSTRUMENTATIONS The study was undertaken in order to track the influence of the coal-fired power plant on the distribution of 210Po activities in the atmosphere and coastal system of Kapar. For this reason, the samples taken ranged from raw charcoal materials to sediment. Bulk rainwater including suspended solid (SSrw) and dissolved phase (Drw) samples was collected using a plastic pail with an approximate area of 660 cm² together with rain gauge indicator. The samples of estuarine water containing suspended solid (SSew) and dissolved phase (Dew) were collected using a Niskin water sampler and stored in 25 L polypropylene bottles. After immediate acidification to pH2 using concentrated nitric acid (HNO3) the collected samples were stored. The fractions between dissolved and suspended solid particles were then separated using glass fiber filter paper (Whatman; pore size 0.45 μm). The surface sediment samples were collected using a Petite Ponar grab, keep-in zip-locked plastic bags and stored at freezing temperature. The sampling on atmospheric deposition samples (marked as site C-1 to C-4) was conducted from 7th of February to 30th of August 2007. The four sampling locations for atmospheric deposition samples were placed at 200 m, 400 m, 1,000 m and 2,000 m, respectively, from the chimney (Table 1 and Figure 1). In contrast, the
817
FIGURE 1. Map showing the sampling stations for atmospheric deposition and estuarine environments as display by capital letter of C and S, respectively. Where station C1, C2, C3 and C4 are 200 m, 400 m, 1000 m and 2000 m from the chimney (*),
respectively, as atmospheric sampling site but S1 – S4 is sampling sites for estuarine environments
TABLE 1. Information on each sampling location for this study
Sample type Site number Samplinglocation
Distance from chimney(meters)
Sampling area(Salinity, psu)
Atmosphericdeposition
C 1 03° 07’ 01” N101° 19’ 18” E 200 n.a
C 2 03° 07’ 06” N101° 19’ 32” E 400 n.a
C 3 03° 07’ 19” N101° 19’ 08” E 1000 n.a
C 4 03° 07’ 41” N101° 19’ 09” E 2000 n.a
Estuarinewaters
S 1 03º 07’ 03” N101º 19’ 49” E 2200 Upper estuary
(0.1 - 17)
S 2 03º 06’ 27” N101º 19’ 44” E 2000 Middle estuary
(18 - 25)
S 3 03º 07’ 34” N101º 18’ 31” E 2500 Water discharge
(28 - 29)
S 4 03º 06’ 37” N101º 18’ 42” E 2500 Jetty
(27 - 28)
n.a : not available
818
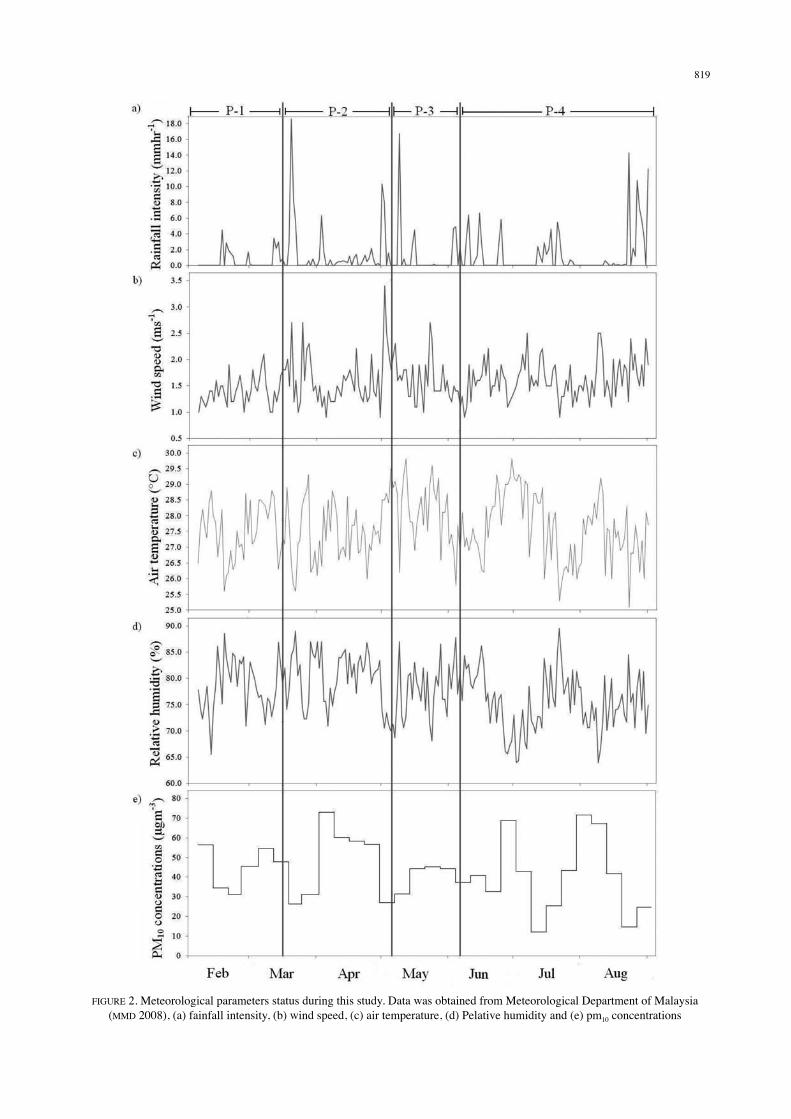
estuarine samples (marked as site S-1 to S-4), which were also taken from four locations, were only collected twice: on 8th of March and 1st of August 2007. The reason being that they were to represent the two different monsoon periods, northeast and southwest, respectively. The distance from the chimney was between 2,000 and 2,500 m for all estuarine sampling locations so as to standardize the possible direct influence from SSAAPP. In terms of the temporal variations which the study area experienced during P-1 (7th of February to 15th of March) samplings showed it to be a relatively dry period, characterized by a very low amount and intensity of rainfall (Figure 2). The highest rainfall intensity ever recorded during that period, 4.46 mm h-1, occurred on 16th of February which was also at the end of northeast monsoon for year 2006/07. During this period, the winds from the northeast were relatively weak and tended to behave erratically. The atmospheric temperature also increased slightly, leading to warmer and drier weather (Table 2 and Figure 2). The second period (P-2) from 16th of March to 5th of May was the transitional period between the northeast and southwest monsoon, during which time more rainfall activity was experienced in the afternoon. The rainfall intensity was normally light to moderate and only occasionally heavy and very heavy. The two highest rainfall intensities recorded during that period were 18.63 and 10.29 mm h-1. These occurred on 20th of March and 1st of May, respectively. The wind was reported been fickle and weak (MMD 2008), while the atmospheric humidity was relatively higher (Table 2 and Figure 2).
The third period (P-3) from 6th of May to 6th of June was slightly shorter than the other periods due to the additional effect of the Sumatran Winds. This period was actually the same as the fourth period (P-4), which is included in the southwest monsoon season for year 2007. The Sumatran winds occurred at the beginning of the southwest monsoon in May (MMD 2008) and are the normal winds which originate from the southwestern of Peninsular Malaysia and blow through the Sumatra island region. As a result, much of the air masses originating from Sumatra were also transported to our study area. Fundamentally, the west coast region of the Malaysia Peninsula is the main area receiving the majority of the air mass input from Sumatra. Nevertheless, the southwest monsoon normally brings a relatively drier season to the Kapar area with occasional rainfall activities occurring in early May and June, in the middle of July and at the end of August.
MEASUREMENT OF 210Po The radiochemical procedures proposed by Narita et al. (1989) were followed, where the dissolved samples fraction were put in pail to be spiked with 0.1 dpm of Polonium-209 tracer and 25 mg mL-1 of ferum carrier. The aqueous was precipitated with ammonium hydroxide (NH4OH) to form iron(III)hydroxide [(Fe(III)(OH)3] precipitation and redissolved with diluted HCl for further radiochemical separations.
TABLE 2. Summary of meteorological and climatic variation during sampling events obtained from the Malaysian Meteorology Department
Period Duration Condition
1st (P-1) 7 February – 15 MarchEnd of the northeast monsoon•Very occasional and limited rainfall activity•Weak wind from the northeast •Increasing atmospheric temperature•Warm and dry period•
2nd (P-2) 16 March – 5 MayMonsoon transition•More frequent rainfall activity of light to moderate intensity•Weak wind with no particular direction•Relatively humid period•
3rd (P-3) 6 May – 6 JuneBeginning of the southwest monsoon•Very occasional rainfall activity•Occasional strong wind from the northeast •Significant influence from Sumatran Winds•Dry period•
4th (P-4) 7 June – 30 AugustThe southwest monsoon•Weak wind from the southwest•During June normally very dry period experienced•During July also relatively dry but usually intensified rainfall •received in middle of the month During early August very dry period experienced but more •intensified rainfall activity towards the end of month
Where P-1, P-2, P-3 and P-4 is post-northeast monsoon, monsoon transition, pre-southwest monsoon and southwest monsoon, respectively.
819
FIGURE 2. Meteorological parameters status during this study. Data was obtained from Meteorological Department of Malaysia (MMD 2008), (a) fainfall intensity, (b) wind speed, (c) air temperature, (d) Pelative humidity and (e) pm10 concentrations
820
Meanwhile, particulate samples fraction were totally digested with concentrated HNO3, HCl and HF to dissolve all particles into aqueous form in Teflon beaker after spiked with 1.3 dpm of Polonium-209 tracer. All digestion procedures were using hotplates and taken to dryness below 80 ºC to prevent polonium from vaporized. Finally, dried samples were re-dissolved with diluted HCl for radiochemical separation procedures. The determination of 210Po was based on the spontaneous deposition of 210Po on a silver disk (Flynn 1968). Before deposition, hydroxylamine hydrochloride and ascorbic acid were added as chelating agent and reduce Fe(III) into Fe(II), respectively. Polonium was spontaneously plated on silver discs using 50 mL of 0.5 M HCl solution at 70–80 °C for 3 h. The activity of 210Po was measured using the Alpha Analyst Spectroscopy system with a silicon-surface barrier detector by Canberra, Inc., with Apex-Alpha software. The polonium yield in analyzed samples was typically 60–80%. The system consists of silicone-surface barrier detector placed in standalone nucleus alpha spectrometers having negligible background (0.0003 cpm) and counting efficiency of 11 – 13%. The system was calibrated using mixed standard source of 230Th, 239Pu, 244Cu and 241Am. A reference material, IAEA-300 (radionuclides in Baltic Sea Sediment), was used to check the performance of the analytical procedure. The obtained recovery value was always greater than 90%.
RESULTS
ACTIVITY CONCENTRATIONS OF 210Po IN SOLID SAMPLES
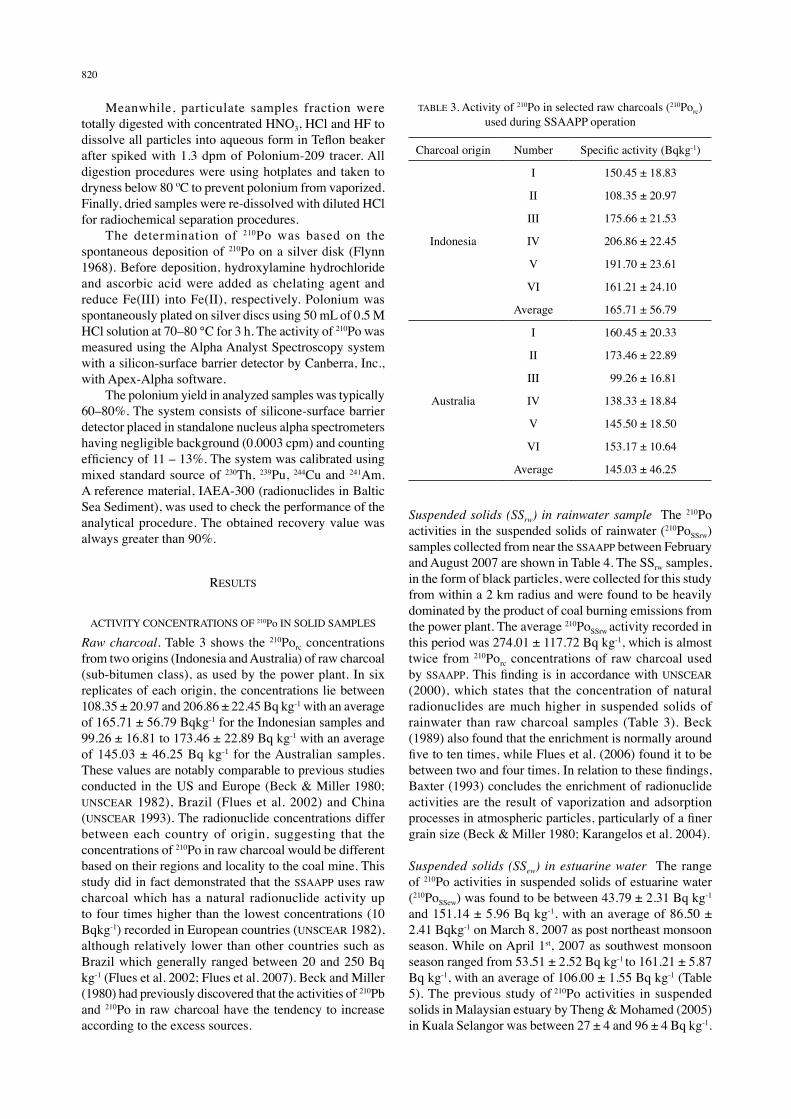
Raw charcoal. Table 3 shows the 210Porc concentrations from two origins (Indonesia and Australia) of raw charcoal (sub-bitumen class), as used by the power plant. In six replicates of each origin, the concentrations lie between 108.35 ± 20.97 and 206.86 ± 22.45 Bq kg-1 with an average of 165.71 ± 56.79 Bqkg-1 for the Indonesian samples and 99.26 ± 16.81 to 173.46 ± 22.89 Bq kg-1 with an average of 145.03 ± 46.25 Bq kg-1 for the Australian samples. These values are notably comparable to previous studies conducted in the US and Europe (Beck & Miller 1980; UNSCEAR 1982), Brazil (Flues et al. 2002) and China (UNSCEAR 1993). The radionuclide concentrations differ between each country of origin, suggesting that the concentrations of 210Po in raw charcoal would be different based on their regions and locality to the coal mine. This study did in fact demonstrated that the SSAAPP uses raw charcoal which has a natural radionuclide activity up to four times higher than the lowest concentrations (10 Bqkg-1) recorded in European countries (UNSCEAR 1982), although relatively lower than other countries such as Brazil which generally ranged between 20 and 250 Bq kg-1 (Flues et al. 2002; Flues et al. 2007). Beck and Miller (1980) had previously discovered that the activities of 210Pb and 210Po in raw charcoal have the tendency to increase according to the excess sources.
TABLE 3. Activity of 210Po in selected raw charcoals (210Porc) used during SSAAPP operation
Charcoal origin Number Specific activity (Bqkg-1)
Indonesia
I 150.45 ± 18.83
II 108.35 ± 20.97
III 175.66 ± 21.53
IV 206.86 ± 22.45
V 191.70 ± 23.61
VI 161.21 ± 24.10
Average 165.71 ± 56.79
Australia
I 160.45 ± 20.33
II 173.46 ± 22.89
III 99.26 ± 16.81
IV 138.33 ± 18.84
V 145.50 ± 18.50
VI 153.17 ± 10.64
Average 145.03 ± 46.25
Suspended solids (SSrw) in rainwater sample The 210Po activities in the suspended solids of rainwater (210PoSSrw) samples collected from near the SSAAPP between February and August 2007 are shown in Table 4. The SSrw samples, in the form of black particles, were collected for this study from within a 2 km radius and were found to be heavily dominated by the product of coal burning emissions from the power plant. The average 210PoSSrw
activity recorded in this period was 274.01 ± 117.72 Bq kg-1, which is almost twice from 210Porc concentrations of raw charcoal used by SSAAPP. This finding is in accordance with UNSCEAR (2000), which states that the concentration of natural radionuclides are much higher in suspended solids of rainwater than raw charcoal samples (Table 3). Beck (1989) also found that the enrichment is normally around five to ten times, while Flues et al. (2006) found it to be between two and four times. In relation to these findings, Baxter (1993) concludes the enrichment of radionuclide activities are the result of vaporization and adsorption processes in atmospheric particles, particularly of a finer grain size (Beck & Miller 1980; Karangelos et al. 2004).
Suspended solids (SSew) in estuarine water The range of 210Po activities in suspended solids of estuarine water (210PoSSew) was found to be between 43.79 ± 2.31 Bq kg-1 and 151.14 ± 5.96 Bq kg-1, with an average of 86.50 ± 2.41 Bqkg-1 on March 8, 2007 as post northeast monsoon season. While on April 1st, 2007 as southwest monsoon season ranged from 53.51 ± 2.52 Bq kg-1 to 161.21 ± 5.87 Bq kg-1, with an average of 106.00 ± 1.55 Bq kg-1 (Table 5). The previous study of 210Po activities in suspended solids in Malaysian estuary by Theng & Mohamed (2005) in Kuala Selangor was between 27 ± 4 and 96 ± 4 Bq kg-1.
821
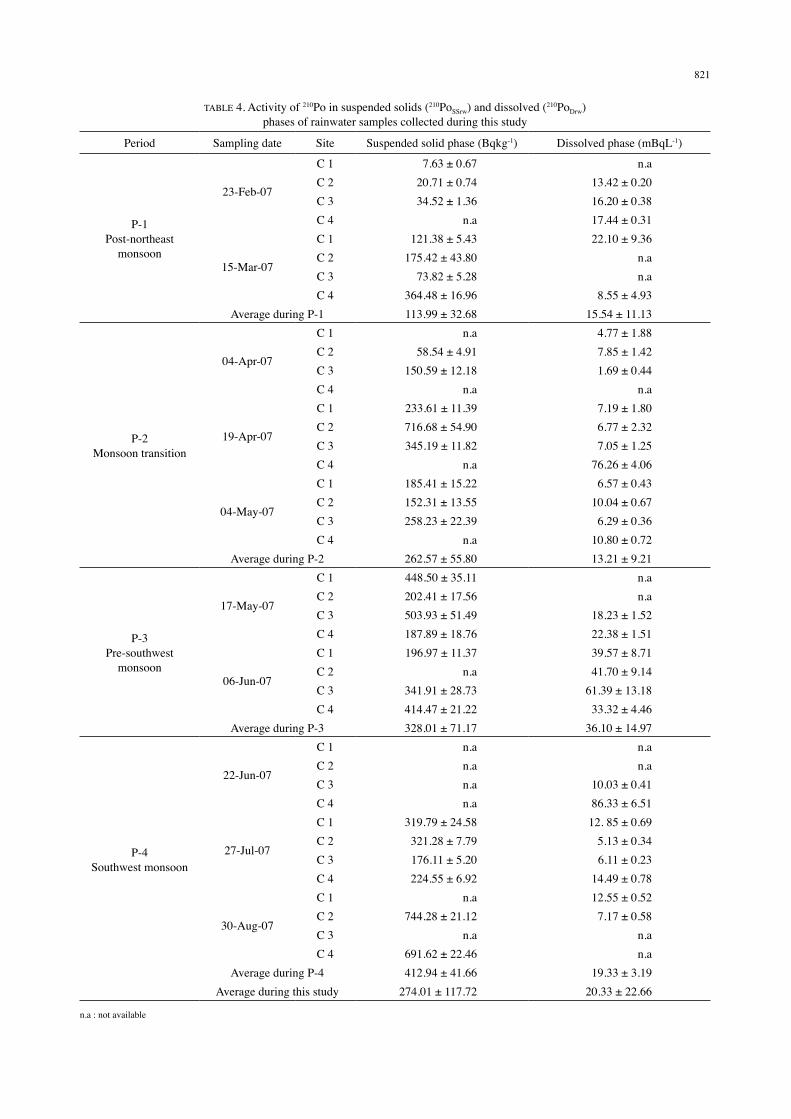
TABLE 4. Activity of 210Po in suspended solids (210PoSSrw) and dissolved (210PoDrw) phases of rainwater samples collected during this study
Period Sampling date Site Suspended solid phase (Bqkg-1) Dissolved phase (mBqL-1)
P-1Post-northeast
monsoon
23-Feb-07
C 1 7.63 ± 0.67 n.aC 2 20.71 ± 0.74 13.42 ± 0.20C 3 34.52 ± 1.36 16.20 ± 0.38C 4 n.a 17.44 ± 0.31
15-Mar-07
C 1 121.38 ± 5.43 22.10 ± 9.36C 2 175.42 ± 43.80 n.aC 3 73.82 ± 5.28 n.aC 4 364.48 ± 16.96 8.55 ± 4.93
Average during P-1 113.99 ± 32.68 15.54 ± 11.13
P-2Monsoon transition
04-Apr-07
C 1 n.a 4.77 ± 1.88C 2 58.54 ± 4.91 7.85 ± 1.42C 3 150.59 ± 12.18 1.69 ± 0.44C 4 n.a n.a
19-Apr-07
C 1 233.61 ± 11.39 7.19 ± 1.80C 2 716.68 ± 54.90 6.77 ± 2.32C 3 345.19 ± 11.82 7.05 ± 1.25C 4 n.a 76.26 ± 4.06
04-May-07
C 1 185.41 ± 15.22 6.57 ± 0.43C 2 152.31 ± 13.55 10.04 ± 0.67C 3 258.23 ± 22.39 6.29 ± 0.36C 4 n.a 10.80 ± 0.72
Average during P-2 262.57 ± 55.80 13.21 ± 9.21
P-3Pre-southwest
monsoon
17-May-07
C 1 448.50 ± 35.11 n.aC 2 202.41 ± 17.56 n.aC 3 503.93 ± 51.49 18.23 ± 1.52C 4 187.89 ± 18.76 22.38 ± 1.51
06-Jun-07
C 1 196.97 ± 11.37 39.57 ± 8.71C 2 n.a 41.70 ± 9.14C 3 341.91 ± 28.73 61.39 ± 13.18C 4 414.47 ± 21.22 33.32 ± 4.46
Average during P-3 328.01 ± 71.17 36.10 ± 14.97
P-4Southwest monsoon
22-Jun-07
C 1 n.a n.aC 2 n.a n.aC 3 n.a 10.03 ± 0.41C 4 n.a 86.33 ± 6.51
27-Jul-07
C 1 319.79 ± 24.58 12. 85 ± 0.69C 2 321.28 ± 7.79 5.13 ± 0.34C 3 176.11 ± 5.20 6.11 ± 0.23C 4 224.55 ± 6.92 14.49 ± 0.78
30-Aug-07
C 1 n.a 12.55 ± 0.52C 2 744.28 ± 21.12 7.17 ± 0.58C 3 n.a n.aC 4 691.62 ± 22.46 n.a
Average during P-4 412.94 ± 41.66 19.33 ± 3.19Average during this study 274.01 ± 117.72 20.33 ± 22.66
n.a : not available
822
The study stated that the main source of radioactivity in that river was from the agricultural activity by oil palm industry, while domestic and industrial waste releases would also important. Therefore, it will be applicable to say that the 210Po activities in suspended solids of Kapar coastal region are highly influenced by the deposition of fly ash originating from coal combustions. The deposition of suspended solid or fly ash from coal burning emissions to the Kapar coastal area were notably higher during the second estuarine sampling as southwest monsoon period (P-4), which experienced more dry periods than the first estuarine sampling indicated as post northeast monsoon events (P-1). As a result, 210PoSSew activity concentrations in all sampling locations should record higher activities during the dry period during the southwest monsoon. It was found that only S 1 and S 4 followed the above trend and that in contrary with the S 2 and S 3 profiles which were not similarly distributed. There are possible explanations for such behavior in the selected study areas, which generally due to the geochemical variability for every location. The S 2, which is located in the lower estuary, may have been strongly influenced by an increasing amount of run-off from the land by rivers and streams during post northeast monsoon events (P-1). The watershed and chemical weathering which brings agricultural, industrial and residential wastes during the heavier rainfall of the northeast monsoon are possible reasons for the enhancement of 210PoSSew
activity at this particular location. These possible sources are also estimated to enhance the 210PoSSew
activity to a level about twice higher than normally expected. This showed that the influence from geochemical variability is sometime more significant in shaping the natural radionuclide activity concentration in river and estuary of Kapar than by the power plant’s effluents or emissions.
For S 3, the changes of 210PoSSew activity at this
location are expected to fluctuate depending on the level of emissions from the SSAAPP cooling systems. S 3 constantly receives input from the SSAAPP water discharge, which was used to cool systems during SSAAPP operations. The concentrations at this location may not represent the typical concentrations at other sampling sites, irrespective of seasonal variations, since the disruptions arise from water discharge from the power plant.
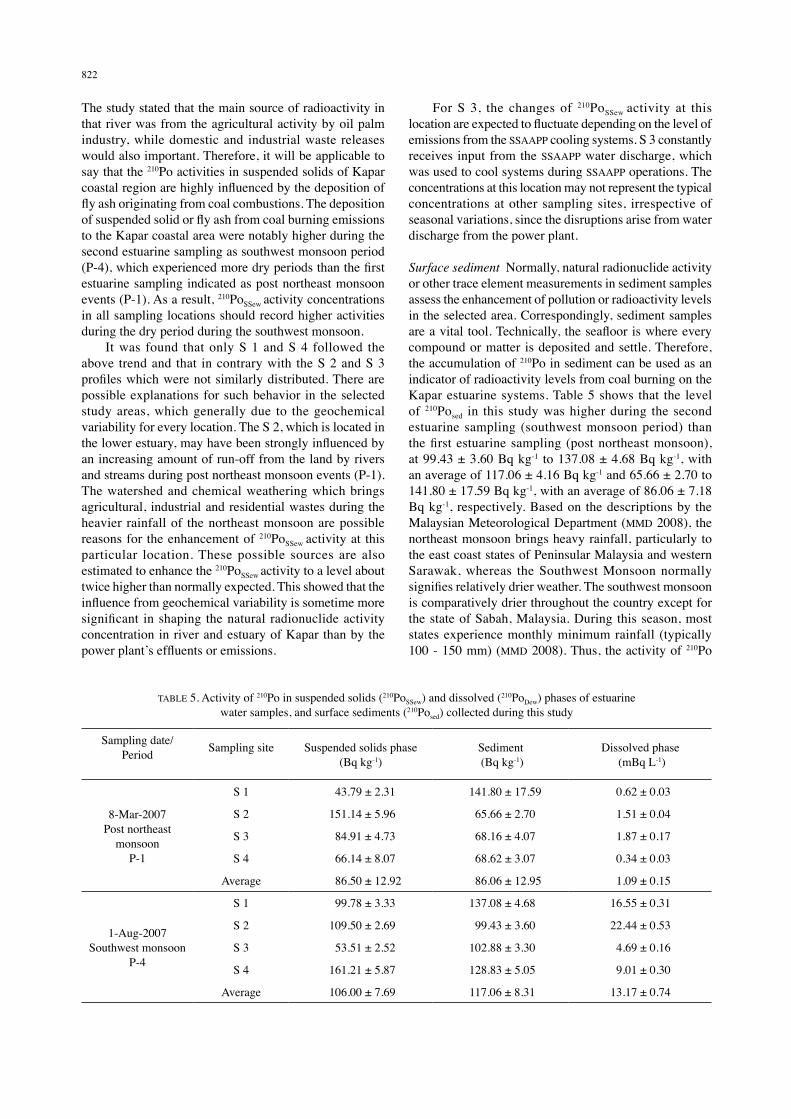
Surface sediment Normally, natural radionuclide activity or other trace element measurements in sediment samples assess the enhancement of pollution or radioactivity levels in the selected area. Correspondingly, sediment samples are a vital tool. Technically, the seafloor is where every compound or matter is deposited and settle. Therefore, the accumulation of 210Po in sediment can be used as an indicator of radioactivity levels from coal burning on the Kapar estuarine systems. Table 5 shows that the level of 210Posed in this study was higher during the second estuarine sampling (southwest monsoon period) than the first estuarine sampling (post northeast monsoon), at 99.43 ± 3.60 Bq kg-1 to 137.08 ± 4.68 Bq kg-1, with an average of 117.06 ± 4.16 Bq kg-1 and 65.66 ± 2.70 to 141.80 ± 17.59 Bq kg-1, with an average of 86.06 ± 7.18 Bq kg-1, respectively. Based on the descriptions by the Malaysian Meteorological Department (MMD 2008), the northeast monsoon brings heavy rainfall, particularly to the east coast states of Peninsular Malaysia and western Sarawak, whereas the Southwest Monsoon normally signifies relatively drier weather. The southwest monsoon is comparatively drier throughout the country except for the state of Sabah, Malaysia. During this season, most states experience monthly minimum rainfall (typically 100 - 150 mm) (MMD 2008). Thus, the activity of 210Po
TABLE 5. Activity of 210Po in suspended solids (210PoSSew) and dissolved (210PoDew) phases of estuarine water samples, and surface sediments (210Posed) collected during this study
Sampling date/Period Sampling site Suspended solids phase
(Bq kg-1)Sediment (Bq kg-1)
Dissolved phase (mBq L-1)
8-Mar-2007Post northeast
monsoonP-1
S 1 43.79 ± 2.31 141.80 ± 17.59 0.62 ± 0.03
S 2 151.14 ± 5.96 65.66 ± 2.70 1.51 ± 0.04
S 3 84.91 ± 4.73 68.16 ± 4.07 1.87 ± 0.17
S 4 66.14 ± 8.07 68.62 ± 3.07 0.34 ± 0.03
Average 86.50 ± 12.92 86.06 ± 12.95 1.09 ± 0.15
1-Aug-2007Southwest monsoon
P-4
S 1 99.78 ± 3.33 137.08 ± 4.68 16.55 ± 0.31
S 2 109.50 ± 2.69 99.43 ± 3.60 22.44 ± 0.53
S 3 53.51 ± 2.52 102.88 ± 3.30 4.69 ± 0.16
S 4 161.21 ± 5.87 128.83 ± 5.05 9.01 ± 0.30
Average 106.00 ± 7.69 117.06 ± 8.31 13.17 ± 0.74
823
in this study may have been more accumulated between transition monsoon andsouthwest monsoon season of year 2007 than in the northeast monsoon of year 2006/07. This may be induced by the relatively warmer and drier southwest monsoon.
ACTIVITY CONCENTRATIONS 210Po IN DISSOLVED PHASE
Rainwater In dissolved phase of rainwater (Drw) sample, the activity concentration of 210PoDrw ranged from 1.69 ± 0.44 to 86.33 ± 6.51 mBq L-1 (Table 4). The 210PoDrw activity in rainwater is also important as this measurement allows scientists to assess the dispersion processes and radionuclide deposition from the atmosphere. Rainfall is one of the essential processes which acts as a washing or removal agent for aerosol and air particulates in the atmosphere and deposits them onto maritime or continental surfaces. Nevertheless, radionuclide activities in precipitation samples were found to fluctuate, depending on the amount and period of rainfall (Sugihara et al. 1999), aerosol distribution and size (Balkanov & Sorensen 2001), meteorological factors (Martinez-Aguirre et al. 1991), among other factors. Such that, the concentration of 210PoDrw during this study correlated with the emissions from coal burning and the suspended solid or fly ash contents from the power plant.
Estuarine water 210PoDew activity fluctuated at different locations from the upper river down to the coastal waters. The 210PoDew activities at all sampling locations were recorded as being higher during the southwest monsoon period than the post northeast monsoon events. Based on Table 5, the 210PoDew activity during March 8, 2007 sampling was ranging between 0.34 ± 0.03 and 1.87 ± 0.17 mBq L-1, with an average of 1.09 ± 0.07 mBq L-1. For August 1st, 2007 sampling, the 210PoDew activity was varied between 4.69 ± 0.16 and 22.44 ± 0.53 mBq L-1, with an average of 13.17 ± 0.33 mBq L-1. In contrast to the solid phase samples, there were very distinct differences between to the two estuarine water samplings undertaken and samples were over 10 times higher. For this reason, it was possible to find the changes in radionuclide concentrations much more clearly in the dissolved rather than the particulate phases.
DISCUSSION
THE SEASONAL CHANGES AND CHARACTERIZATION OF 210Po ACTIVITIES BETWEEN FEBRUARY AND AUGUST, 2007
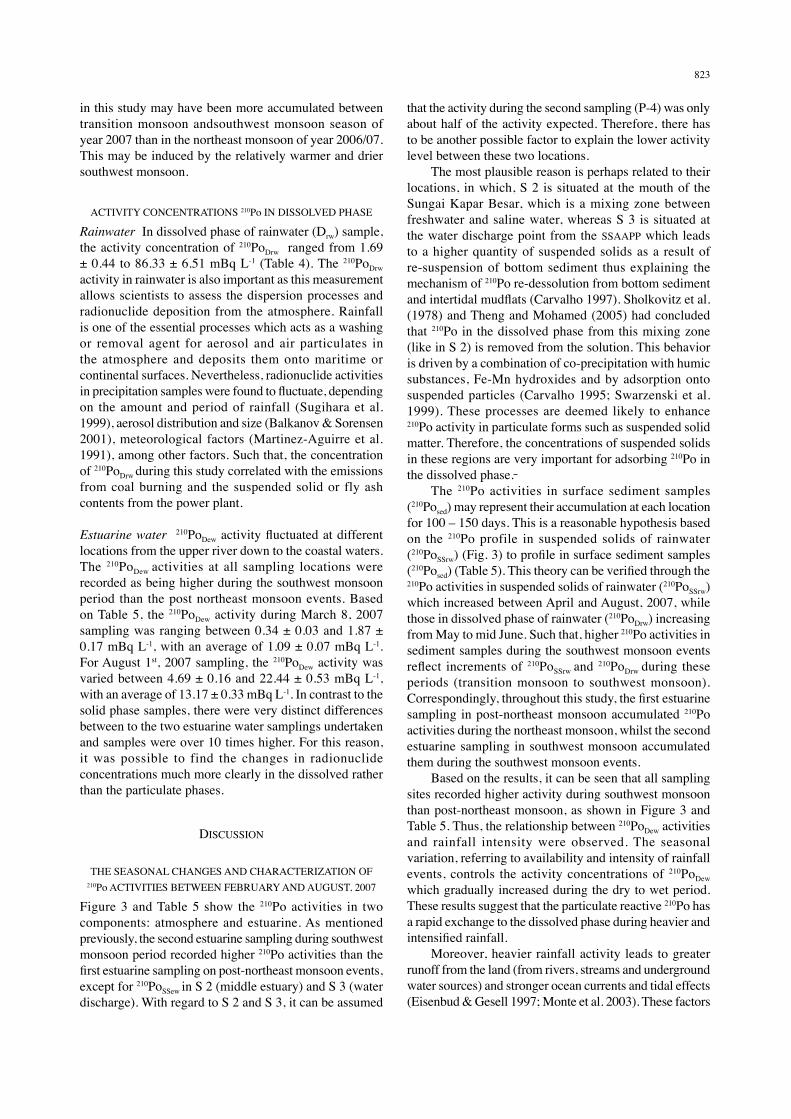
Figure 3 and Table 5 show the 210Po activities in two components: atmosphere and estuarine. As mentioned previously, the second estuarine sampling during southwest monsoon period recorded higher 210Po activities than the first estuarine sampling on post-northeast monsoon events, except for 210PoSSew in S 2 (middle estuary) and S 3 (water discharge). With regard to S 2 and S 3, it can be assumed
that the activity during the second sampling (P-4) was only about half of the activity expected. Therefore, there has to be another possible factor to explain the lower activity level between these two locations. The most plausible reason is perhaps related to their locations, in which, S 2 is situated at the mouth of the Sungai Kapar Besar, which is a mixing zone between freshwater and saline water, whereas S 3 is situated at the water discharge point from the SSAAPP which leads to a higher quantity of suspended solids as a result of re-suspension of bottom sediment thus explaining the mechanism of 210Po re-dessolution from bottom sediment and intertidal mudflats (Carvalho 1997). Sholkovitz et al. (1978) and Theng and Mohamed (2005) had concluded that 210Po in the dissolved phase from this mixing zone (like in S 2) is removed from the solution. This behavior is driven by a combination of co-precipitation with humic substances, Fe-Mn hydroxides and by adsorption onto suspended particles (Carvalho 1995; Swarzenski et al. 1999). These processes are deemed likely to enhance 210Po activity in particulate forms such as suspended solid matter. Therefore, the concentrations of suspended solids in these regions are very important for adsorbing 210Po in the dissolved phase. The 210Po activities in surface sediment samples (210Posed) may represent their accumulation at each location for 100 – 150 days. This is a reasonable hypothesis based on the 210Po profile in suspended solids of rainwater (210PoSSrw) (Fig. 3) to profile in surface sediment samples (210Posed) (Table 5). This theory can be verified through the 210Po activities in suspended solids of rainwater (210PoSSrw) which increased between April and August, 2007, while those in dissolved phase of rainwater (210PoDrw) increasing from May to mid June. Such that, higher 210Po activities in sediment samples during the southwest monsoon events reflect increments of 210PoSSrw
and 210PoDrw during these
periods (transition monsoon to southwest monsoon). Correspondingly, throughout this study, the first estuarine sampling in post-northeast monsoon accumulated 210Po activities during the northeast monsoon, whilst the second estuarine sampling in southwest monsoon accumulated them during the southwest monsoon events. Based on the results, it can be seen that all sampling sites recorded higher activity during southwest monsoon than post-northeast monsoon, as shown in Figure 3 and Table 5. Thus, the relationship between 210PoDew activities and rainfall intensity were observed. The seasonal variation, referring to availability and intensity of rainfall events, controls the activity concentrations of 210PoDew
which gradually increased during the dry to wet period. These results suggest that the particulate reactive 210Po has a rapid exchange to the dissolved phase during heavier and intensified rainfall. Moreover, heavier rainfall activity leads to greater runoff from the land (from rivers, streams and underground water sources) and stronger ocean currents and tidal effects (Eisenbud & Gesell 1997; Monte et al. 2003). These factors
824
FIGURE 3. Distribution average activity of 210Po in rainwater samples at various time and location of sampling events from February to September 2007 (a) suspended salid phase and (b) discoved phase
tend to enhance the mechanical and chemical weathering processes (Mas et al. 2007) and subsequently, lead to an increased concentration of 210PoDew
activity during higher rainfall activities in August. At the same time, heavier rainfall activity is also likely to enhance the re-suspension of bottom sediments, which result in higher concentrations of 210Po in water. With respect to 210PoDrw, the activity concentrations of 210Po in the atmosphere positively correlated with a higher mean rainfall. Martin (2003) found higher 210Po activity in the atmosphere was affected by the enhancement of biogenic aerosol or particulate content during the rainy season. However, Martin (2003) also concluded a negative correlation between rainfall intensity and the concentration of insoluble particulate matter or dust. Theses finding clearly prove the activity concentrations of 210Po in the atmosphere is correlative to the amount of dust and rainfall.
THE TRANSFORMATION OF 210Po FROM COAL BURNING ACTIVITY TO COASTAL ENVIRONMENT
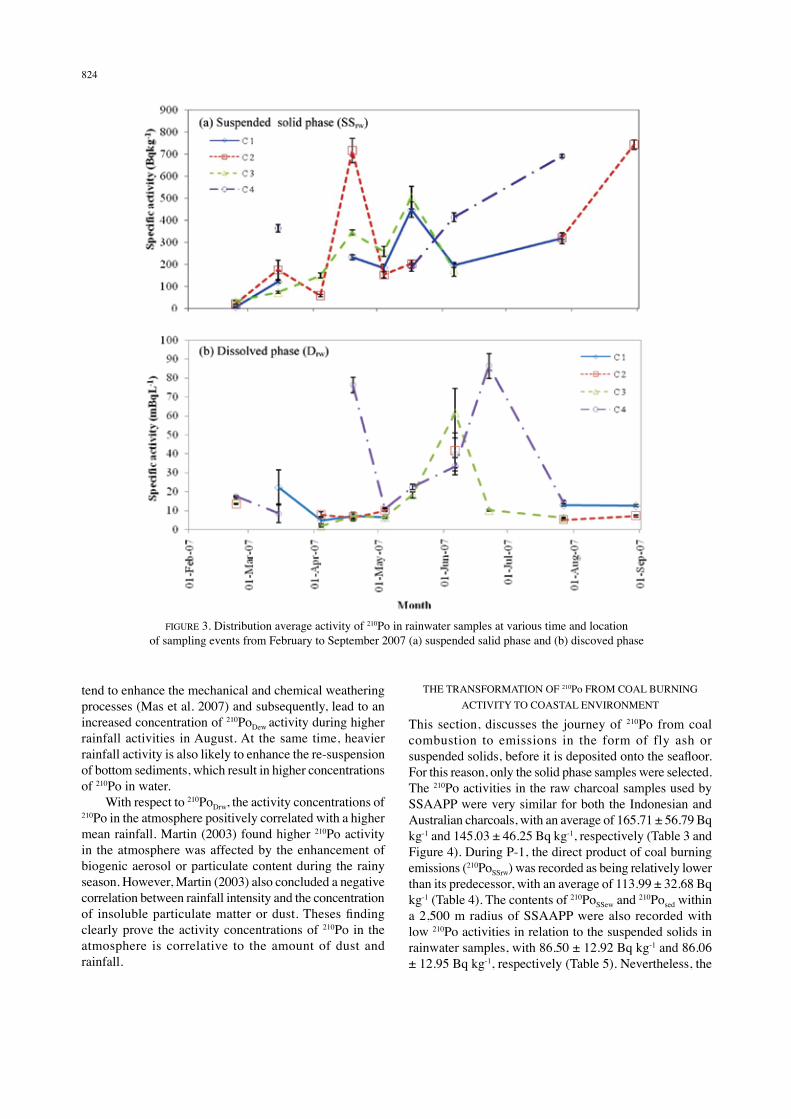
This section, discusses the journey of 210Po from coal combustion to emissions in the form of fly ash or suspended solids, before it is deposited onto the seafloor. For this reason, only the solid phase samples were selected. The 210Po activities in the raw charcoal samples used by SSAAPP were very similar for both the Indonesian and Australian charcoals, with an average of 165.71 ± 56.79 Bq kg-1 and 145.03 ± 46.25 Bq kg-1, respectively (Table 3 and Figure 4). During P-1, the direct product of coal burning emissions (210PoSSrw) was recorded as being relatively lower than its predecessor, with an average of 113.99 ± 32.68 Bq kg-1 (Table 4). The contents of 210PoSSew and 210Posed within a 2,500 m radius of SSAAPP were also recorded with low 210Po activities in relation to the suspended solids in rainwater samples, with 86.50 ± 12.92 Bq kg-1 and 86.06 ± 12.95 Bq kg-1, respectively (Table 5). Nevertheless, the
825
patterns showed that 210Po activities among suspended solids in rainwater, suspended solids in estuarine water and surface sediment samples were almost consistent and altered very little, lies between 86 and 117 Bq kg-1. With reference to the 210Po activities in surface sediment samples (210Posed) as discussed before, the first estuarine sampling during post-northeast monsoon was in essence collecting 210Po sources throughout November 2006 and January 2007. These were much likely to have been affected by the northeast monsoon whilst 210Po sources for the second estuarine sampling (southwest monsoon events) were collected between April and August 2007. For the record, the climate in the Kapar region during post-northeast monsoon was characterized by high rainfall intensity and atmospheric relative humidity, rather strong northeastern winds and a lower atmospheric temperature (MMD 2008). Even though our records demonstrate that the period February to March 2007 was associated with low rainfall activities and much slower winds from the northeast, which resulted in higher atmospheric temperatures, the aforementioned factors could be important causes as to why 210Po activities were lower during this period of time as opposed to any other. These factors, which may also have been driven by the amount of coal burning emissions, are all major contributors for lower 210Po activities during the first estuarine sampling. For the suspended solid of rainwater samples, the average 210PoSSrw activities showed a distinct increment from monsoon transition (P-2) to southwest monsoon (P-4) of almost three times from the level at post-northeast monsoon (Figure 4). The monsoon transition (P-2) in Figure 3a, demonstrated that 210PoSSrw activities increased from the middle of March until the end of April for all locations, apart from C-4. The increment was affected by higher PM10 concentrations and atmospheric temperatures (Figure 2) during April, in which more coal combustion
emissions were released. This result shows that the enrichment of 210Po in suspended solid is associated with the concentration of particulate matter in air columns (Carvalho 1995; Martin 2003), which are induced by coal combustion emissions from the SSAAPP, particularly during warmer atmospheric temperatures. In contrast, during pre-southwest monsoon (P-3), one of the principal causes of higher 210PoSSrw
activities was noted to be extreme weather. In this study, extreme weather was referred to an extremely dry or wet period, depending on the rainfall availability and atmospheric temperature. Figure 2 shows a dry period during the middle of May until June with no rainfall occurrence. However, it should be noted that when rainfall does occur, the intensity was eventually high and predominantly classified as heavy rainfall. Such that, it is possible to stipulate that the increasing atmospheric temperature during a dry period is one of the key factors of 210Po enrichment in atmospheric samples. This is essential due to higher temperatures causing more 222Rn and its daughters’ to emanate from earth, depending on the volatility of each radionuclide (Karangelos et al. 2004). P-4, which was actually the continuation of P-3, also experienced extreme weather. In this instance, higher 210PoSSrw
activities were driven by higher SSAAPP emissions during July and August, according to the PM10 concentrations documented, which reached 68.91 and 71.57 μgm-3, respectively (Figures 3 and 2(e).) Figure 4 also presents a slight increment of 210Po activities in suspended solids and surface sediment samples during P-4. This result demonstrates the enrichment by 210Po in suspended solids of rainwater which increased from P-1 to P-4. Consequently, it can be verified that 210Po enrichments in suspended solids of estuarine water and surface sediment in the Kapar estuarine and coastal region were significantly affected by the SSAAPP’s coal burning emissions.
FIGURE 4. 210Po activities in each of the solid samples analyzed during this study which reproduced from Table 3, Table 4 and Table 5 data to show temporal changes of 210Po from P-1 to P-4
826
DISTRIBUTION AND DISPERSION OF 210Po WITHIN THE SSAAPP REGION
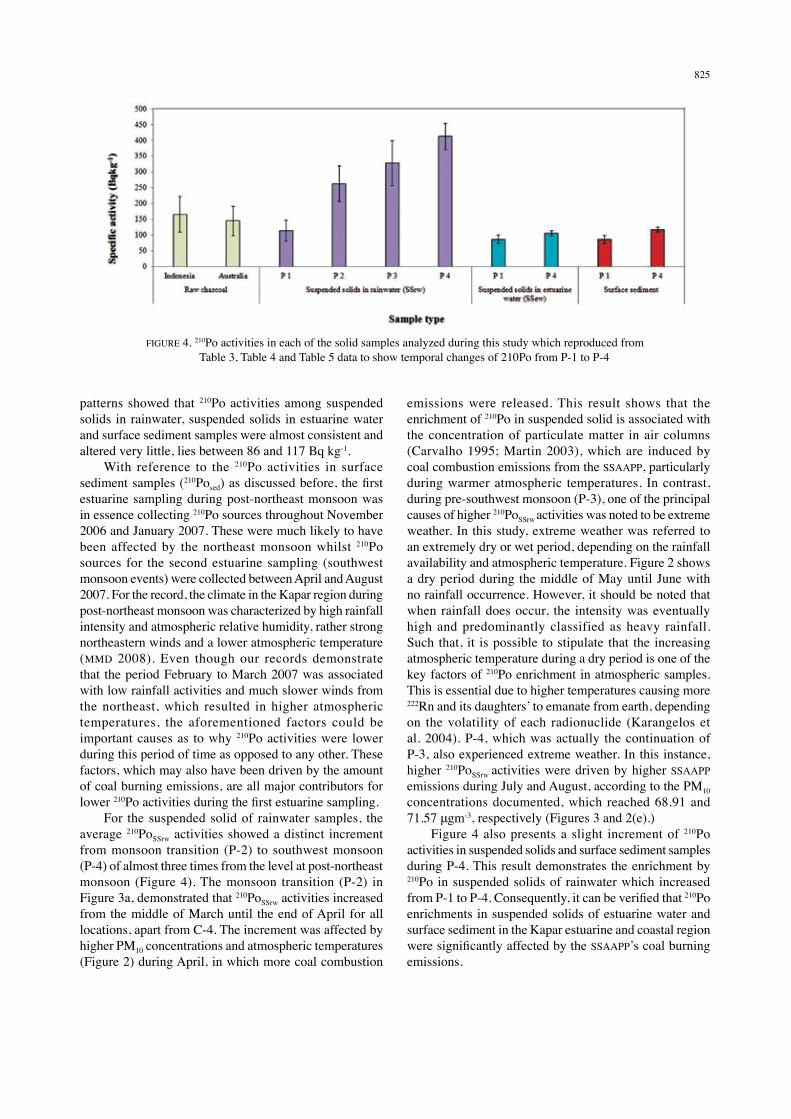
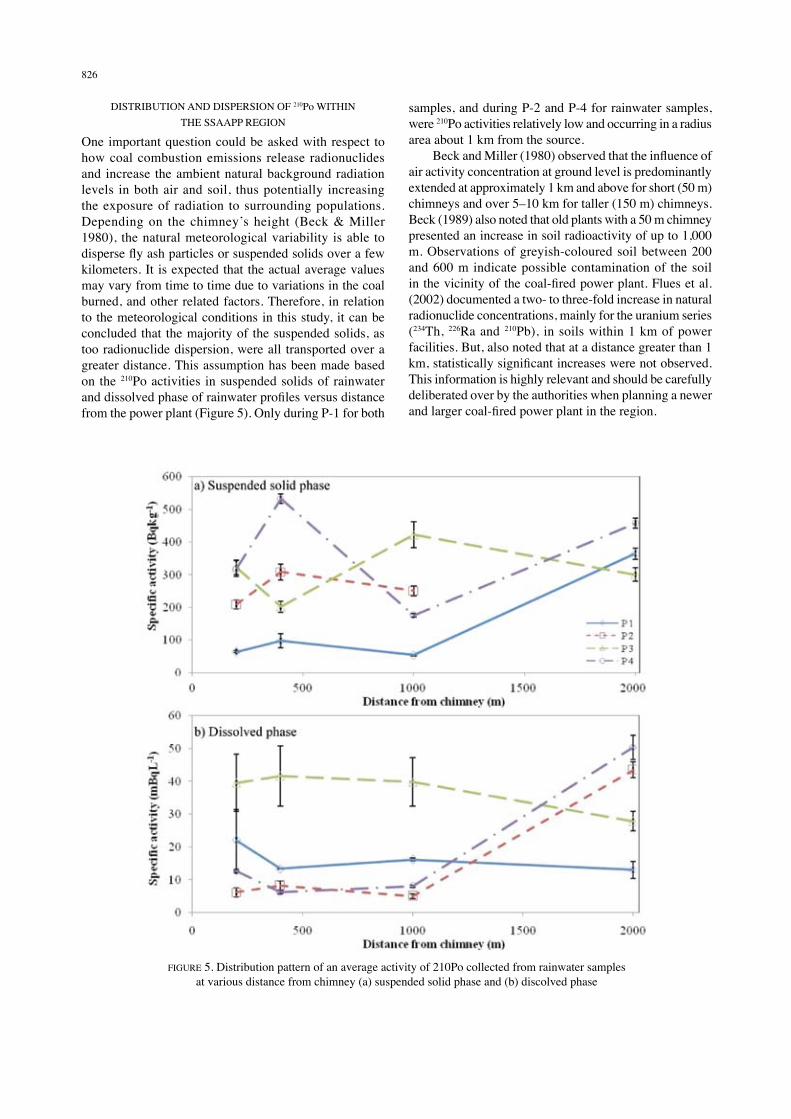
One important question could be asked with respect to how coal combustion emissions release radionuclides and increase the ambient natural background radiation levels in both air and soil, thus potentially increasing the exposure of radiation to surrounding populations. Depending on the chimney’s height (Beck & Miller 1980), the natural meteorological variability is able to disperse fly ash particles or suspended solids over a few kilometers. It is expected that the actual average values may vary from time to time due to variations in the coal burned, and other related factors. Therefore, in relation to the meteorological conditions in this study, it can be concluded that the majority of the suspended solids, as too radionuclide dispersion, were all transported over a greater distance. This assumption has been made based on the 210Po activities in suspended solids of rainwater and dissolved phase of rainwater profiles versus distance from the power plant (Figure 5). Only during P-1 for both
samples, and during P-2 and P-4 for rainwater samples, were 210Po activities relatively low and occurring in a radius area about 1 km from the source. Beck and Miller (1980) observed that the influence of air activity concentration at ground level is predominantly extended at approximately 1 km and above for short (50 m) chimneys and over 5–10 km for taller (150 m) chimneys. Beck (1989) also noted that old plants with a 50 m chimney presented an increase in soil radioactivity of up to 1,000 m. Observations of greyish-coloured soil between 200 and 600 m indicate possible contamination of the soil in the vicinity of the coal-fired power plant. Flues et al. (2002) documented a two- to three-fold increase in natural radionuclide concentrations, mainly for the uranium series (234Th, 226Ra and 210Pb), in soils within 1 km of power facilities. But, also noted that at a distance greater than 1 km, statistically significant increases were not observed. This information is highly relevant and should be carefully deliberated over by the authorities when planning a newer and larger coal-fired power plant in the region.
FIGURE 5. Distribution pattern of an average activity of 210Po collected from rainwater samples at various distance from chimney (a) suspended solid phase and (b) discolved phase
827
CONCLUSION
The specific activities of 210Po in various environmental samples were significantly affected by the deposition of suspended solids in rainwater discharged from the coal-fired power plant of SSAAPP. Moreover, the 210Po content in suspended solids of rainwater was heavily enriched from its original form (charcoal) by nearly three times the quantity. Distribution and accumulation also varied depending on climatic variations at the survey sites. This study showed that 210Po accumulation in the study site was noticeably higher during the southwest monsoon than the northeast monsoon, owing to respective meteorological conditions. A further finding was that most of the suspended solids in rainwater containing 210Po originating from SSAAPP burning emissions were transported over a distance of a few kilometers.
ACKNOWLEDGEMENTS
The authors would like to thank all individuals and organizations involved in this research, particularly the Universiti Kebangsaan Malaysia and Kapar Energy Ventures Sdn. Bhd. for their invaluable help. This research was funded by the Ministry of Science, Technology and Innovation, Malaysia (Science Fund grant No. 04-01-02-SF0117).
REFERENCES
Al-Masri, M.S., Al-Karfan, K., Khalili, H. & Hassan, M. 2006. Speciation of 210Po and 210Pb in air particulates by sequential extraction. Journal of Environmental Radioactivity 91: 103-112.
Balkanov, A. & Sorensen, J.H. 2001. Parameterisation of radionuclide deposition in atmospheric long-range transport modelling. Physics and Chemistry of the Earth (B) 26: 787-799.
Baskaran, M. & Shaw, G.E. 2001. Residence times of arctic haze aerosols using the concentrations and activity ratios of 210Po, 210Pb and 7Be. Journal of Aerosol Science 32: 443-452.
Baxter, L.L. 1993. Ash deposition during biomass and coal combustion: A mechanistic approach. Biomass and Bioenergy 2: 85-102.
Beck, H.L. 1989. Radiation exposures due to fossil fuel combustion. Radiation Physics and Chemistry 34(2): 285-293.
Beck, H.L. & Miller, K.M. 1980. Some radiological aspects of coal combustion. IEEE Transactions on Nuclear Science 27(1): 689-694.
Carvalho, F.P. 1995. Origins and concentrations of 222Rn, 210Pb, 210Bi and 210Po in the surface air at Lisbon, Portugal, at the Atlantic edge of the European continental landmass. Atmospheric Environment 29: 1809-1819.
Carvalho, F.P. 1997. Distribution, cycling and mean residence time of 226Ra, 210Pb and 210Po in the Tagus estuary. Science of Total Environment 196: 151-161.
Eisenbud, M. & Gesell, T.F. 1997. Environmental Radioactivity: From Natural, Industrial, and Military Sources. 4th Ed. New York: Academic Press.
Flues, M., Camargo, I.M.C., Figueiredo-Filho, P.M., Silva, P.S.C. & Mazzilli, B.P. 2007. Evaluation of radionuclides concentration in Brazilian coals. Fuel 86: 807-812.
Flues, M., Camargo, I.M.C., Silva, P.S.C. & Mazzilli, B.P. 2006. Radioactivity evaluation of coal and ashes from Figueira coal power plant in Brazil. Journal of Radioanalytical and Nuclear Chemistry 270: 597–602.
Flues, M., Moraes, V. & Mazzilli, B.P. 2002. The influence of a coal-fired power plant operation on radionuclide concentrations in soil. Journal of Environmental Radioactivity 63: 285-294.
Flynn, W.W. 1968. The determination of low levels of polonium-210 in environmental materials. Analytica Chimica Acta 43: 221-227.
Garland, J.A. & Wakeford, R. 2007. Atmospheric emissions from the Windscale accident of October 1957. Atmospheric Environment 41: 3904-3920.
Karangelos, D.J., Petropoulos, N.P., Anagnostakis, M.J., Hinis, E.P. & Simopoulos, S.E. 2004. Radiological characteristics and investigation of the radioactive equilibrium in the ashes produced in lignite-fired power plants. Journal of Environmental Radioactivity 77: 233-246.
Martin, P. 2003. Uranium and thorium series radionuclides in rainwater over several tropical storms. Journal of Environmental Radioactivity 65: 1-18.
Martinez-Aguirre, A., Moron, M.C. & Garcia-Leon, M. 1991. Measurements of U- and Ra-isotopes in rainwater samples. Journal of Radioanalytical and Nuclear Chemistry 152: 37-46.
Mas, J.L., Garcia-Leon, M., Garcia-Tenorio, R. & Bolivar, J.P. 2007. Radionuclide concentrations in water. In Radionuclides Concentrations in Food and the Environment. (eds.) by Pöschl, M. & Nollet, L.M.L. (eds.) Florida: Taylor and Francis Group.
MMD (Malaysian Meteorological Department). 2008. Buletin cuaca bulanan. http://www.met.gov.my/malay/penerbitan/penerbitan.html.
Monte, L., Brittain, J.E., Håkanson, L., Heling, R., Smith, J.T. & Zheleznyak, M. 2003. Review and assessment of models used to predict the fate of radionuclides in lakes. Journal of Environmental Radioactivity 69: 177-205.
Narita, H., Harada, K., Burnett, W.C., Tsunogai, S. & McCabe, W.J. 1989. Determination of 210Pb, 210Bi and 210Po in natural waters and other materials by electrochemical separation. Talanta 36: 925-929.
Papastefanou, C. 1996. Radiological impact from atmospheric releases of 226Ra from coal-fired power plants. Journal of Environmental Radioactivity 32: 105-114.
Papastefanou, C. 2006. Residence time of tropospheric aerosols in association with radioactive nuclides. Applied Radiation and Isotopes 64: 93-100.
Poet, S.E., Moore, H.E. & Martell, E.A. 1972. Lead-210, bismuth-210 and polonium-210 in the atmosphere: accurate ratio measurement and application to aerosol residence time determination. Journal of Geophysical Research 77(33): 6515-6525.
Sholkovitz, E.R., Boyle, E.A. & Price, N.B. 1978. The removal of dissolved humic acids and iron during estuarine mixing. Earth and Planetary Science Letters 40: 130-136.
Skwarzec, B., Ulatowski, J., Struminska, D.I. & Falandysz, J. 2003. 210Po in the phytobentos from Puck Bay. Journal of Environmental Monitoring 5: 308-311.
828
Skwarzec, B. & Fabisiak, J. 2007. Bioaccumulation of 210Po in marine birds. Journal of Environmental Radioactivity 93: 119-126.
Sugihara, G., Casdagli, M., Habjan, E., Hess, D., Holland, G. & Dixon, P. 1999. Residual delay maps unveil global patterns of atmospheric nonlinearity and produce improved local forecasts. National Academy of Sciences of the United States of America Proceeding 96: 14210-14215.
Swarzenski, P.W., McKee, B.A., Sorensen, K. & Todd, J.F. 1999. 210Pb and 210Po, manganese and iron cycling across the O2/H2S interface of a permanently anoxic fjord: Framvaren Norway. Marine Chemistry 67: 199-217.
Tateda, Y., Carvalho, F.P., Fowler, S.W. & Miguel, J.C. 2003. Fractionation of 210Po and 210Pb in coastal waters of the NW Mediterranean continental margin. Continental Shelf Research 23: 295-316.
Theng, T.L. & Mohamed, C.A.R. 2005. Activities of 210Po and 210Pb in the water column at Kuala Selangor, Malaysia. Journal of Environmental Radioactivity 80(3): 273-286.
TNB Generation. 2003. Sultan Salahuddin Abdul Aziz Power Station, Kapar. Pamphlet, Selangor.
UNSCEAR (United Nations Scientific Committee on the Effects of Atomic Radiation). 1982. Ionizing Radiation: Sources and Biological Effects. New York: United Nations Scientific Committee on the Effects of Atomic Radiation.
UNSCEAR (United Nations Scientific Committee on the Effects of Atomic Radiation). 1993. Exposure From Natural Sources of Radiation. New York: United Nations Scientific Committee on the Effects of Atomic Radiation.
UNSCEAR (United Nations Scientific Committee on the Effects of Atomic Radiation). 2000. Sources and Effects of Ionizing
Radiation. New York: United Nations Scientific Committee on the Effects of Atomic Radiation.
U.S.G.S (United States Geological Survey). 1997. New York: Fact sheet FS-171-97.
Yang, C.H. & Lin, H.C. 1992. Lead-210 and polonium-210 across the frontal region between Kuroshio and East China Sea, northeast of Taiwan. Terrestrial, Atmospheric and Oceanic Sciences 3(3): 379-394.
Asnor Azrin Sabuti Marine Science Program School of Environmental and Natural Resource SciencesFaculty of Science and TechnologyUniversiti Kebangsaan Malaysia43600 Bangi, Selangor D.E.Malaysia
Che Abd Rahim Mohamed*Marine Ecosystem Research Centre (EKOMAR) Faculty of Science and TechnologyUniversiti Kebangsaan Malaysia 43600 Bangi, Selangor D.E.Malaysia
*Corresponding author; email: [email protected]
Received: 30 September 2011Accepted: 21 February 2012